Building and evaluation of a PBPK model for raltegravir in adults
| Version | 2.0-OSP12.3 |
|---|---|
| based on Model Snapshot and Evaluation Plan | https://github.com/Open-Systems-Pharmacology/Raltegravir-Model/releases/tag/v2.0 |
| OSP Version | 12.3 |
| Qualification Framework Version | 3.7 |
This evaluation report and the corresponding PK-Sim project file are filed at:
https://github.com/Open-Systems-Pharmacology/OSP-PBPK-Model-Library/
Table of Contents
- 1 Introduction
- 2 Methods
- 2.1 Modeling strategy
- 2.2 Data used
- 2.3 Model parameters and assumptions
- 3 Results and Discussion
- 3.1 Raltegravir final input parameters
- 3.2 Raltegravir Diagnostics Plots
- 3.3 Raltegravir Concentration-Time profiles
- 4 Conclusion
- 5 References
1 Introduction
The presented model building and evaluation report evaluates the performance of a PBPK model for raltegravir in adults.
Raltegravir, sold under the brand name Isentress, is an antiretroviral medication used to treat HIV/AIDS by blocking the establishment of post-integration HIV latency. It is also used as part of post exposure prophylaxis to prevent HIV infection following potential exposure. Raltegravir is only taken orally and is mainly metabolized by UGT1A1 (~70%) (Kassahun 2007). The final raltegravir model features metabolism by UGT1A1 and to a minor extent by UGT1A9. Additionally, there is excretion via glomerular filtration. The model adequately describes the pharmacokinetics of raltegravir in adults.
The raltegravir model is a whole-body PBPK model, allowing for dynamic translation between individuals with organs expressing UGT1A1. The raltegravir report demonstrates the level of confidence in the raltegravir PBPK model build with the OSP suite with regard to reliable predictions of raltegravir PK adults during model-informed drug development.
2 Methods
2.1 Modeling strategy
The general concept of building a PBPK model has previously been described by Kuepfer et al. (Kuepfer 2016). Relevant information on anthropometric (height, weight) and physiological parameters (e.g. blood flows, organ volumes, binding protein concentrations, hematocrit, cardiac output) in adults was gathered from the literature and has been previously published (PK-Sim Ontogeny Database Version 7.3). The information was incorporated into PK-Sim® and was used as default values for the simulations in adults.
The applied activity and variability of plasma proteins and active processes that are integrated into PK-Sim® are described in the publicly available PK-Sim® Ontogeny Database Version 7.3 (Schlender 2016) or otherwise referenced for the specific process.
First, a base mean model was built using data from the single dose escalation study to find an appropriate structure describing the PK of Raltegravir. The mean PK model was developed using a typical European individual. Unknown parameters were identified using the Parameter Identification module provided in PK-Sim®. Structural model selection was mainly guided by visual inspection of the resulting description of data and biological plausibility.
Once the appropriate structural model was identified, additional parameters for different formulations were identified.
A final PBPK model was established and simulations were compared to the reported data to evaluate model appropriateness and to assess model qualification, by means of diagnostics plots and predicted versus observed concentration-time profiles, of which the results support an adequate prediction of the PK in adults.
During model building, uncertainties in data quality, as well as study differences may cause not being able to adequately describe the PK of all reported clinical studies.
2.2 Data used
2.2.1 In vitro / physico-chemical data
A literature search was performed to collect available information on physicochemical properties of raltegravir. The obtained information from literature is summarized in the table below, and is used for model building.
| Parameter | Unit | Raltegravir literature | Description |
|---|---|---|---|
| MW | g/mol | 444.4163 (drugbank.ca) | Molecular weight |
| pKa | 6.67 (Moss 2012) | Acid dissociation constant | |
| Solubility (pH) | mg/L | Reference pH-dependent table (Moss 2013) | Solubility |
| logD (pH 7) | 0.58 (Moss 2012) | Partition coefficient between octanol and water | |
| fu | 0.17 (Laufer 2009) | Fraction unbound | |
| Km UGT1A1 | µM | 99 (Kassahun 2007) | Michaelis-Menten constant |
| Vmax UGT1A1 | nmol/min/mg | 0.89 (Kassahun 2007) | Maximum rate of reaction |
| Km UGT1A9 | µM | 296 (Kassahun 2007) | Michaelis-Menten constant |
| Vmax UGT1A9 | nmol/min/mg | 0.53 (Kassahun 2007) | Maximum rate of reaction |
2.2.2 Clinical data
A literature search was performed to collect available clinical data on Raltegravir in adults.
The following publications were found in adults for model building and evaluation:
| Publication | Study description |
|---|---|
| Iwamoto 2008 | Single- and multiple-dose escalation study in healthy subjects |
| Iwamoto 2009 | Effects of ritonavir and efavirenz on safety, tolerability and pharmacokinetics of raltegravir |
| Markowitz 2006 | Monotherapy, followed by a longer term combination therapy of raltegravir versus efavirenz |
| Kassahun 2007 | Pharmacokinetics study in healthy adults |
| Rhee 2014 | Pediatric formulation study in healthy adults |
| Wenning 2009 | Effect of rifampin on the pharmacokinetics of raltegravir |
2.3 Model parameters and assumptions
2.3.1 Absorption
As no intravenous data is currently available to study systemic clearance of raltegravir in vivo, only oral data was used for model building. For oral administration the following parameters play a role with regards to the absorption kinetics of a compound, which can be estimated with PBPK: solubility, lipophilicity and intestinal permeability. Moss et al. (Moss 2013) published values for raltegravir solubility in population groups with very low-, low-, medium-, high-, and very high intestinal luminal pH, after a single 400 mg dose of raltegravir. For the raltegravir PBPK model we have applied the medium pH group for creating a pH dependent solubility profile throughout the intestinal tract. The lipophilicity as well as pKa of raltegravir was also published by Moss et al (Moss 2012, Moss 2013) to be 0.58 (as log partition coefficient between octanol and water (pH 7) and 6.67 (acid)), respectively. These values were applied and fixed in the raltegravir PBPK model, without further optimization. Regarding intestinal transcellular permeability (Pint), Moss et al (Moss 2012) reported a range of apical to basolateral apparent permeability in Caco-2 monolayer at different pH values. Using published functions Pint can be calculated from Caco-2 cell membrane permeability measurements (Parrot et al. (Parrot 2002)), Thelen et al. (Thelen 2010, Sun et al. (Sun 2002) and Sjögren et al. (Sjögren 2013)). However as no reference/calibrator compound was available to correct for inter-study variability, these functions could not be applied, and it was decided to estimate the Pint from in vivo clinical data instead. Nevertheless, for plausibility check, a theoretical Pint was calculated using the aforementioned functions without correction, resulting in a range of Pint from 4.64E-04 to 1.47E-09 cm/min. The finally estimated (based on in vivo data) Pint falls within this range.
Table 2. Reported Caco-permeability and calculated theoretical effective permeability (intestinal transcellular permeability, Peff) values for raltegravir via different reported functions, lacking a reference compound for correcting inter-study variability.
| Reference publication of reported function | pH apical to basolateral | Peff apical to basolateral (cm/min) | Reference compound available for correcting Inter study variability |
|---|---|---|---|
| Raltegravir Caco permeability (Moss 2012 ) | 7.4 | 6.60E-6 | - |
| Raltegravir Caco permeability (Moss 2012) | 6.5 | 9.20E-6 | - |
| Parrot 2002 | 7.4 | 2.14E-04 | Not available |
| Thelen 2010 | 7.4 | 1.47E-09 | Not available |
| Sjögren 2013 | 7.4 | 1.03606E-6 | Not available |
| Sun 2002 | 7.4 | 2.77E-4 | Not available |
| Sun 2002 | 6.5 | 2.86E-4 | Not available |
| Simcyp (*) | 6.5 | 4.62E-4 | Not available |
*Not published as paper, Simcyp applied an adapted version of Sun et al 2002
2.3.2 Distribution
Laufer et al. (Laufer 2009) published a fu in humans to be 0.17. Barau et al 2013 reported that raltegravir binds to serum albumin, and not alpha glycoprotein, which is built-in as such in the PBPK model.
After testing the available organ-plasma partition coefficient and cell permeability calculation methods built in PK-Sim, observed clinical data was best described by choosing the partition coefficient calculation by Rodgers and Rowland, and cell permeability calculation by PK-Sim standard. Specific organ permeability normalized to surface area was automatically calculated by PK-Sim.
2.3.3 Metabolism and Elimination
Kassahun et al. (Kassahun 2007) studied the absorption, metabolism, and excretion of raltegravir in healthy volunteers after a single oral dose of 200 mg (200Ci) of [14C] raltegravir. Human liver microsomal incubations confirmed the dominant role of UGT metabolism for raltegravir. Additionally, data from incubations using cDNA-expressed UGTs indicate that the major mechanism of metabolism of raltegravir in humans is UGT1A1-mediated glucuronidation. Raltegravir was in particular converted by UGT1A1 and 1A9. The apparent arithmetic mean Km values for the glucuronidation of raltegravir by UGT1A1 and UGT1A9 were 99 (standard deviation (SD): 16) and 296 (SD: 55) µM, respectively. The corresponding Vmax values (nmol/min/mg) were 0.89 (SD: 0.05) for UGT1A1, and 0.53 (SD: 0.06) for UGT1A9.
Based on this information, the reported in vitro Km values for UGT1A1 and 1A9 were included in the model. Reported Vmax values were in units nmol/min/mg protein and thus not directly transferable into the PBPK model. Therefore, a joint scaling factor fUGT on the in vitro Vmax values was estimated to match observed in vivo data, and keeping the relative relationship between those in vitro values (0.89 and 0.53 nmol/min/mg) for UGT1A1 and UGT1A9 fixed according to:
Vmax,UGT1A1 = fUGT * Vmax,in-vitro,UGT1A1
Vmax,UGT1A9 = fUGT * Vmax,in-vitro,UGT1A9
It is especially important to fix the relative contribution of both enzymes as a ratio to ensure that, when translating to other populations (e.g. children where both UGTs undergo a different ontogeny pattern, or patients who have differently reduced amounts of UGT1A1 vs 1A9) the relative contributions can be adequately scaled. Note that the estimated scaling factor fUGT will be directly implemented into the final in vivo Vmax values (only Vmax,UGT1A1 and Vmax,UGT1A9 will be reported in section 3)
Finally, as ~9% of the dose is excreted in human urine as unchanged parent compound, GFR is introduced in the raltegravir PBPK model.
3 Results and Discussion
The PBPK model raltegravir was developed with clinical pharmacokinetic data covering 4 different oral formulation and a dose range of 10-1600mg, including single dose (SD) as well as multiple dose (MD) clinical data.
As there were 4 different oral formulations available for model evaluation, all formulations require an estimation of the dissolution kinetics via a Weibull function. This function requires the estimation of 2 parameters, the dissolution time (time where 50% of the drug is dissolved), and dissolution shape (shape parameter of the Weibull function). Therefore, to minimize the amount of parameters for fitting, as a first step, the PK study data (lactose formulation) by Iwamoto et al. (Iwamoto 2007) was fitted which includes SD escalation and hast a broad dose-range (10mg-1600mg) to capture dose (non-) linearity. During the model-fitting, the following parameters were estimated (all other parameters were fixed to reported values):
- Vmax (as unique scaling factor fUGT , as described in section 2.3.3)
- Weibull function parameters: Dissolution time and dissolution shape
- Specific intestinal permeability (transcellular)
The fit resulted in an adequate description of all data. As there is no iv data available, it was not possible to clearly distinguish between clearance and absorption, resulting in a considerable correlation between Vmax and dissolution shape (Weibull). An attempt to fix Vmax to reported in vitro values, and only estimating absorption (lipophilicity and intestinal transcellular permeability) resulted in an underprediction of the clearance, and clearly indicated a need for increase in clearance. As described above, no reported intestinal permeability was found other than Caco2-permeability. Caco2-permeability could not be translated to effective intestinal permeability without a reference compound. Therefore it was decided to continue with the model where both Pint and Vmax were estimated.
As a second step, clinical study data for all other formulations summarised in section 2.2.2 were included for model fitting, including film-coated tablets (100-400mg MD, 200-400mg SD), chewable tablets (400mg fasted + fed) and oral granules in suspension (400mg). In this step, only the Weibull functions were estimated with all other parameters fixed based on the first step. Finally, as the parameters of the Weibull functions were highly correlated (as expected), only dissolution shape was estimated as a last step. The model results show that the PBPK model of raltegravir adequately described the date for all formulations and doses available.
3.1 Raltegravir final input parameters
The compound parameter values of the final raltegravir PBPK model are illustrated below.
Compound: Raltegravir
Parameters
| Name | Value | Value Origin | Alternative | Default |
|---|---|---|---|---|
| Solubility table | 40 mg/l | Publication-In Vitro-Moss 2013 Table 2 | Moss 2013 | True |
| Lipophilicity | 0.58 Log Units | Publication-Moss 2012 | Moss 2012 | True |
| Fraction unbound (plasma, reference value) | 0.17 | Publication-In Vitro-Laufer 2009 | Measurement | True |
| Specific intestinal permeability (transcellular) | 2.8481843854E-07 cm/s | Parameter Identification | Fit | True |
| F | 1 | Publication-Other-Drugbank.ca | ||
| Is small molecule | Yes | |||
| Molecular weight | 444.4163 g/mol | Publication-Other-Drugbank.ca | ||
| Plasma protein binding partner | Albumin |
Calculation methods
| Name | Value |
|---|---|
| Partition coefficients | Rodgers and Rowland |
| Cellular permeabilities | PK-Sim Standard |
Processes
Systemic Process: Glomerular Filtration-Kassahun 2007
Species: Human
Parameters
| Name | Value | Value Origin |
|---|---|---|
| GFR fraction | 1 | Publication-In Vitro-Kassahun 2007 |
Metabolizing Enzyme: UGT1A1-Kassahun 2007
Molecule: UGT1A1
Parameters
| Name | Value | Value Origin |
|---|---|---|
| In vitro Vmax for liver microsomes | 2.7351231632 nmol/min/mg mic. protein | Parameter Identification |
| Km | 99 µM | Publication-In Vitro-Kassahun 2007 |
Metabolizing Enzyme: UGT1A9-Kassahun 2007
Molecule: UGT1A9
Parameters
| Name | Value | Value Origin |
|---|---|---|
| In vitro Vmax for liver microsomes | 1.6287812095 nmol/min/mg mic. protein | Parameter Identification |
| Km | 296 µM | Publication-In Vitro-Kassahun 2007 |
Formulation: filmcoated tablet (original Merck formulation)
Type: Weibull
Parameters
| Name | Value | Value Origin |
|---|---|---|
| Dissolution time (50% dissolved) | 500 min | Parameter Identification |
| Lag time | 0 min | |
| Dissolution shape | 0.03536656 | Parameter Identification |
| Use as suspension | Yes |
Formulation: chewable tablet
Type: Weibull
Parameters
| Name | Value | Value Origin |
|---|---|---|
| Dissolution time (50% dissolved) | 1.0000049774E-05 min | Parameter Identification |
| Lag time | 0 min | |
| Dissolution shape | 0.050078869 | Parameter Identification |
| Use as suspension | Yes |
Formulation: Weibull (lactose formulation)
Type: Weibull
Parameters
| Name | Value | Value Origin |
|---|---|---|
| Dissolution time (50% dissolved) | 2.30152527E-10 min | Parameter Identification |
| Lag time | 0 min | |
| Dissolution shape | 0.0389537131 | Parameter Identification |
| Use as suspension | Yes |
Formulation: Weibull (granules)
Type: Weibull
Parameters
| Name | Value | Value Origin |
|---|---|---|
| Dissolution time (50% dissolved) | 0.00010000047426 min | Parameter Identification |
| Lag time | 0 min | |
| Dissolution shape | 0.0654456264 | Parameter Identification |
| Use as suspension | Yes |
3.2 Raltegravir Diagnostics Plots
Below you find the goodness-of-fit visual diagnostic plots for raltegravir PBPK model performance (observed versus individually simulated plasma concentration and weighted residuals versus time, including the geometric mean fold error (GMFE)) of all data used for model building.
Table 3-1: GMFE for Goodness of fit plot for concentration in plasma.
| Group | GMFE |
|---|---|
| Raltegravir chewable tablet | 1.37 |
| Raltegravir filmcoated tablet | 1.56 |
| Raltegravir granules in suspension | 1.42 |
| Raltegravir lactose formulation | 1.48 |
| All | 1.49 |
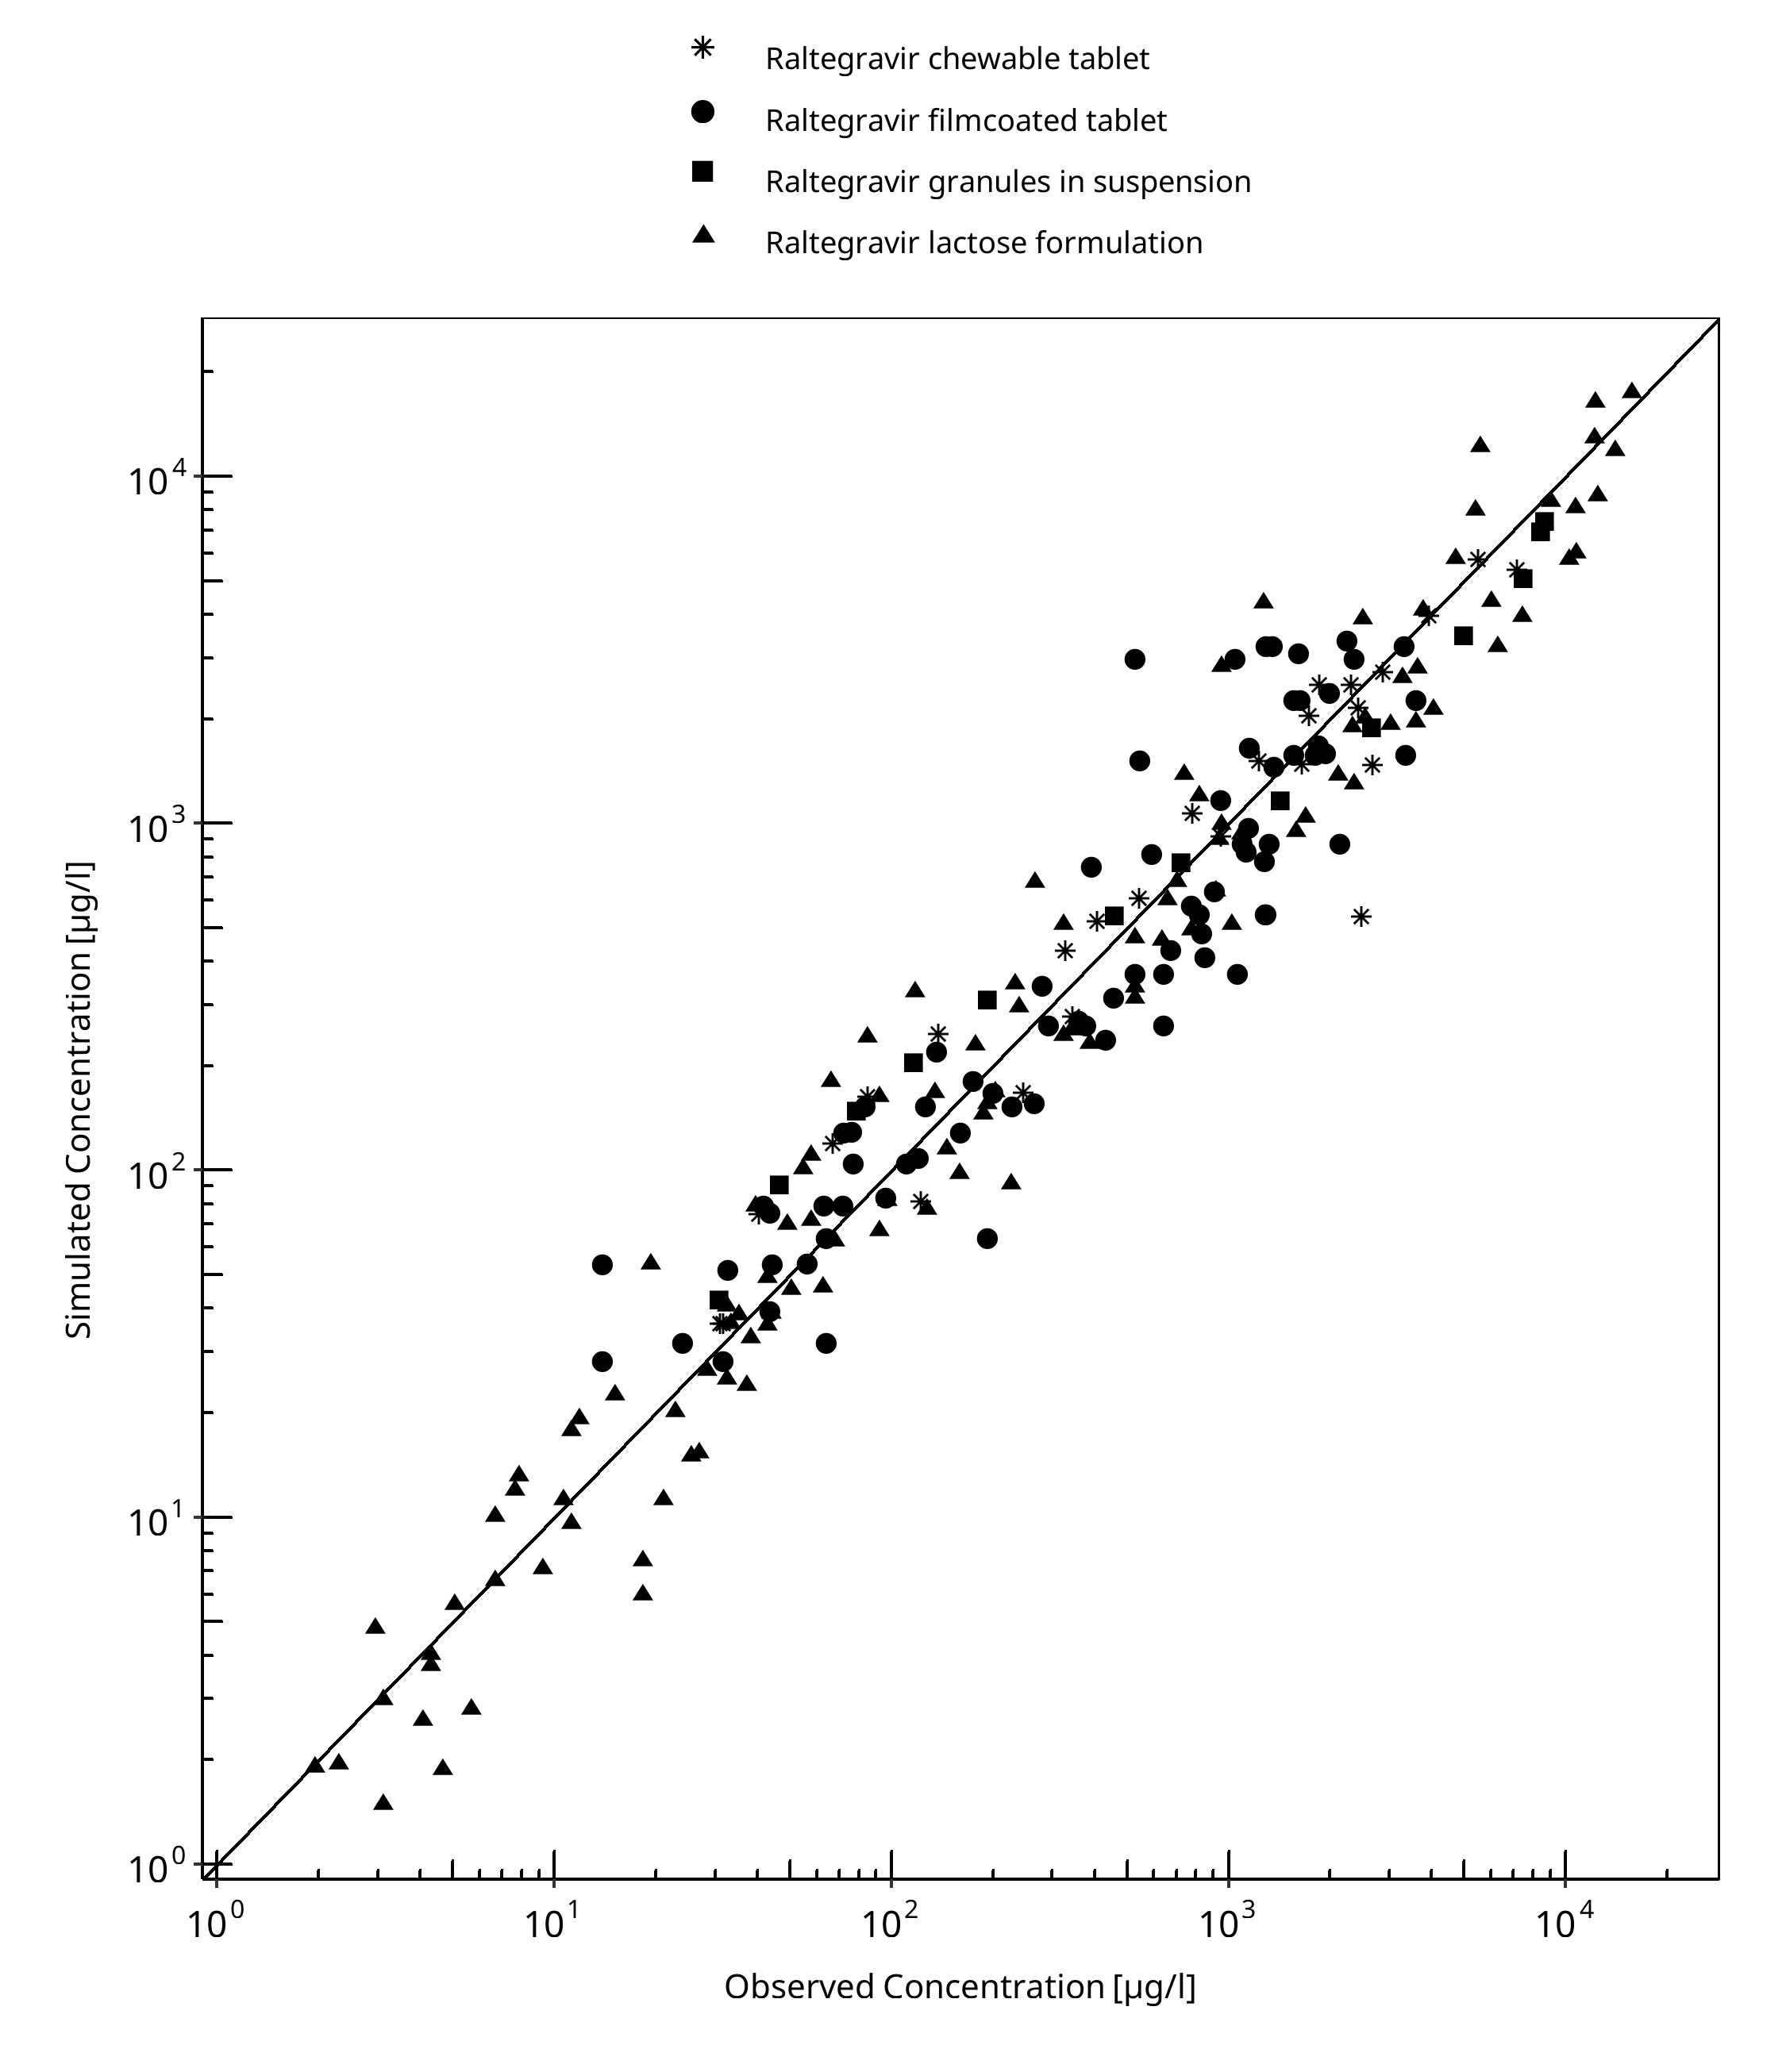
Figure 3-1: Goodness of fit plot for concentration in plasma.
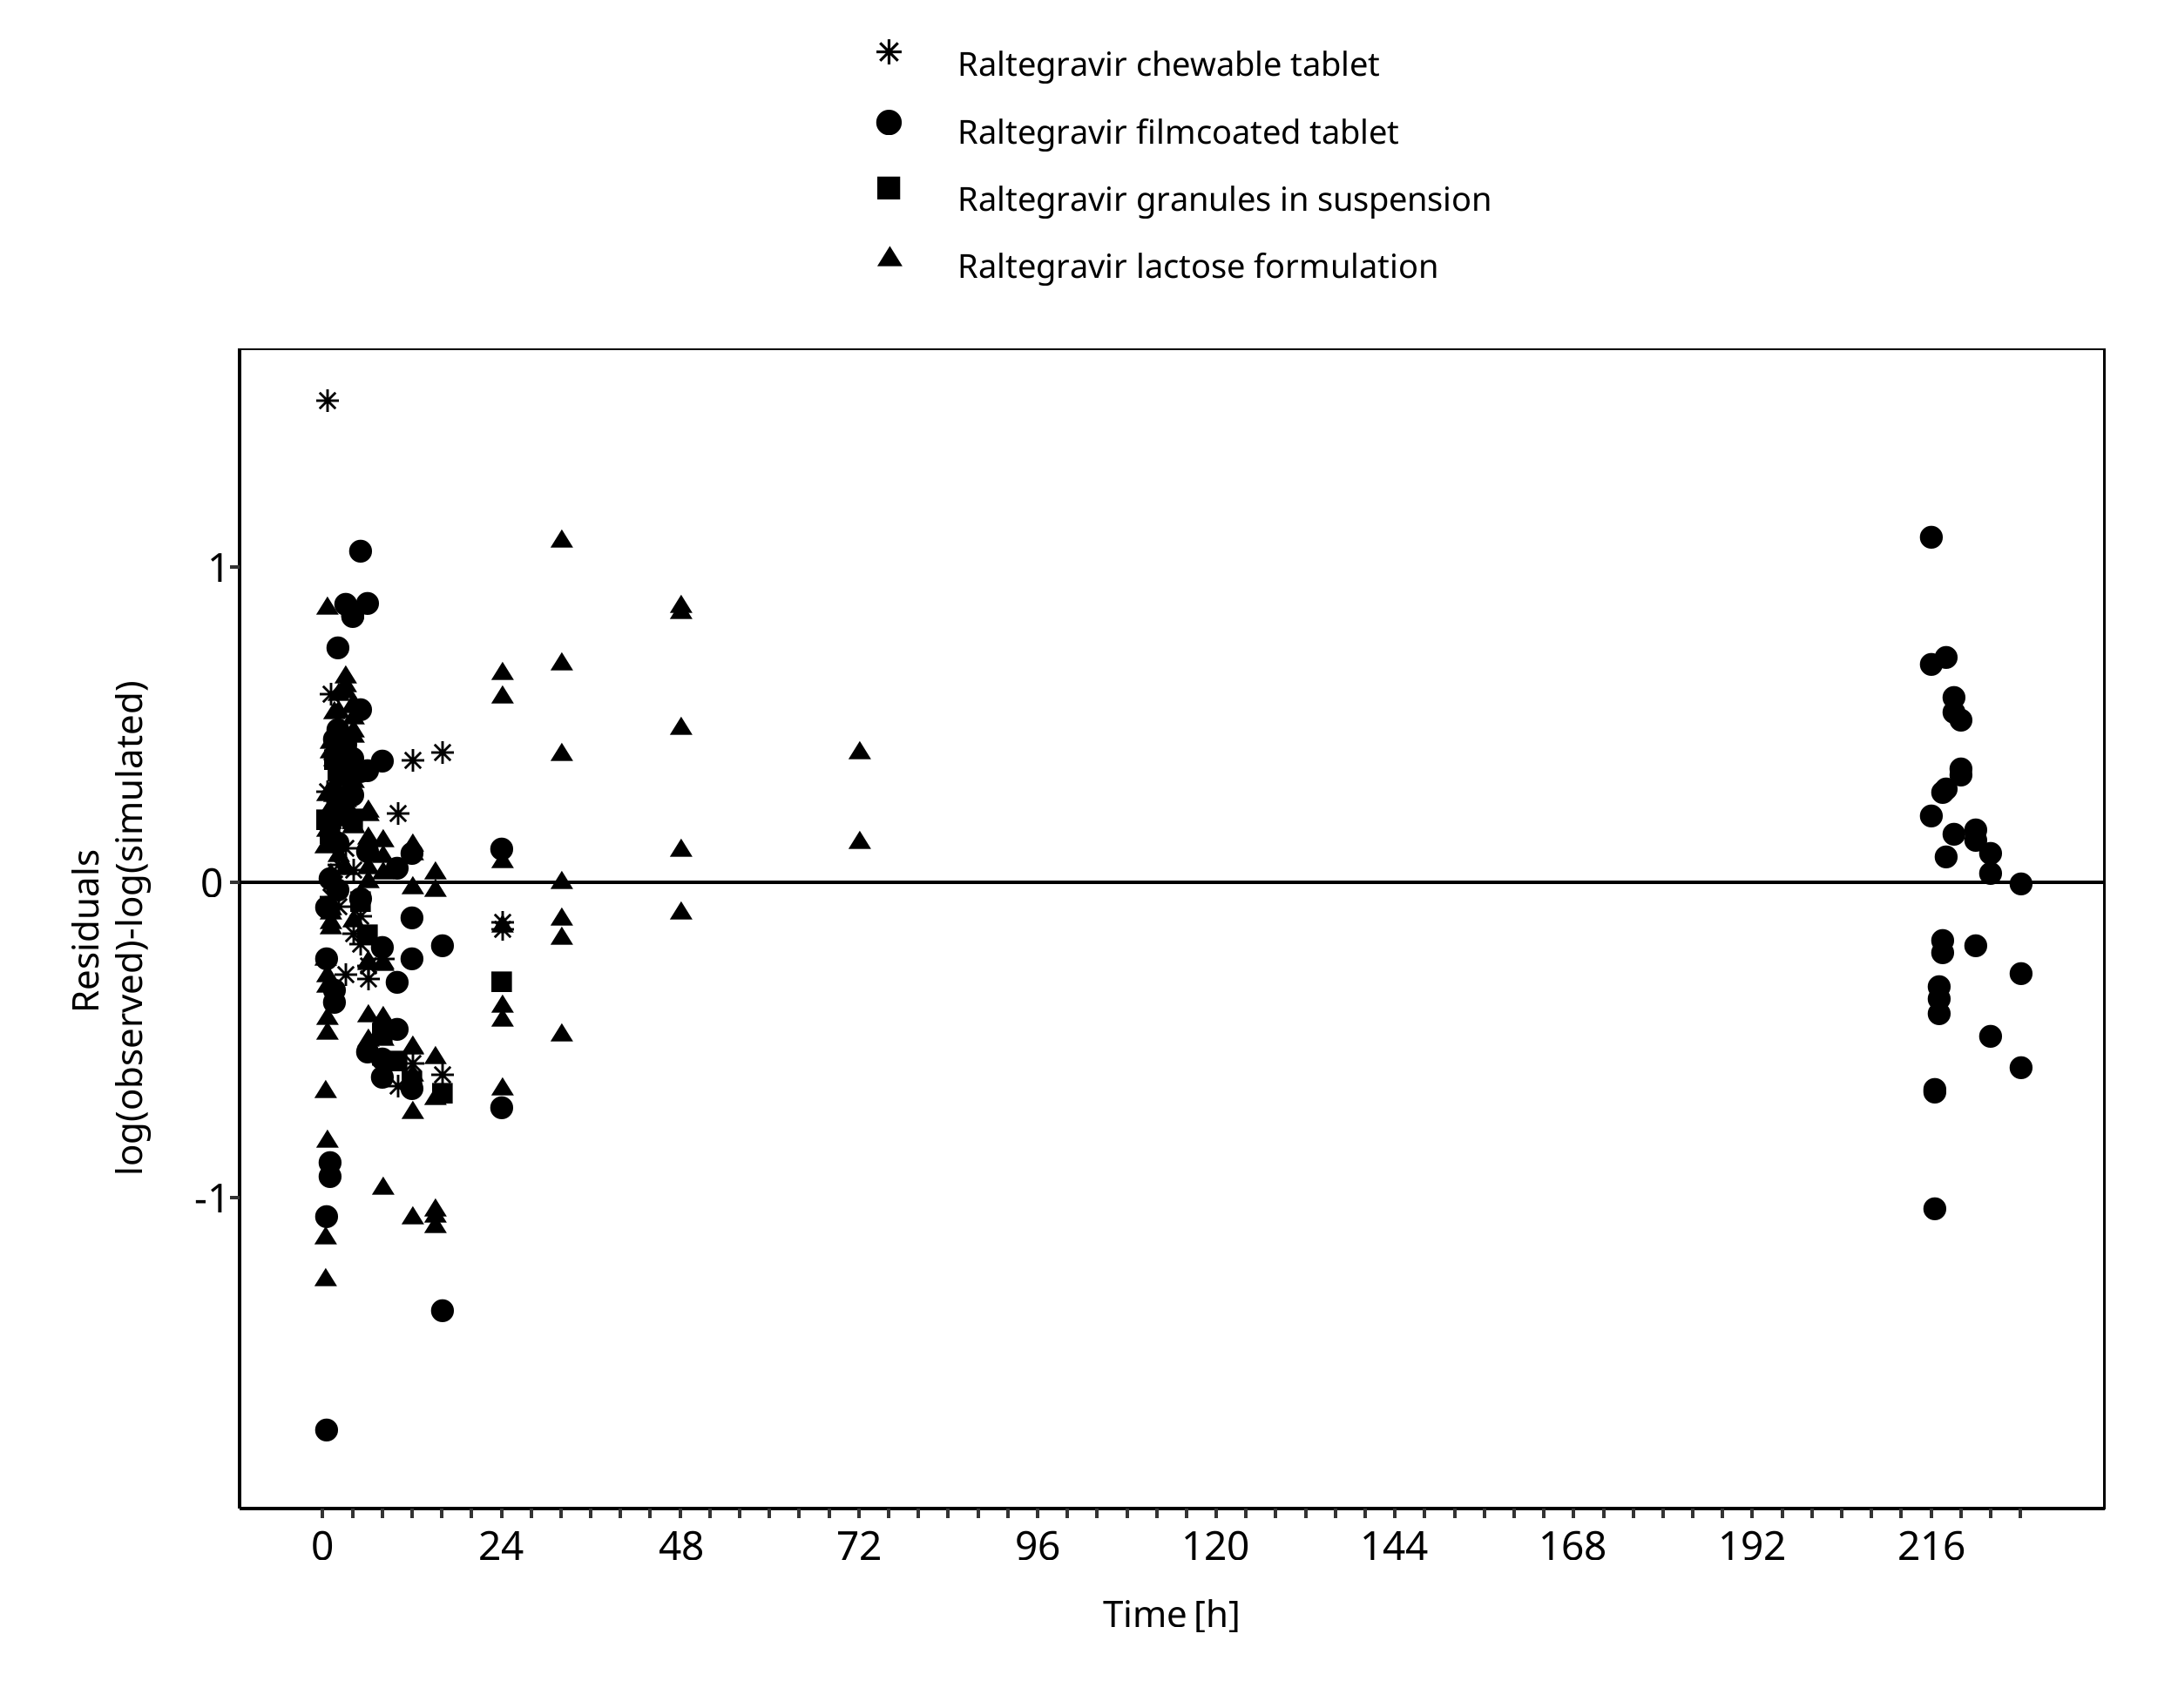
Figure 3-2: Goodness of fit plot for concentration in plasma.
3.3 Raltegravir Concentration-Time profiles
Simulated versus observed plasma concentration-time profiles of all data are listed below.
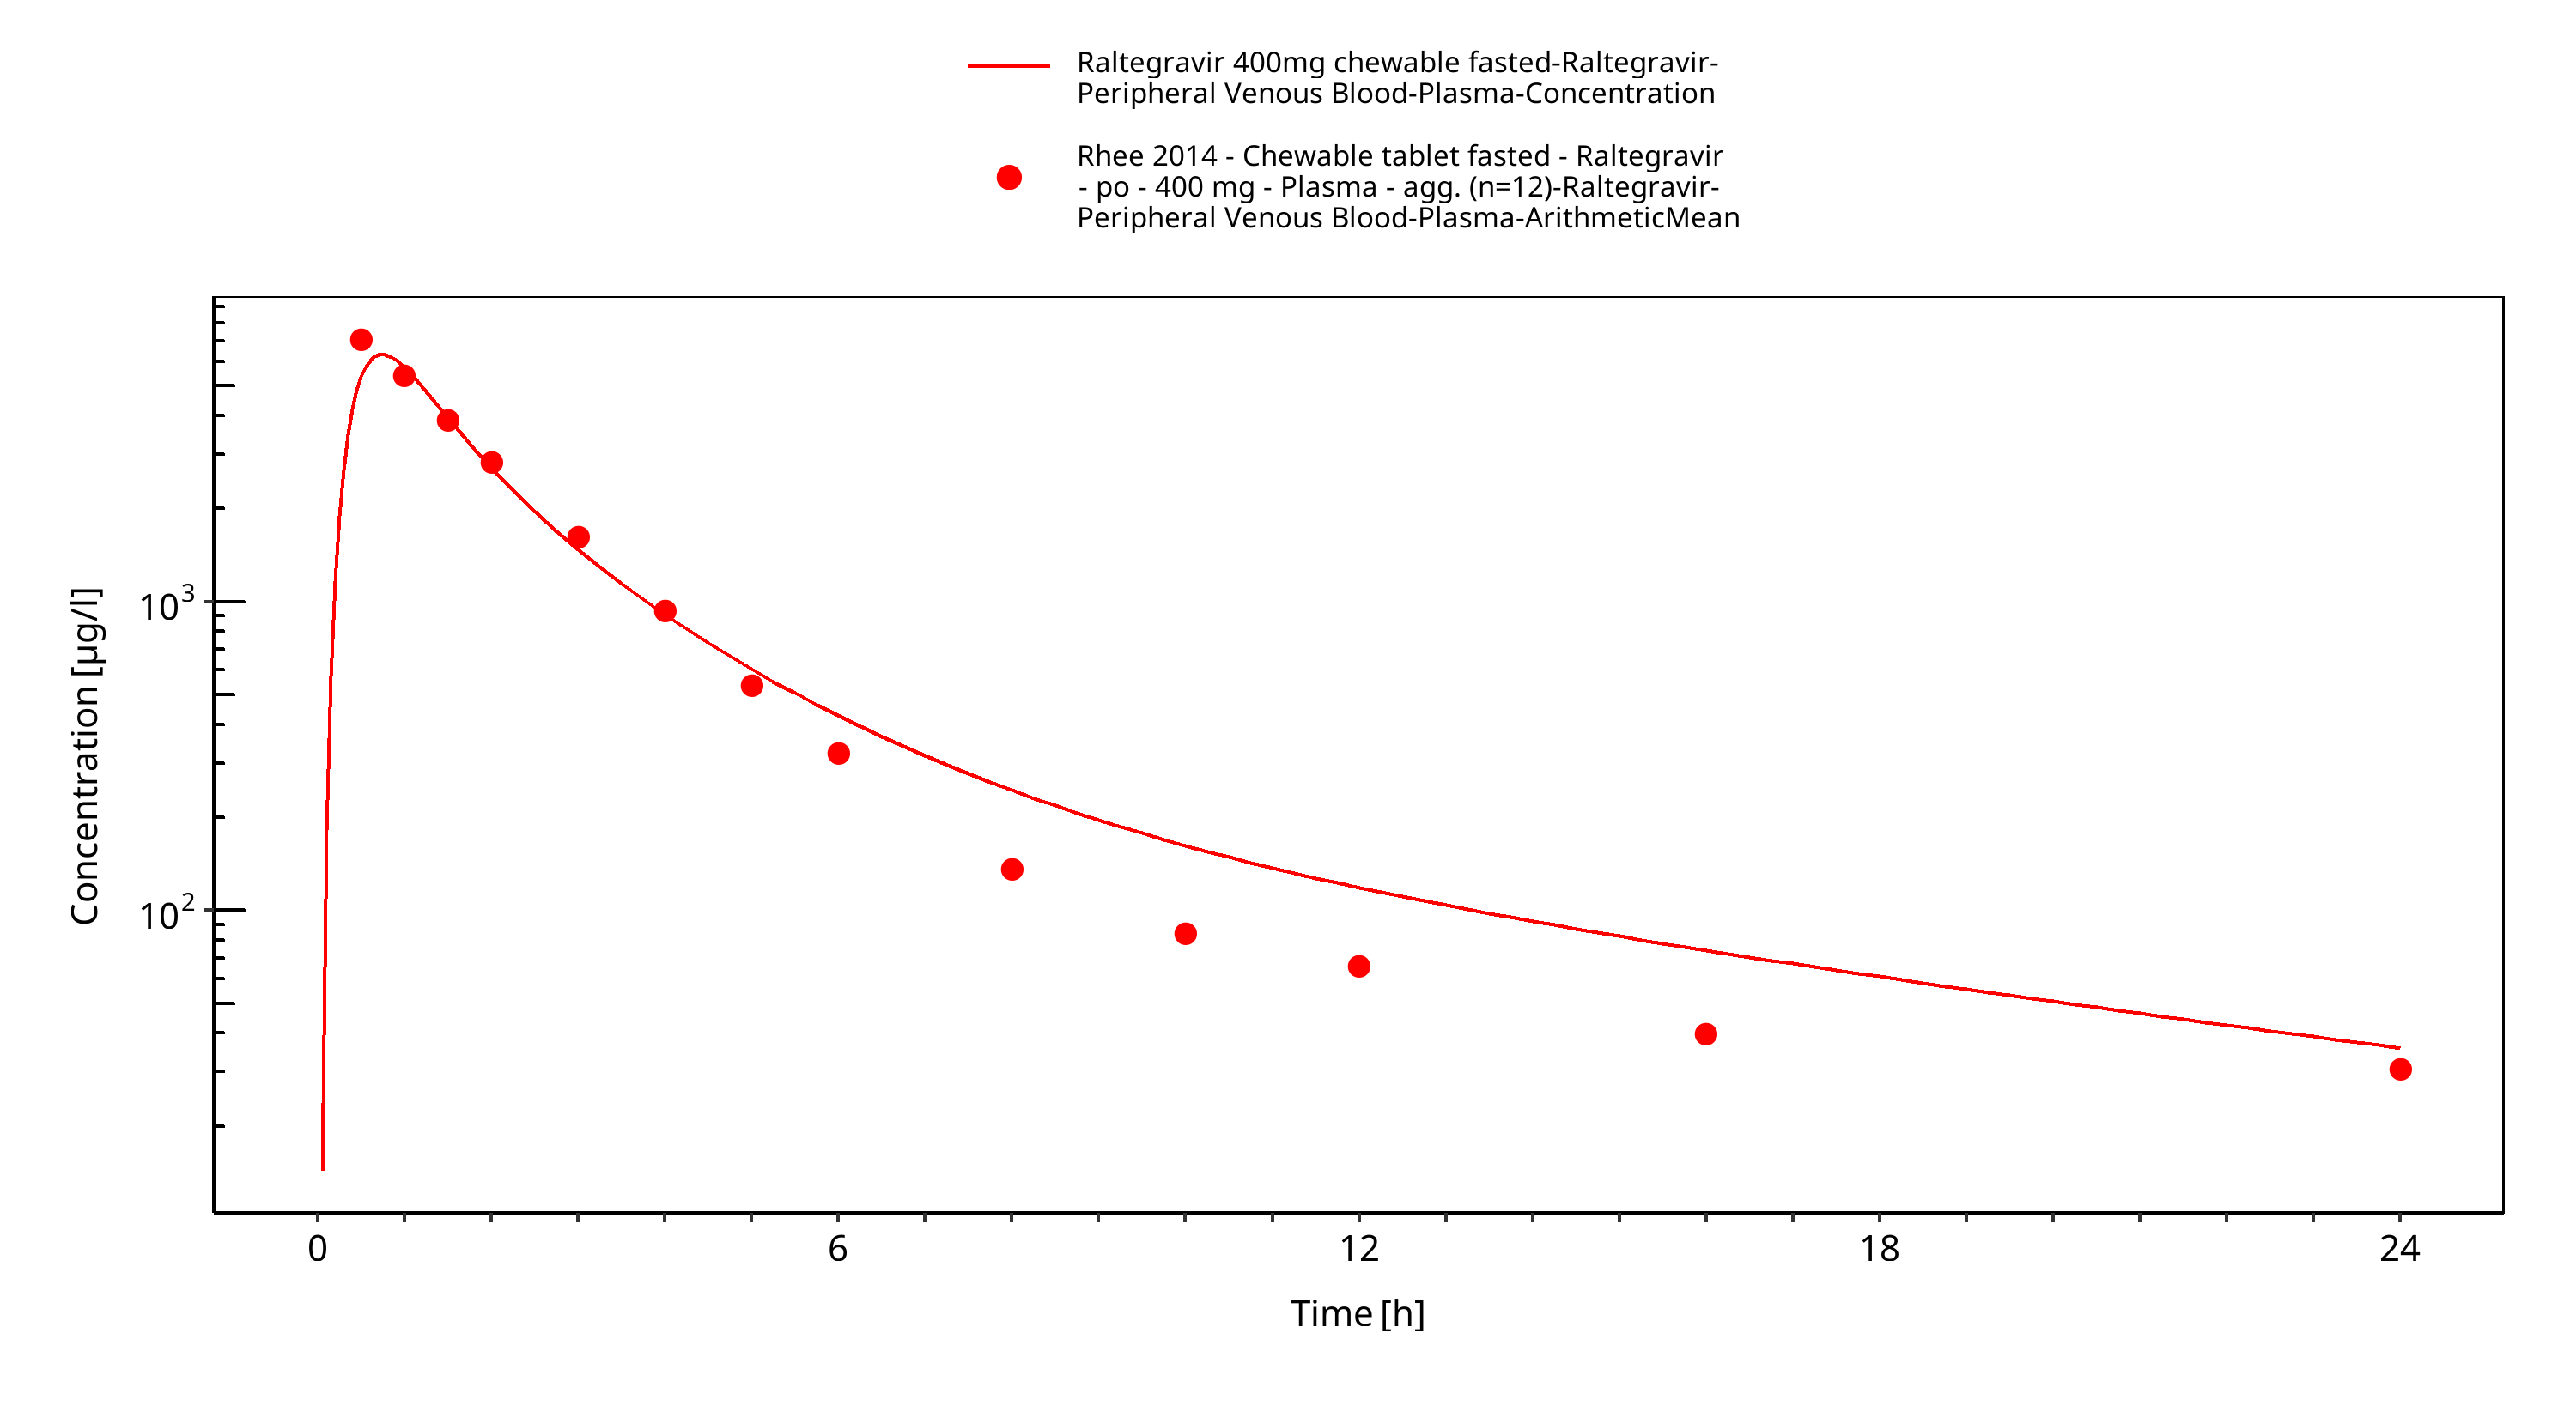
Figure 3-3: Time Profile Analysis
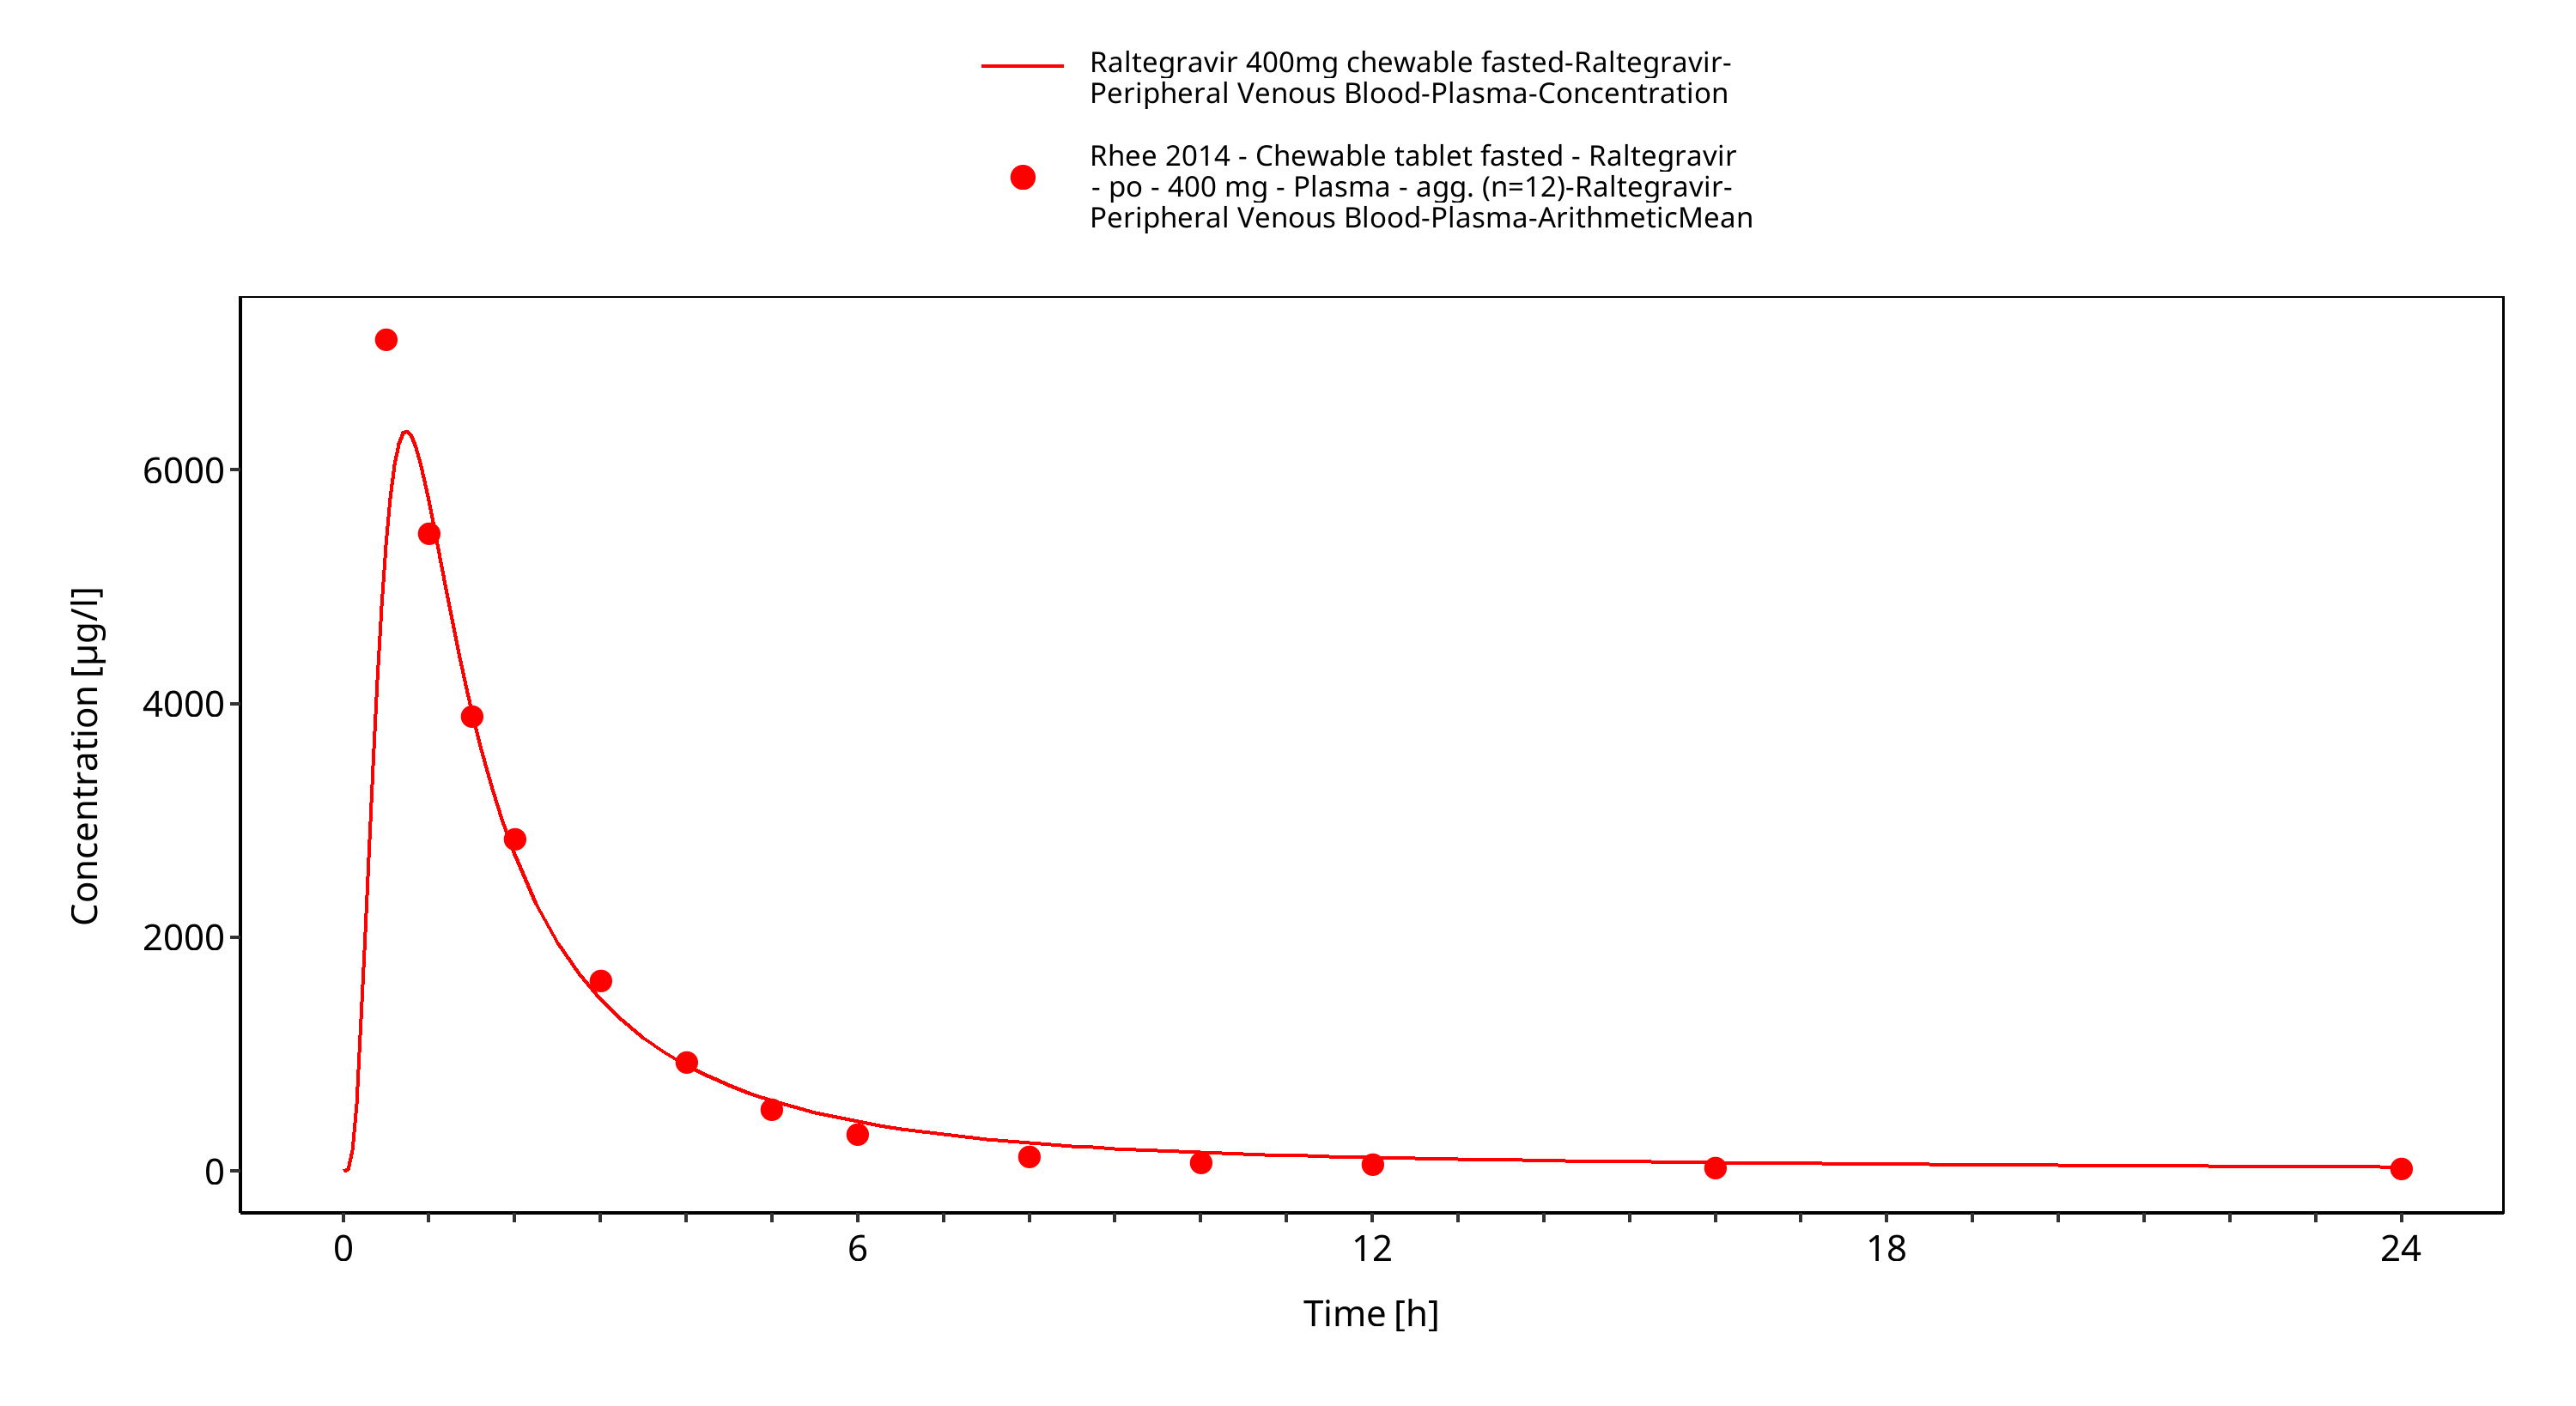
Figure 3-4: Time Profile Analysis 1
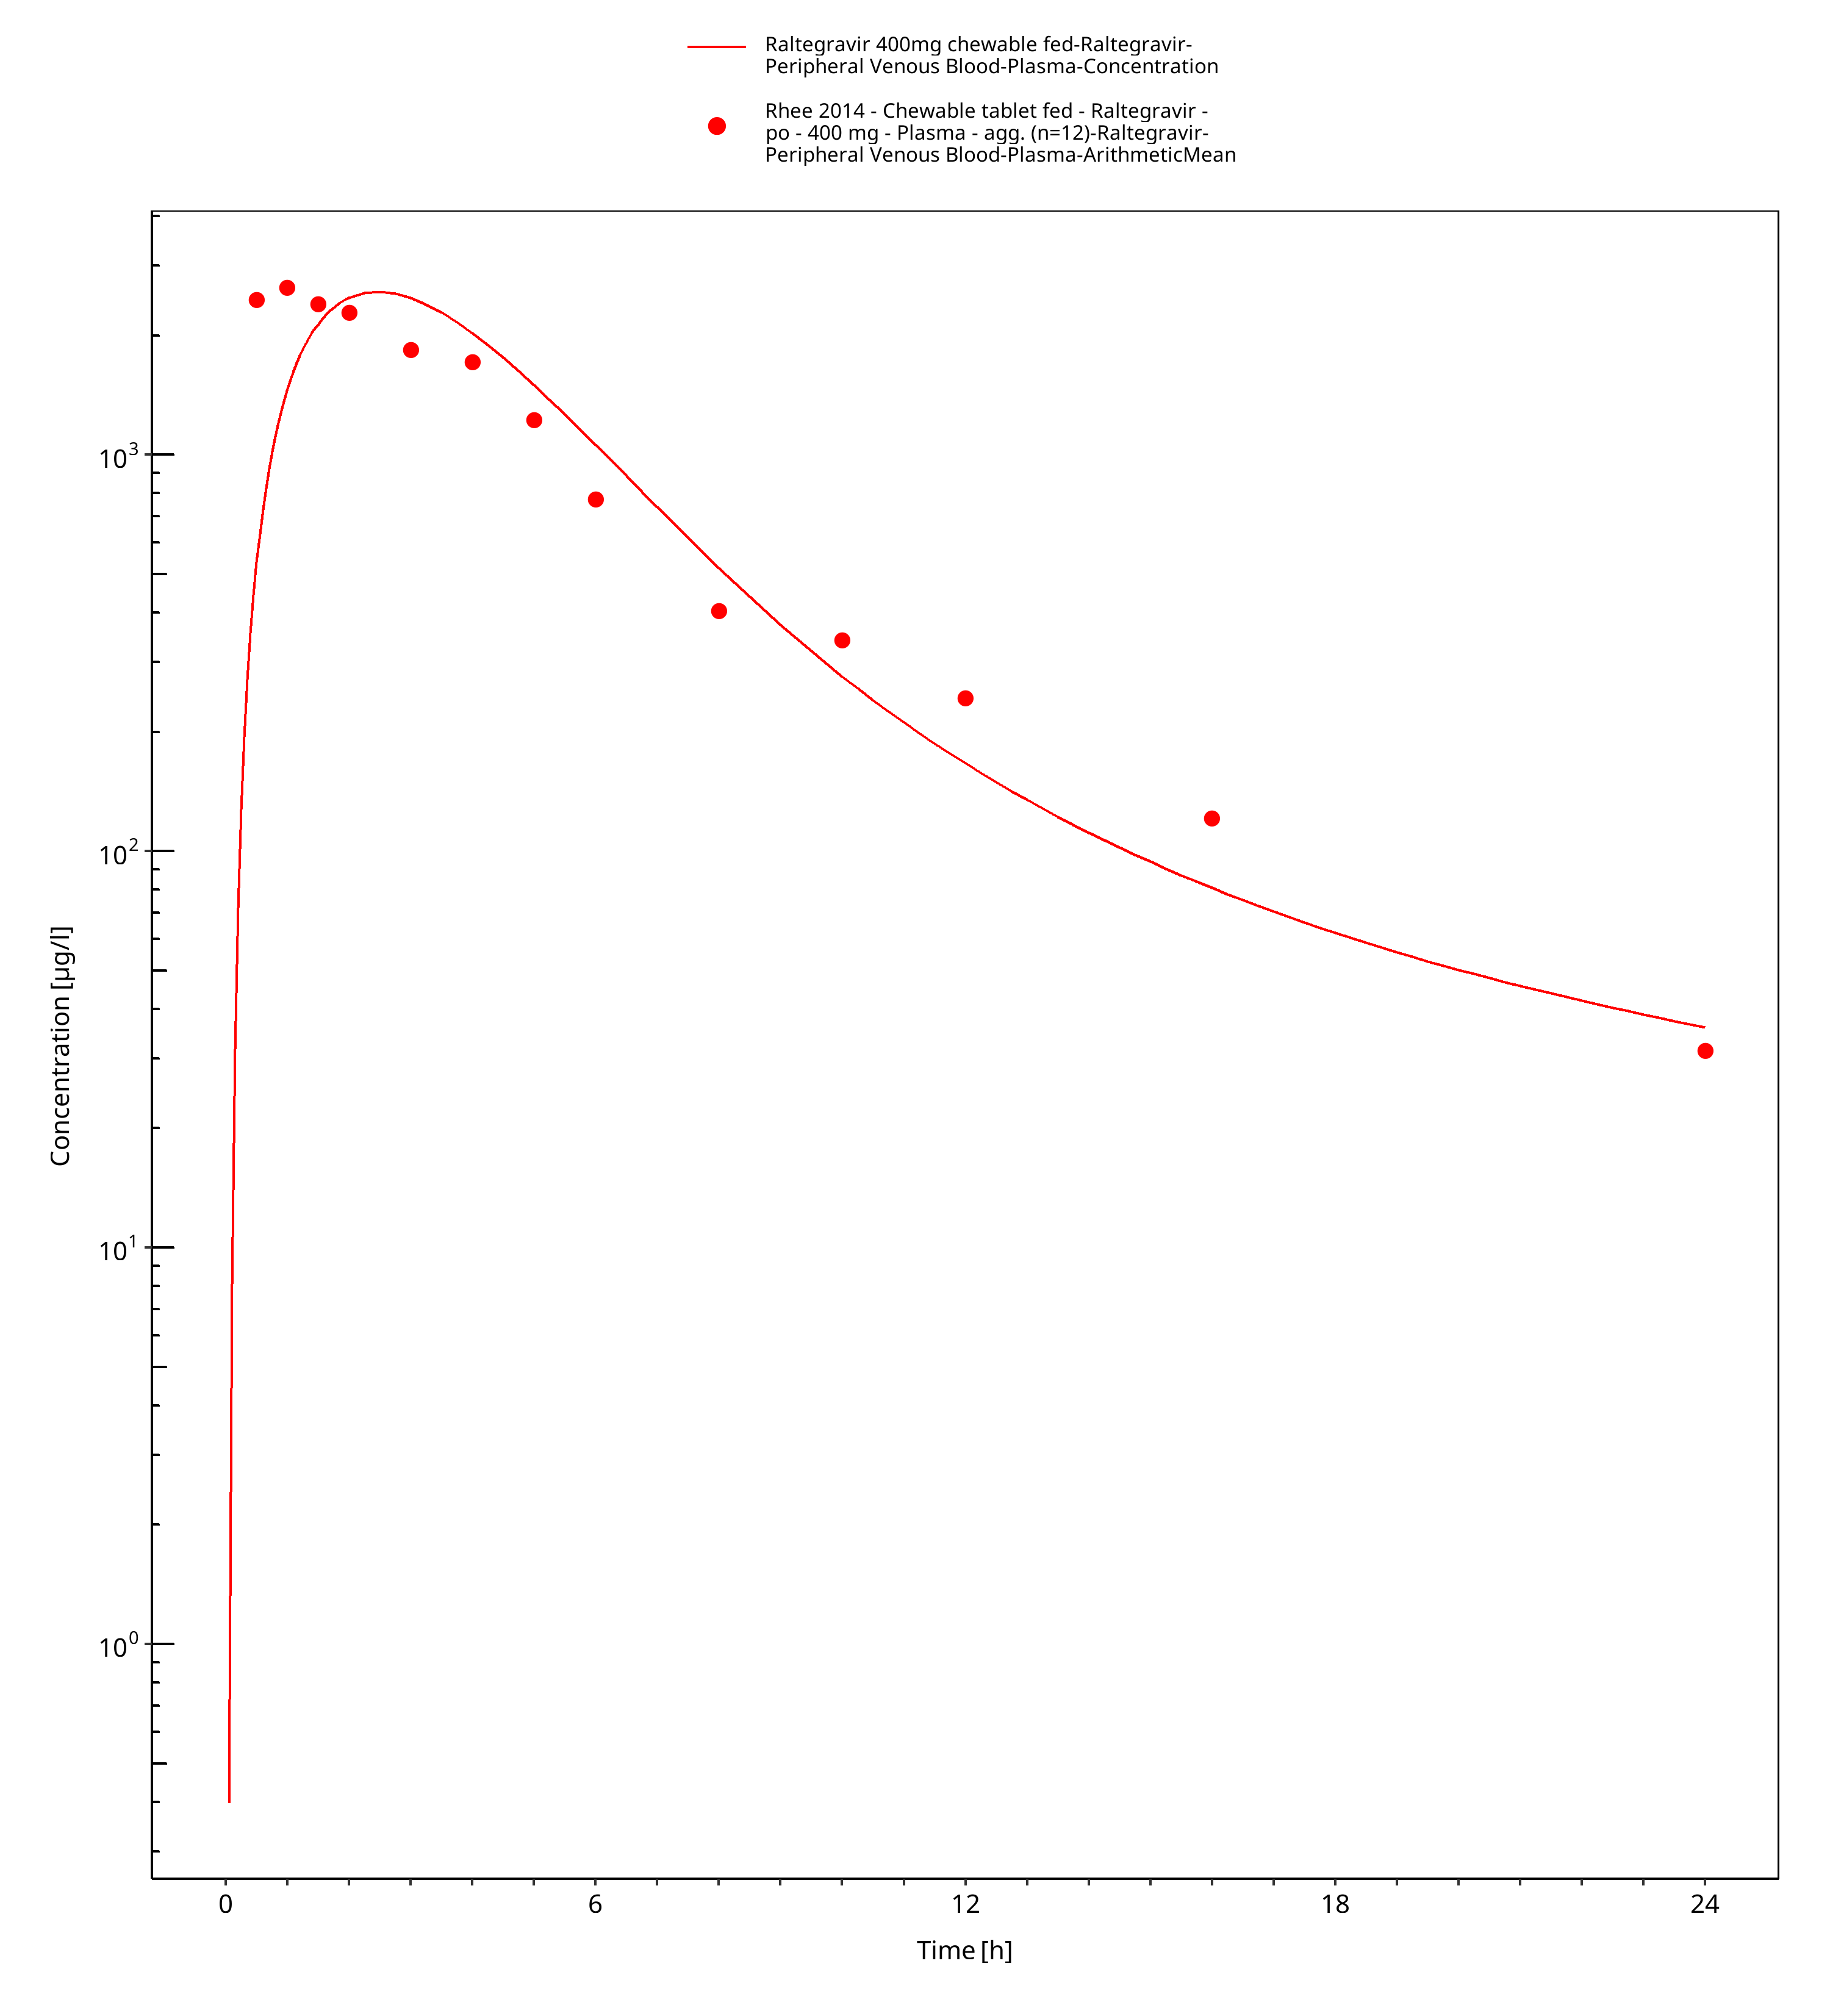
Figure 3-5: Time Profile Analysis
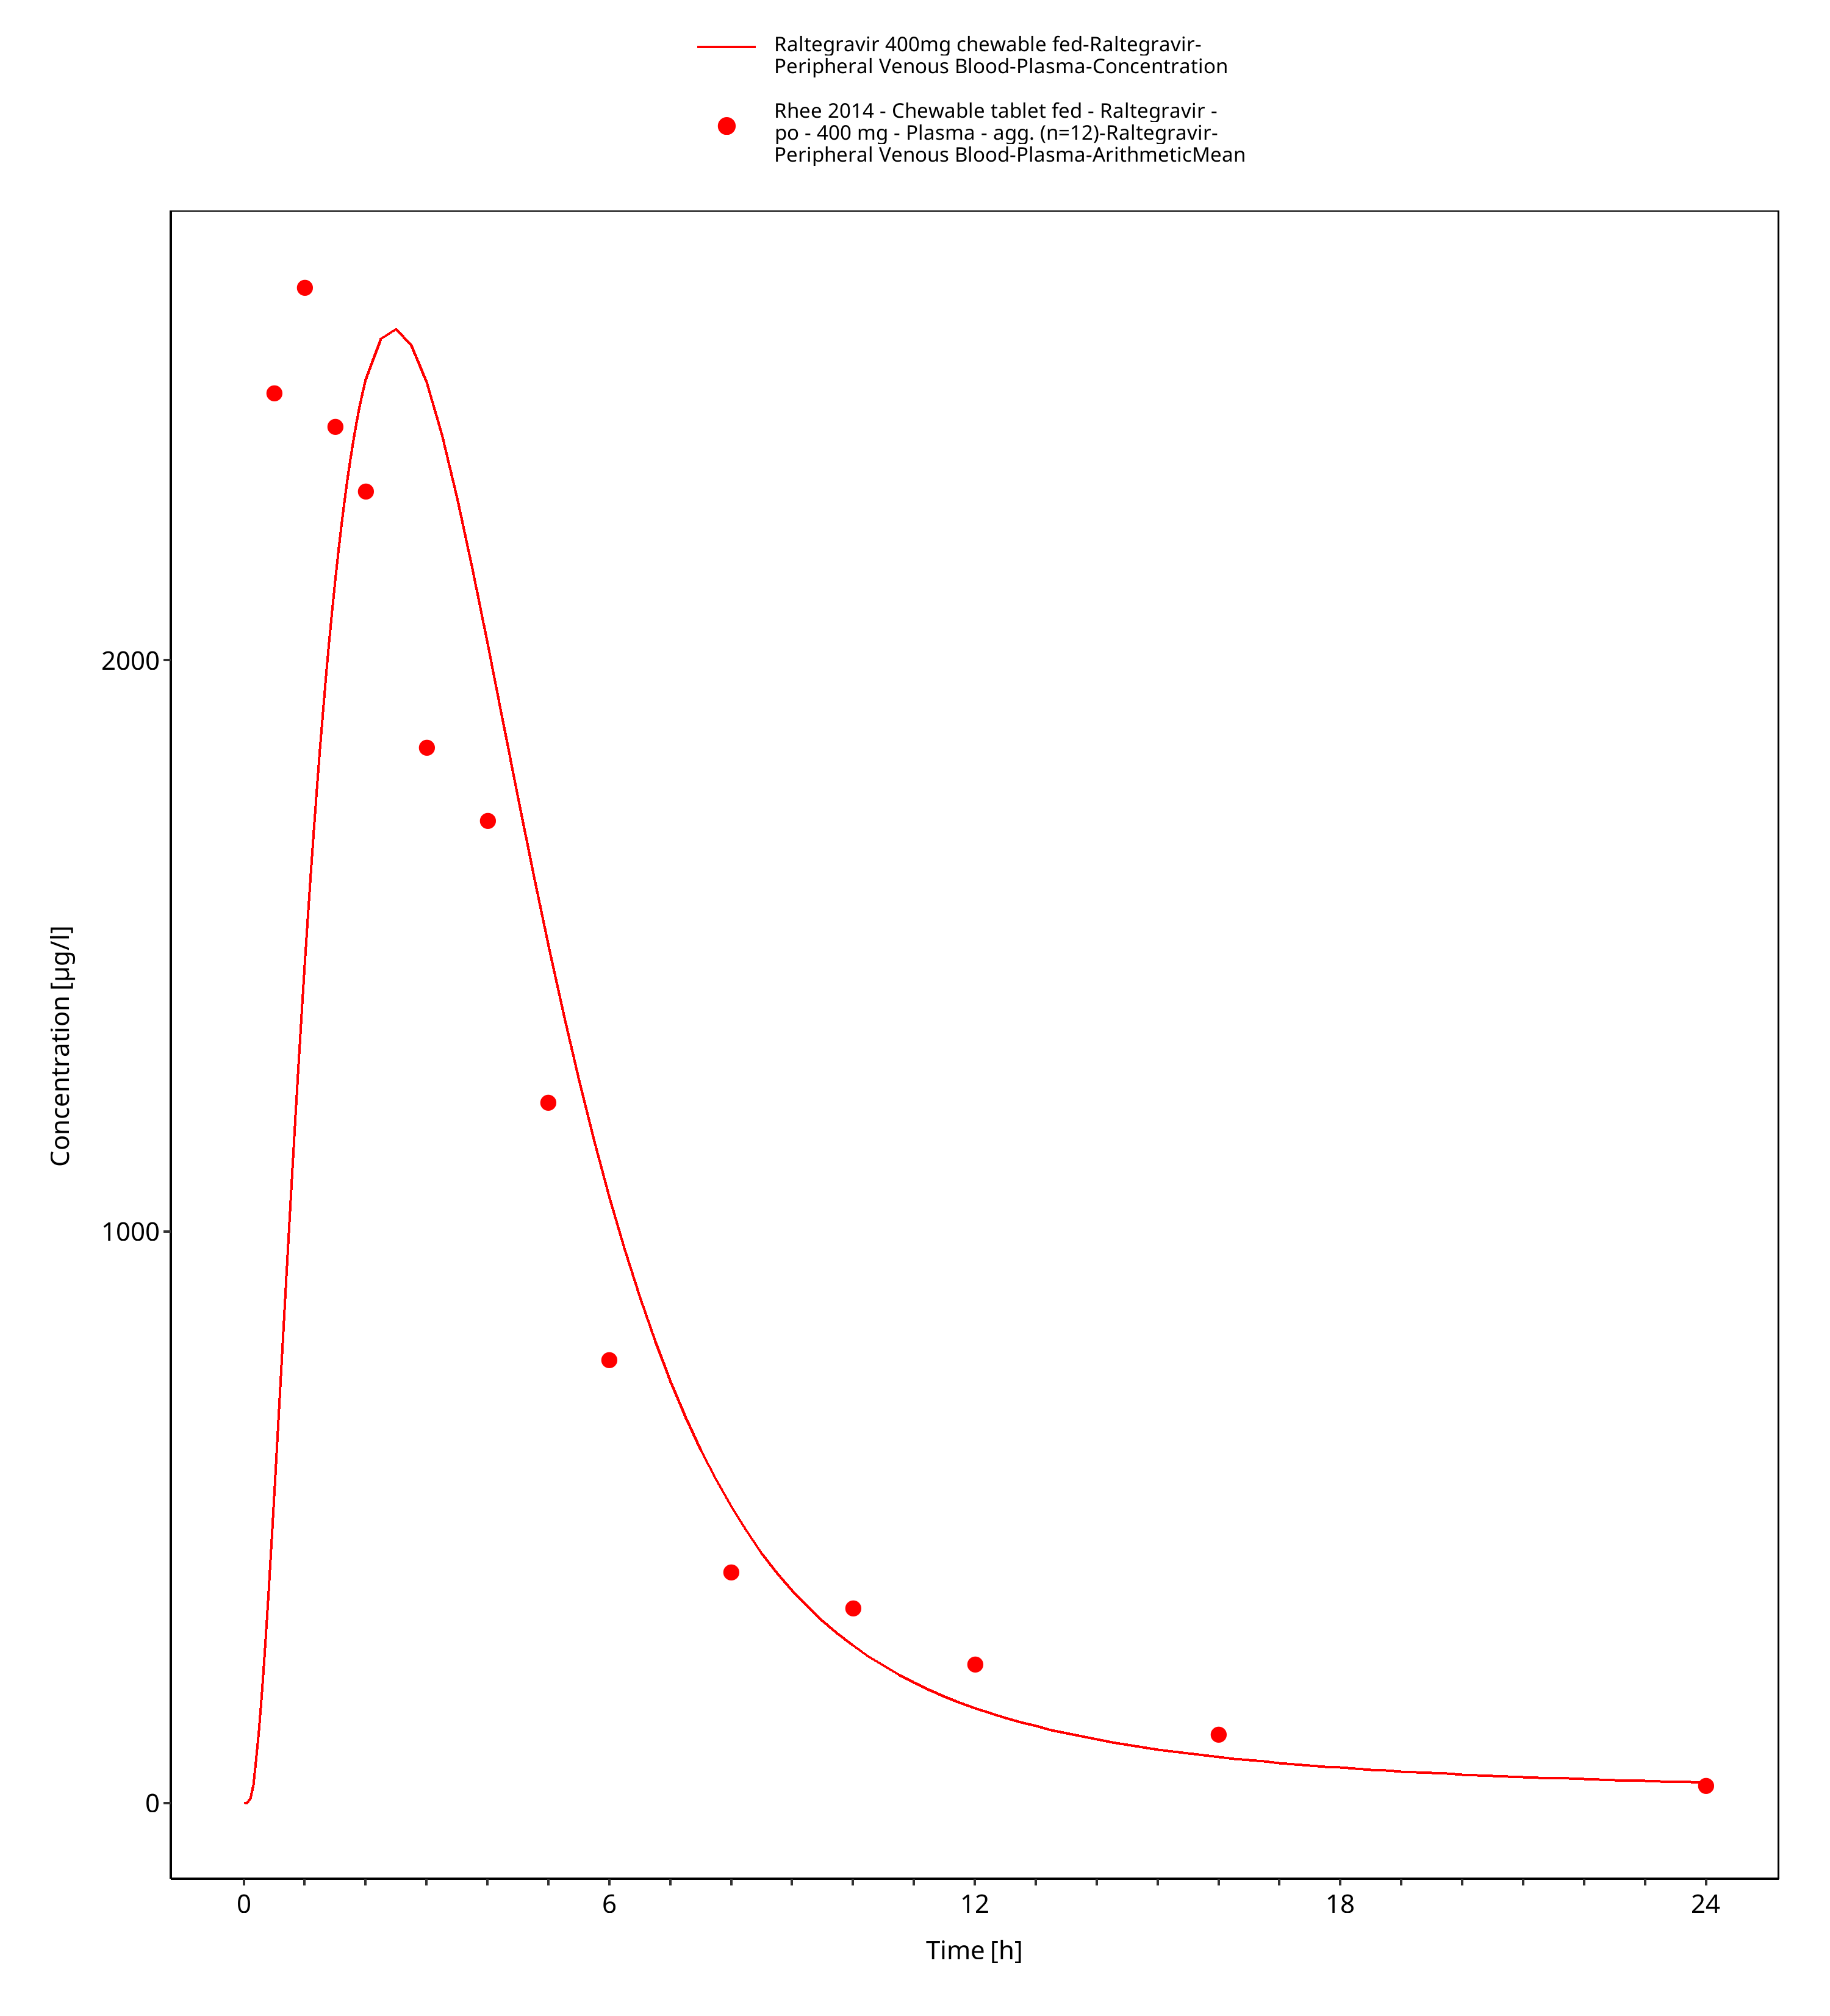
Figure 3-6: Time Profile Analysis 1
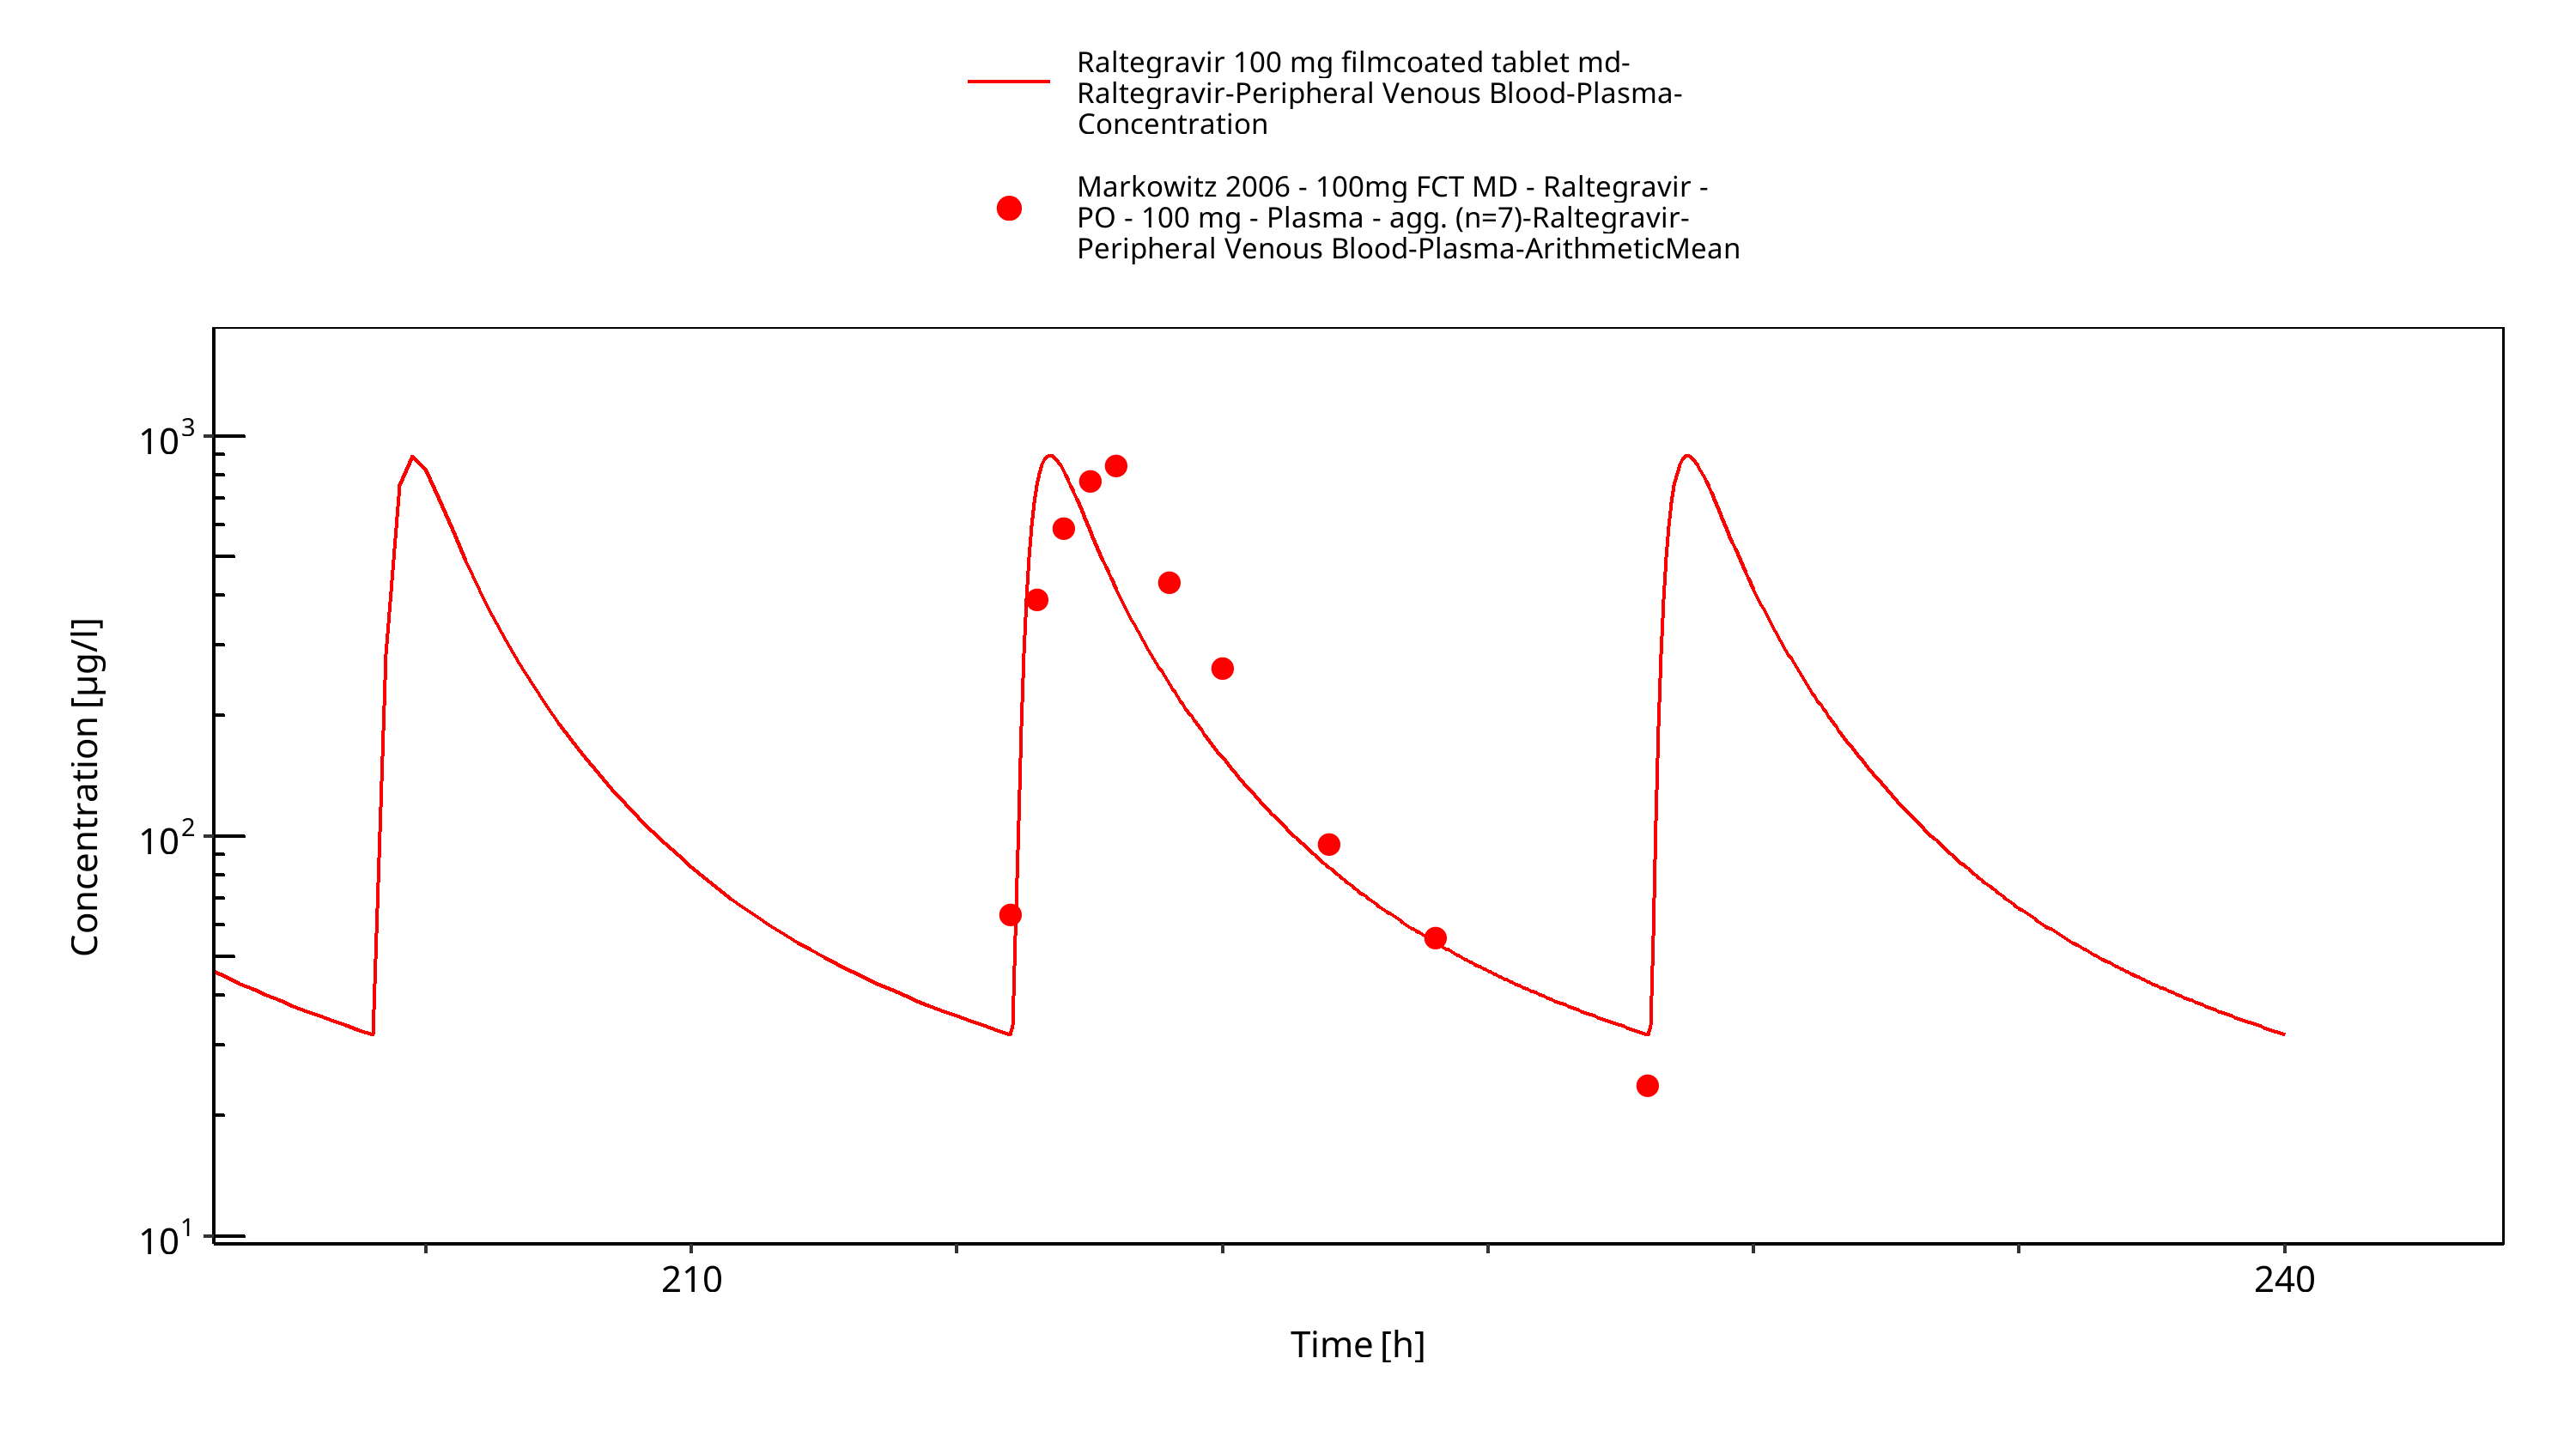
Figure 3-7: Time Profile Analysis
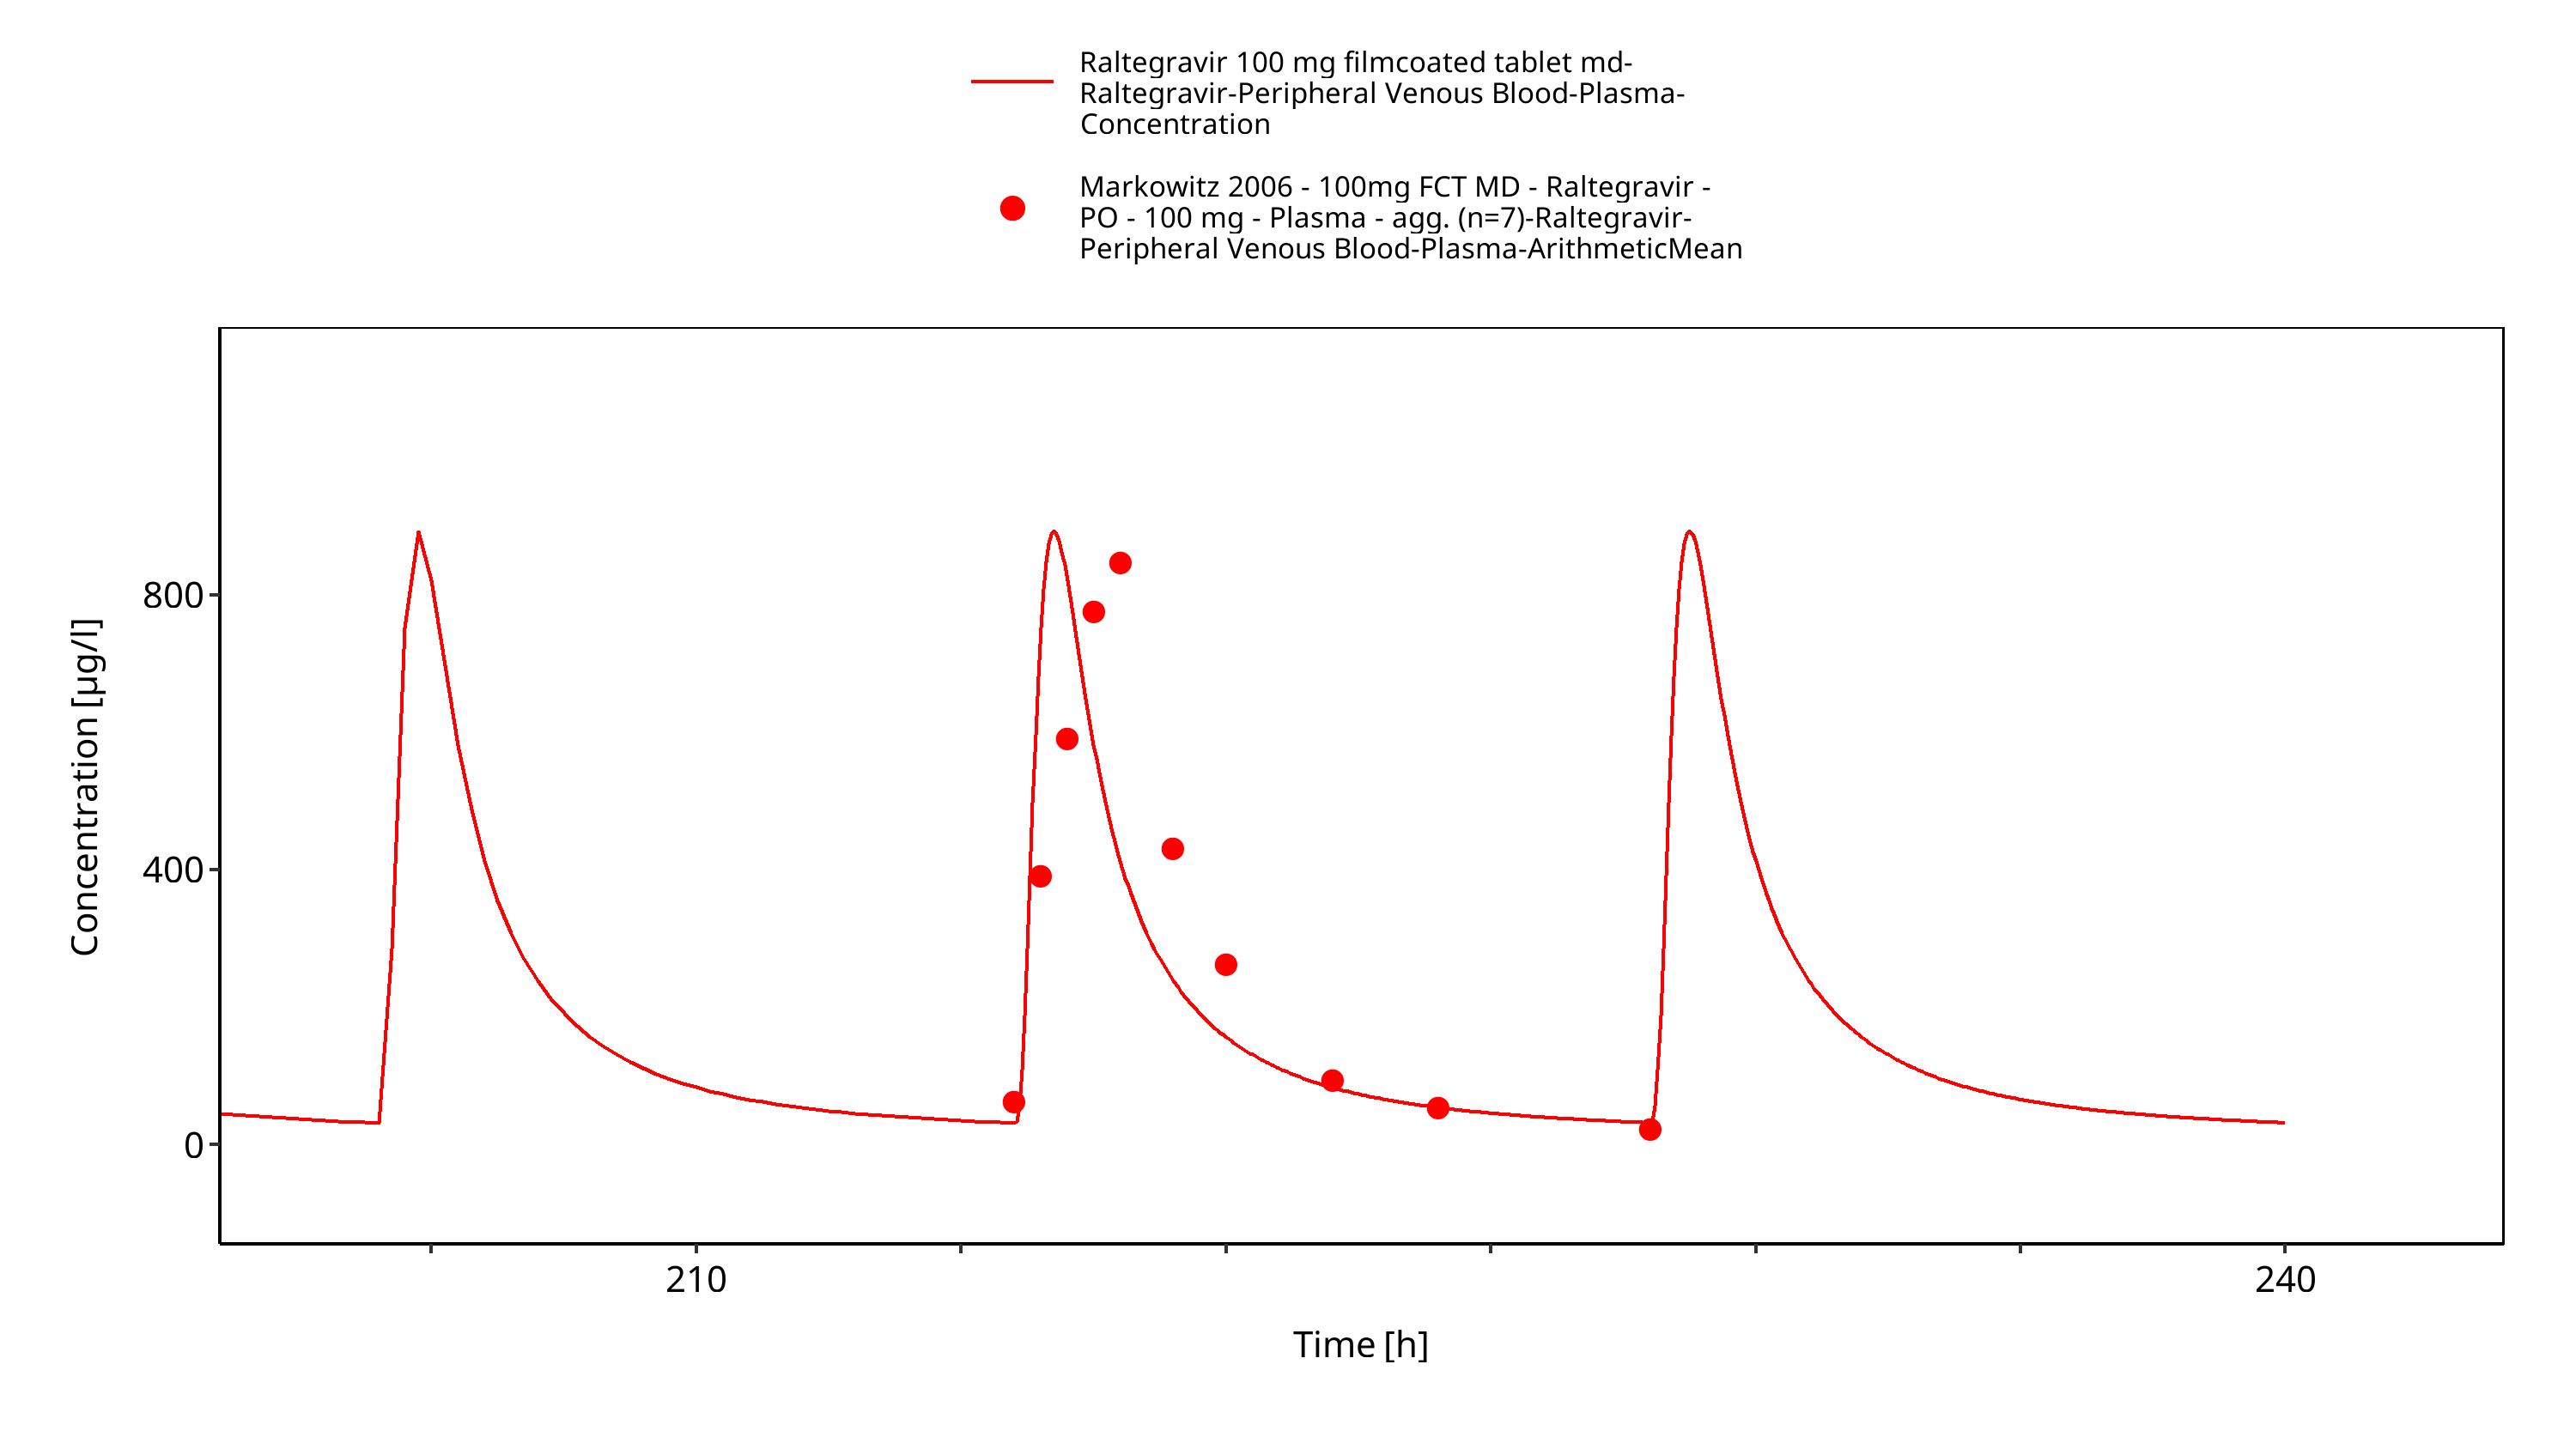
Figure 3-8: Time Profile Analysis 1
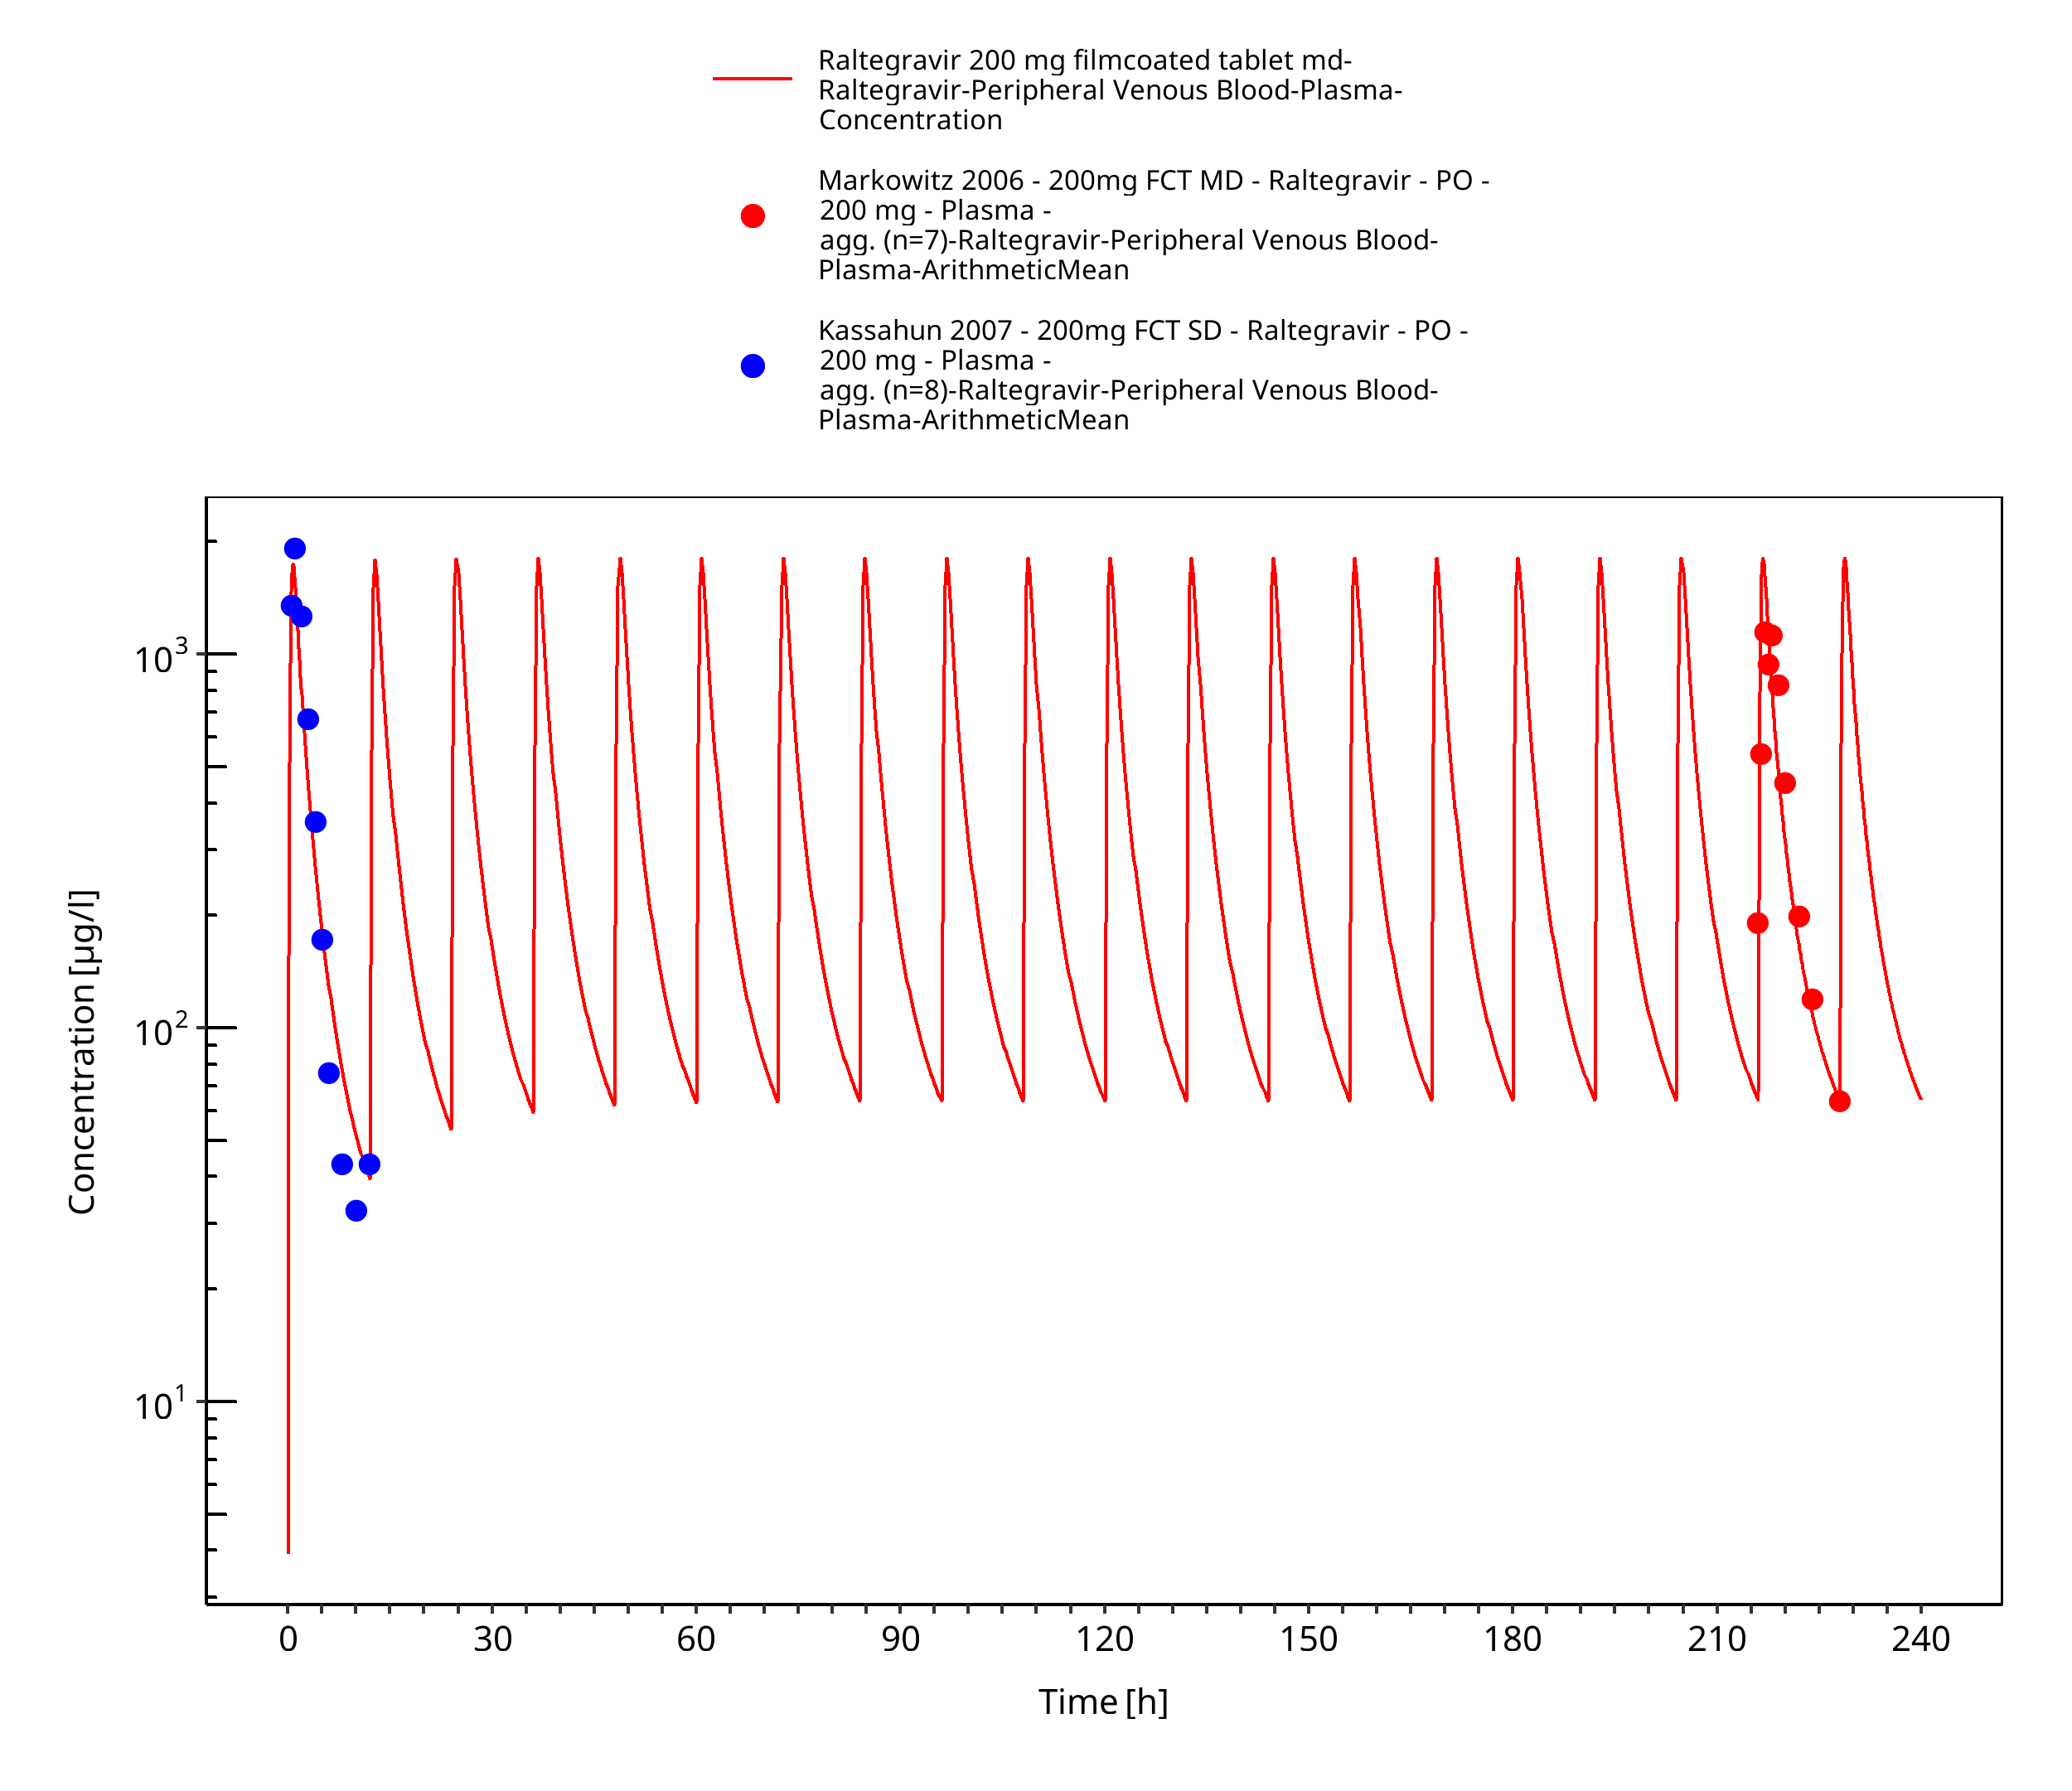
Figure 3-9: Time Profile Analysis
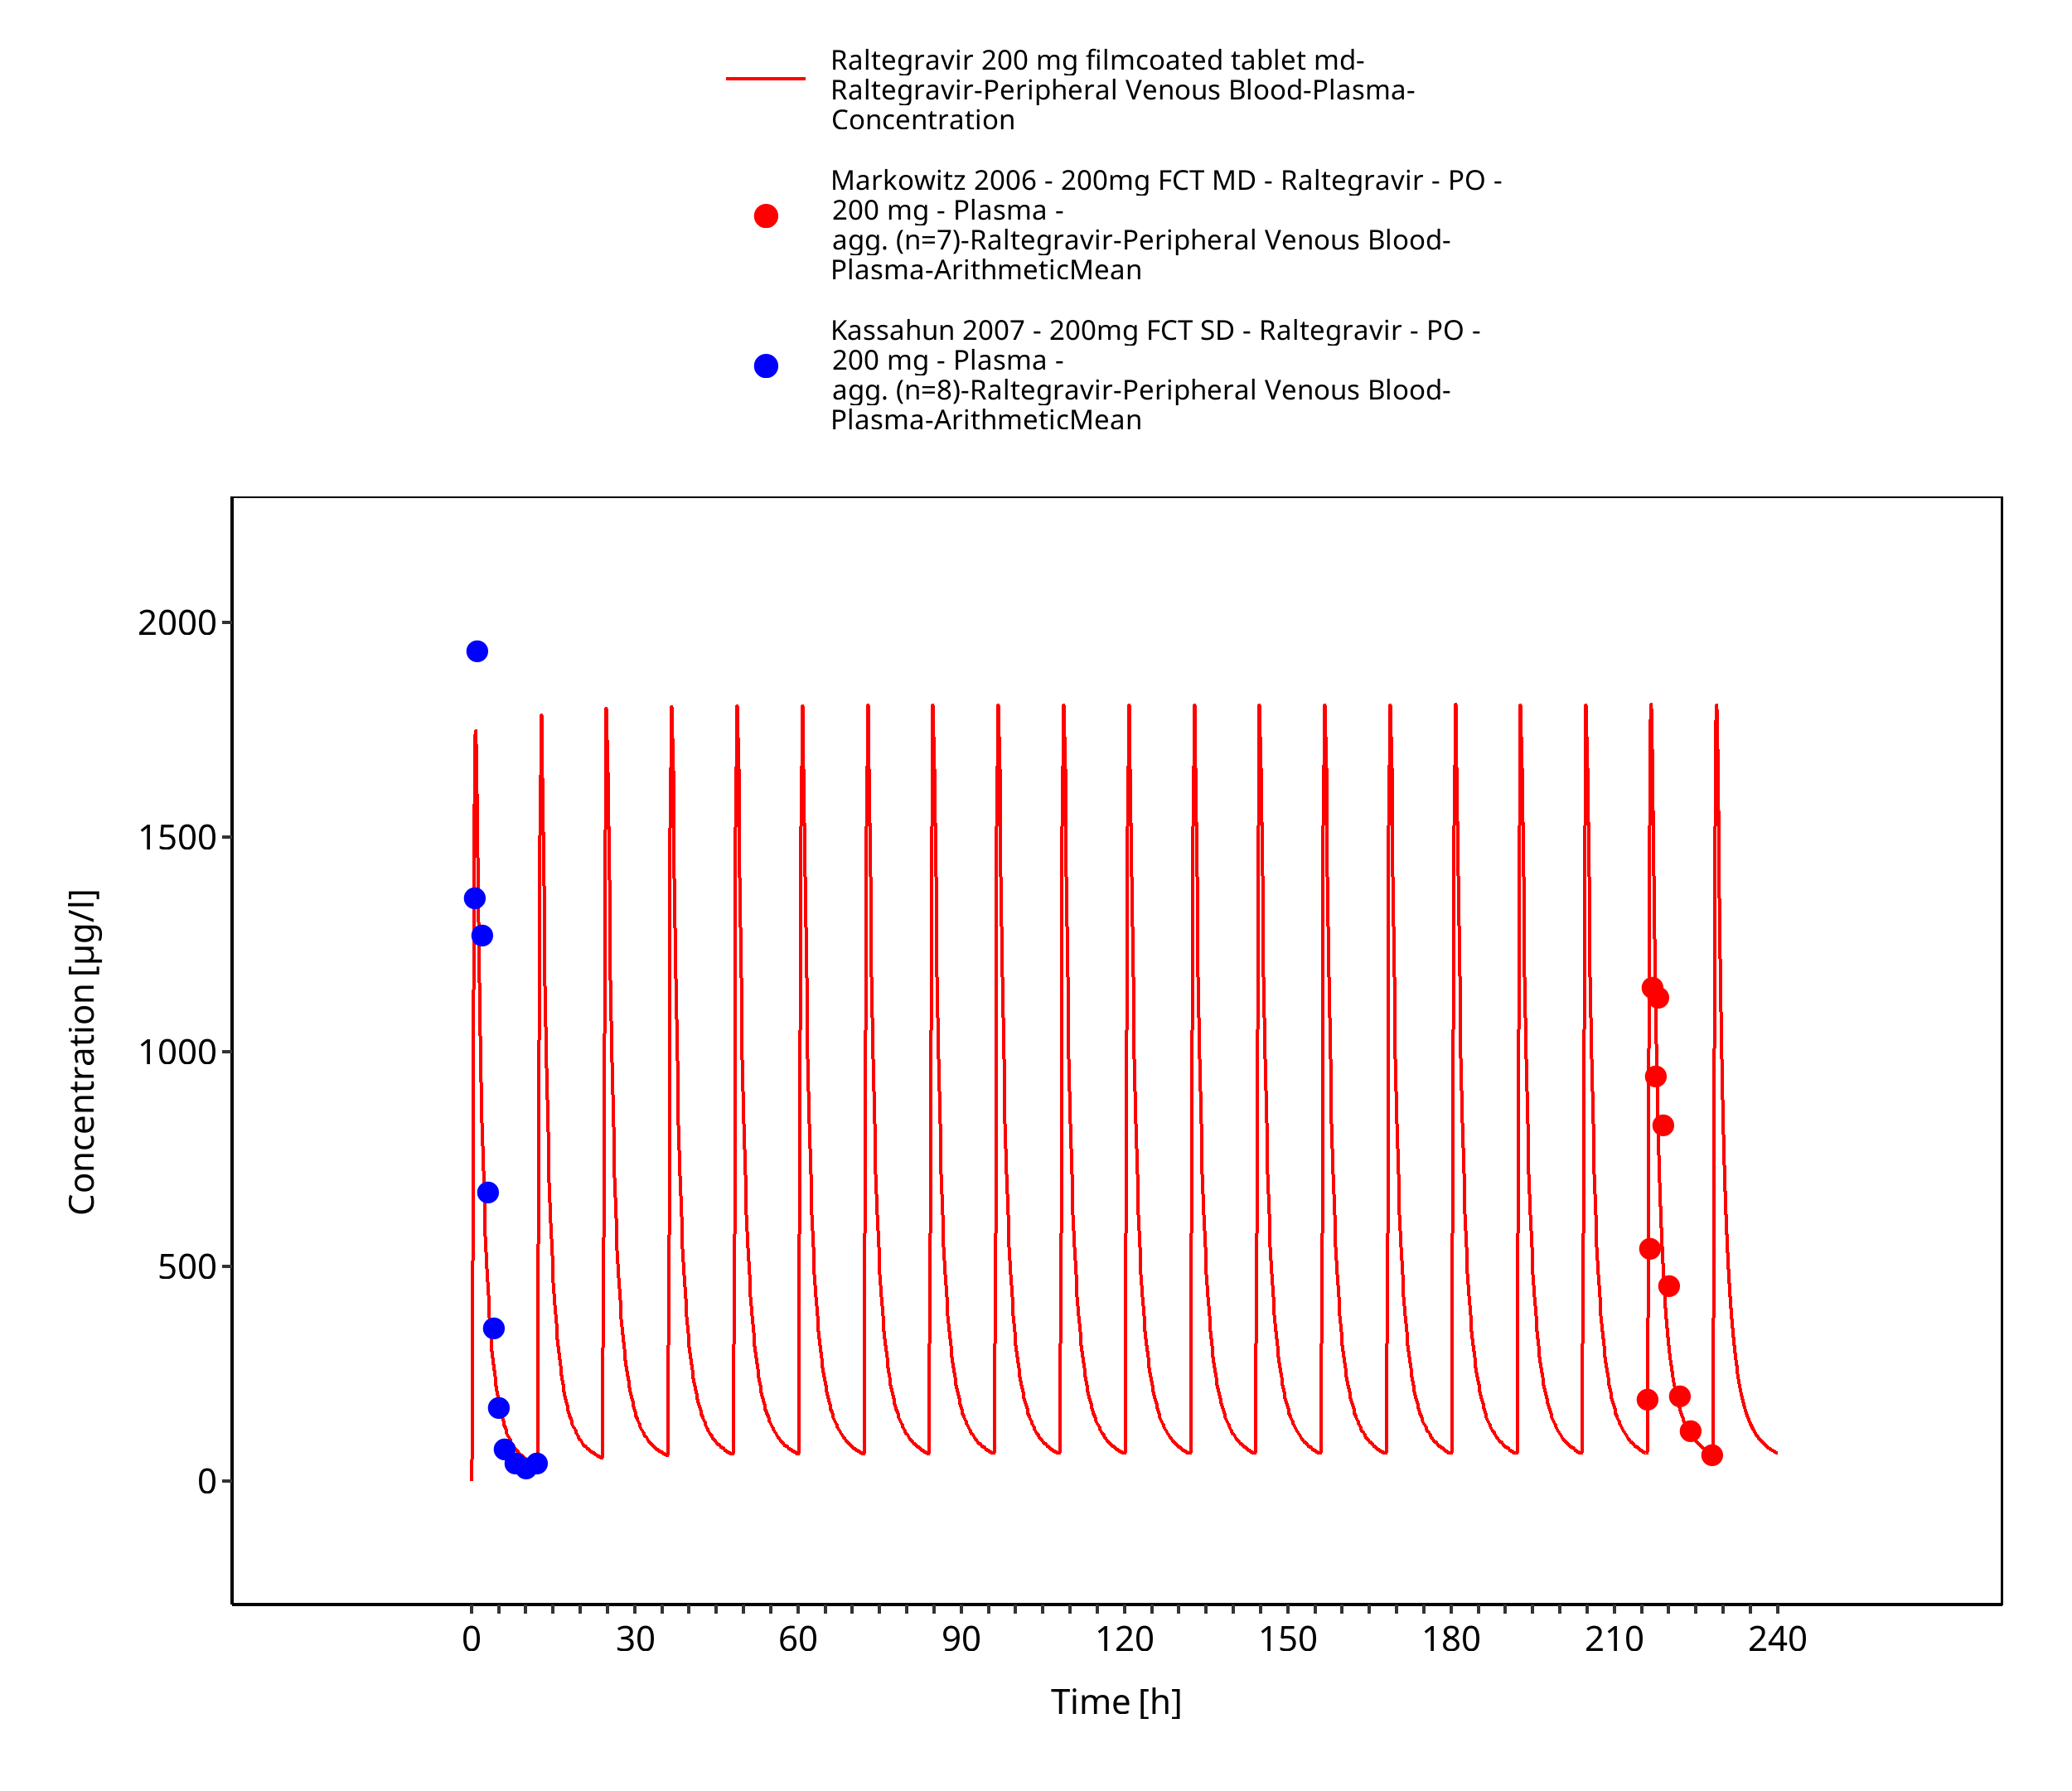
Figure 3-10: Time Profile Analysis 1
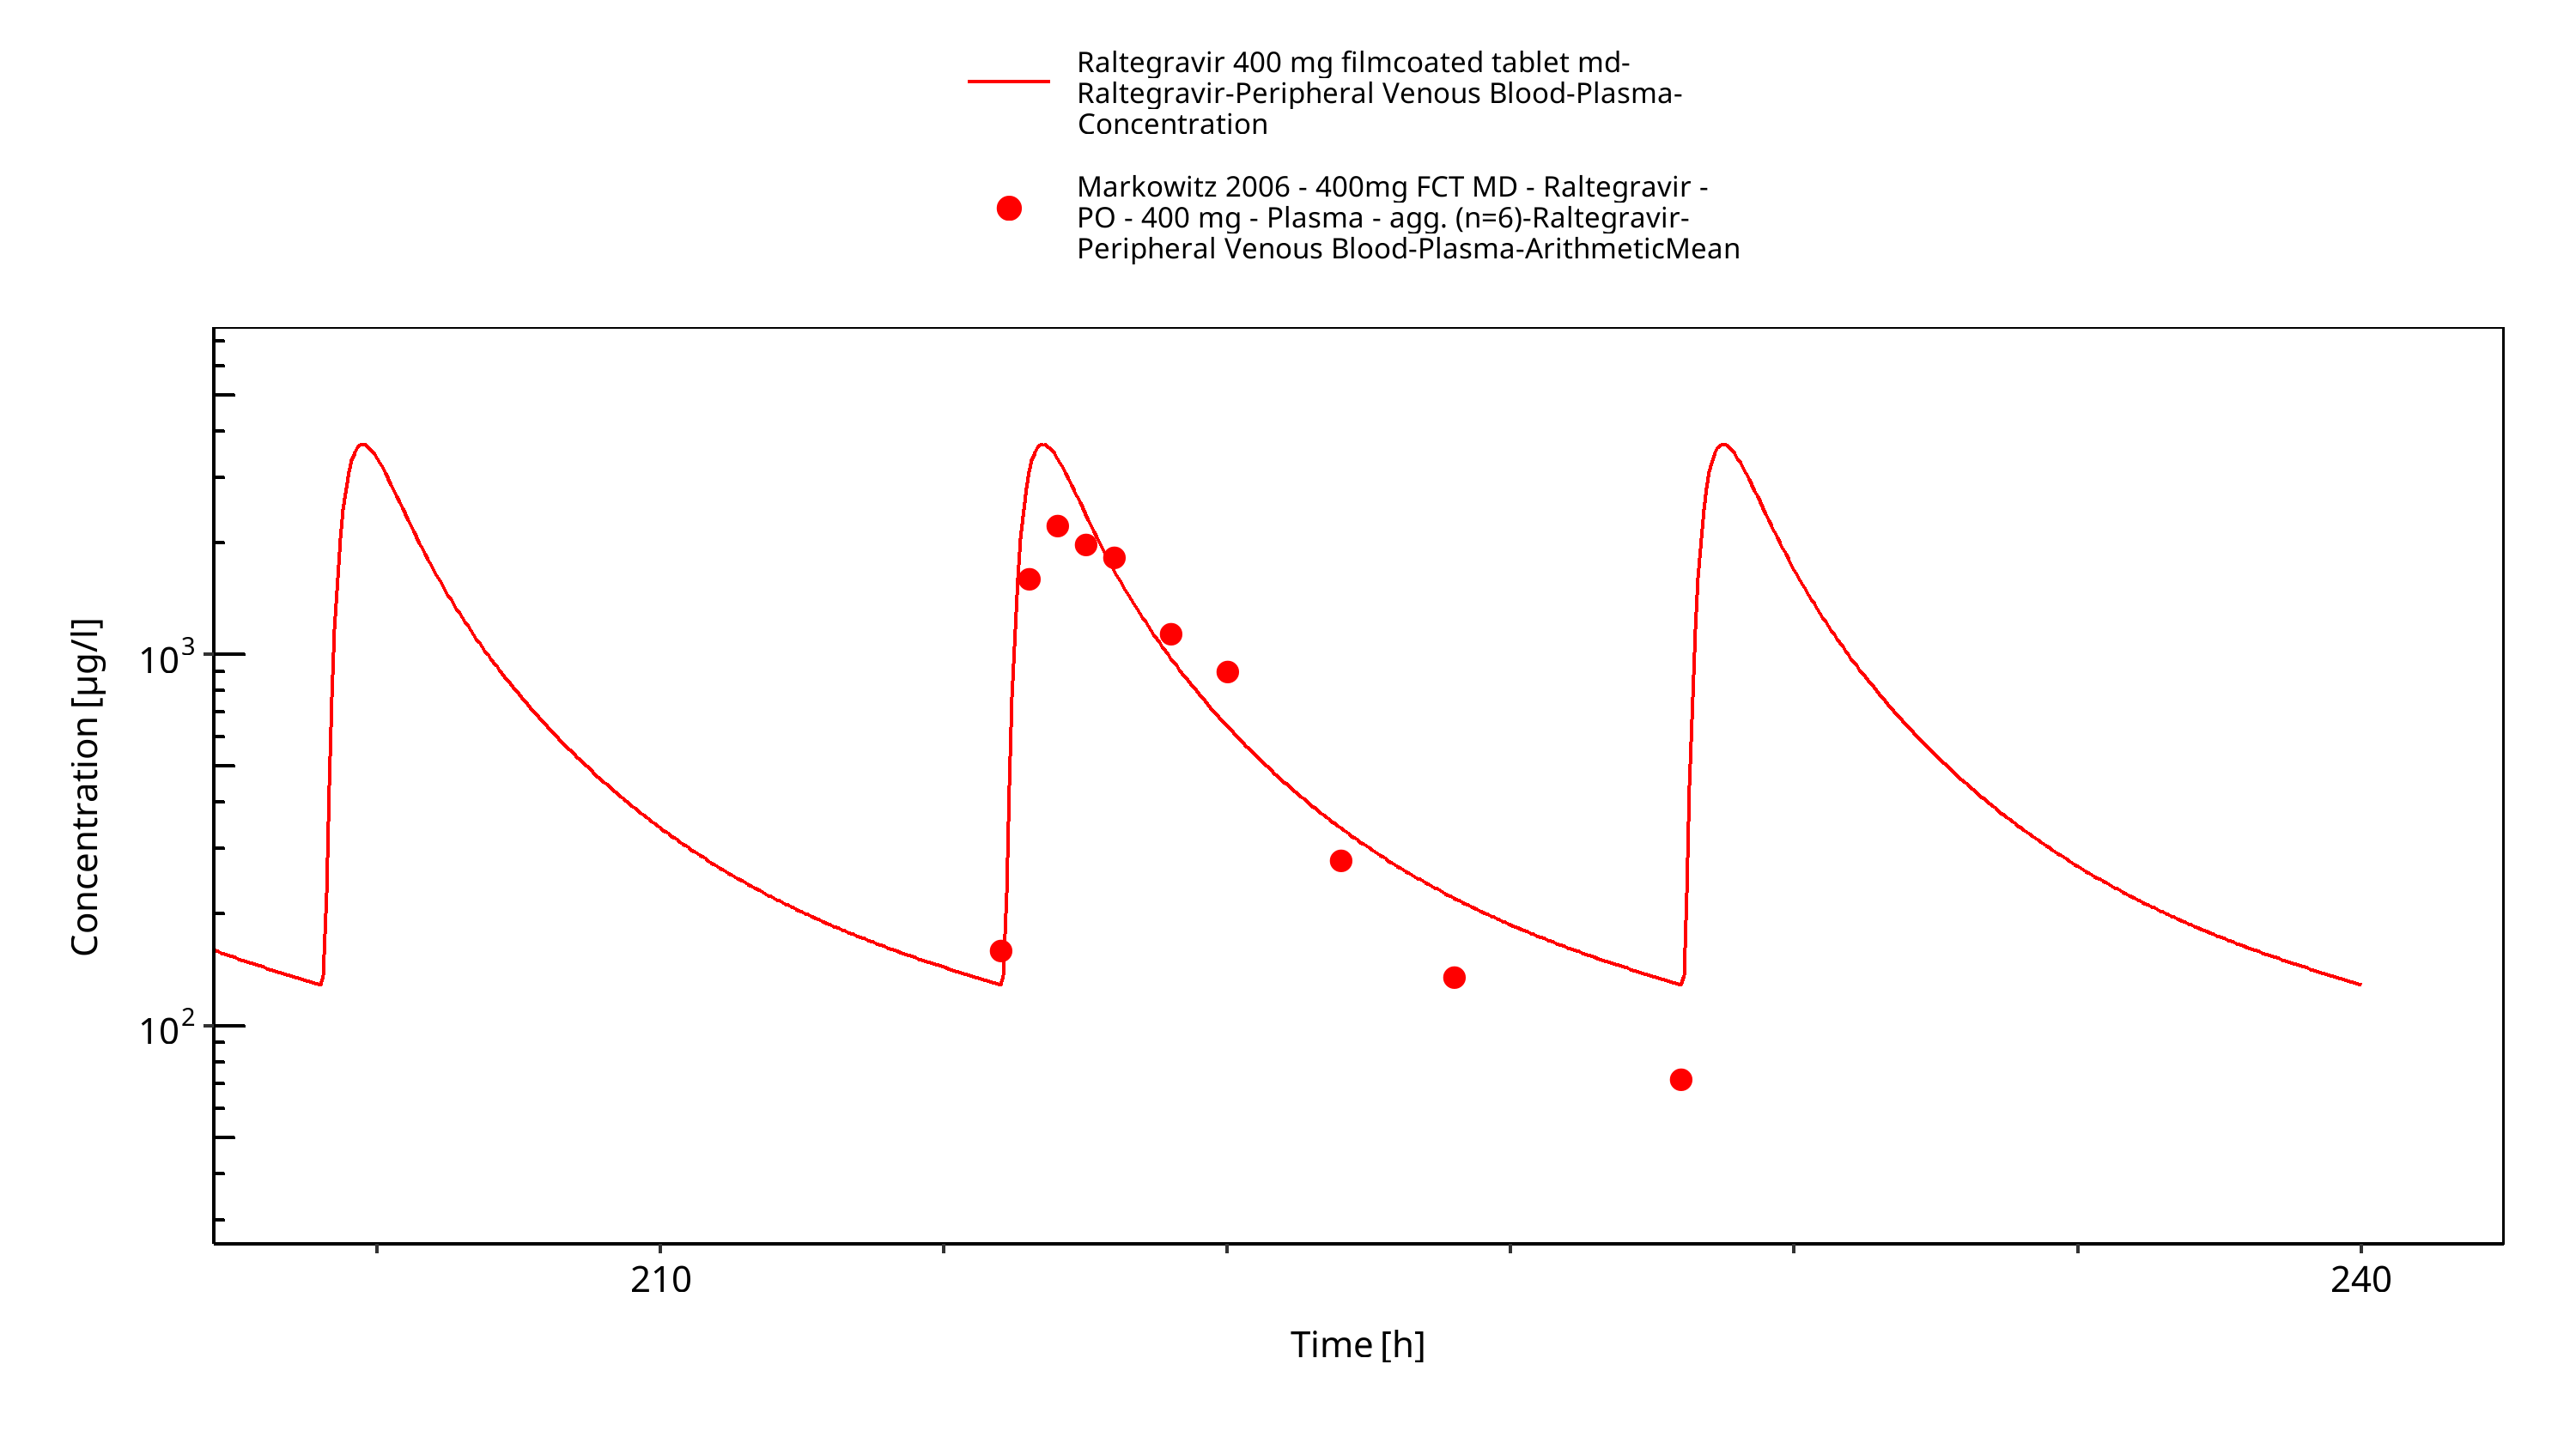
Figure 3-11: Time Profile Analysis
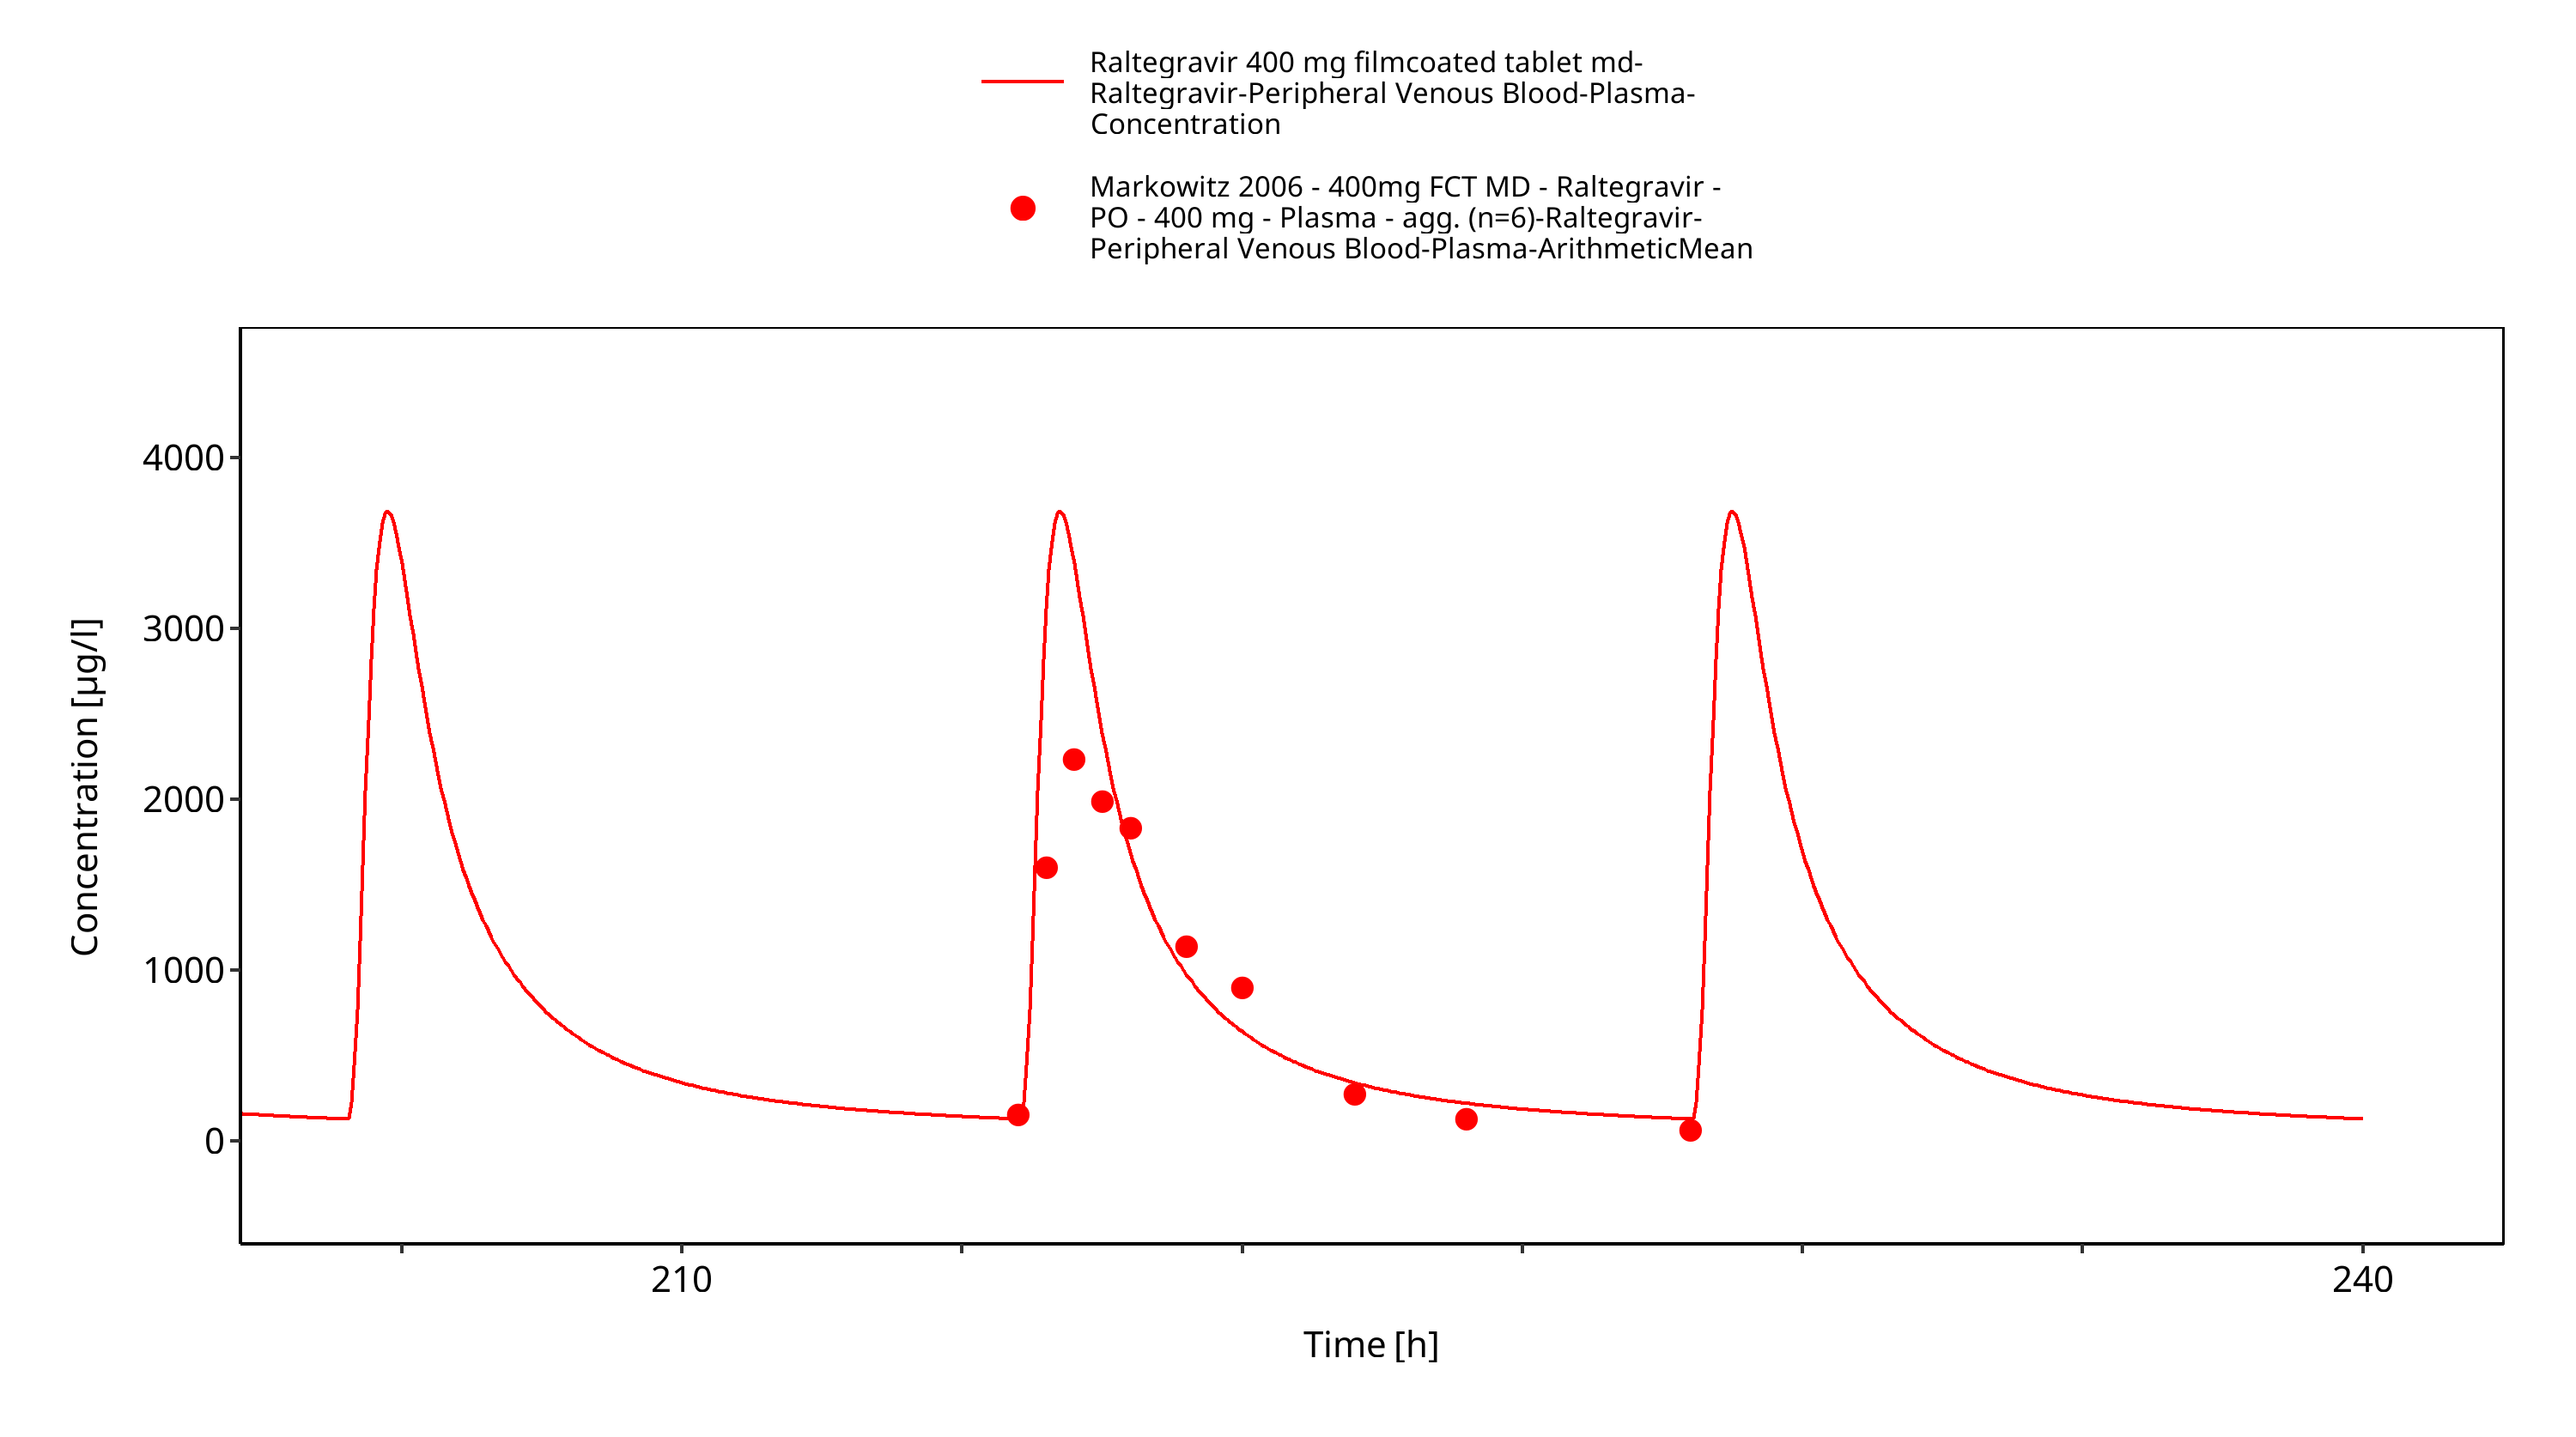
Figure 3-12: Time Profile Analysis 1
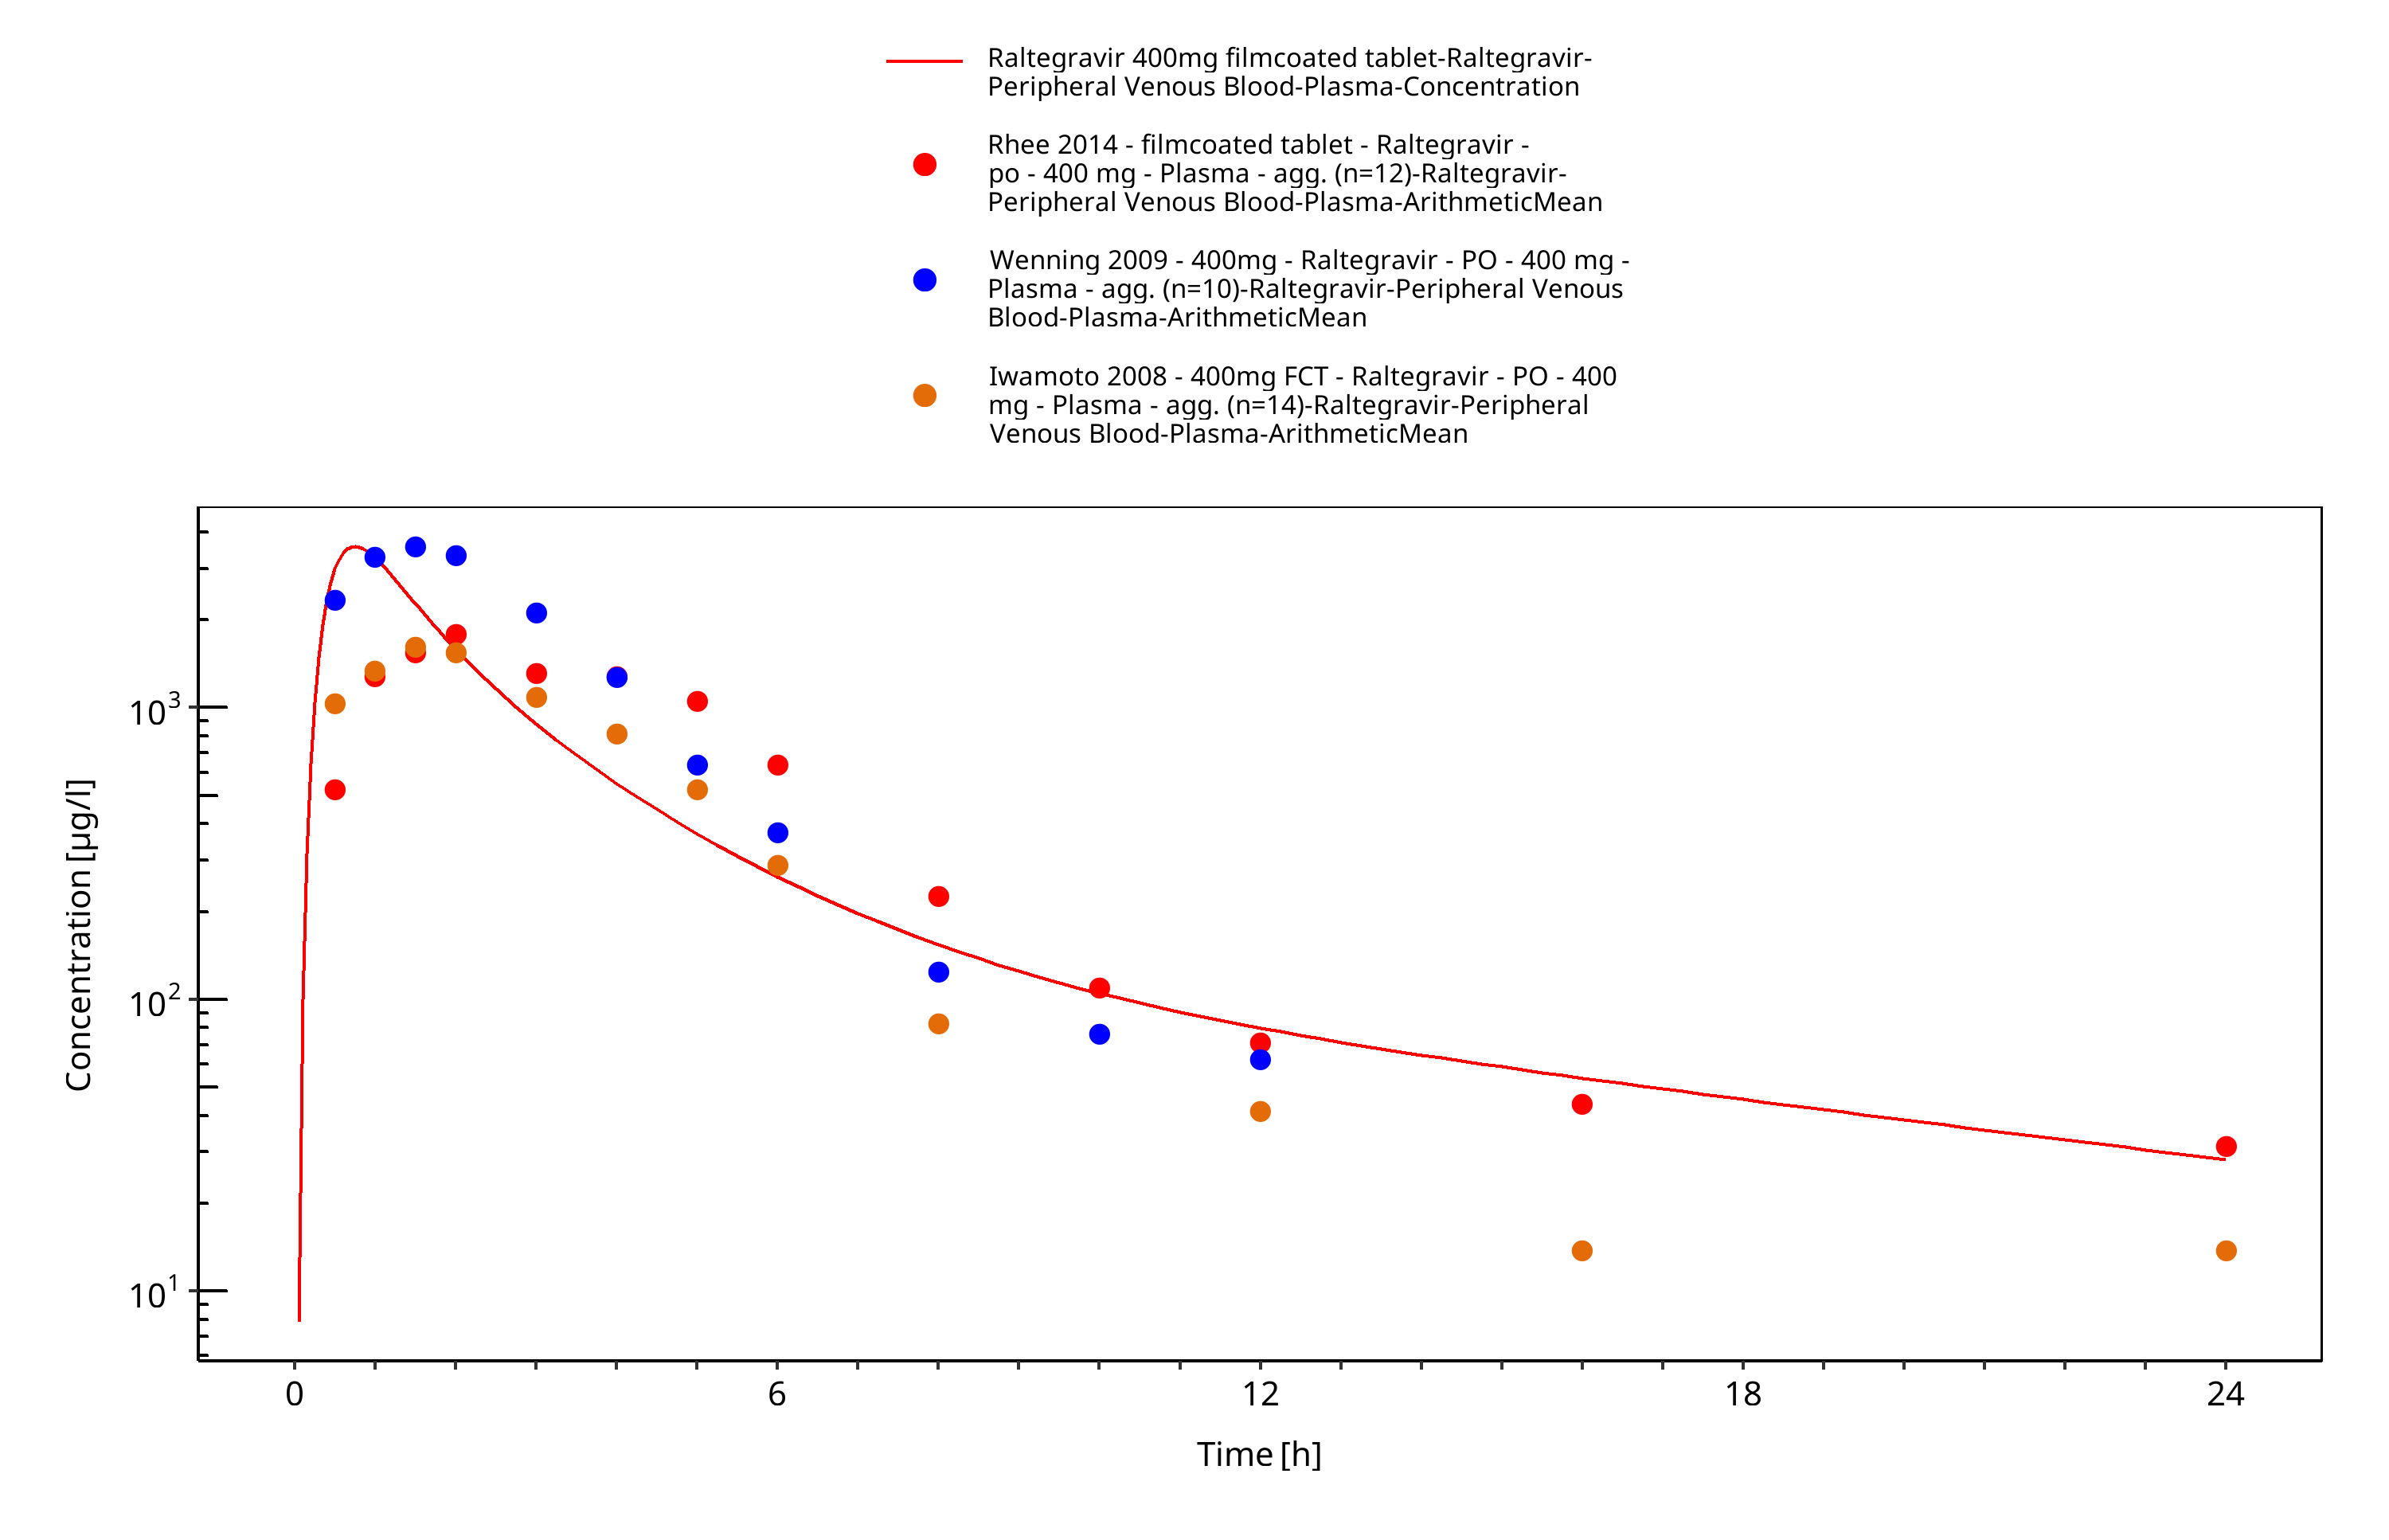
Figure 3-13: Time Profile Analysis
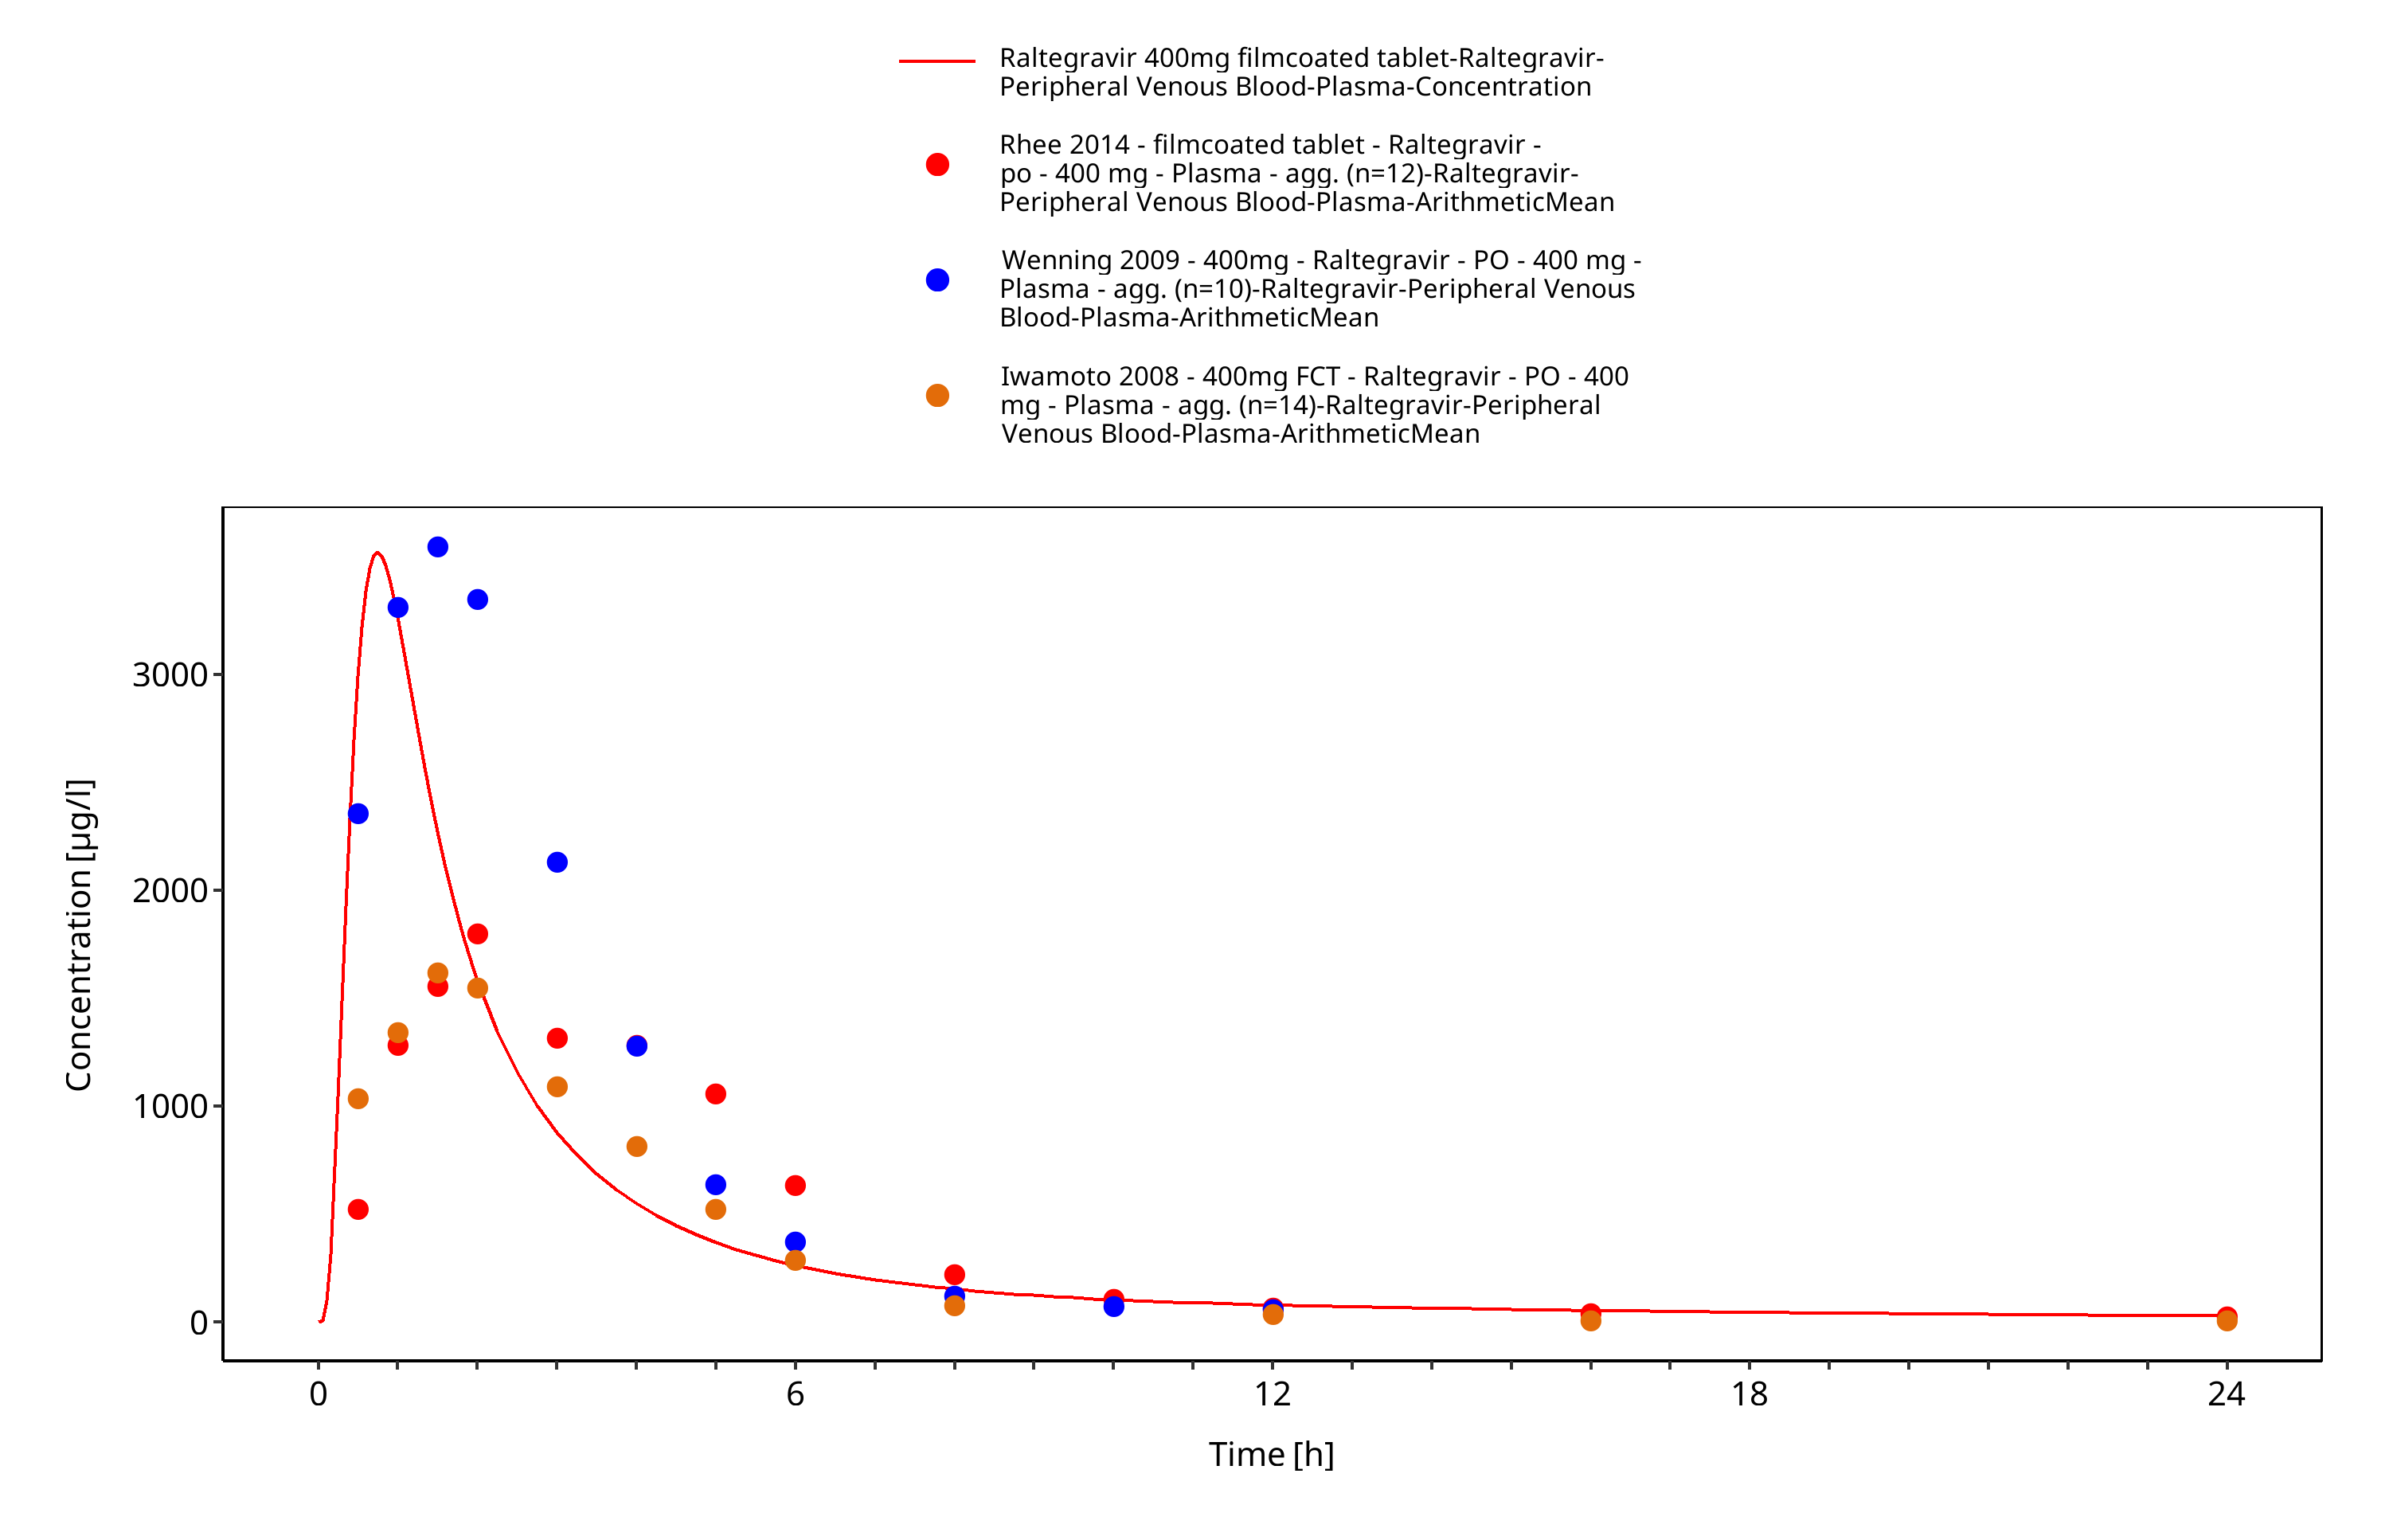
Figure 3-14: Time Profile Analysis 1
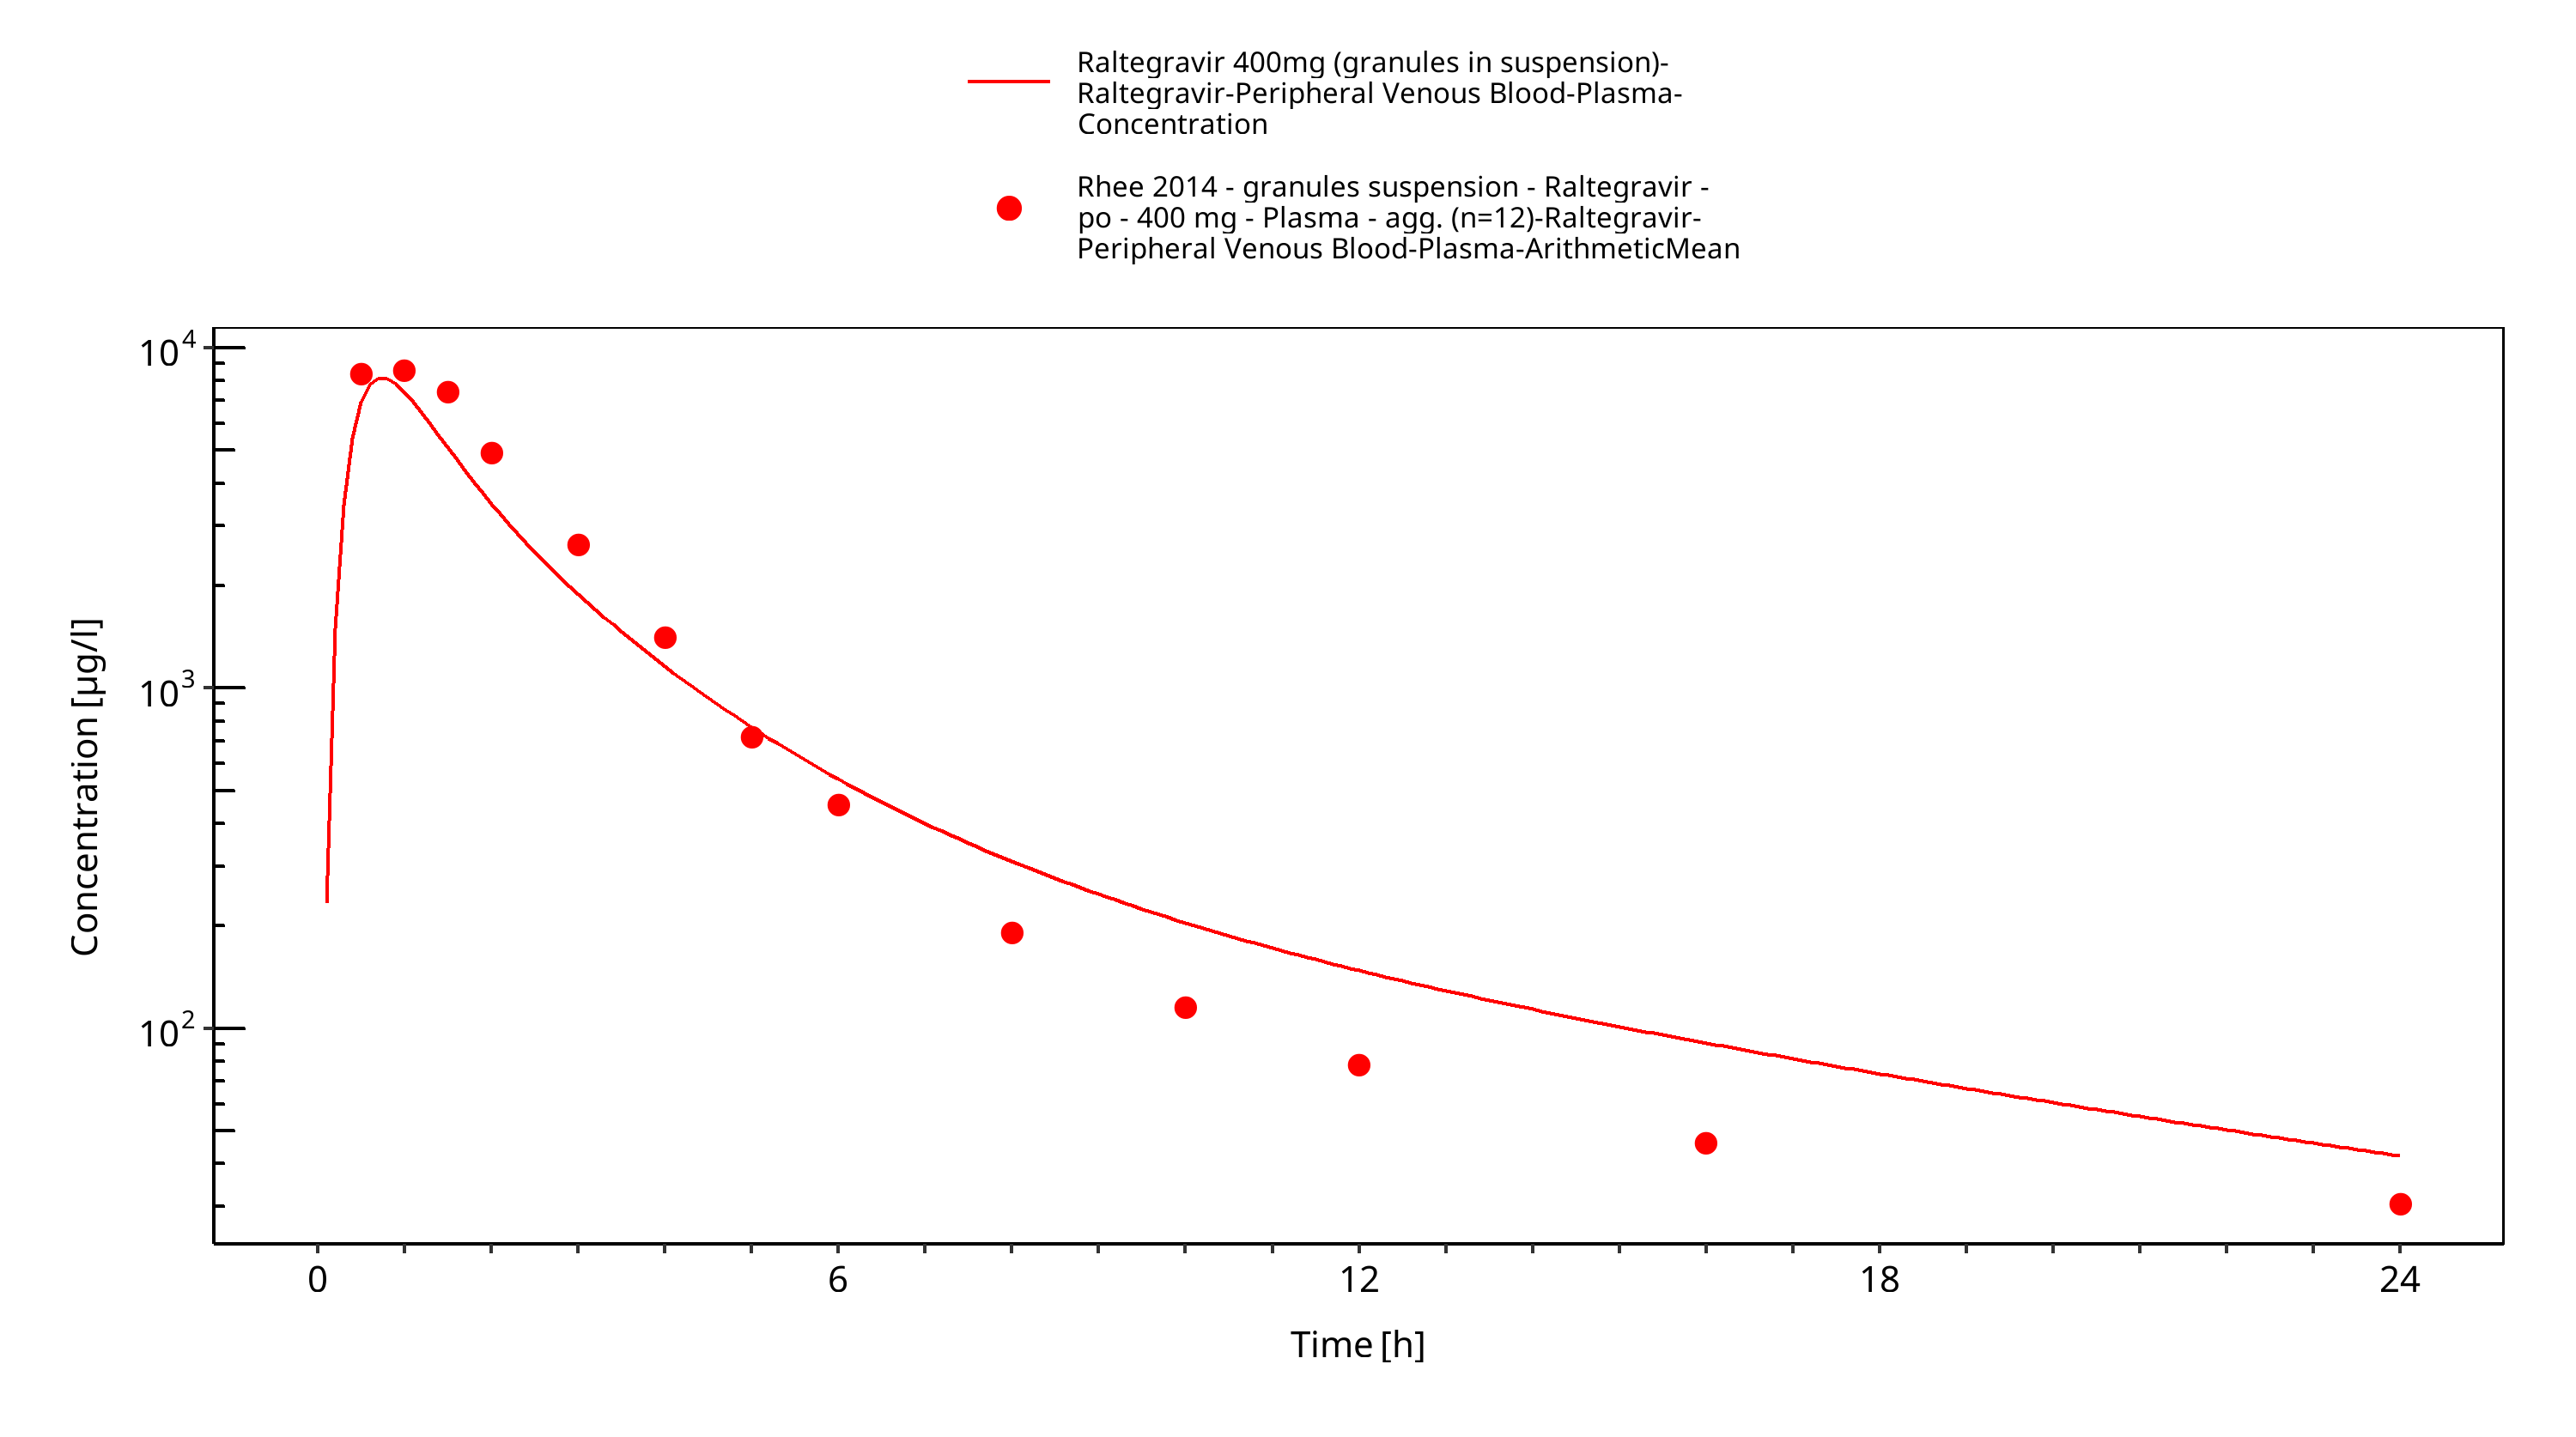
Figure 3-15: Time Profile Analysis
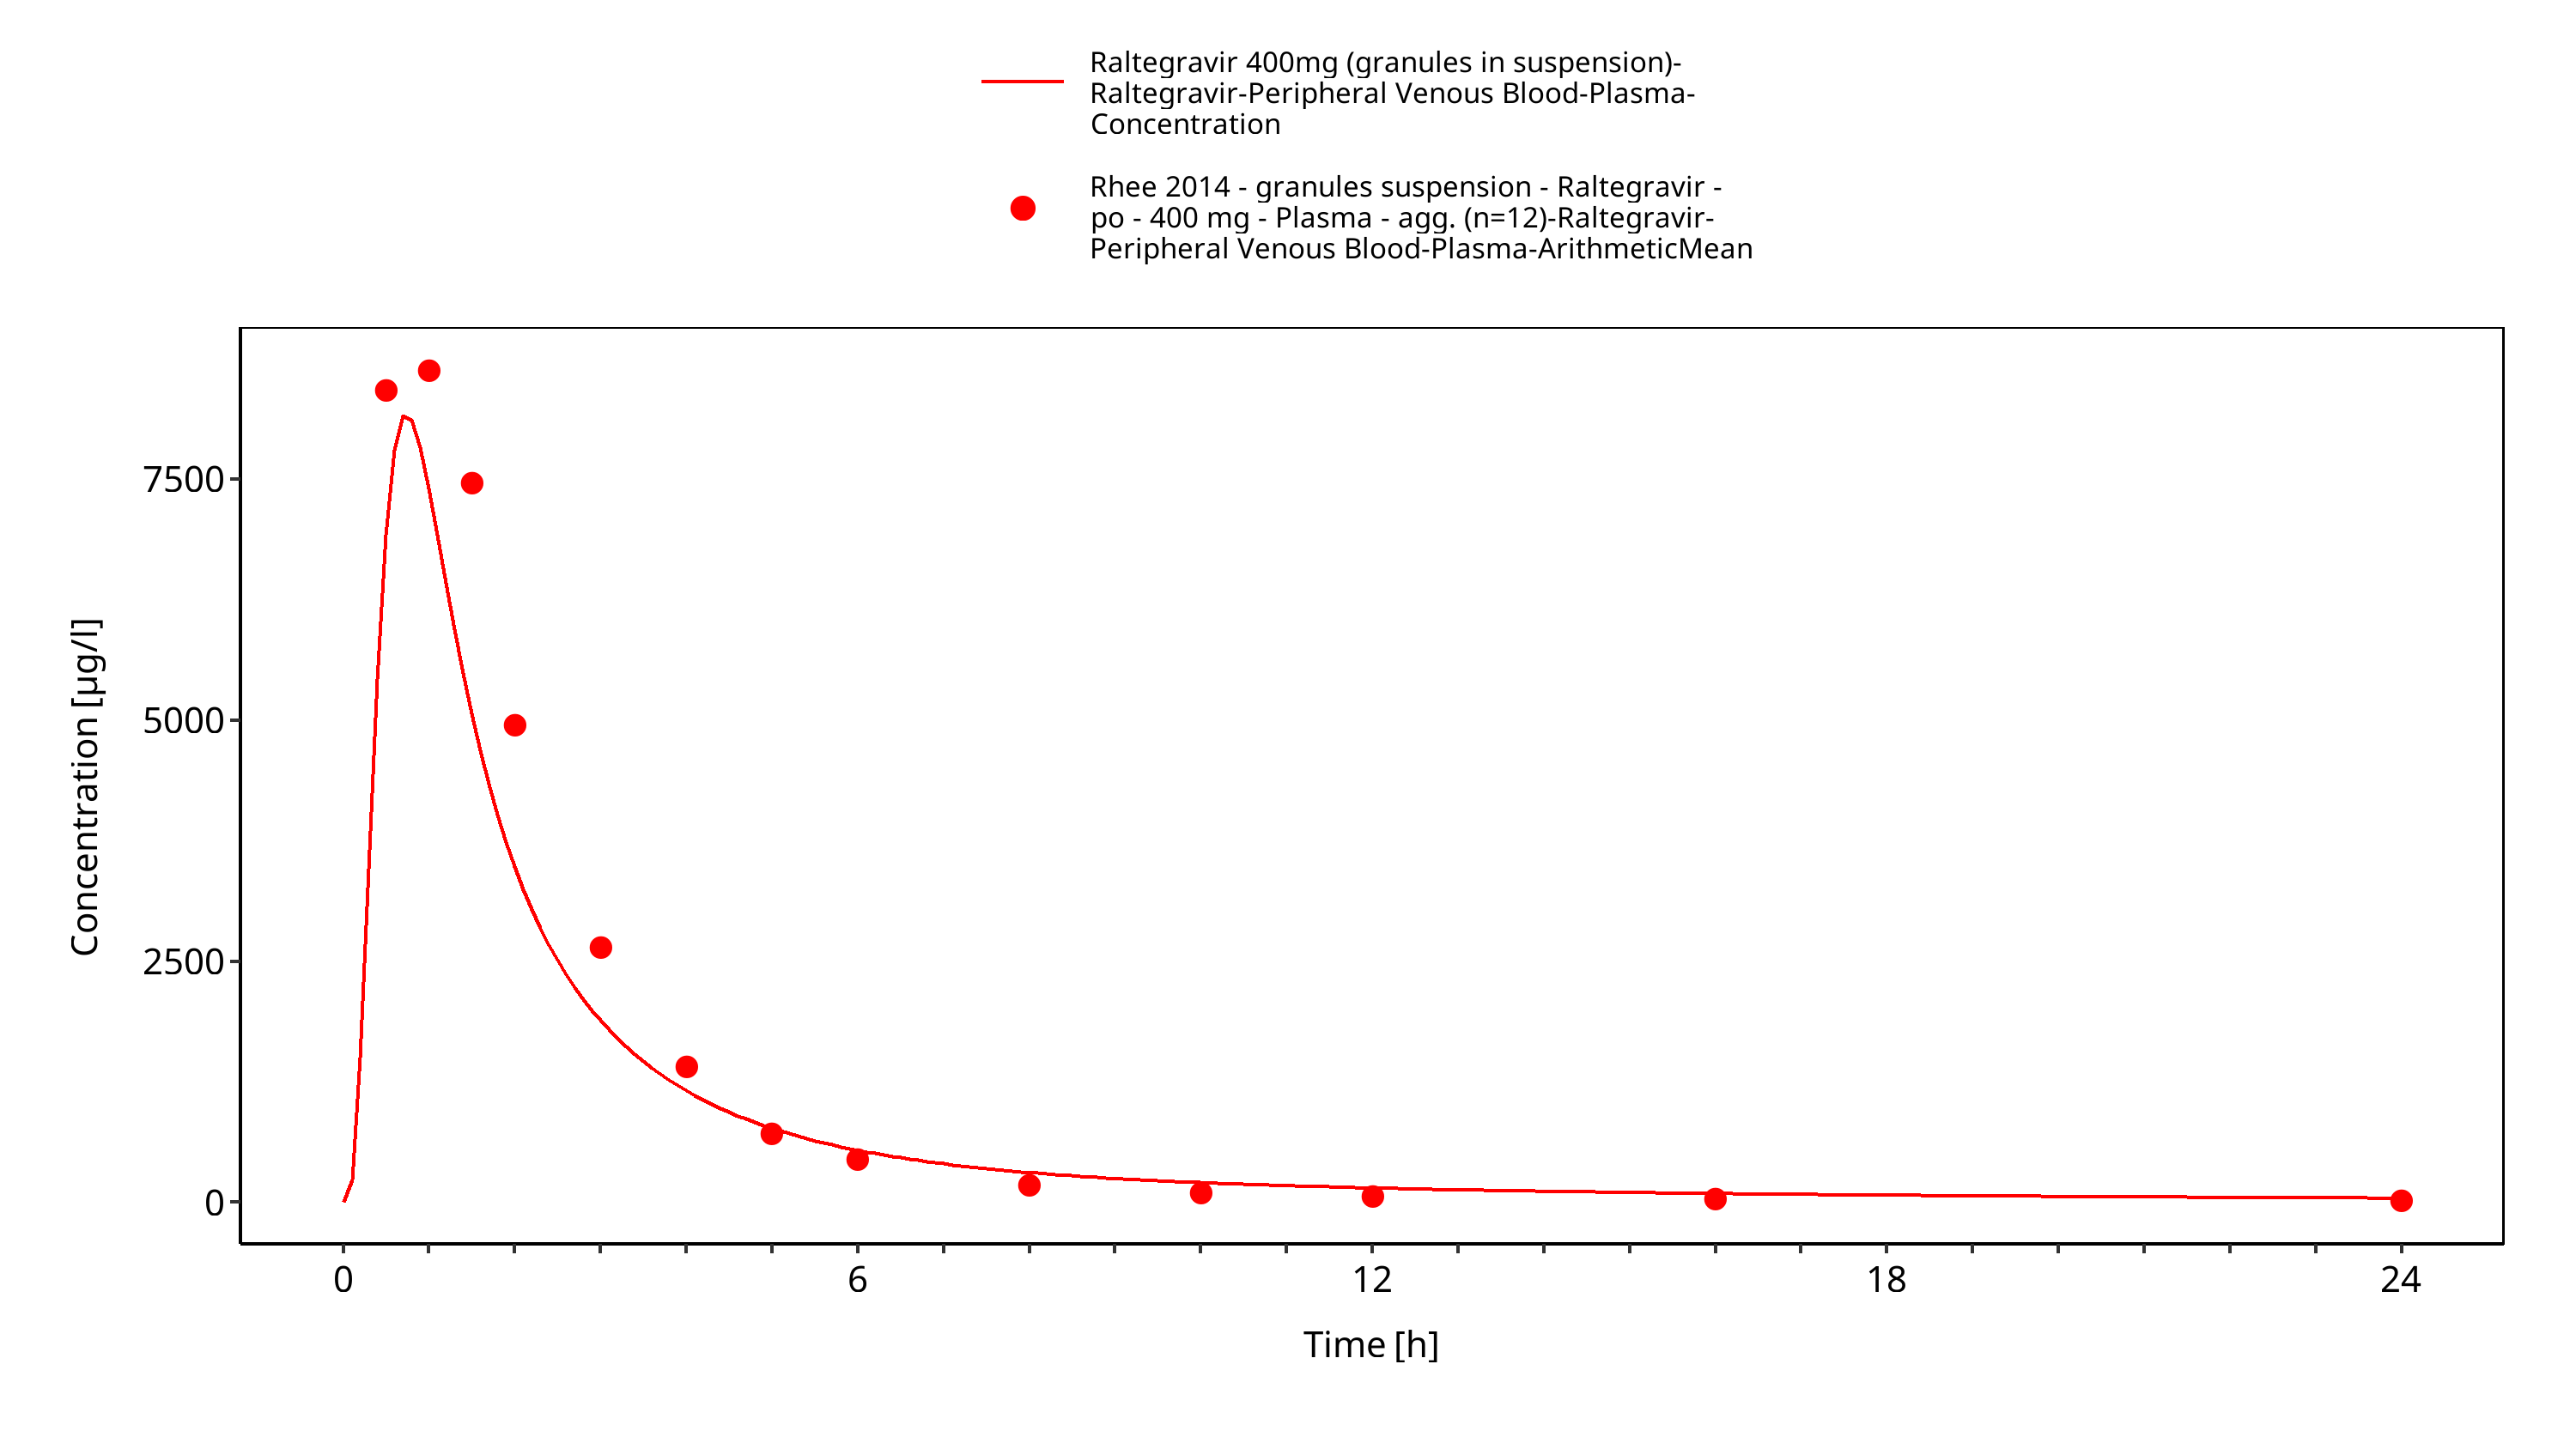
Figure 3-16: Time Profile Analysis 1
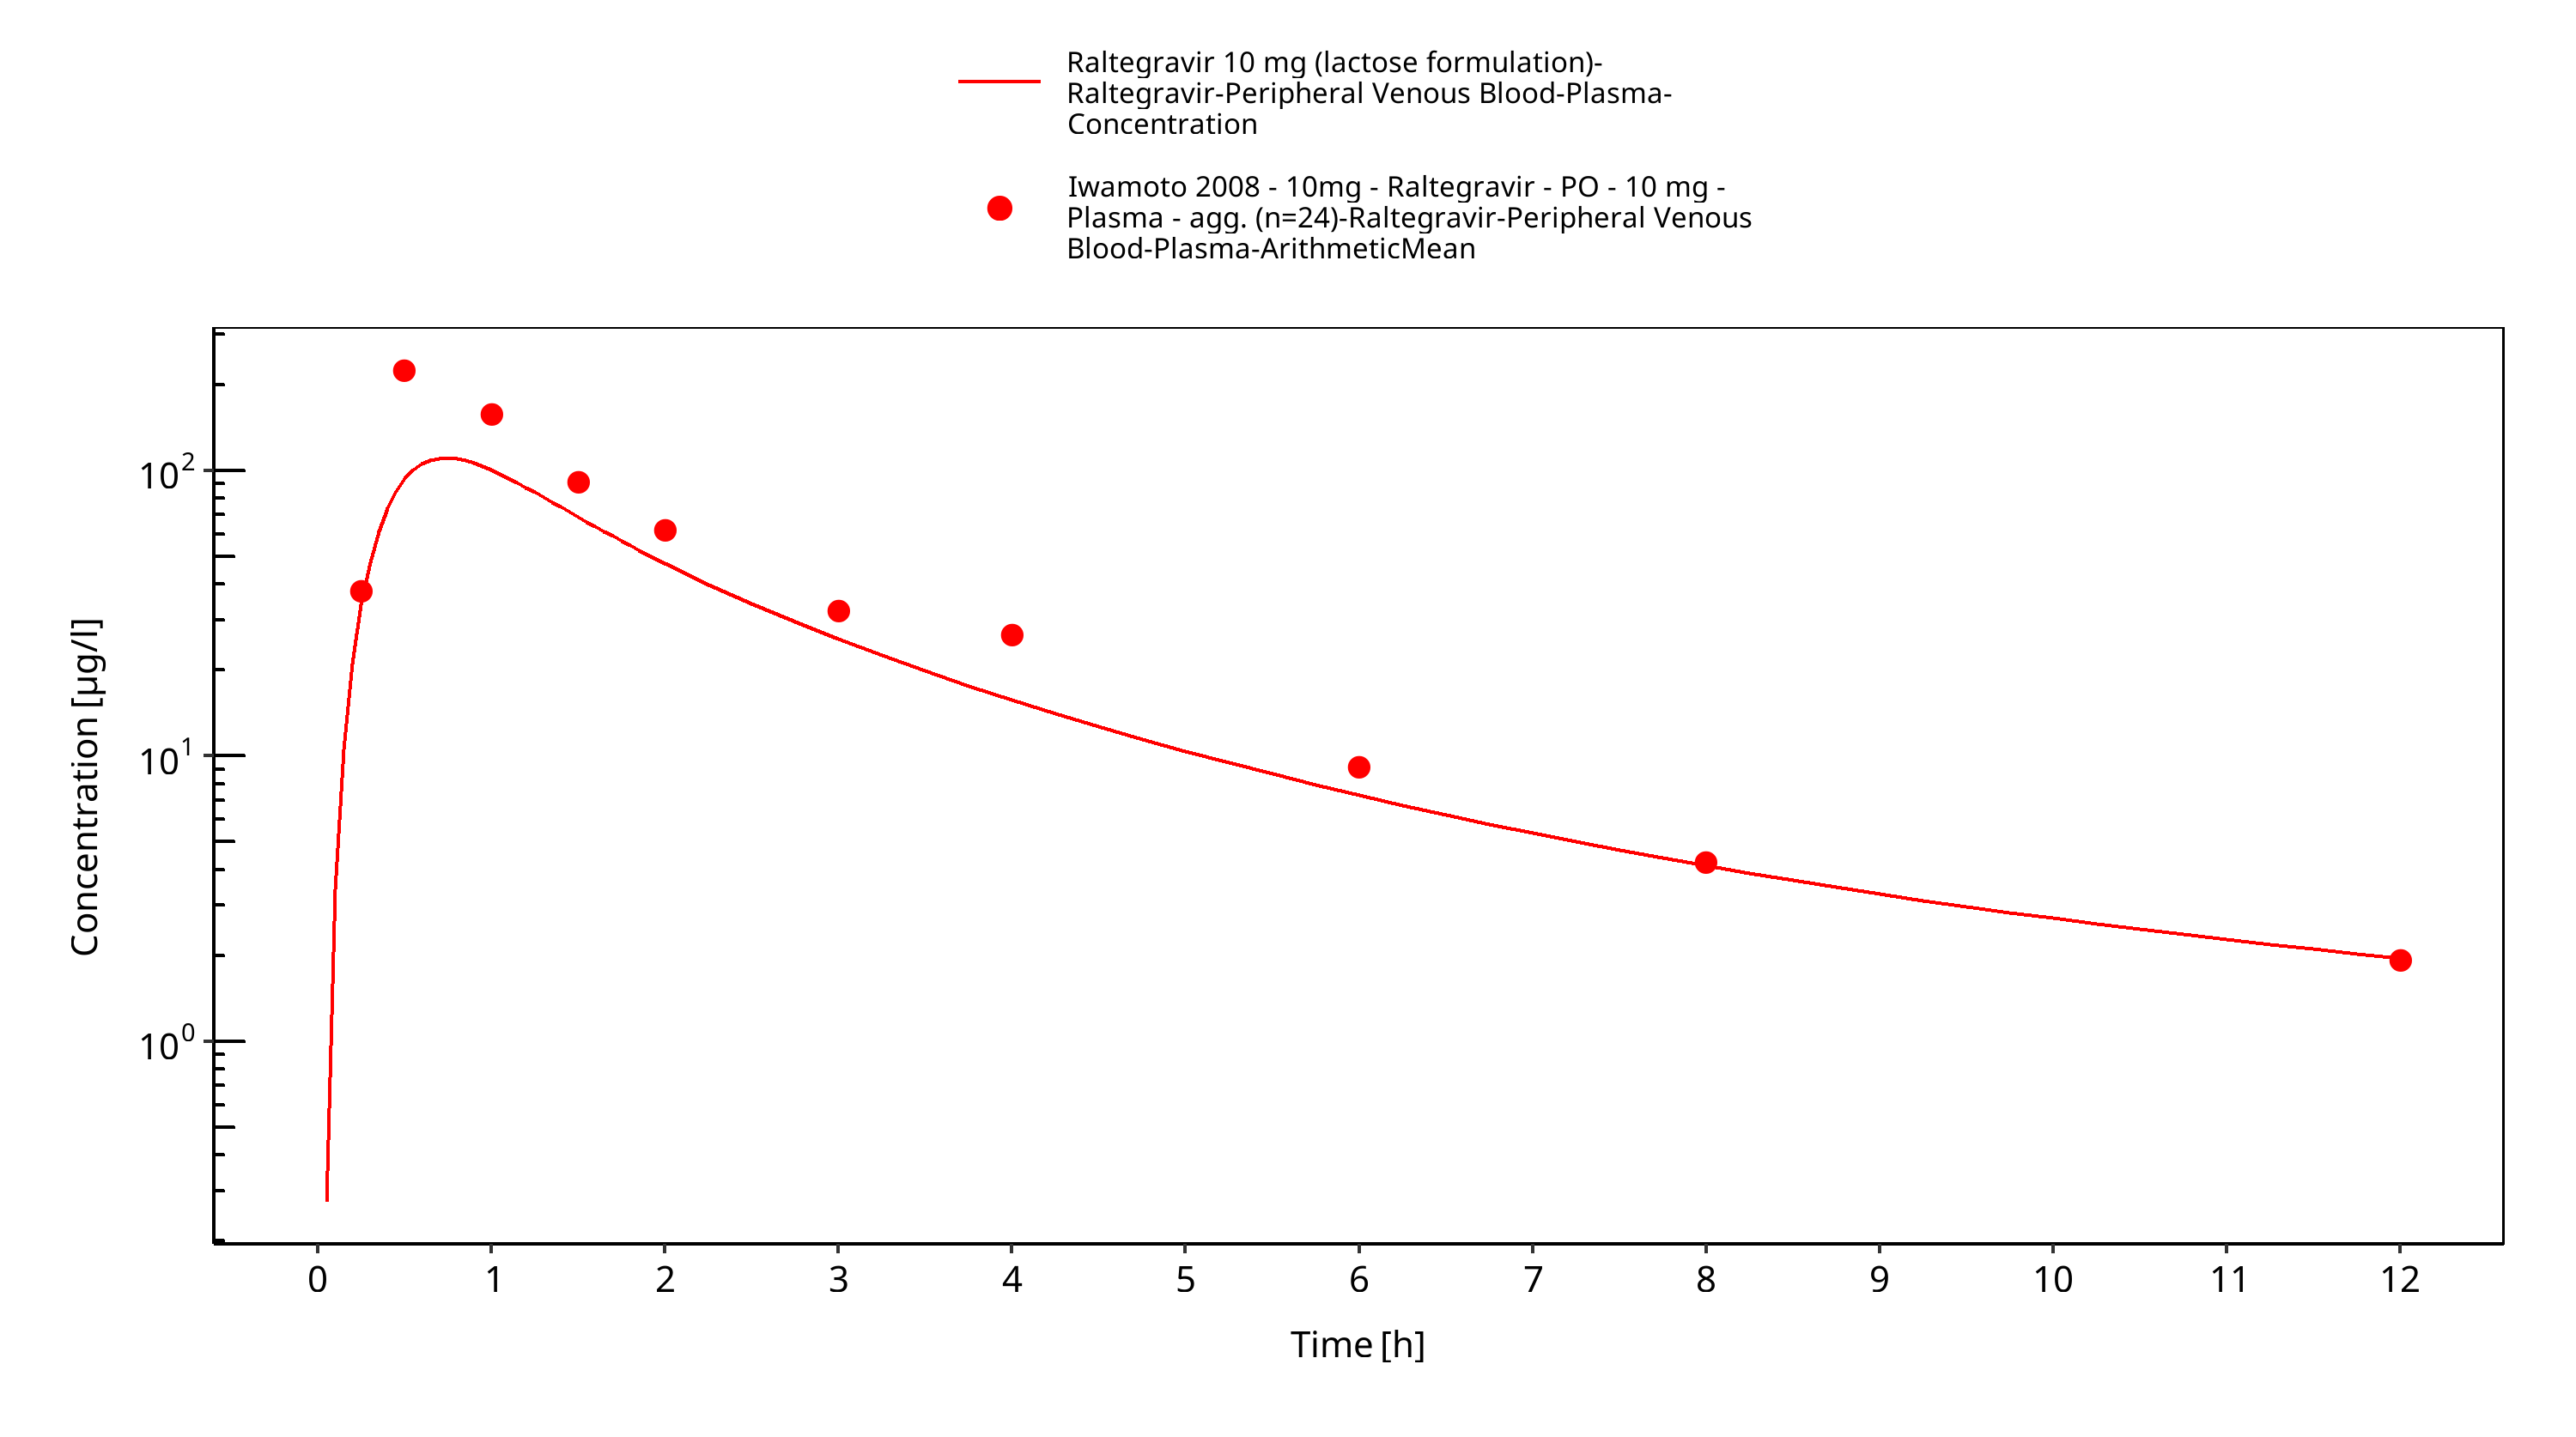
Figure 3-17: Time Profile Analysis
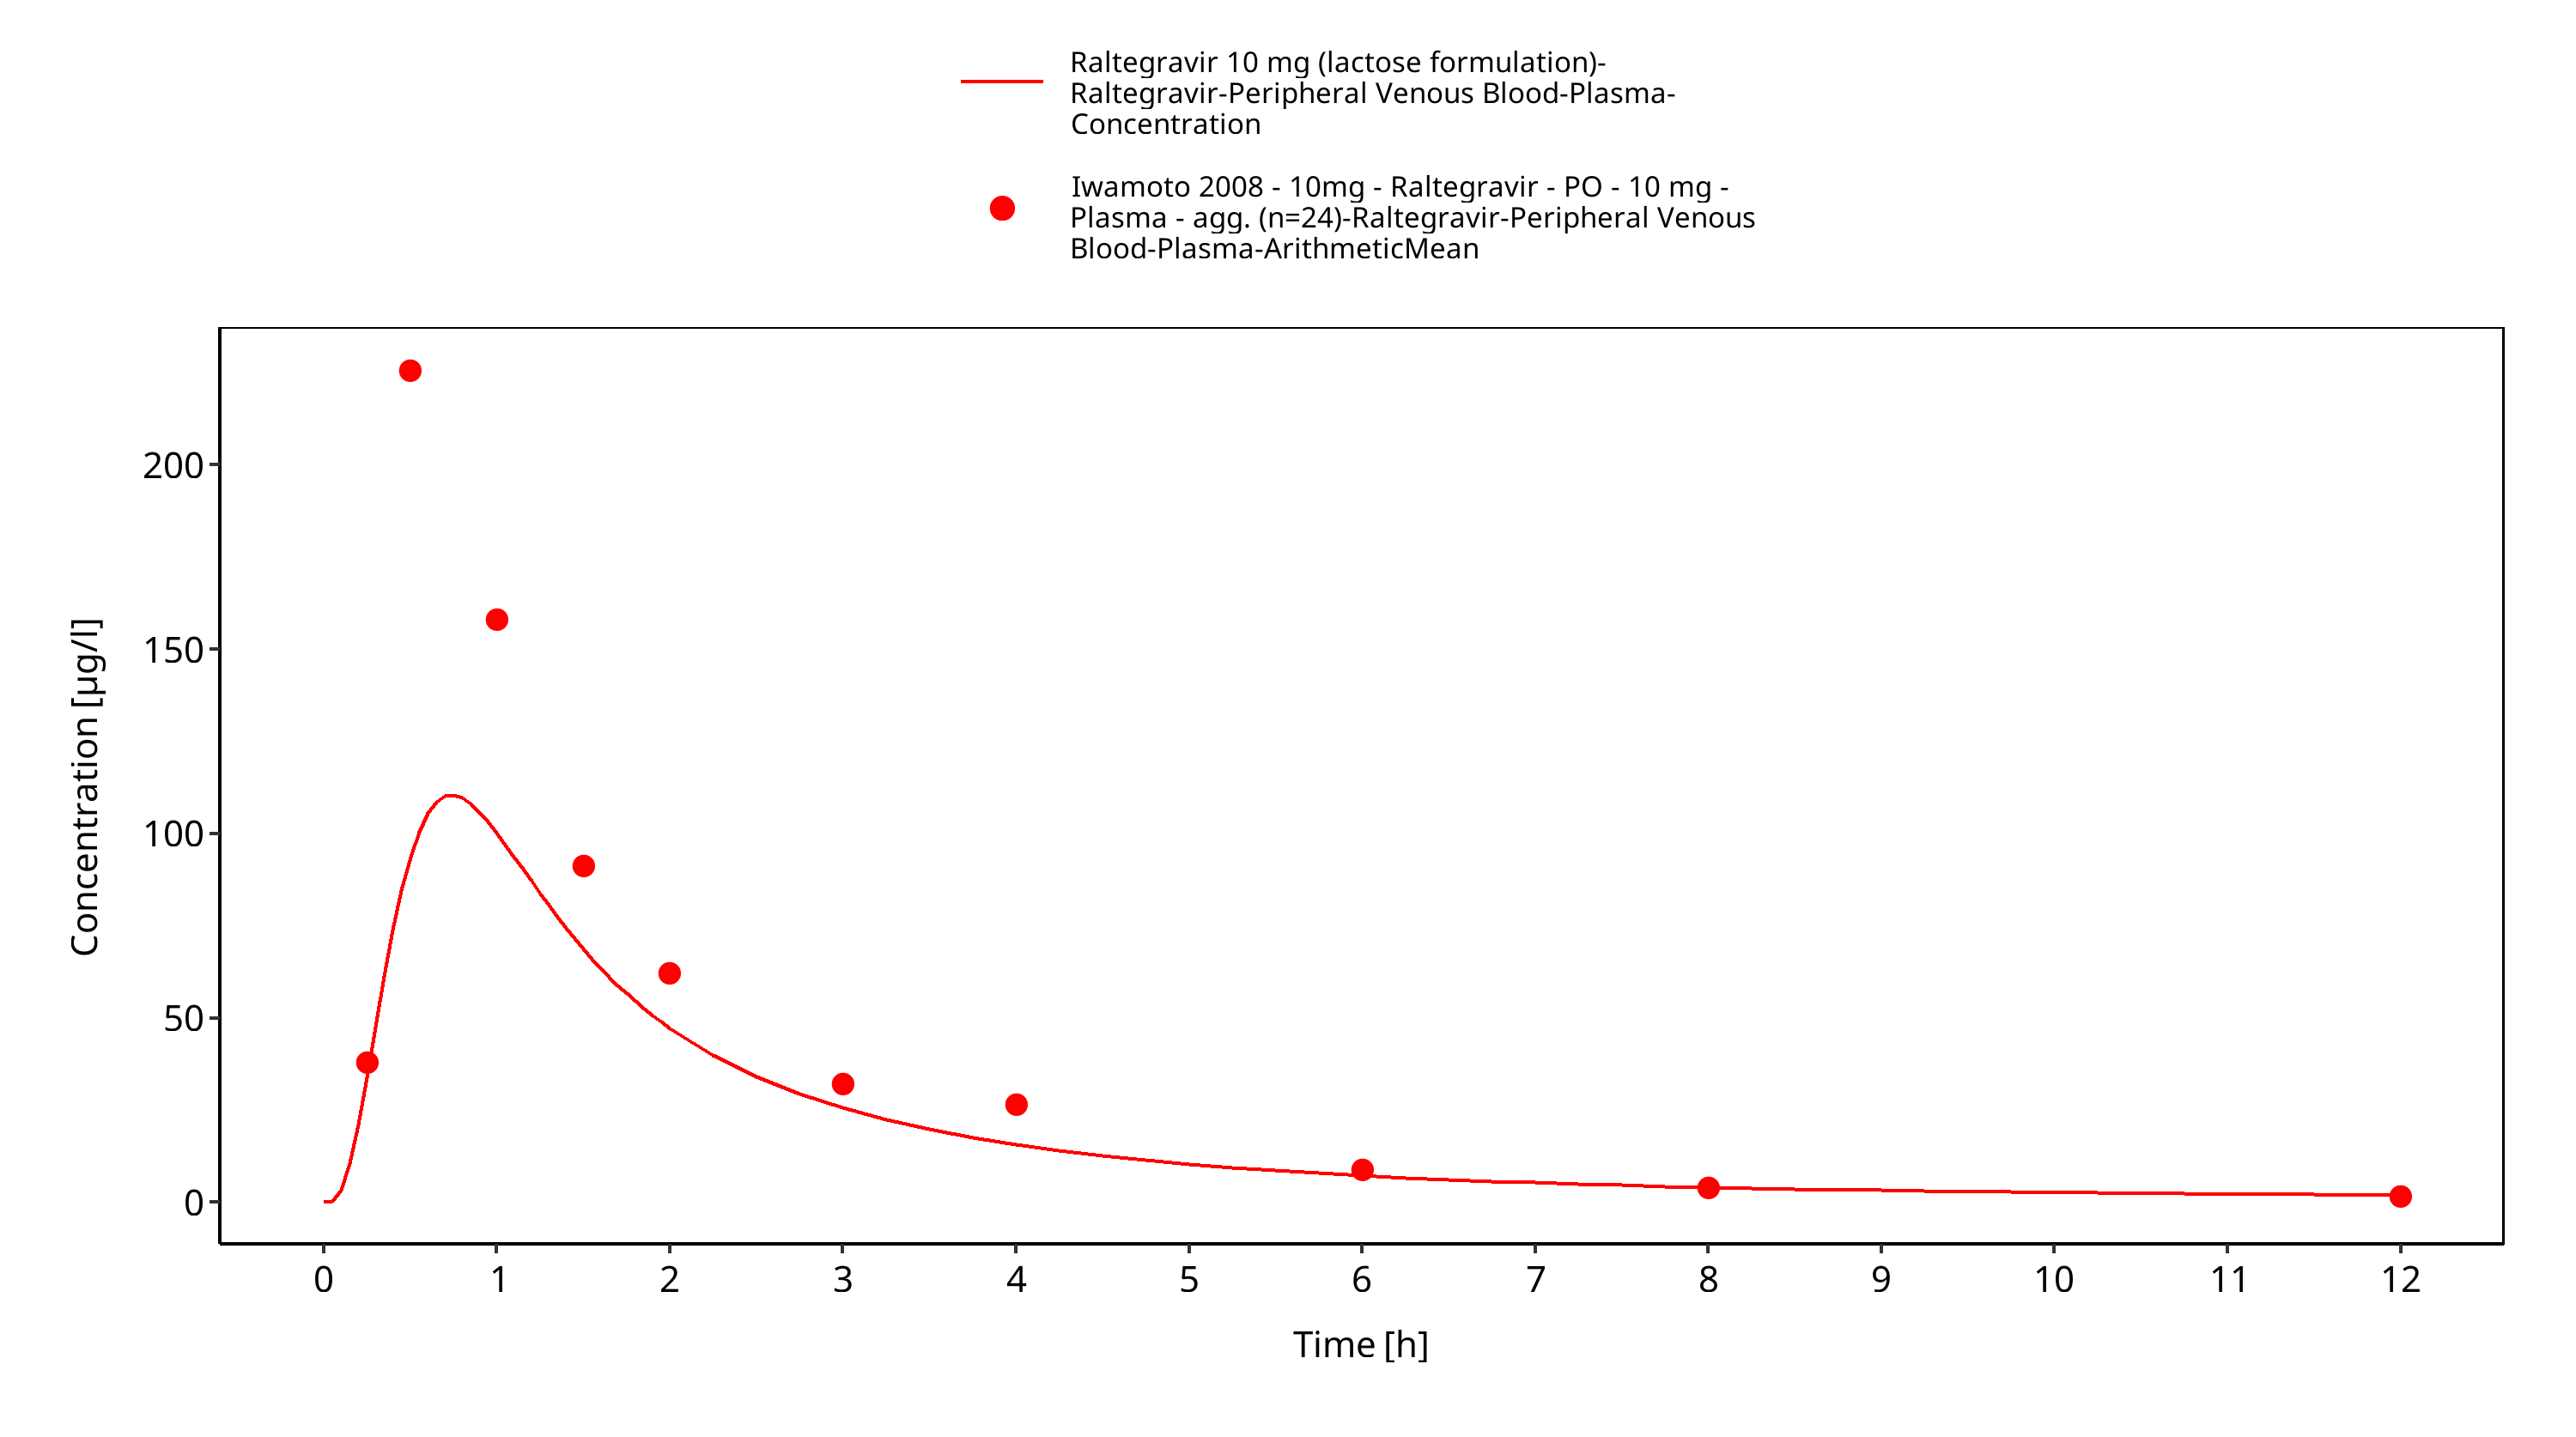
Figure 3-18: Time Profile Analysis 1
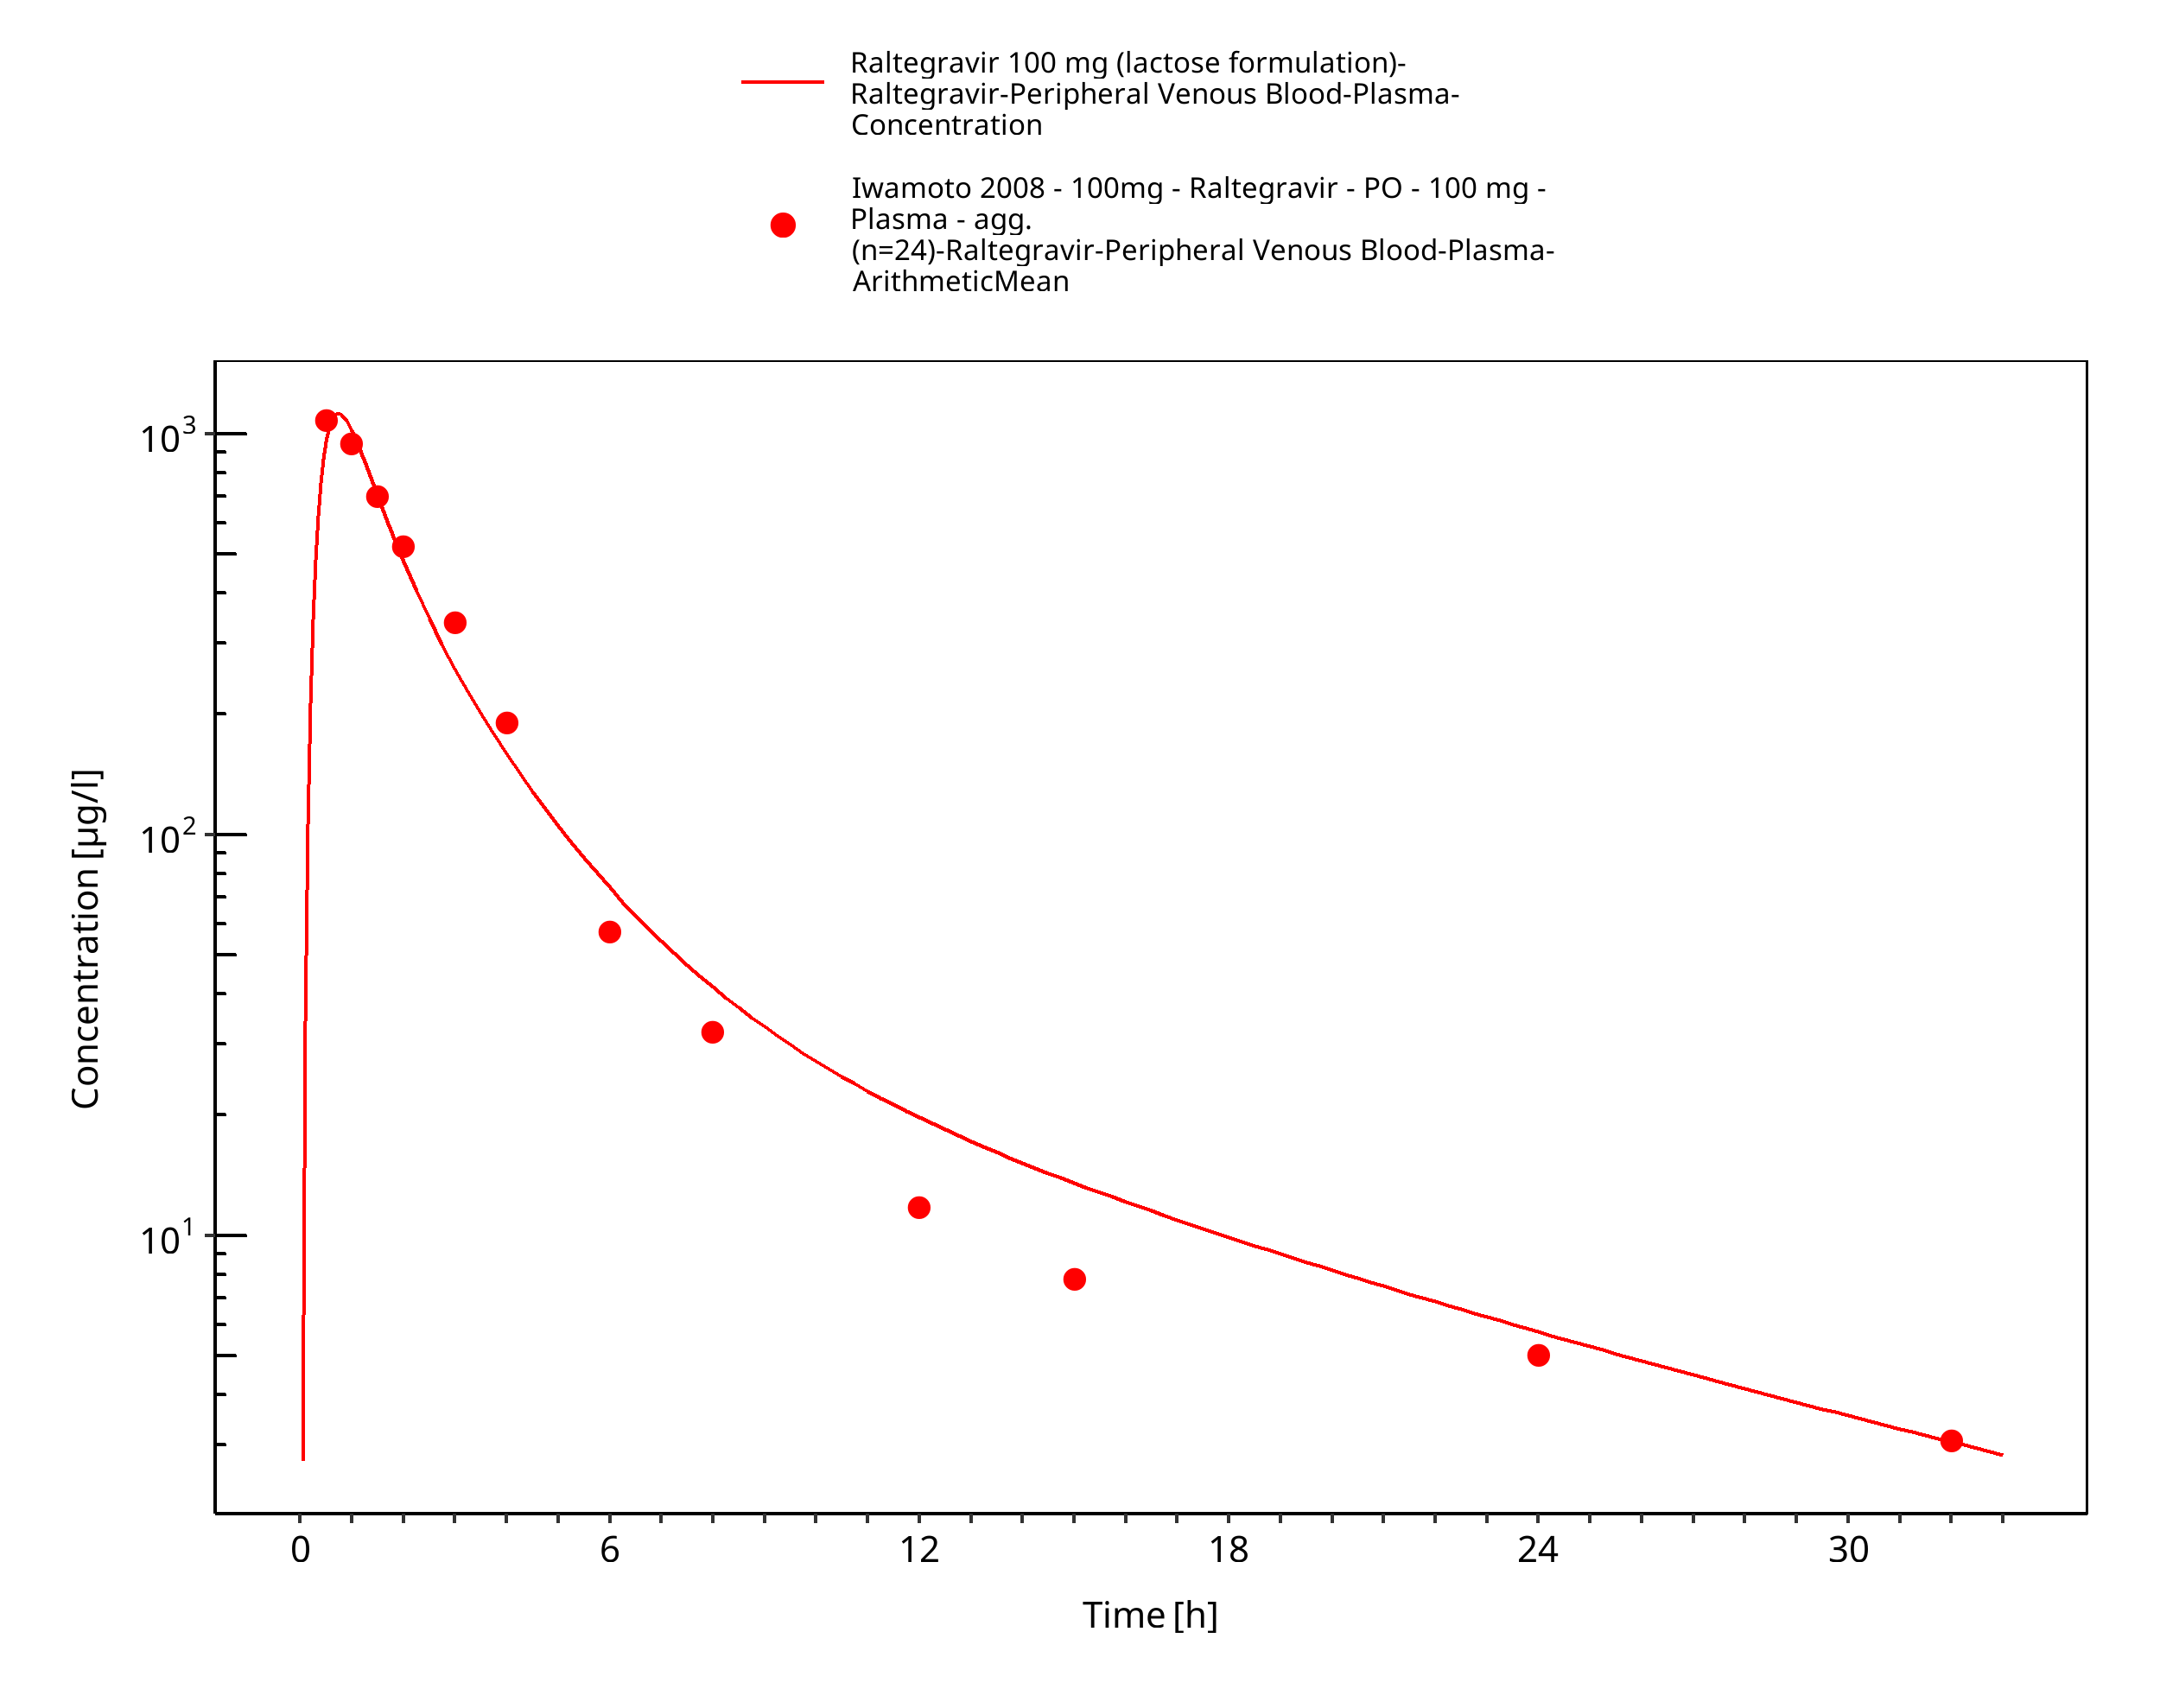
Figure 3-19: Time Profile Analysis
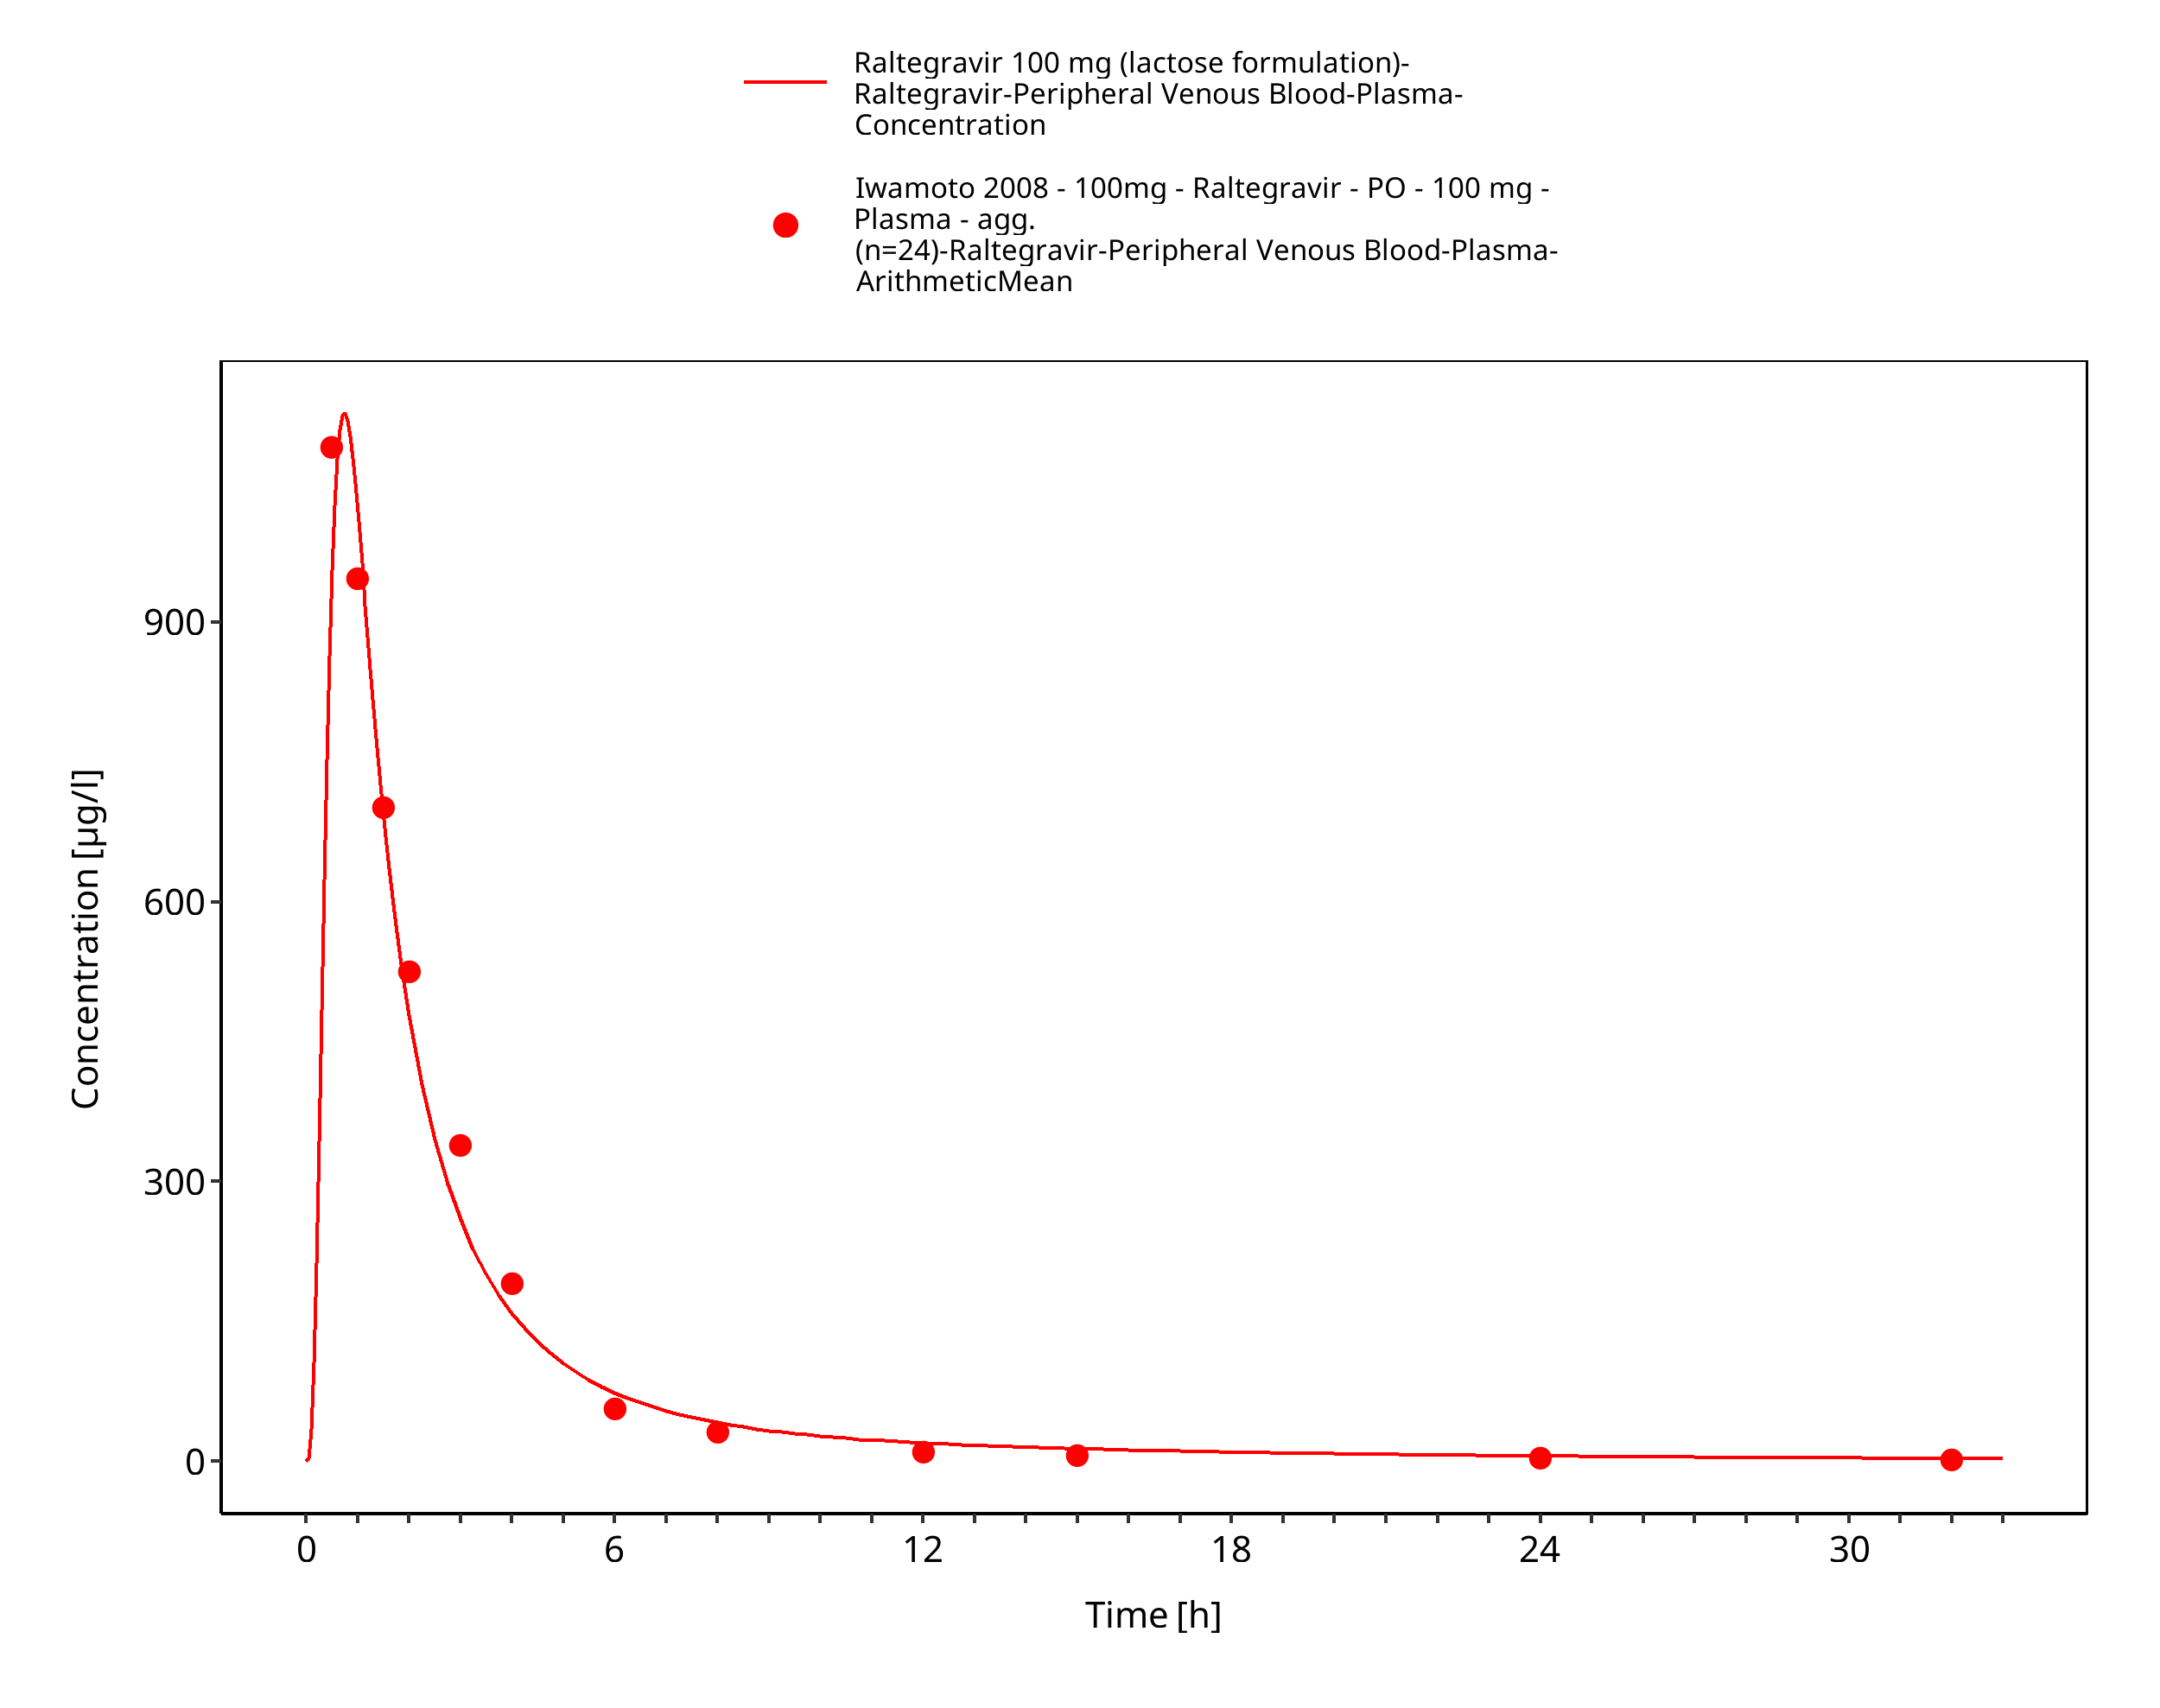
Figure 3-20: Time Profile Analysis 1
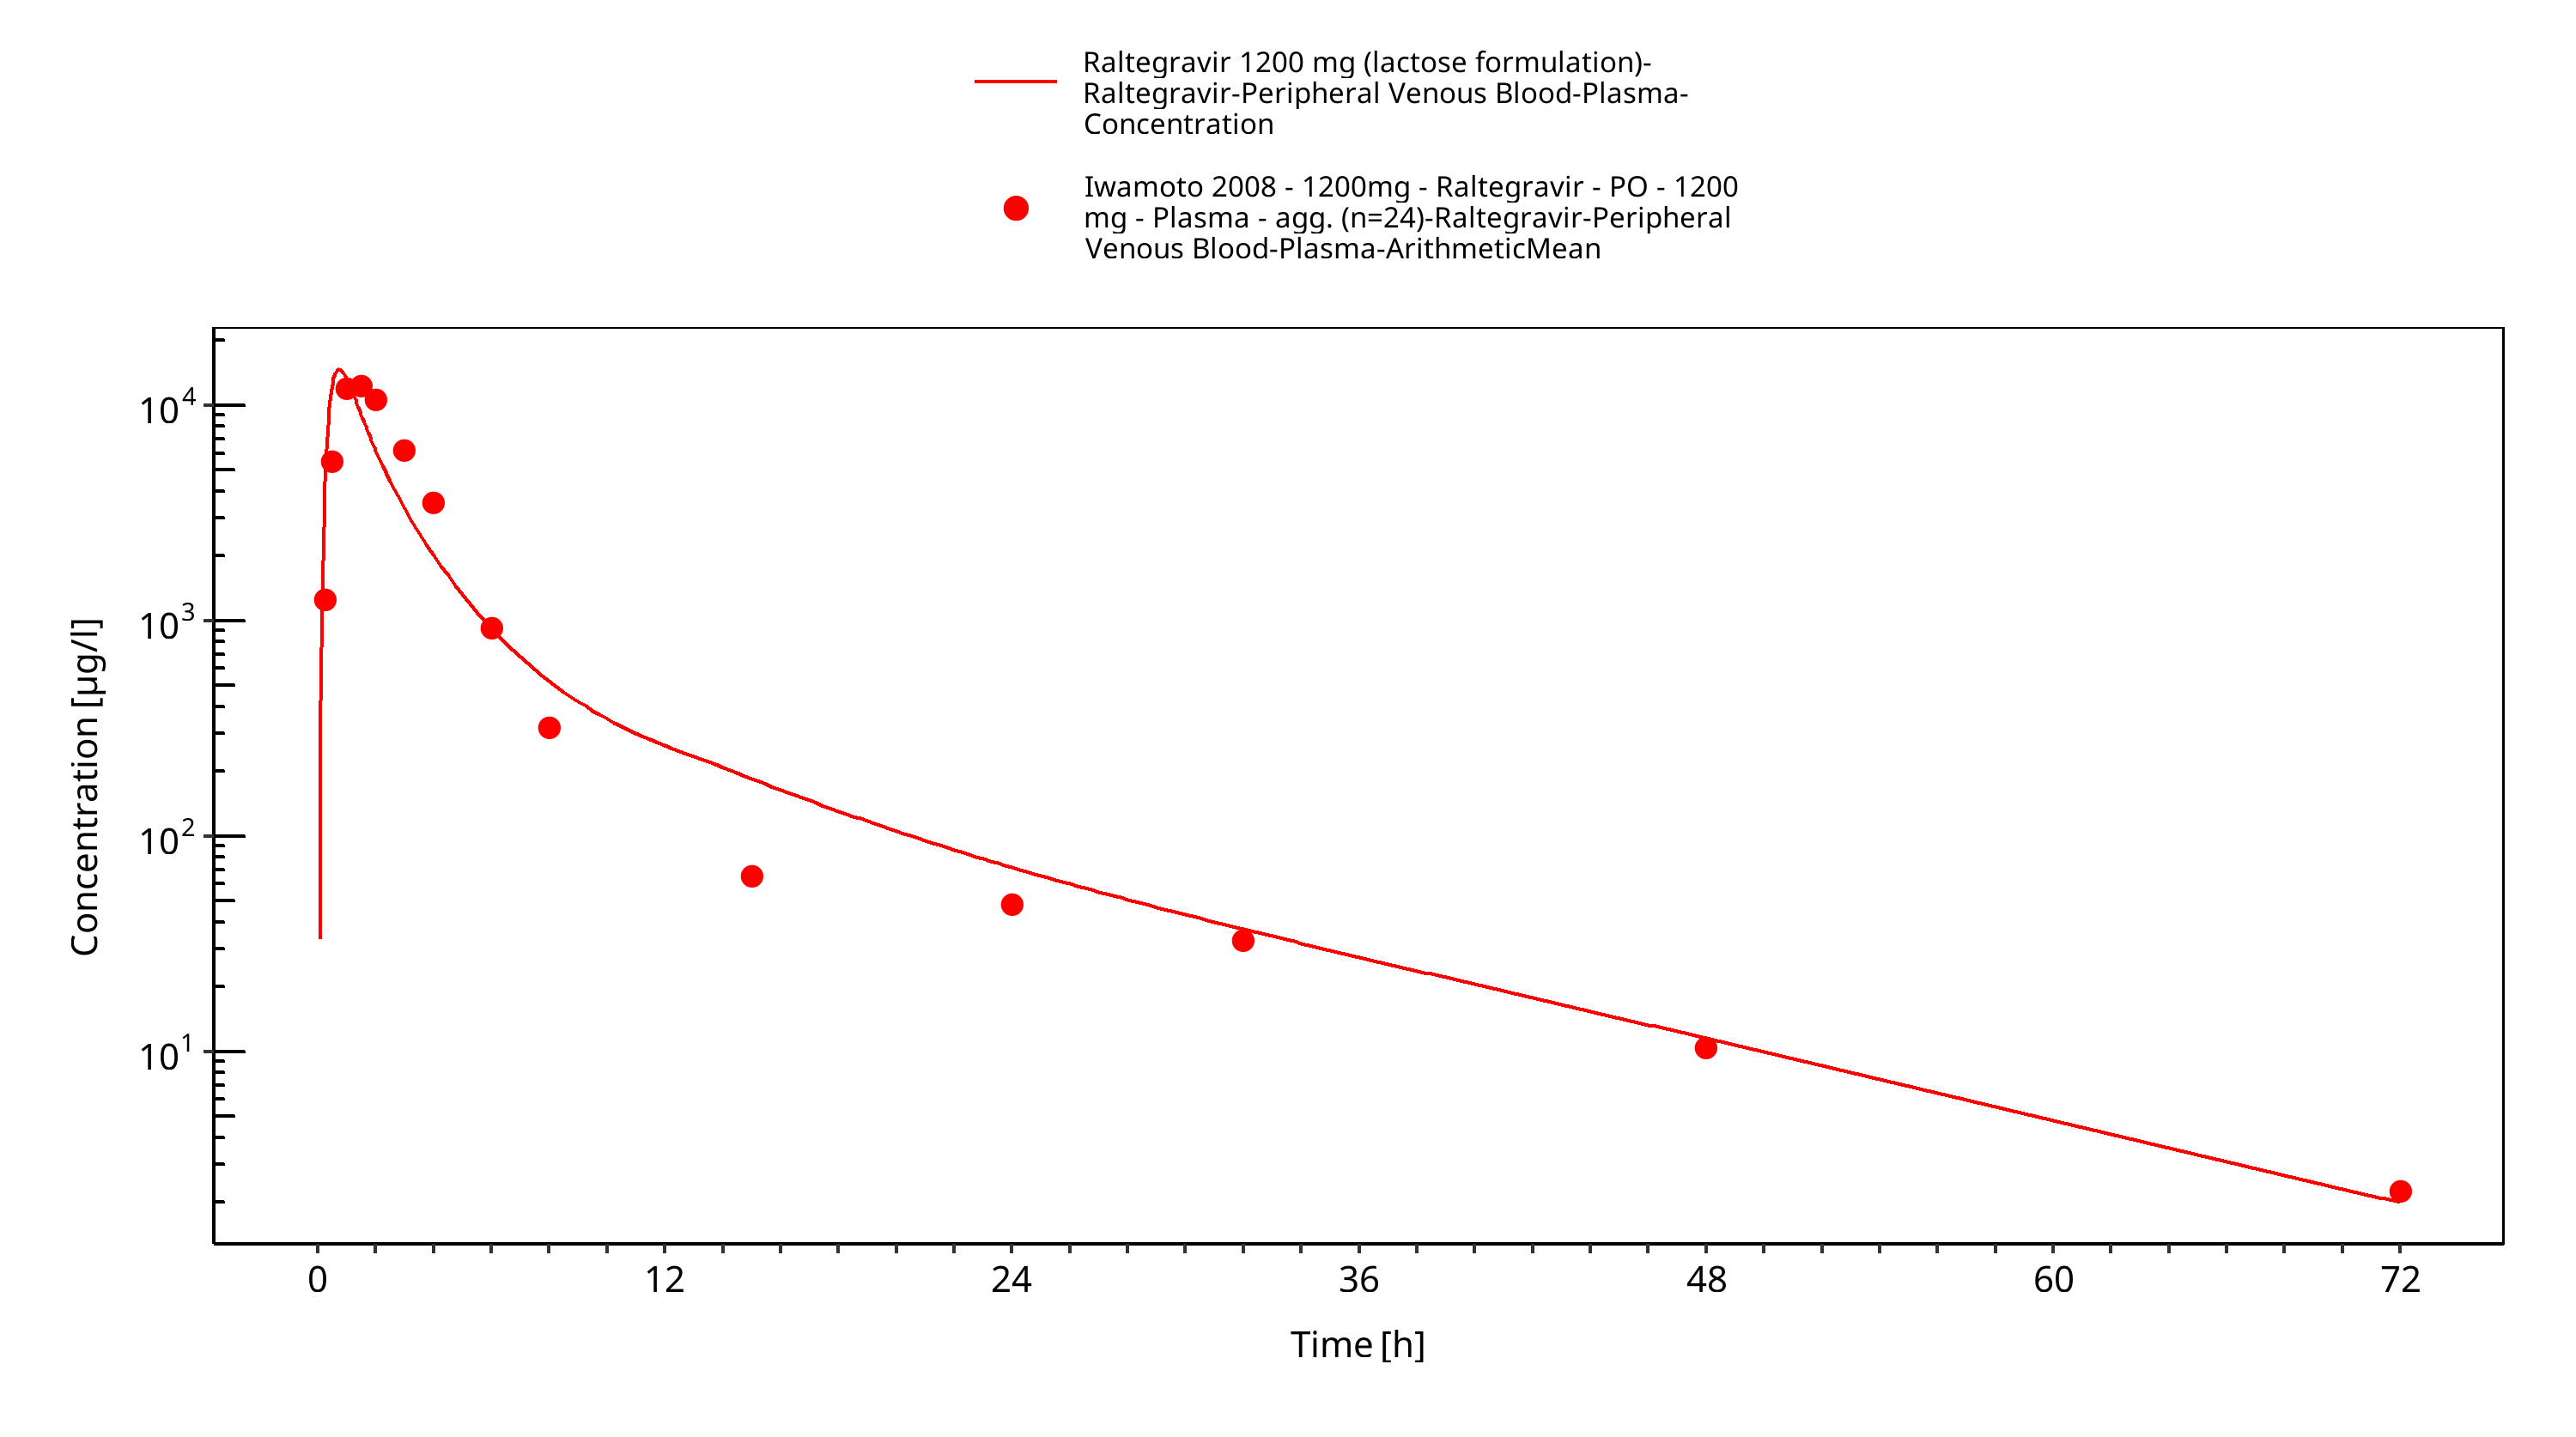
Figure 3-21: Time Profile Analysis
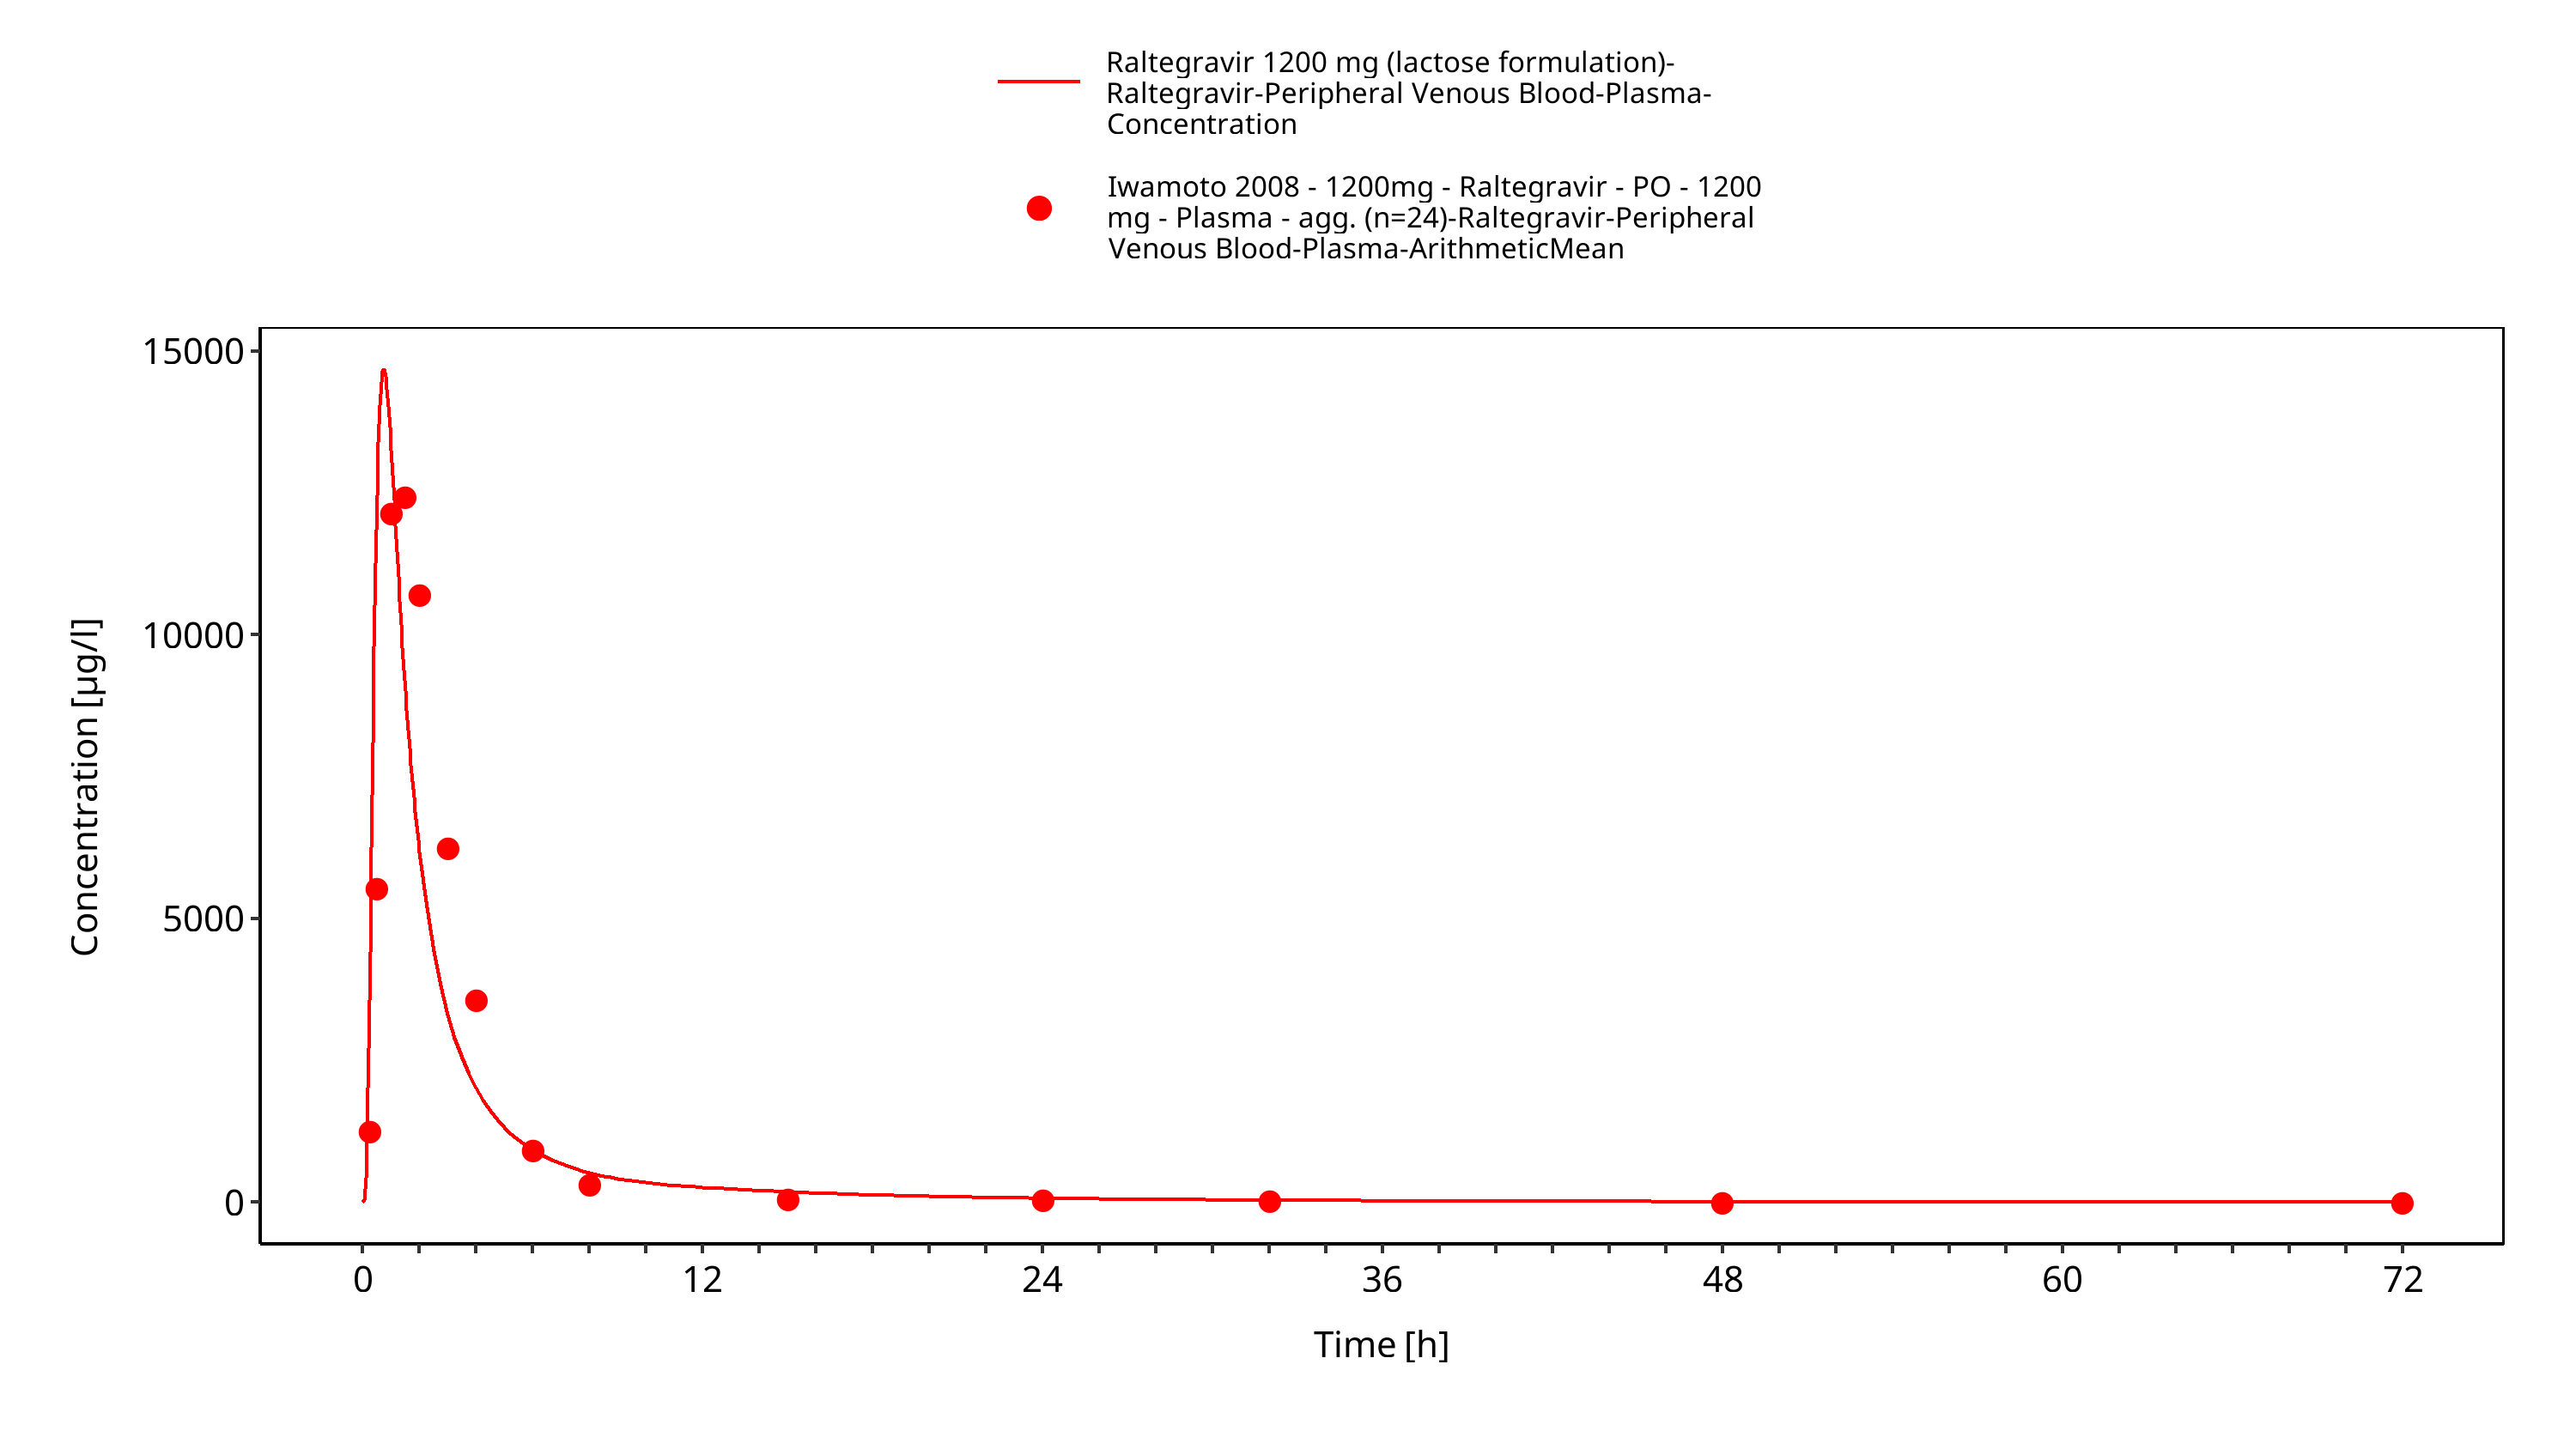
Figure 3-22: Time Profile Analysis 1
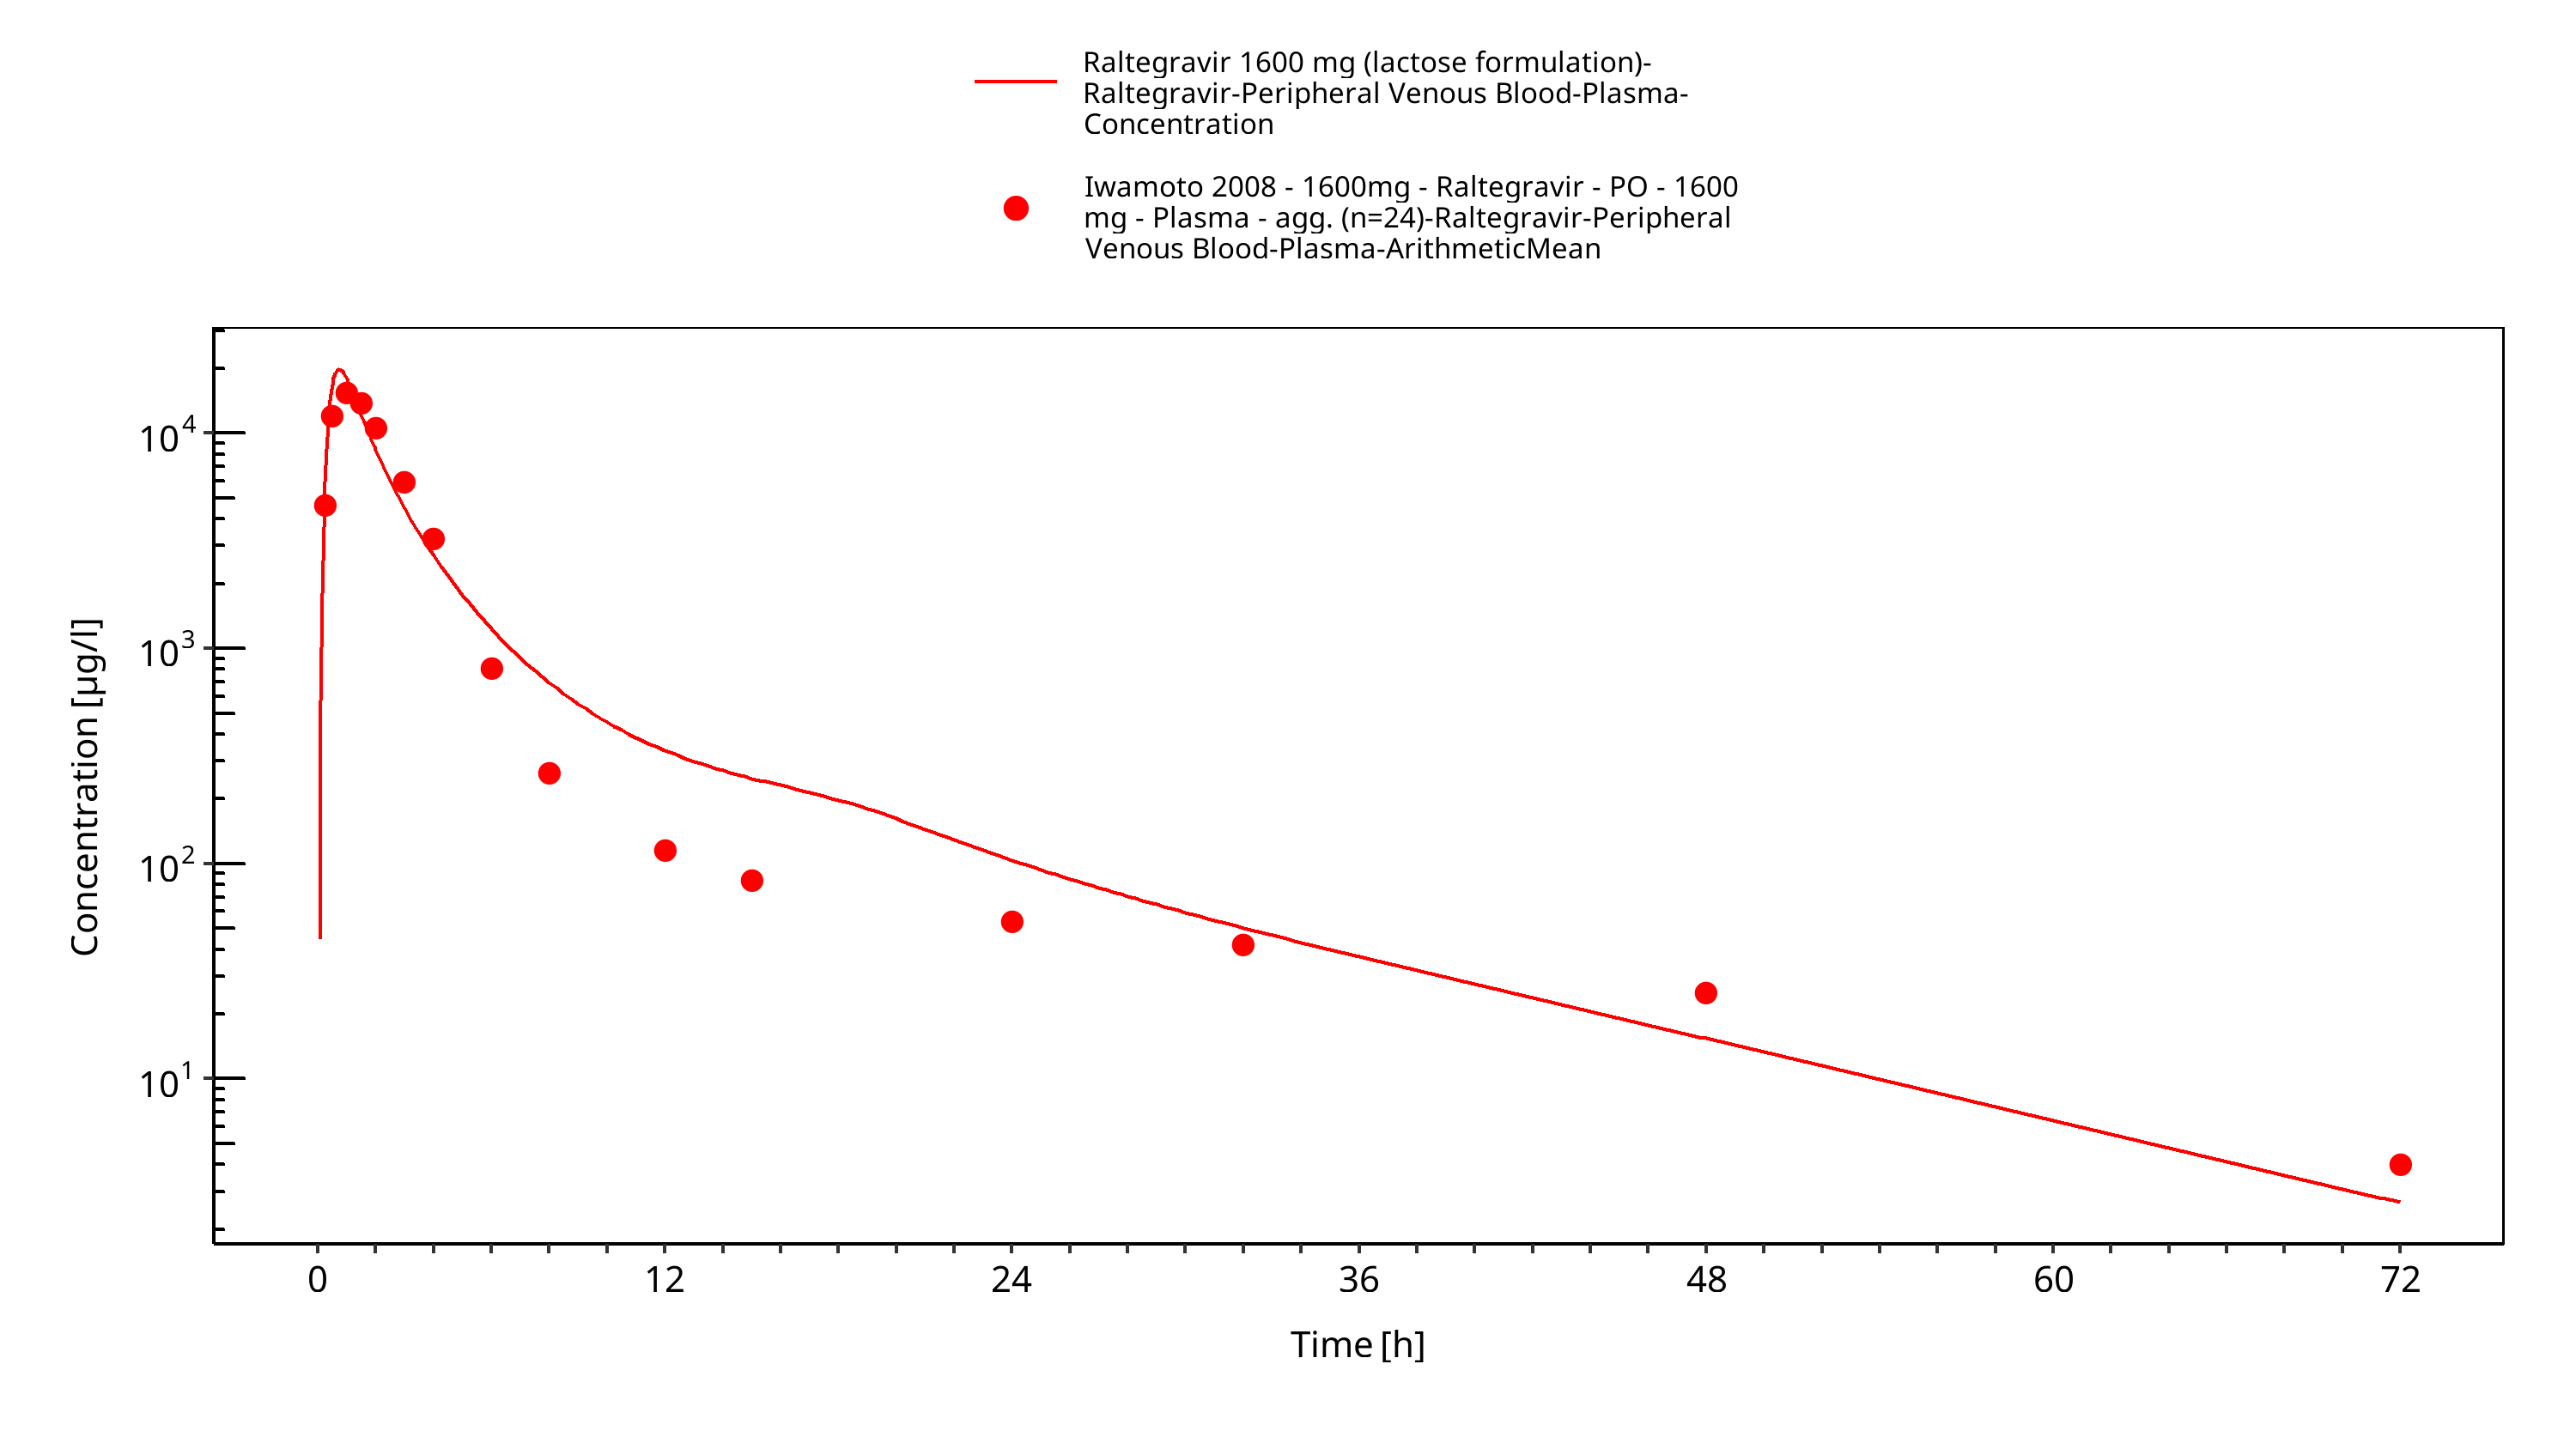
Figure 3-23: Time Profile Analysis
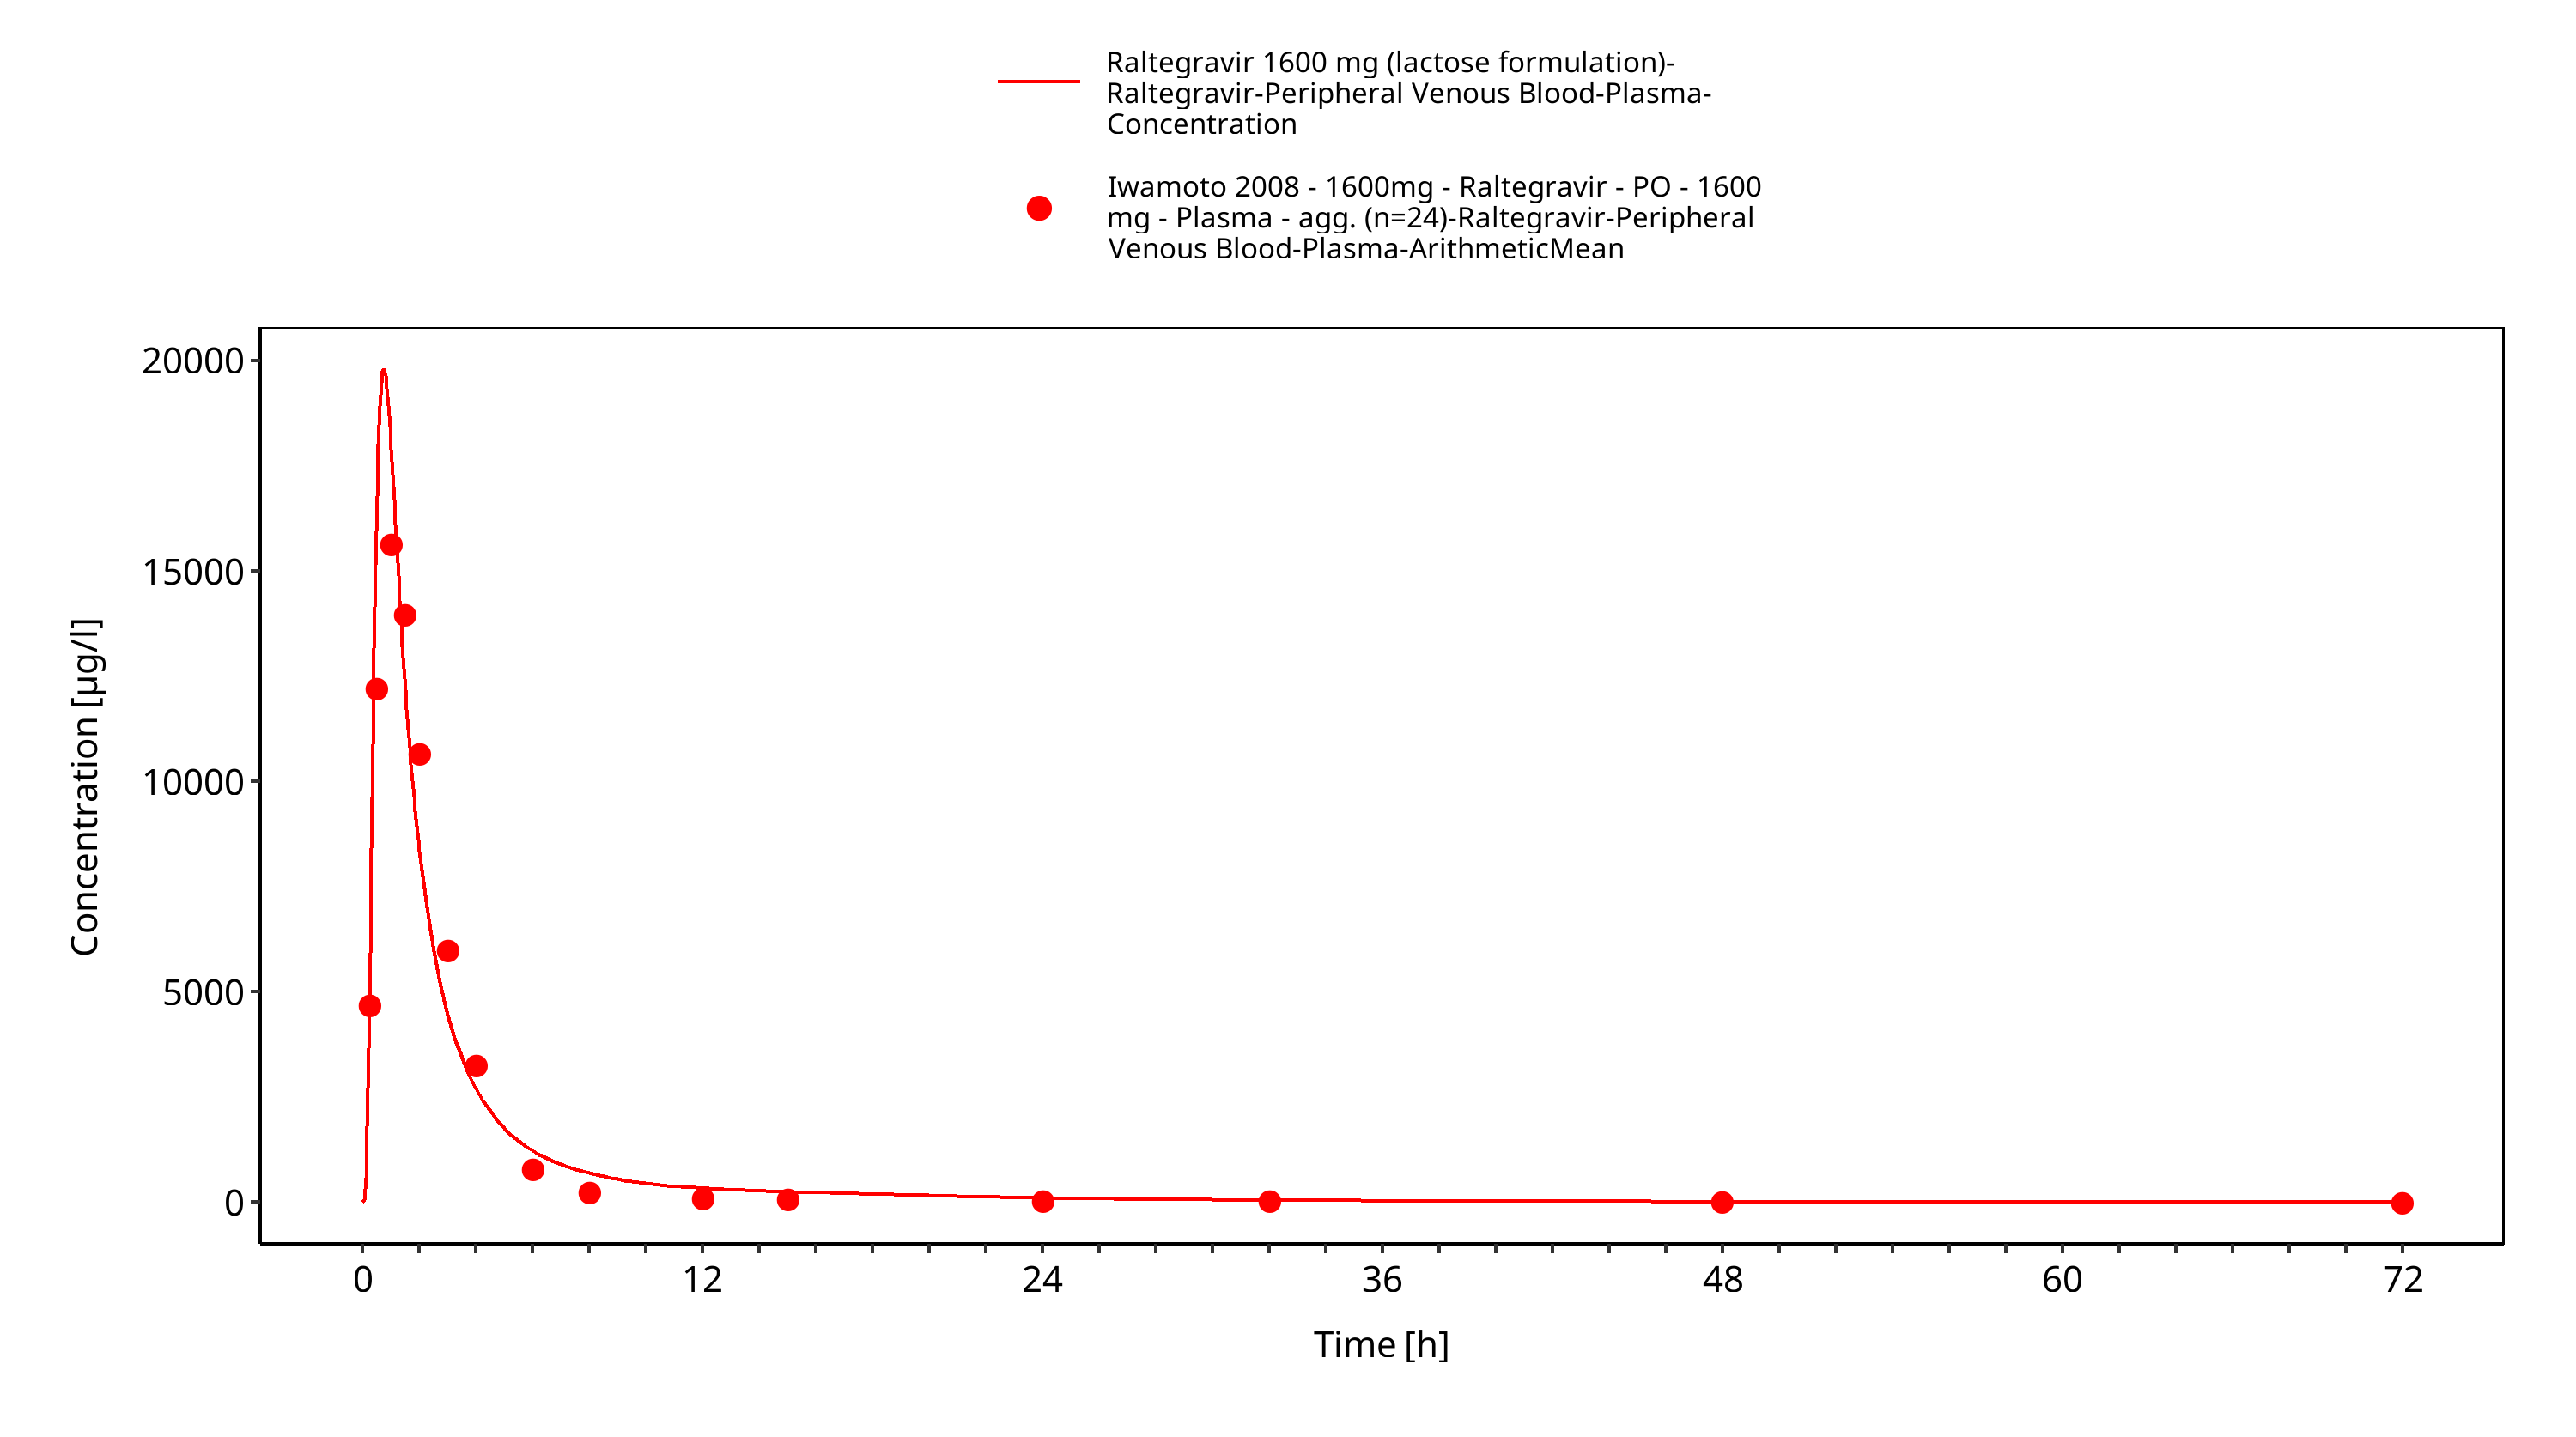
Figure 3-24: Time Profile Analysis 1
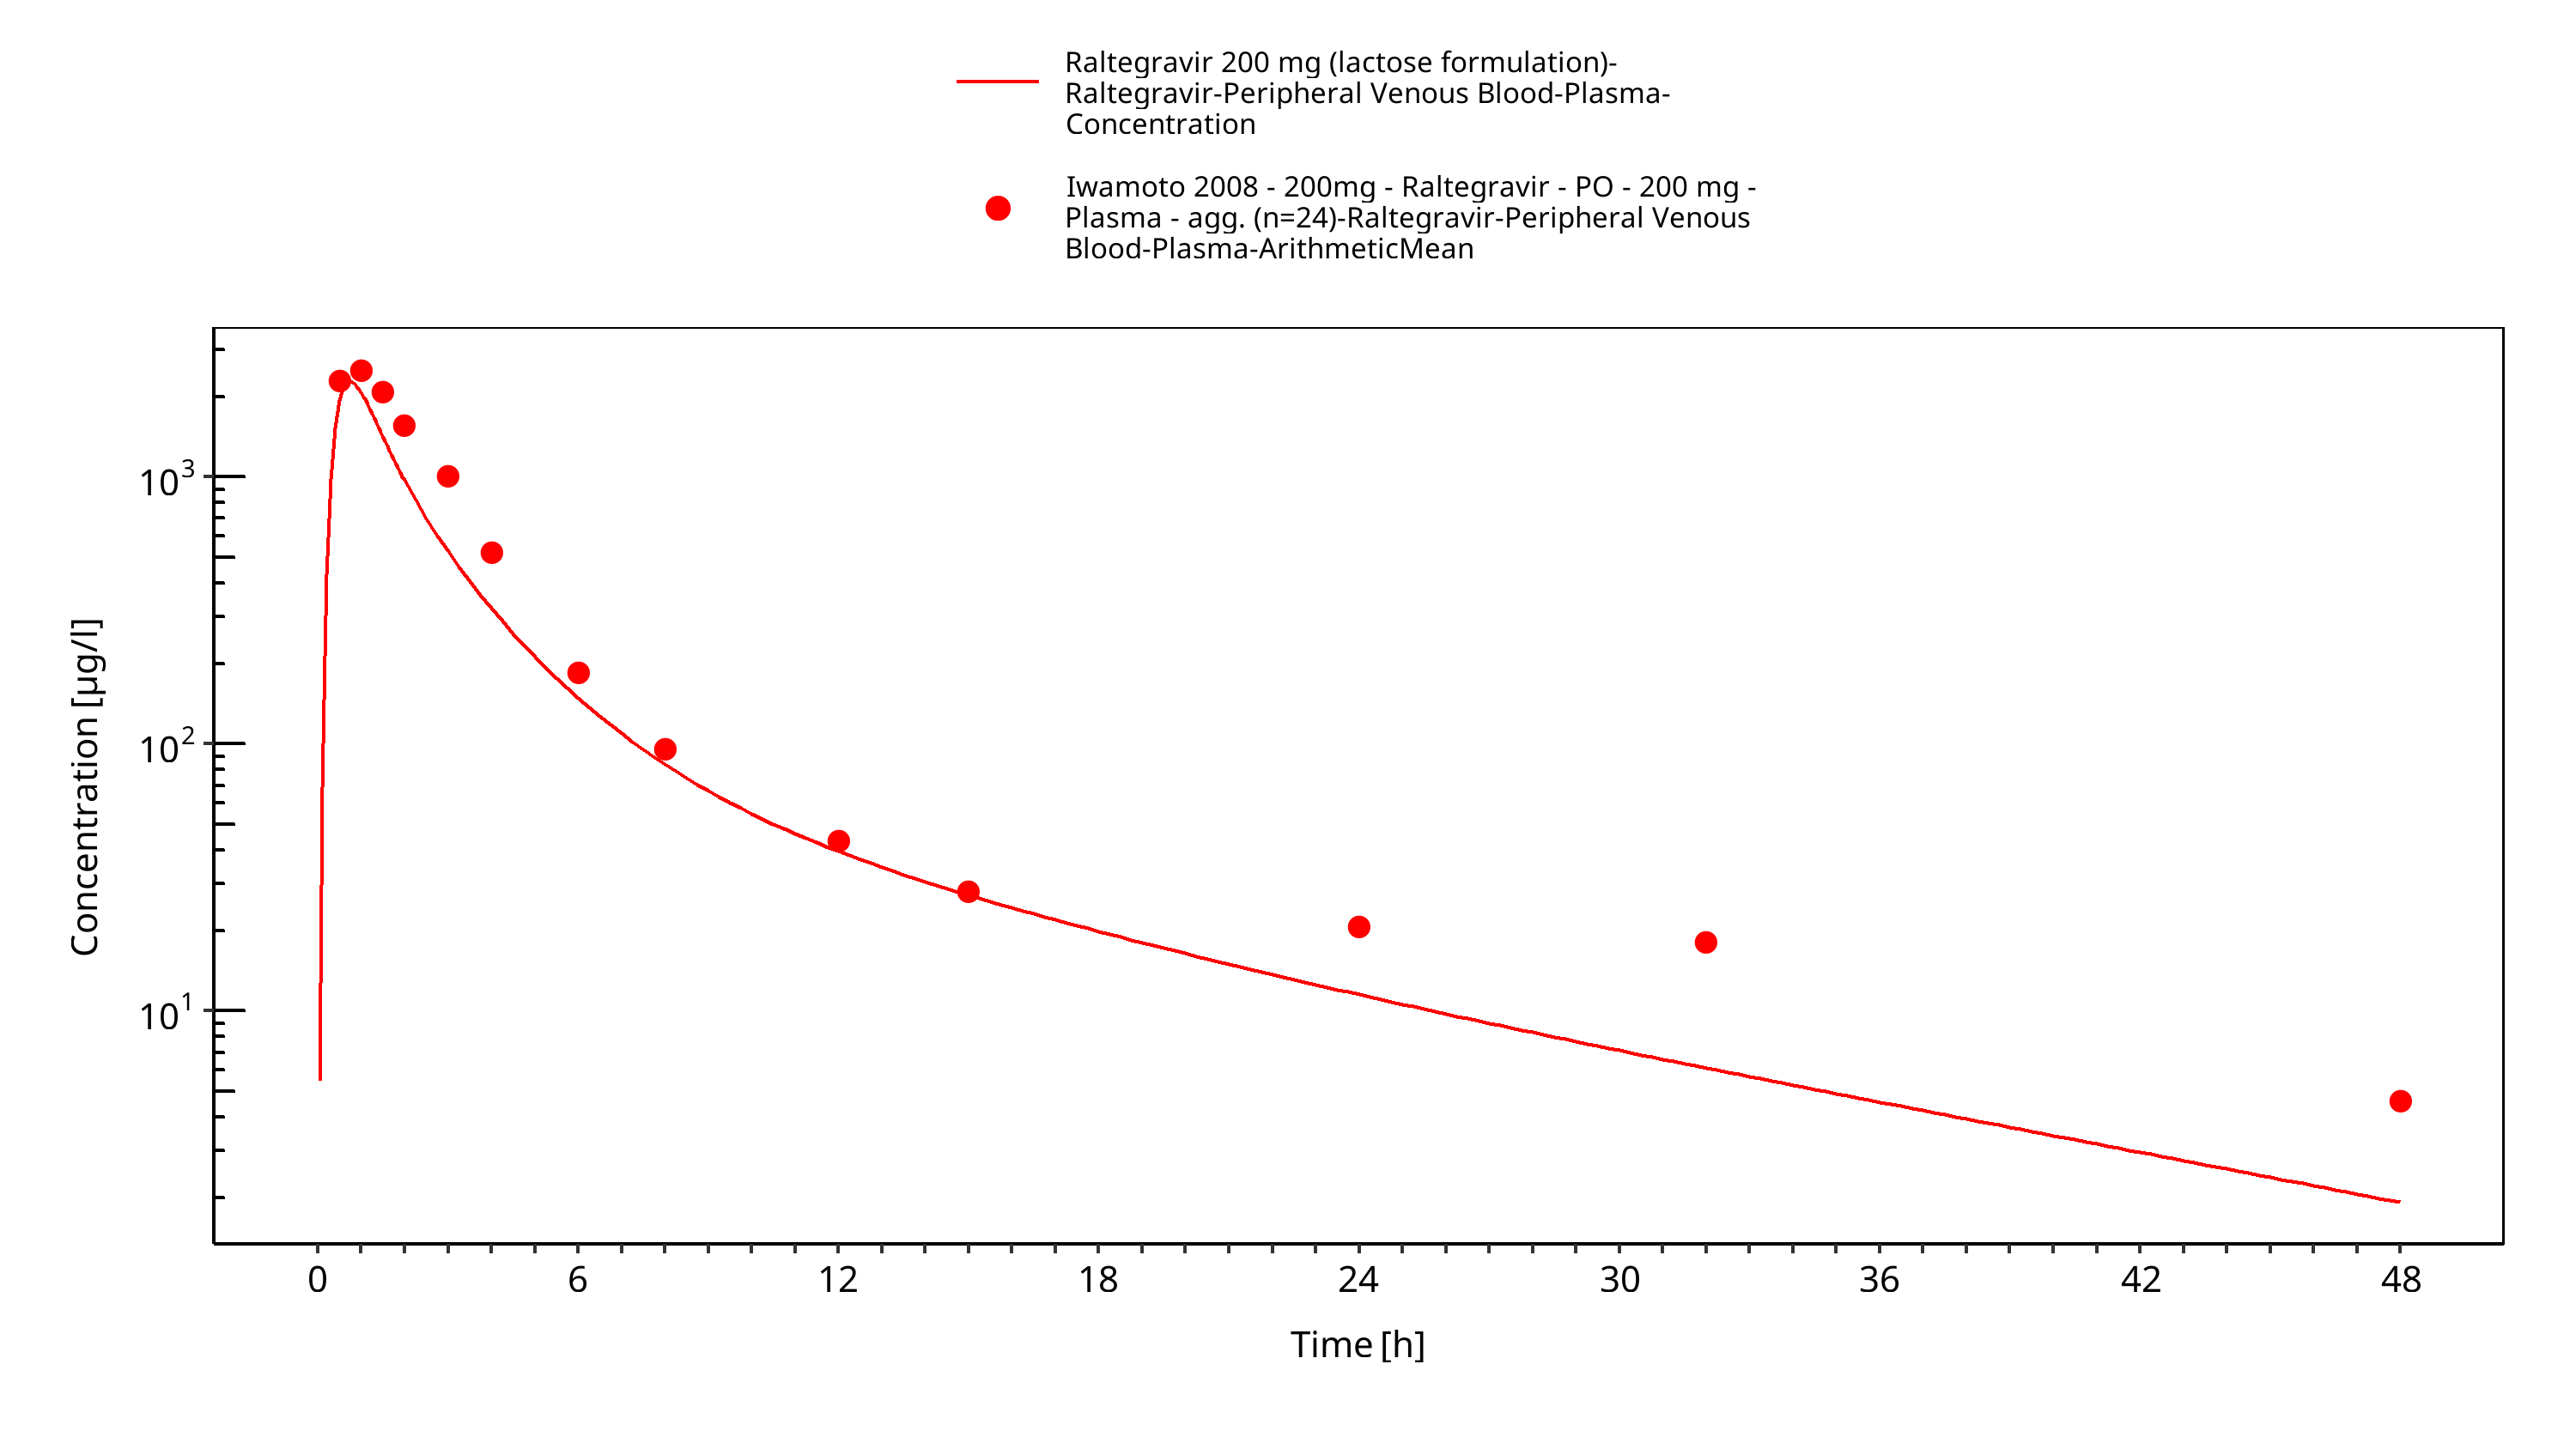
Figure 3-25: Time Profile Analysis
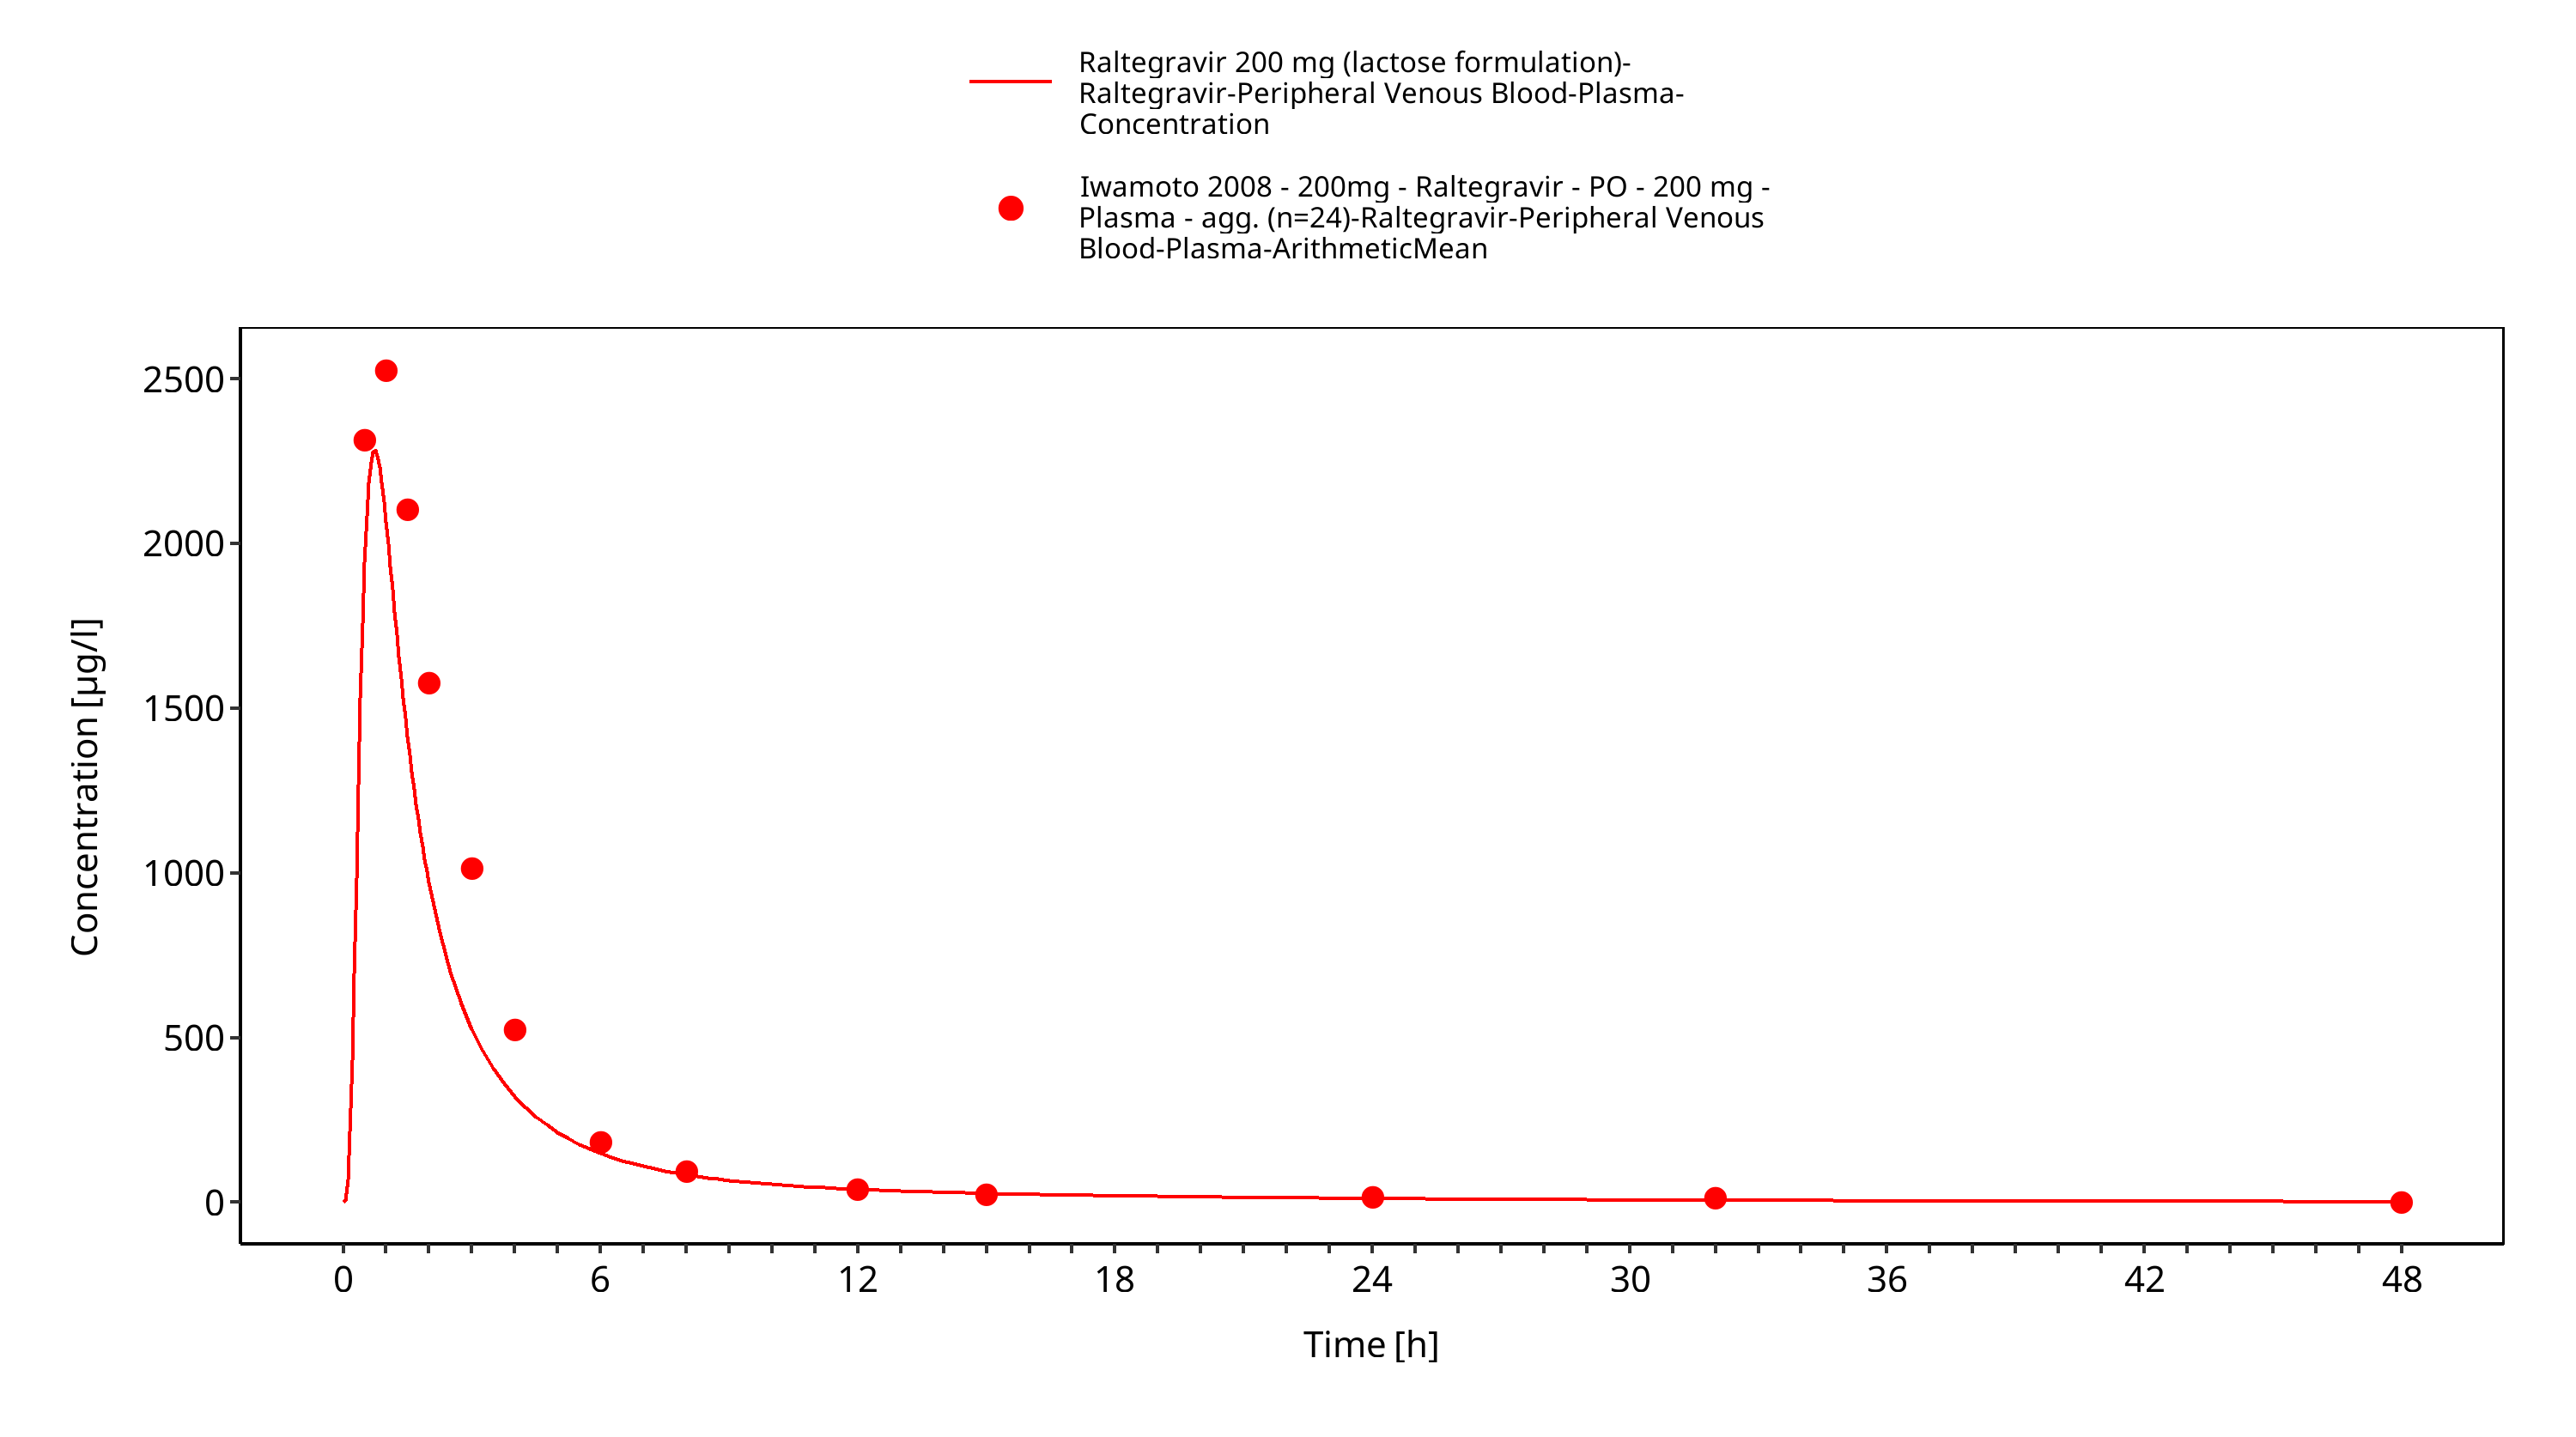
Figure 3-26: Time Profile Analysis 1
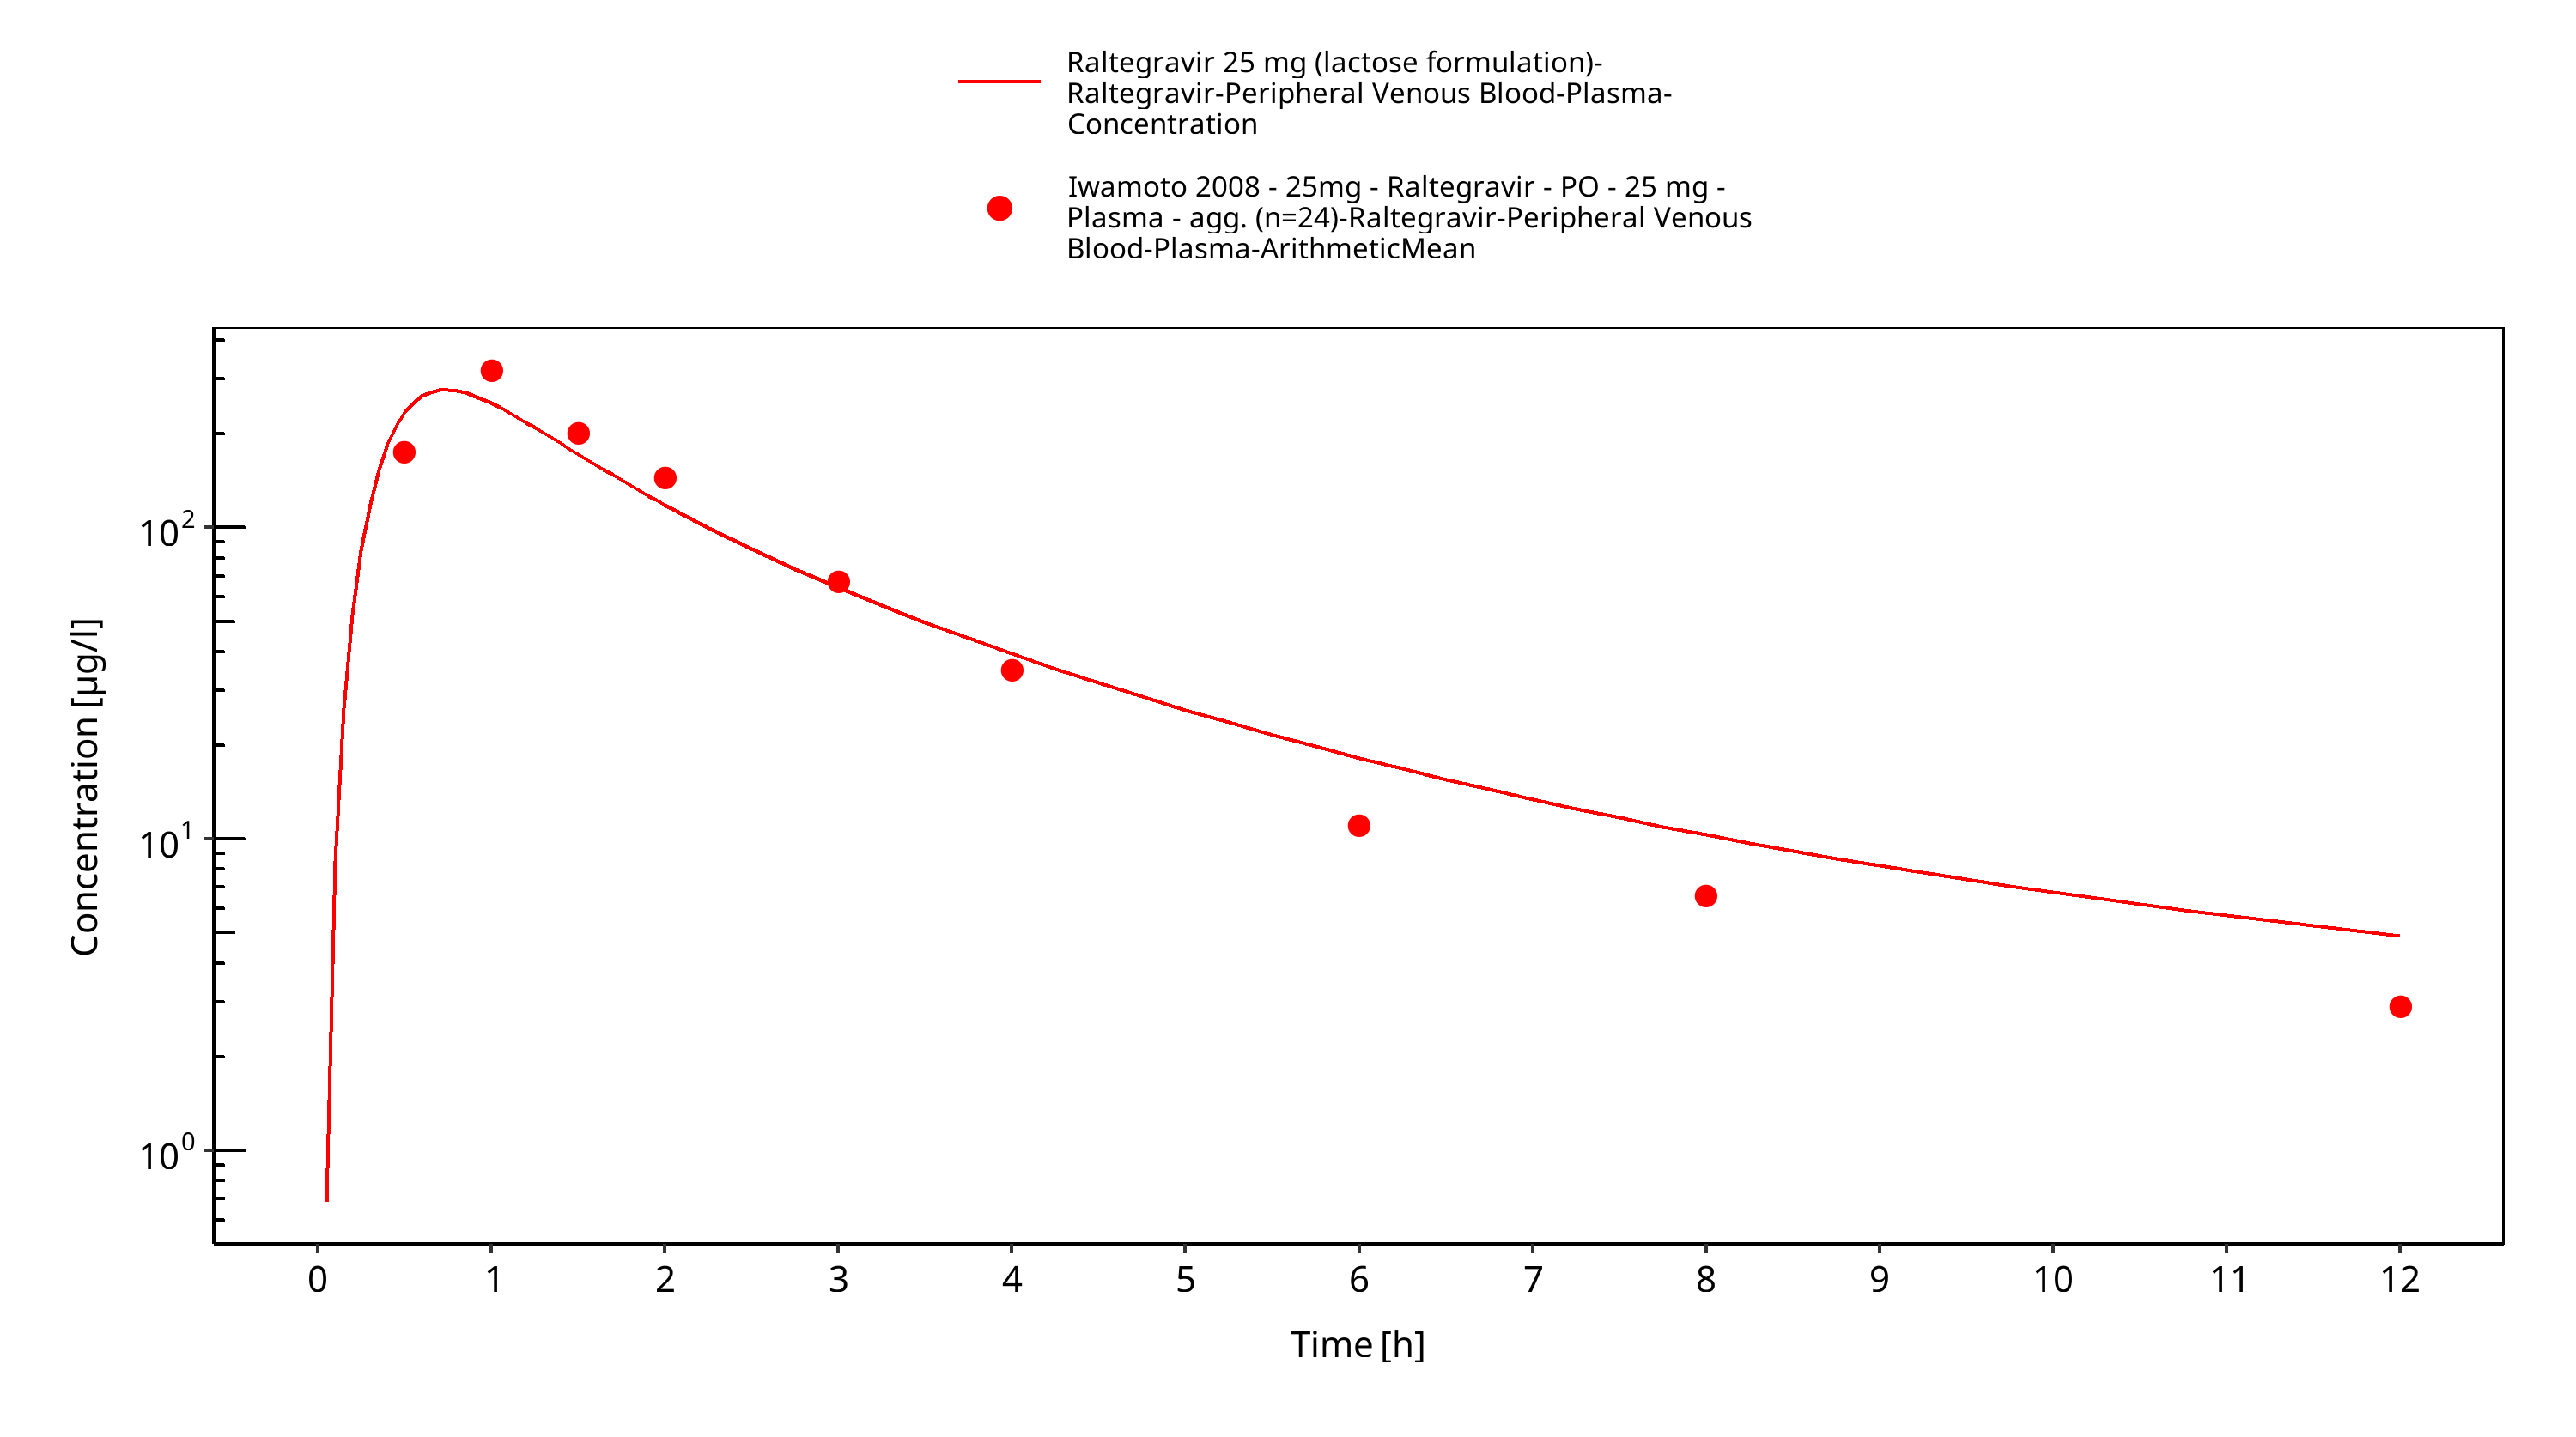
Figure 3-27: Time Profile Analysis
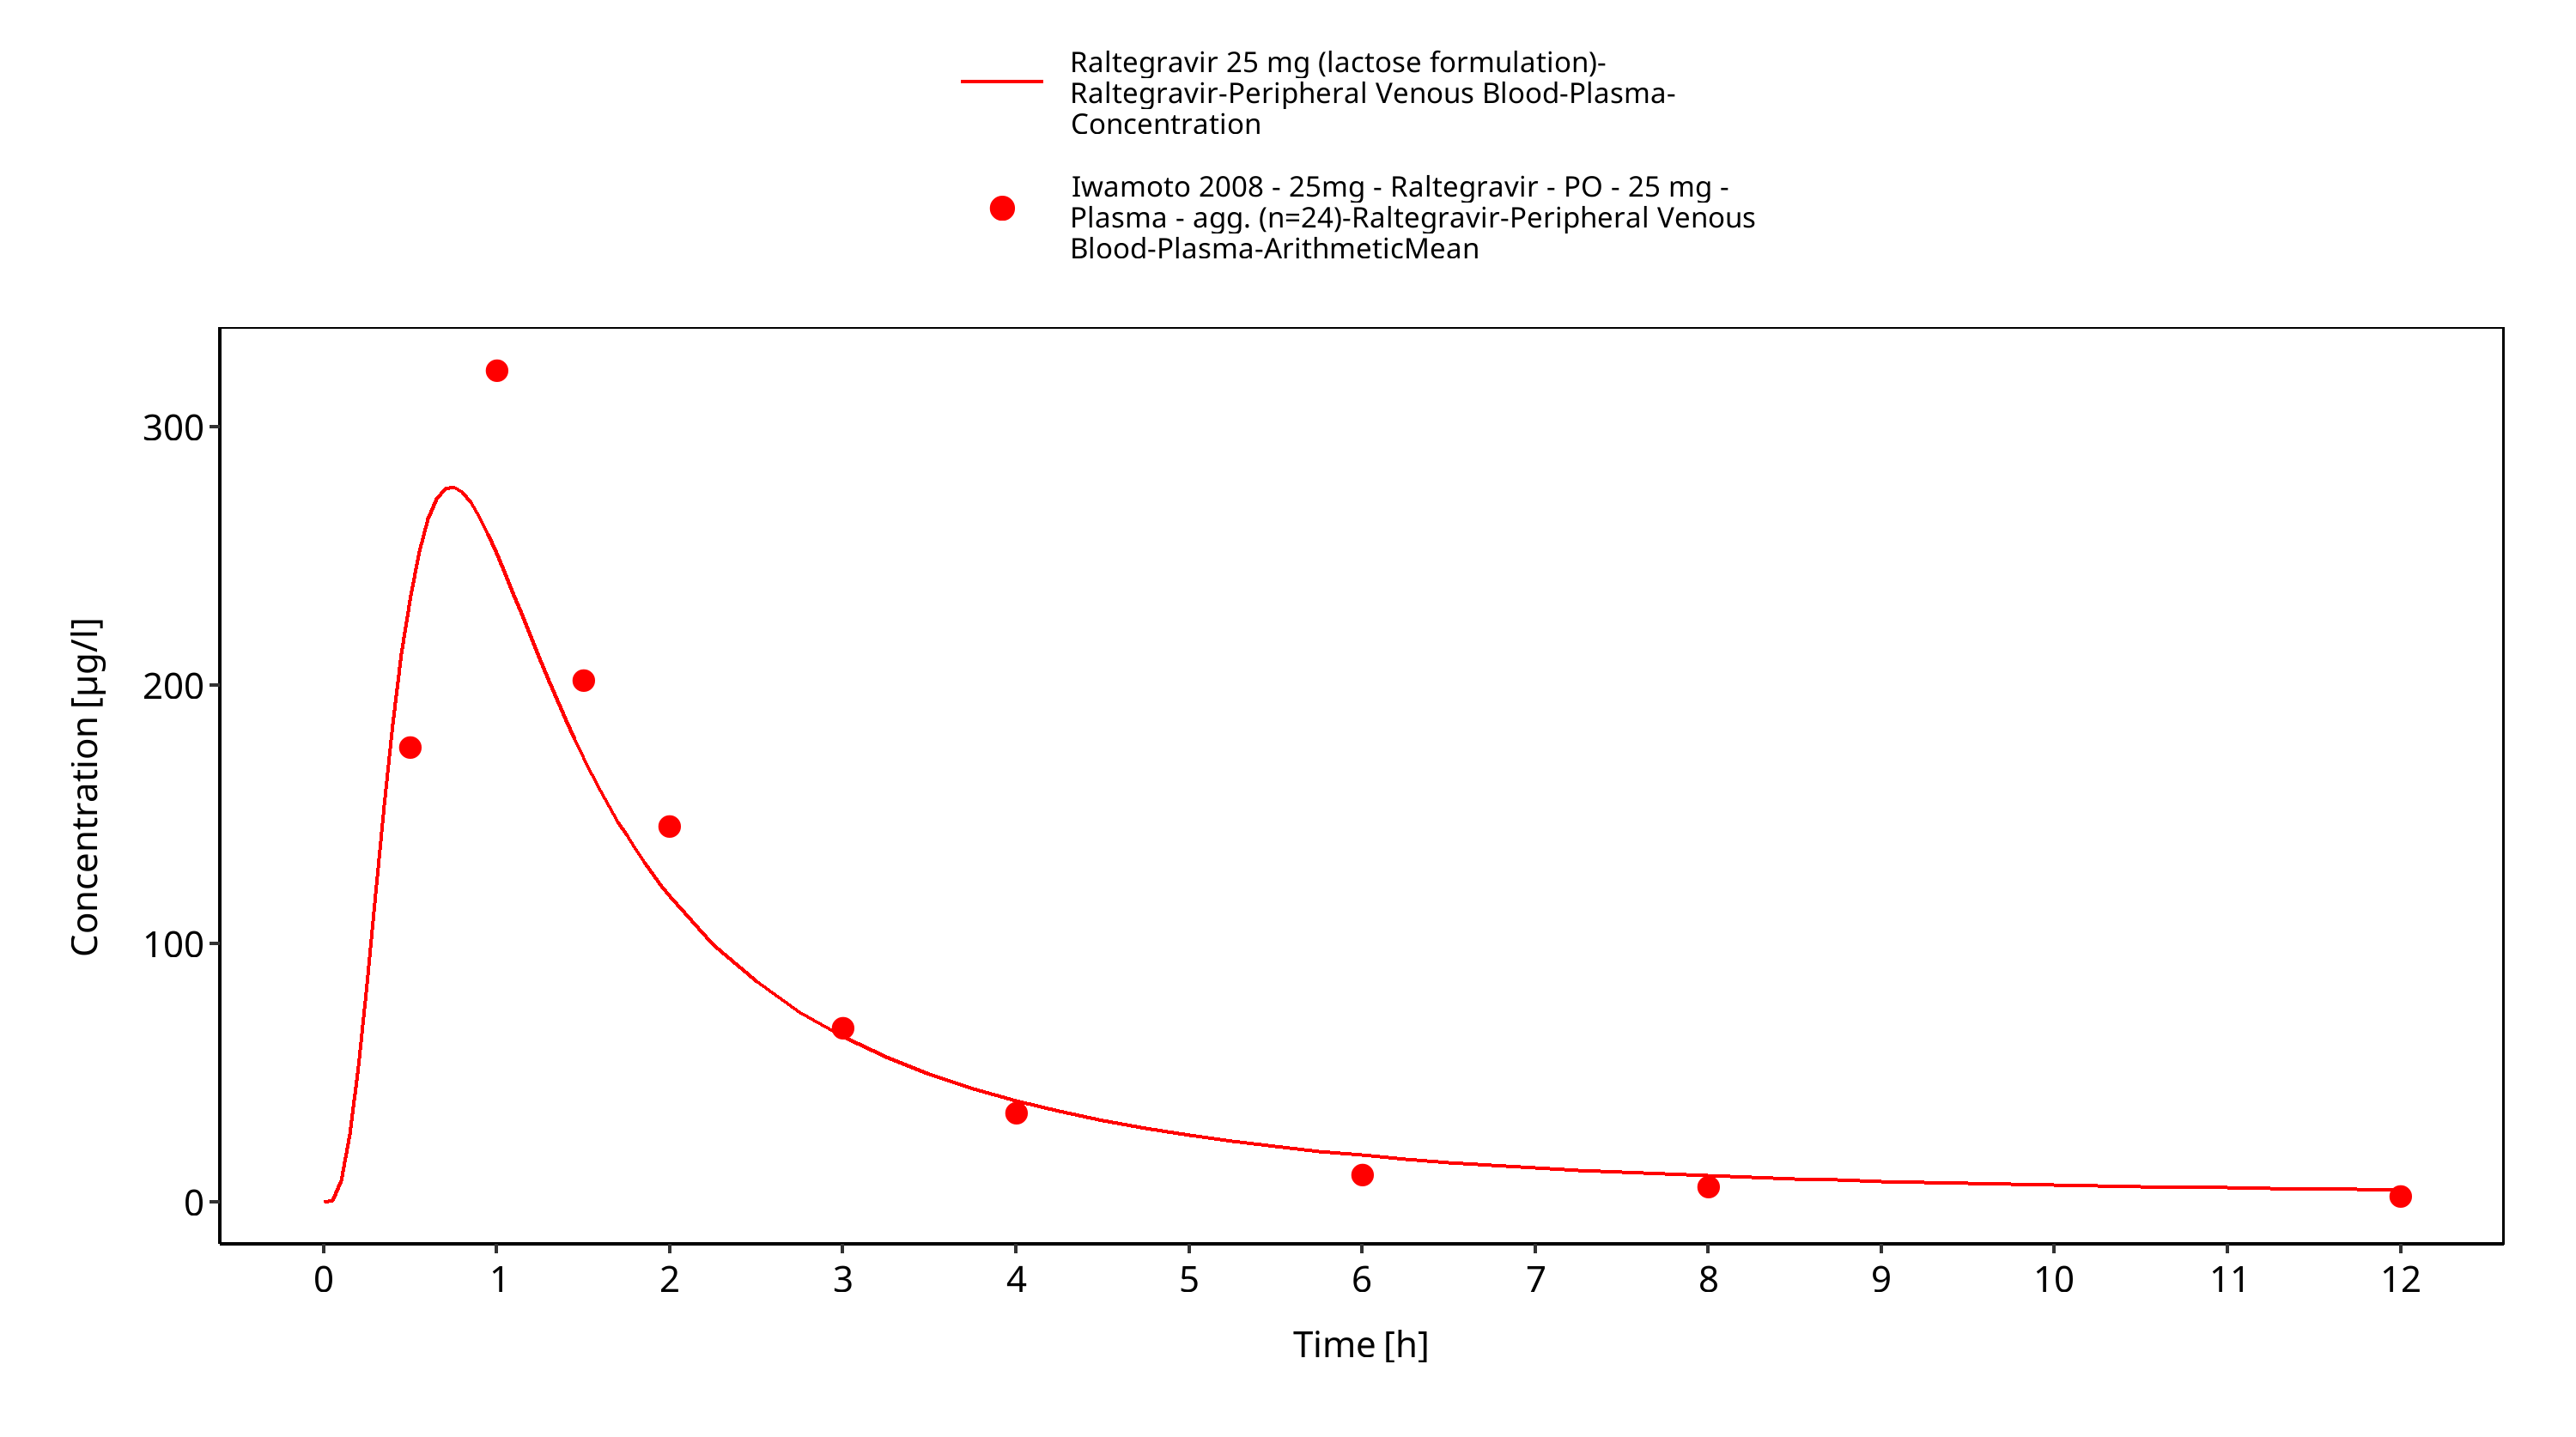
Figure 3-28: Time Profile Analysis 1
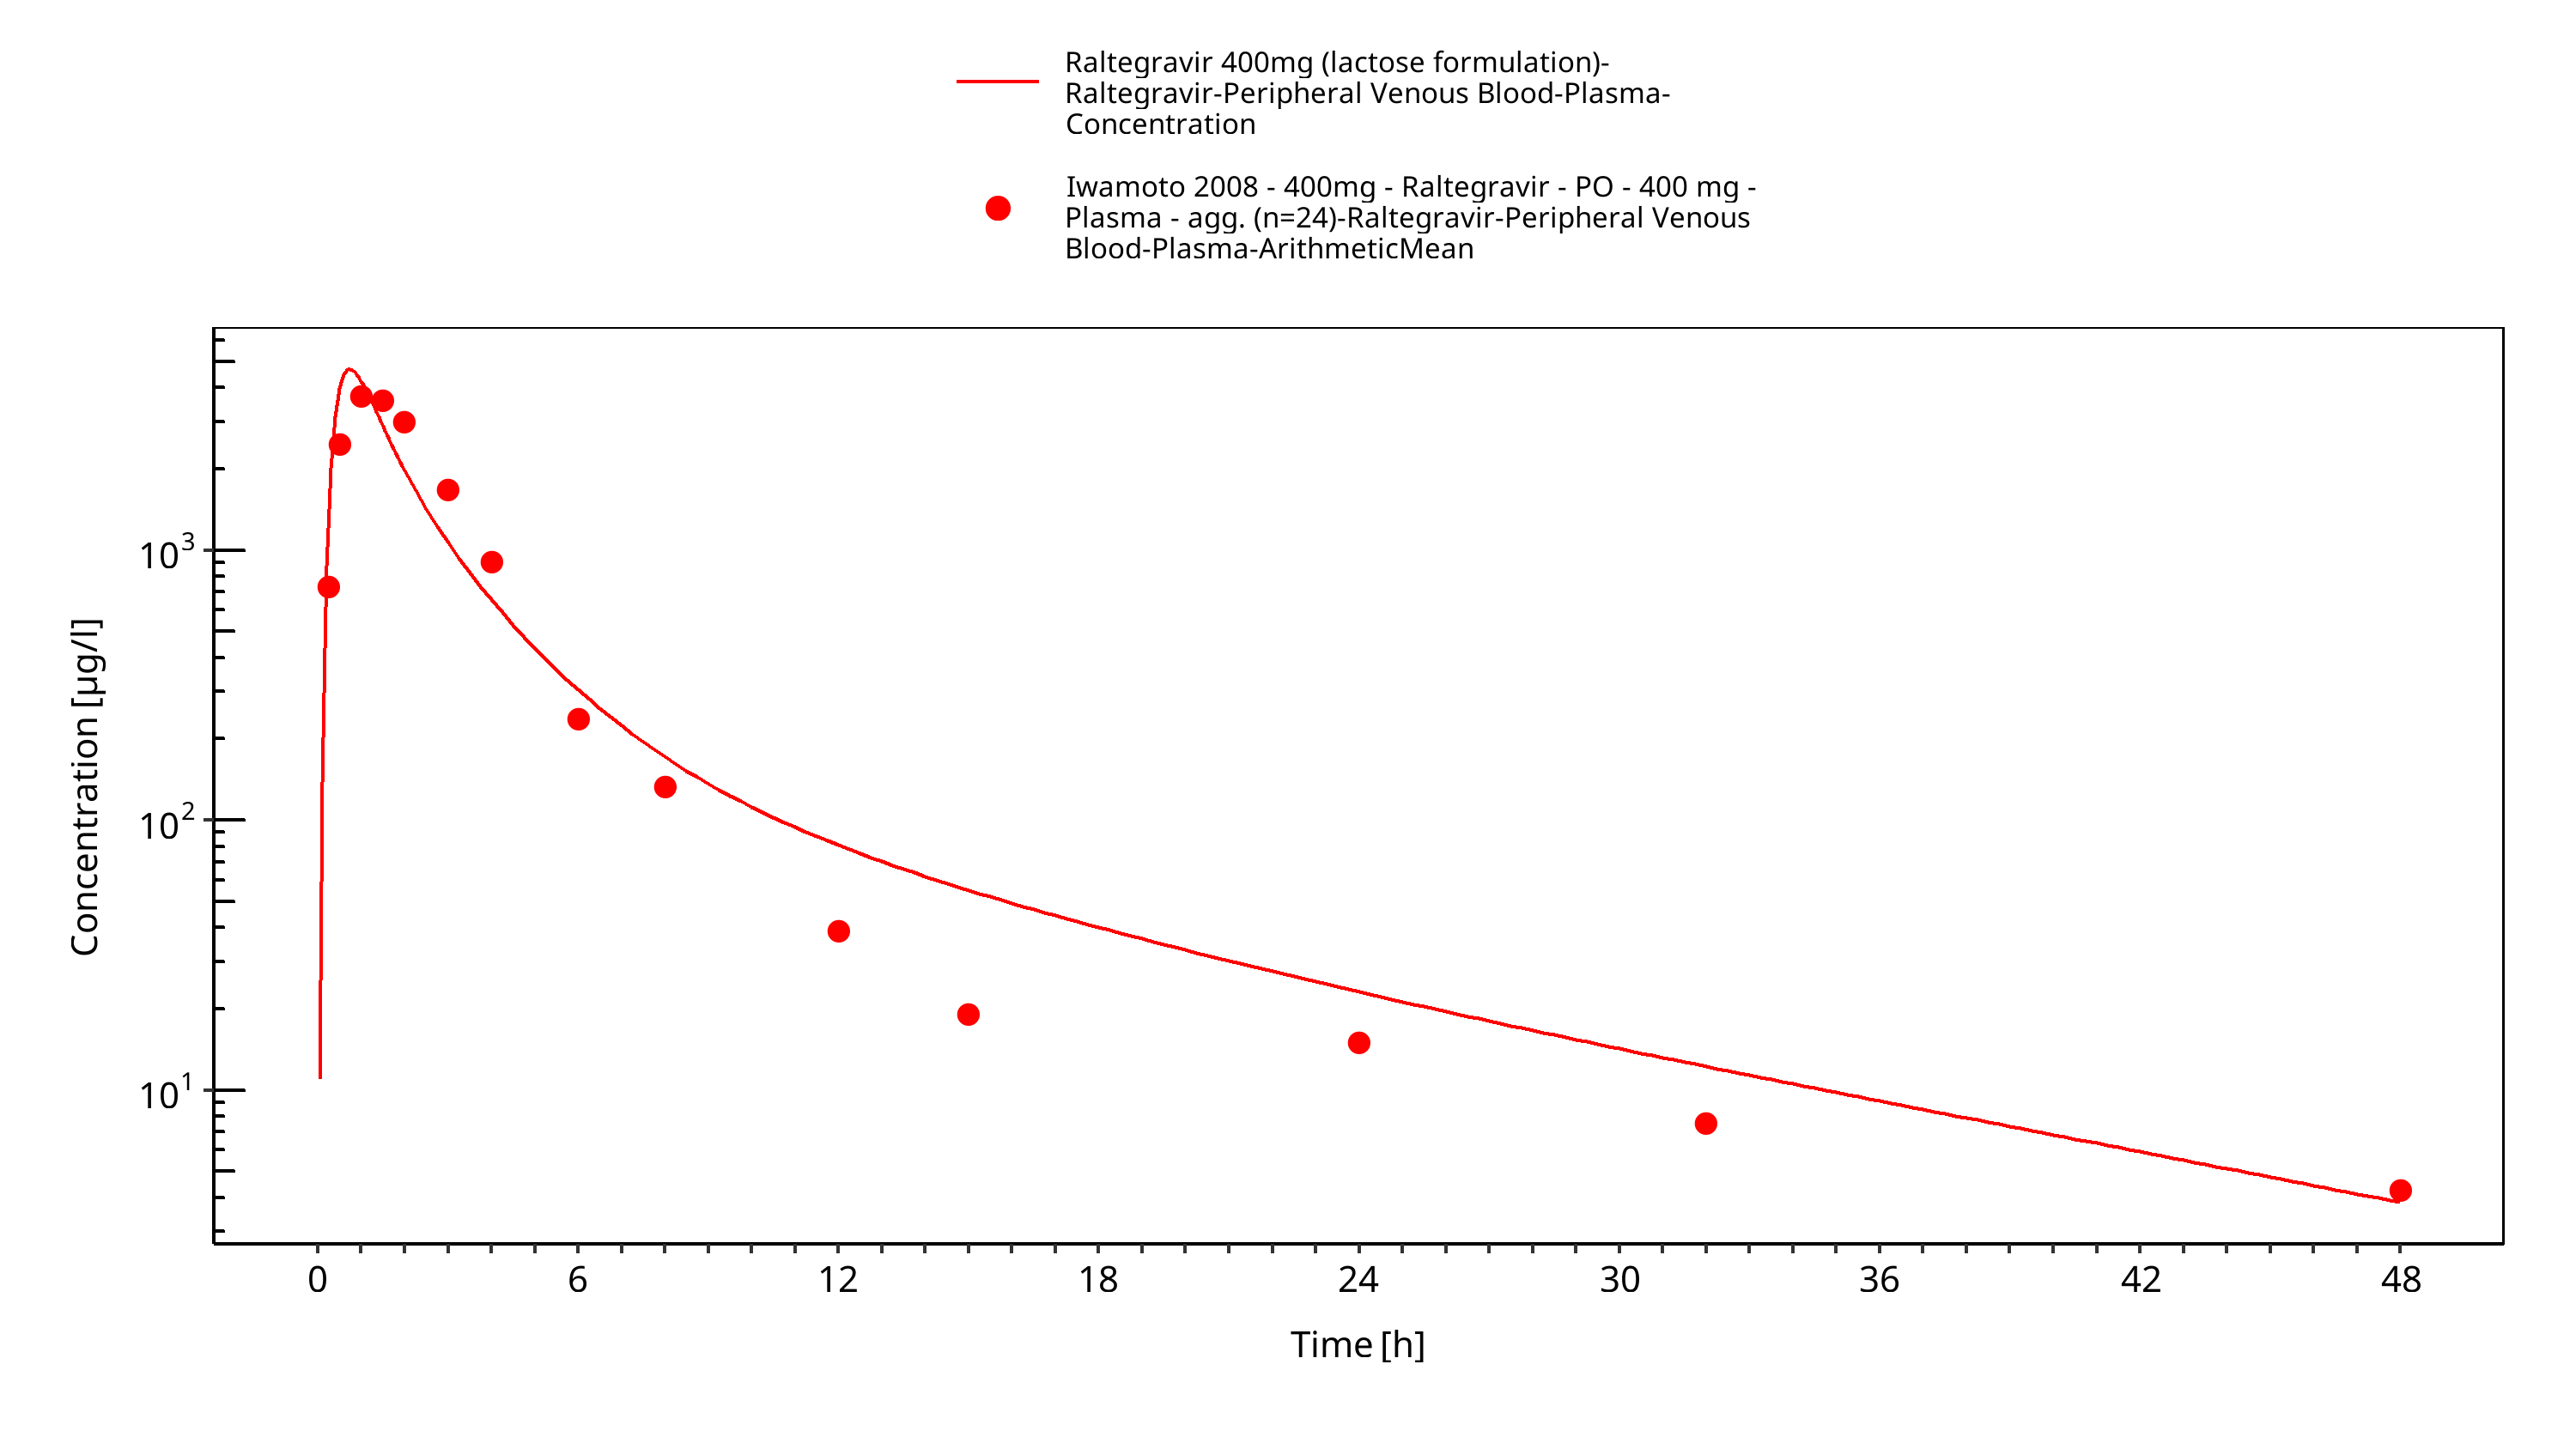
Figure 3-29: Time Profile Analysis
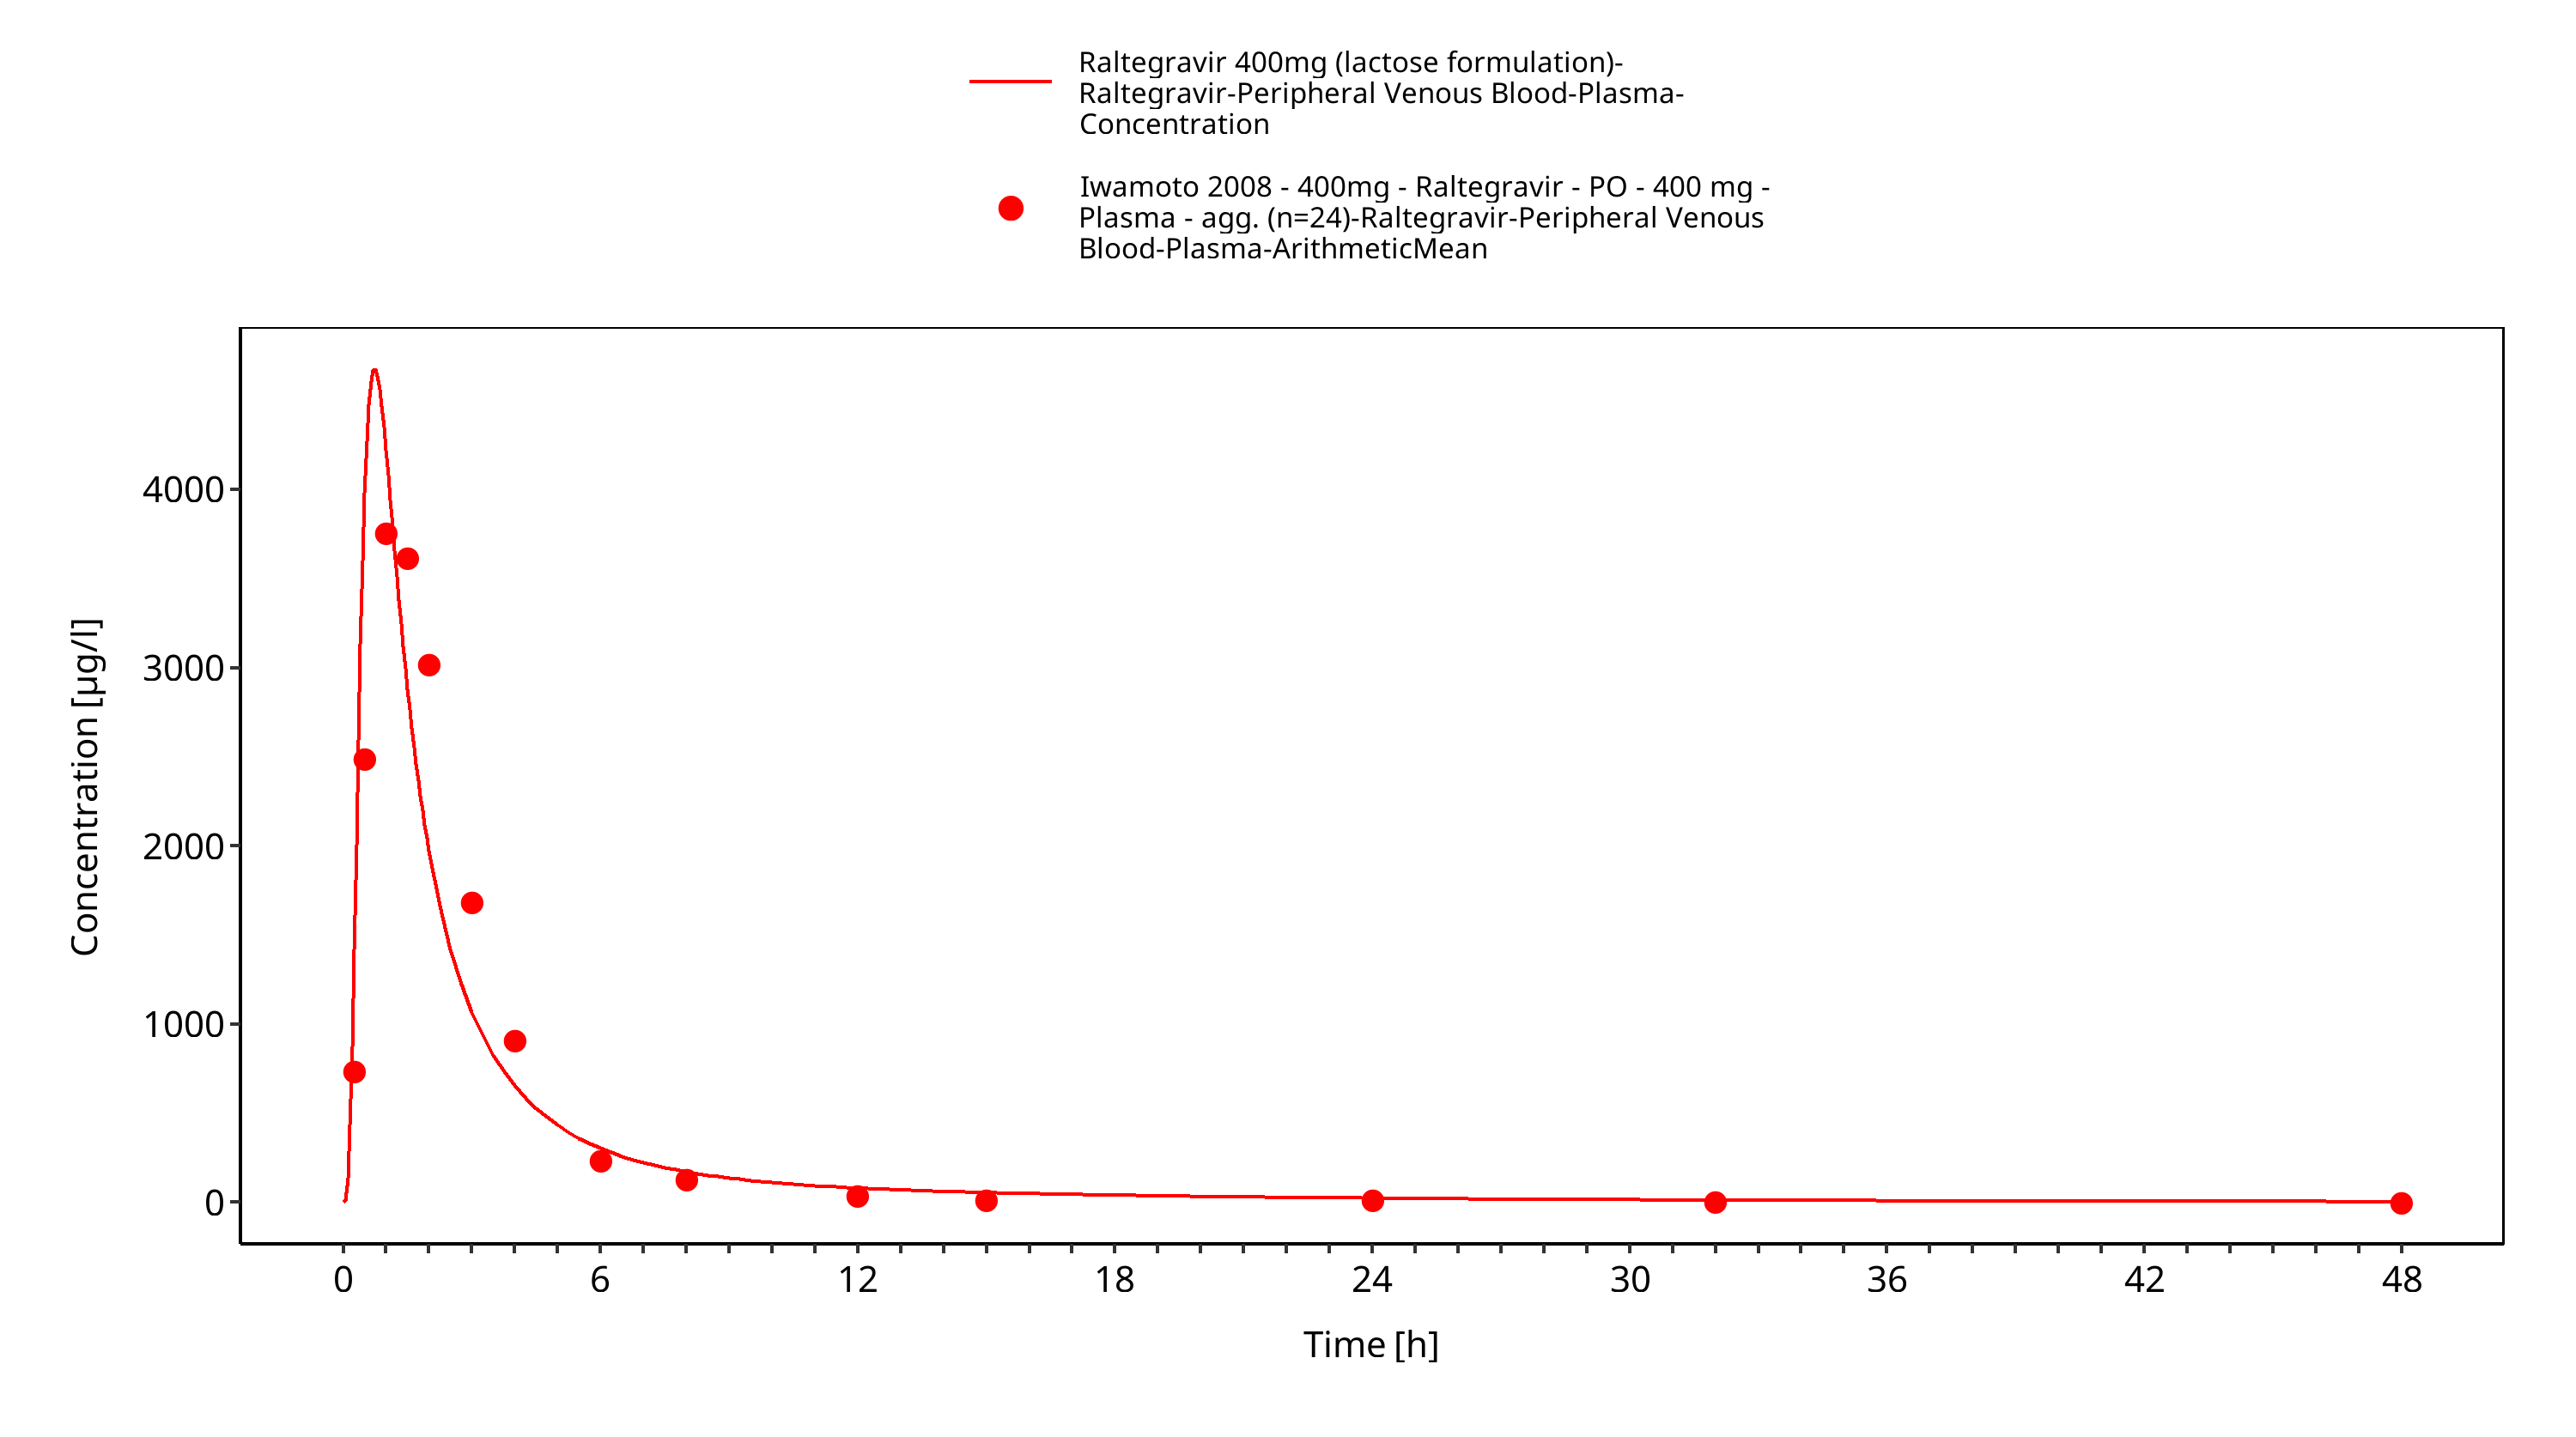
Figure 3-30: Time Profile Analysis 1
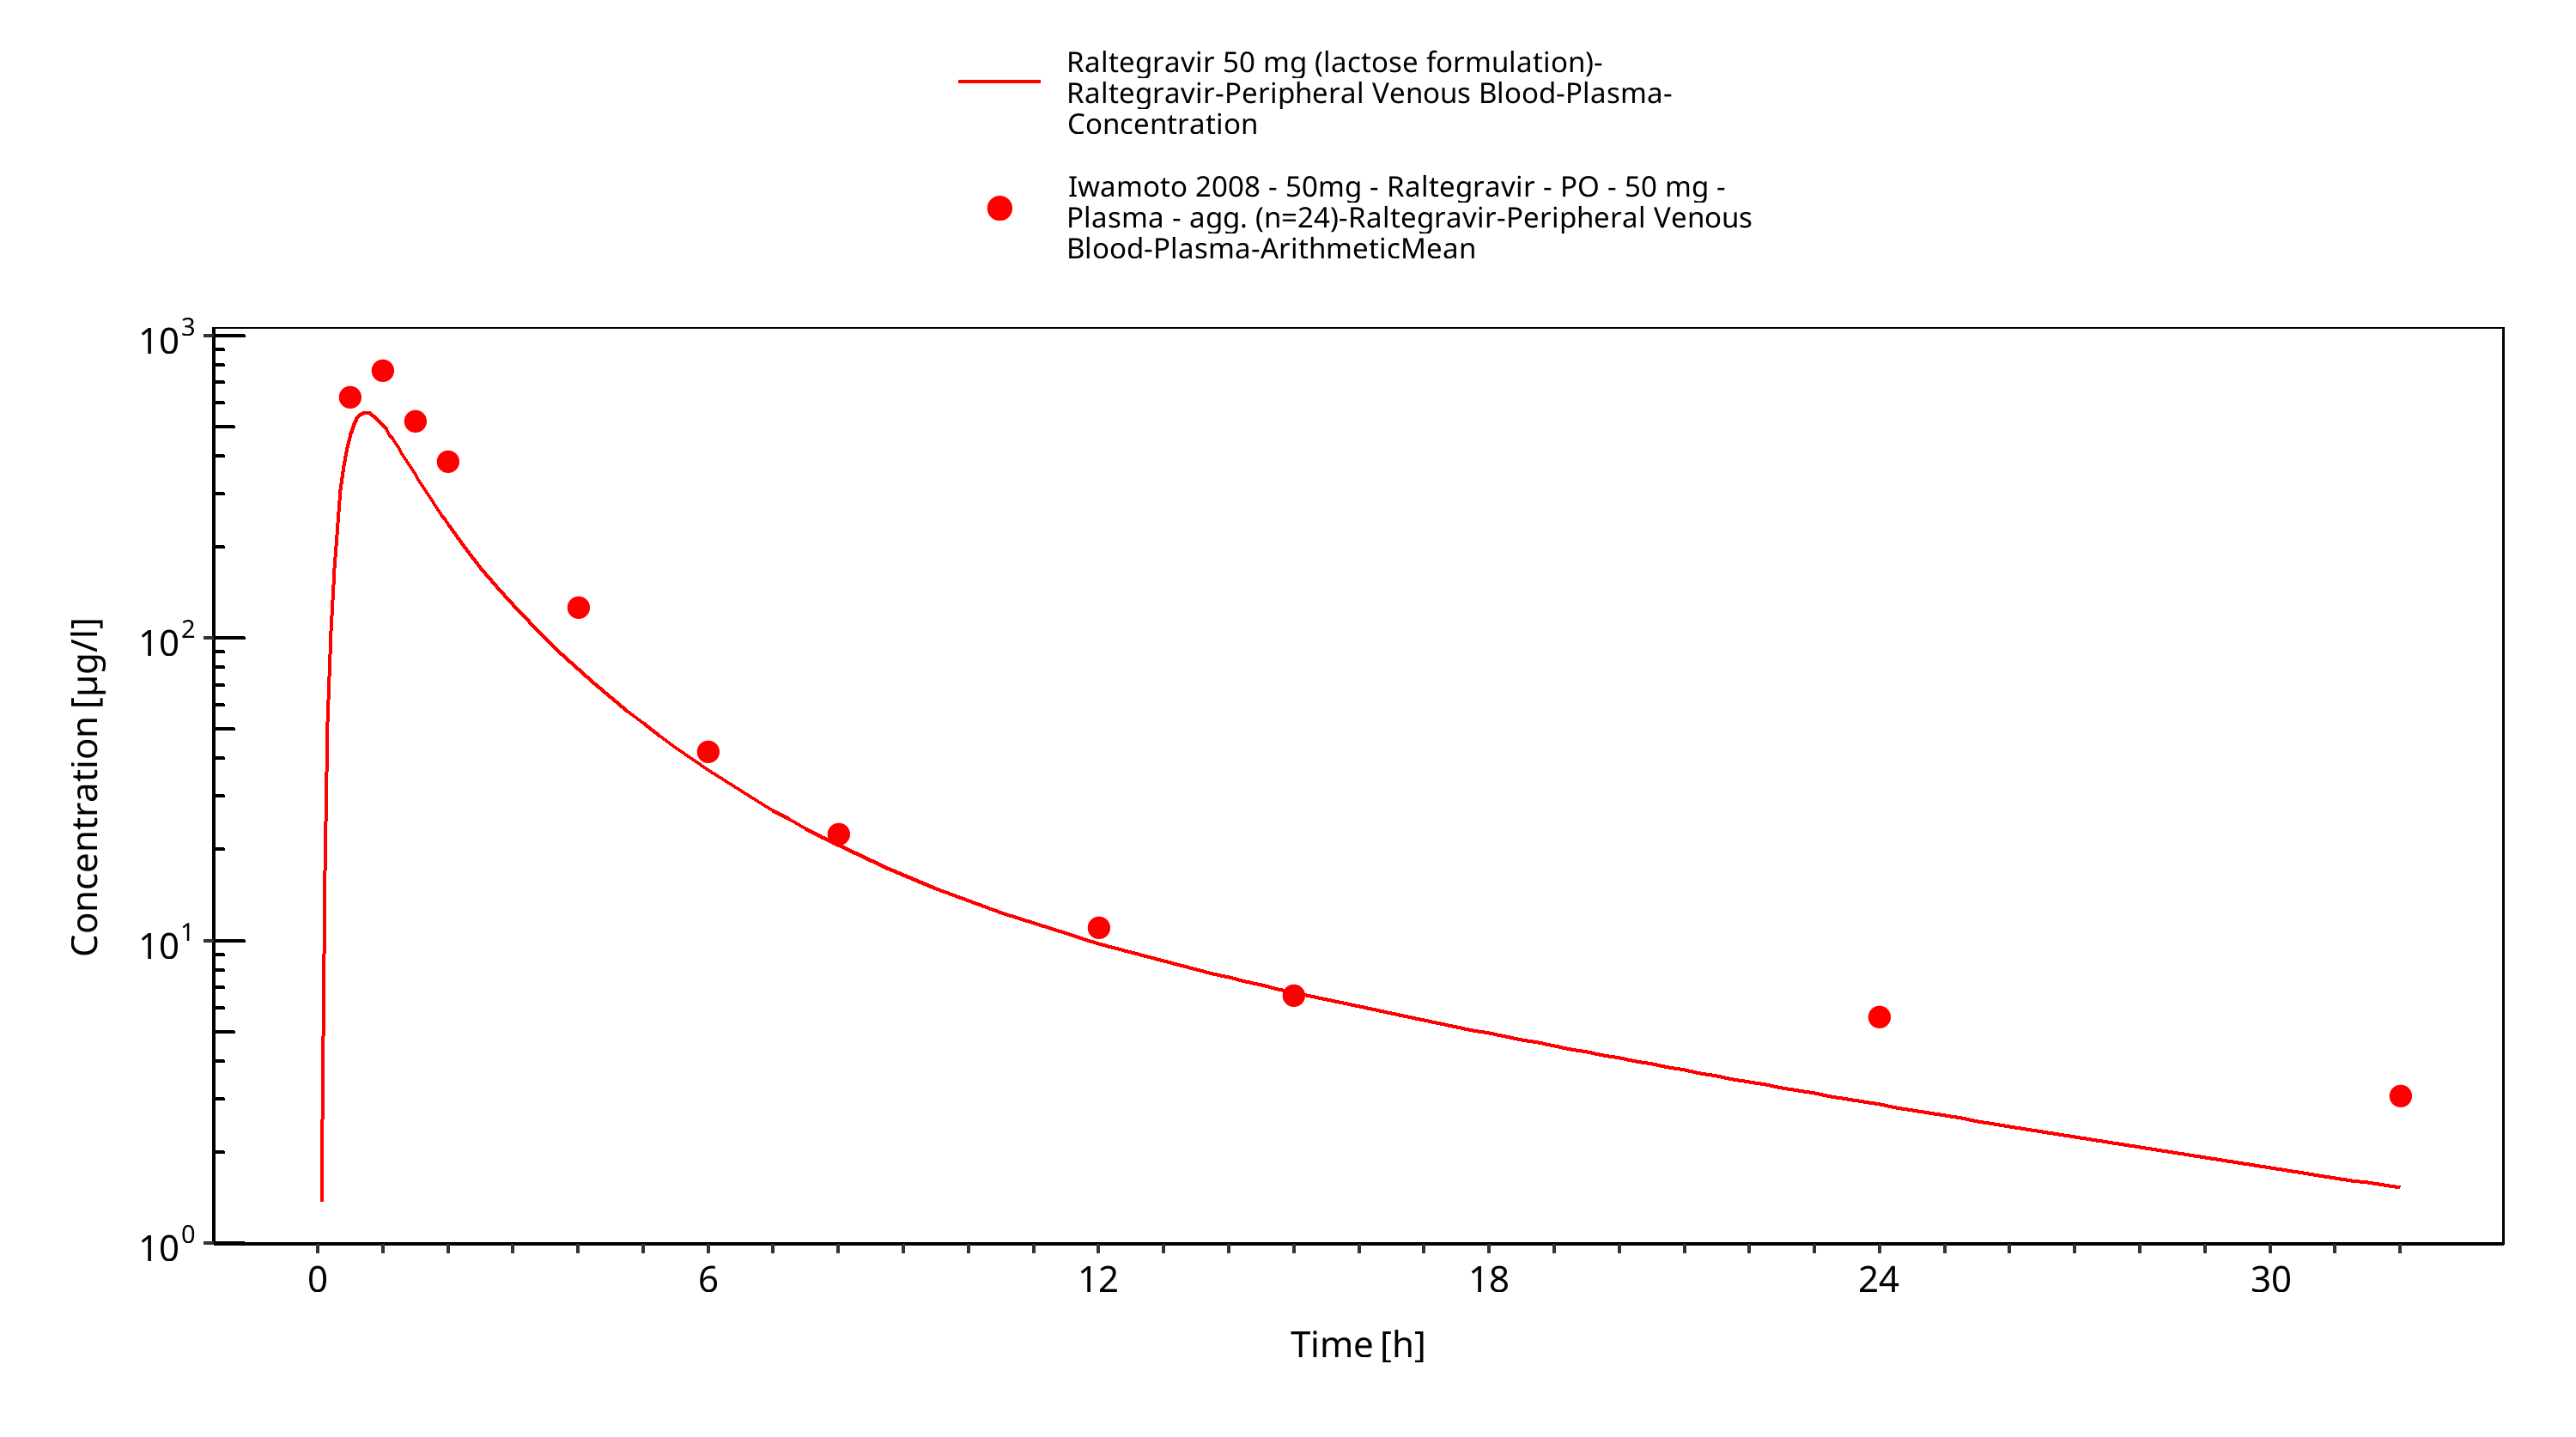
Figure 3-31: Time Profile Analysis
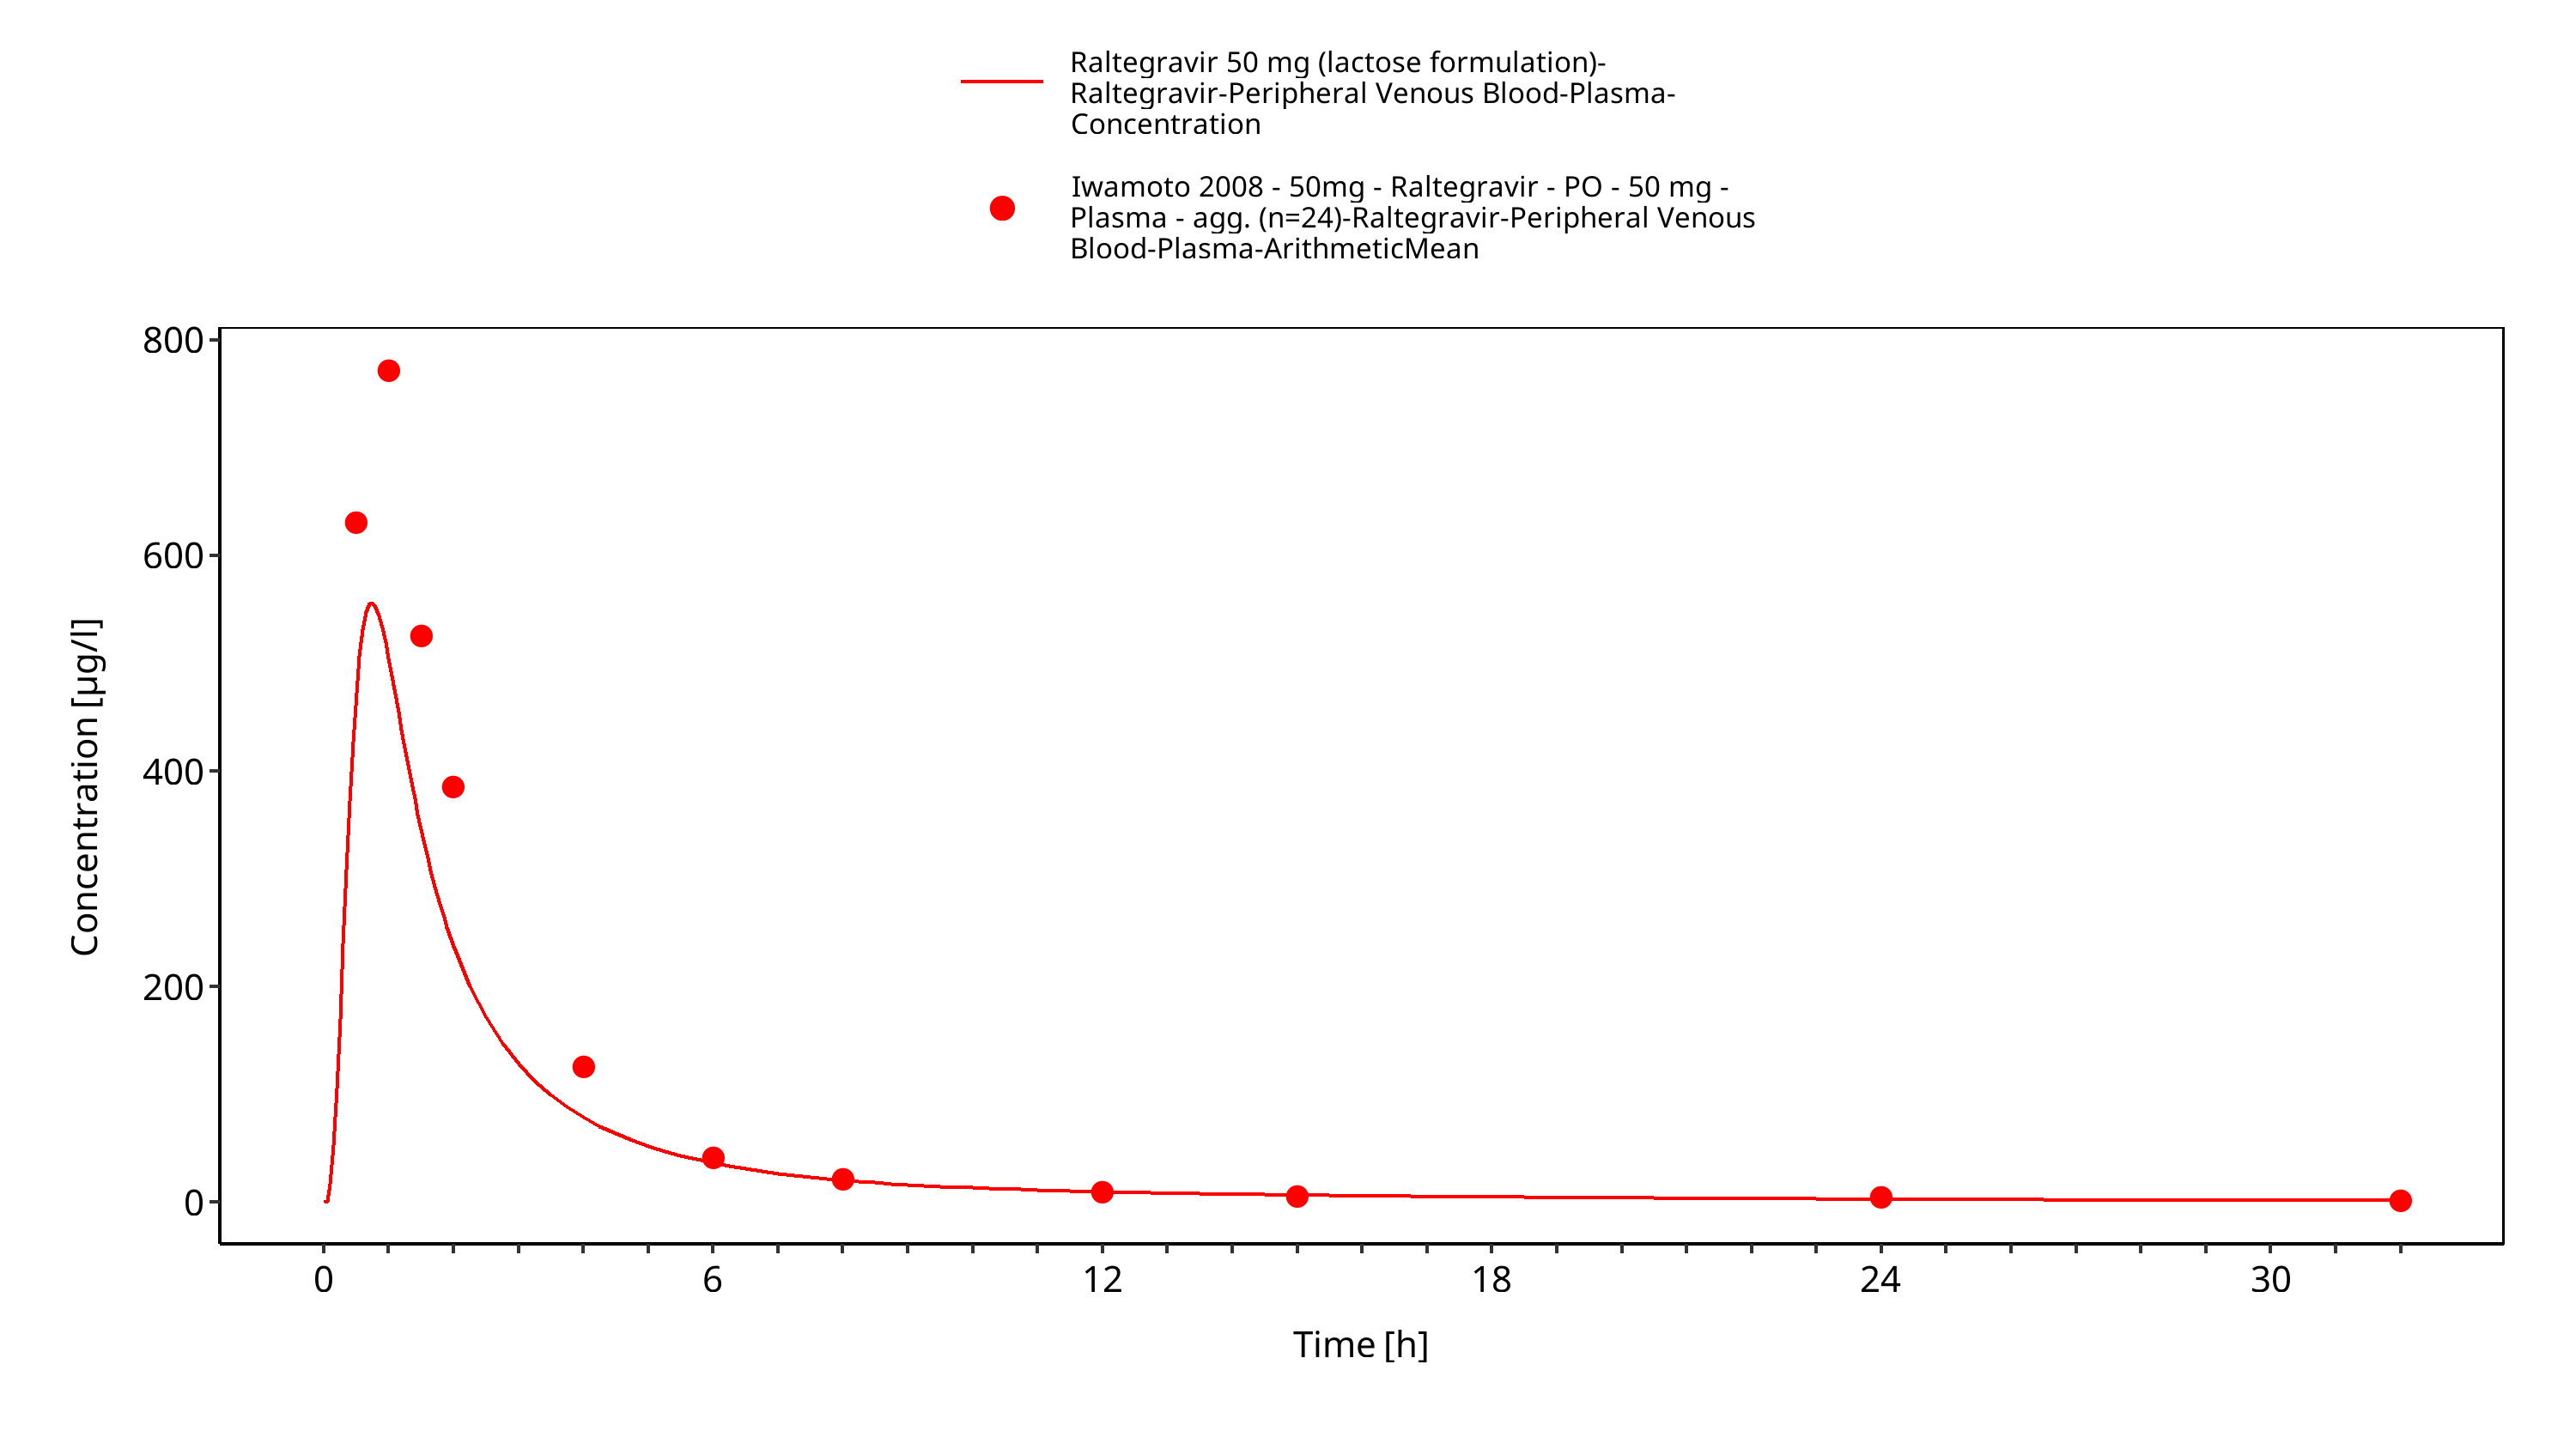
Figure 3-32: Time Profile Analysis 1
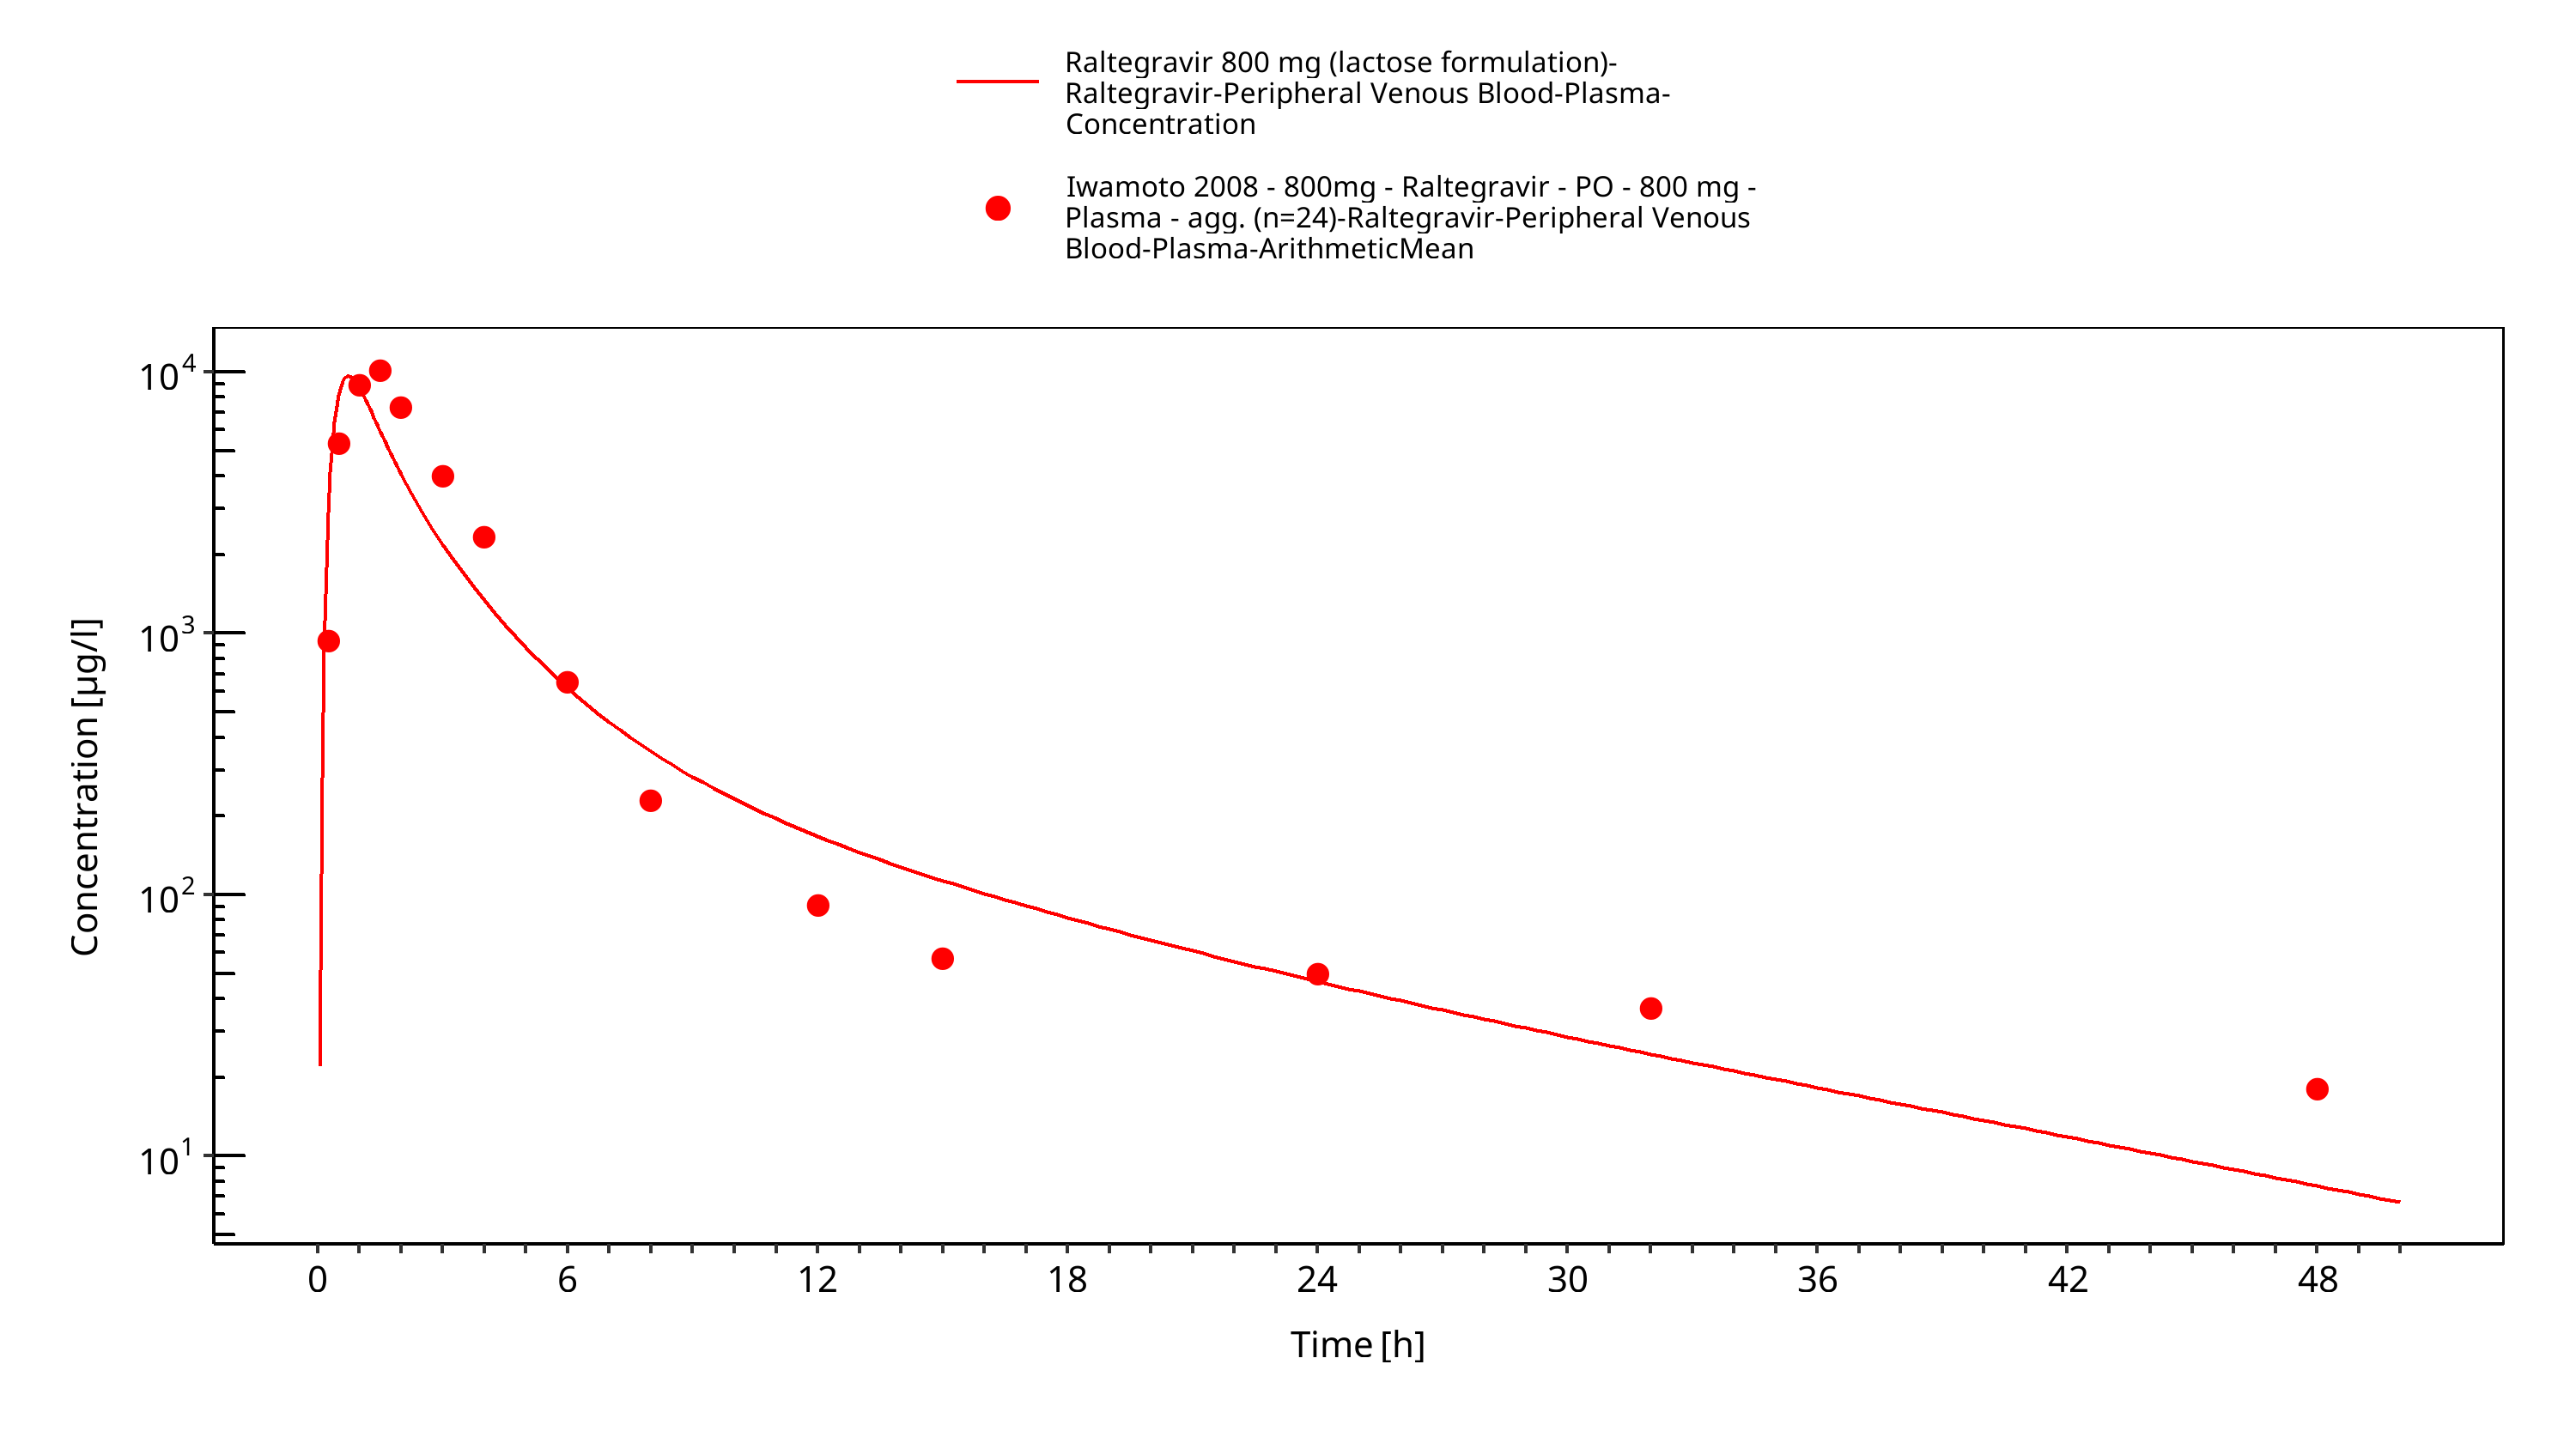
Figure 3-33: Time Profile Analysis
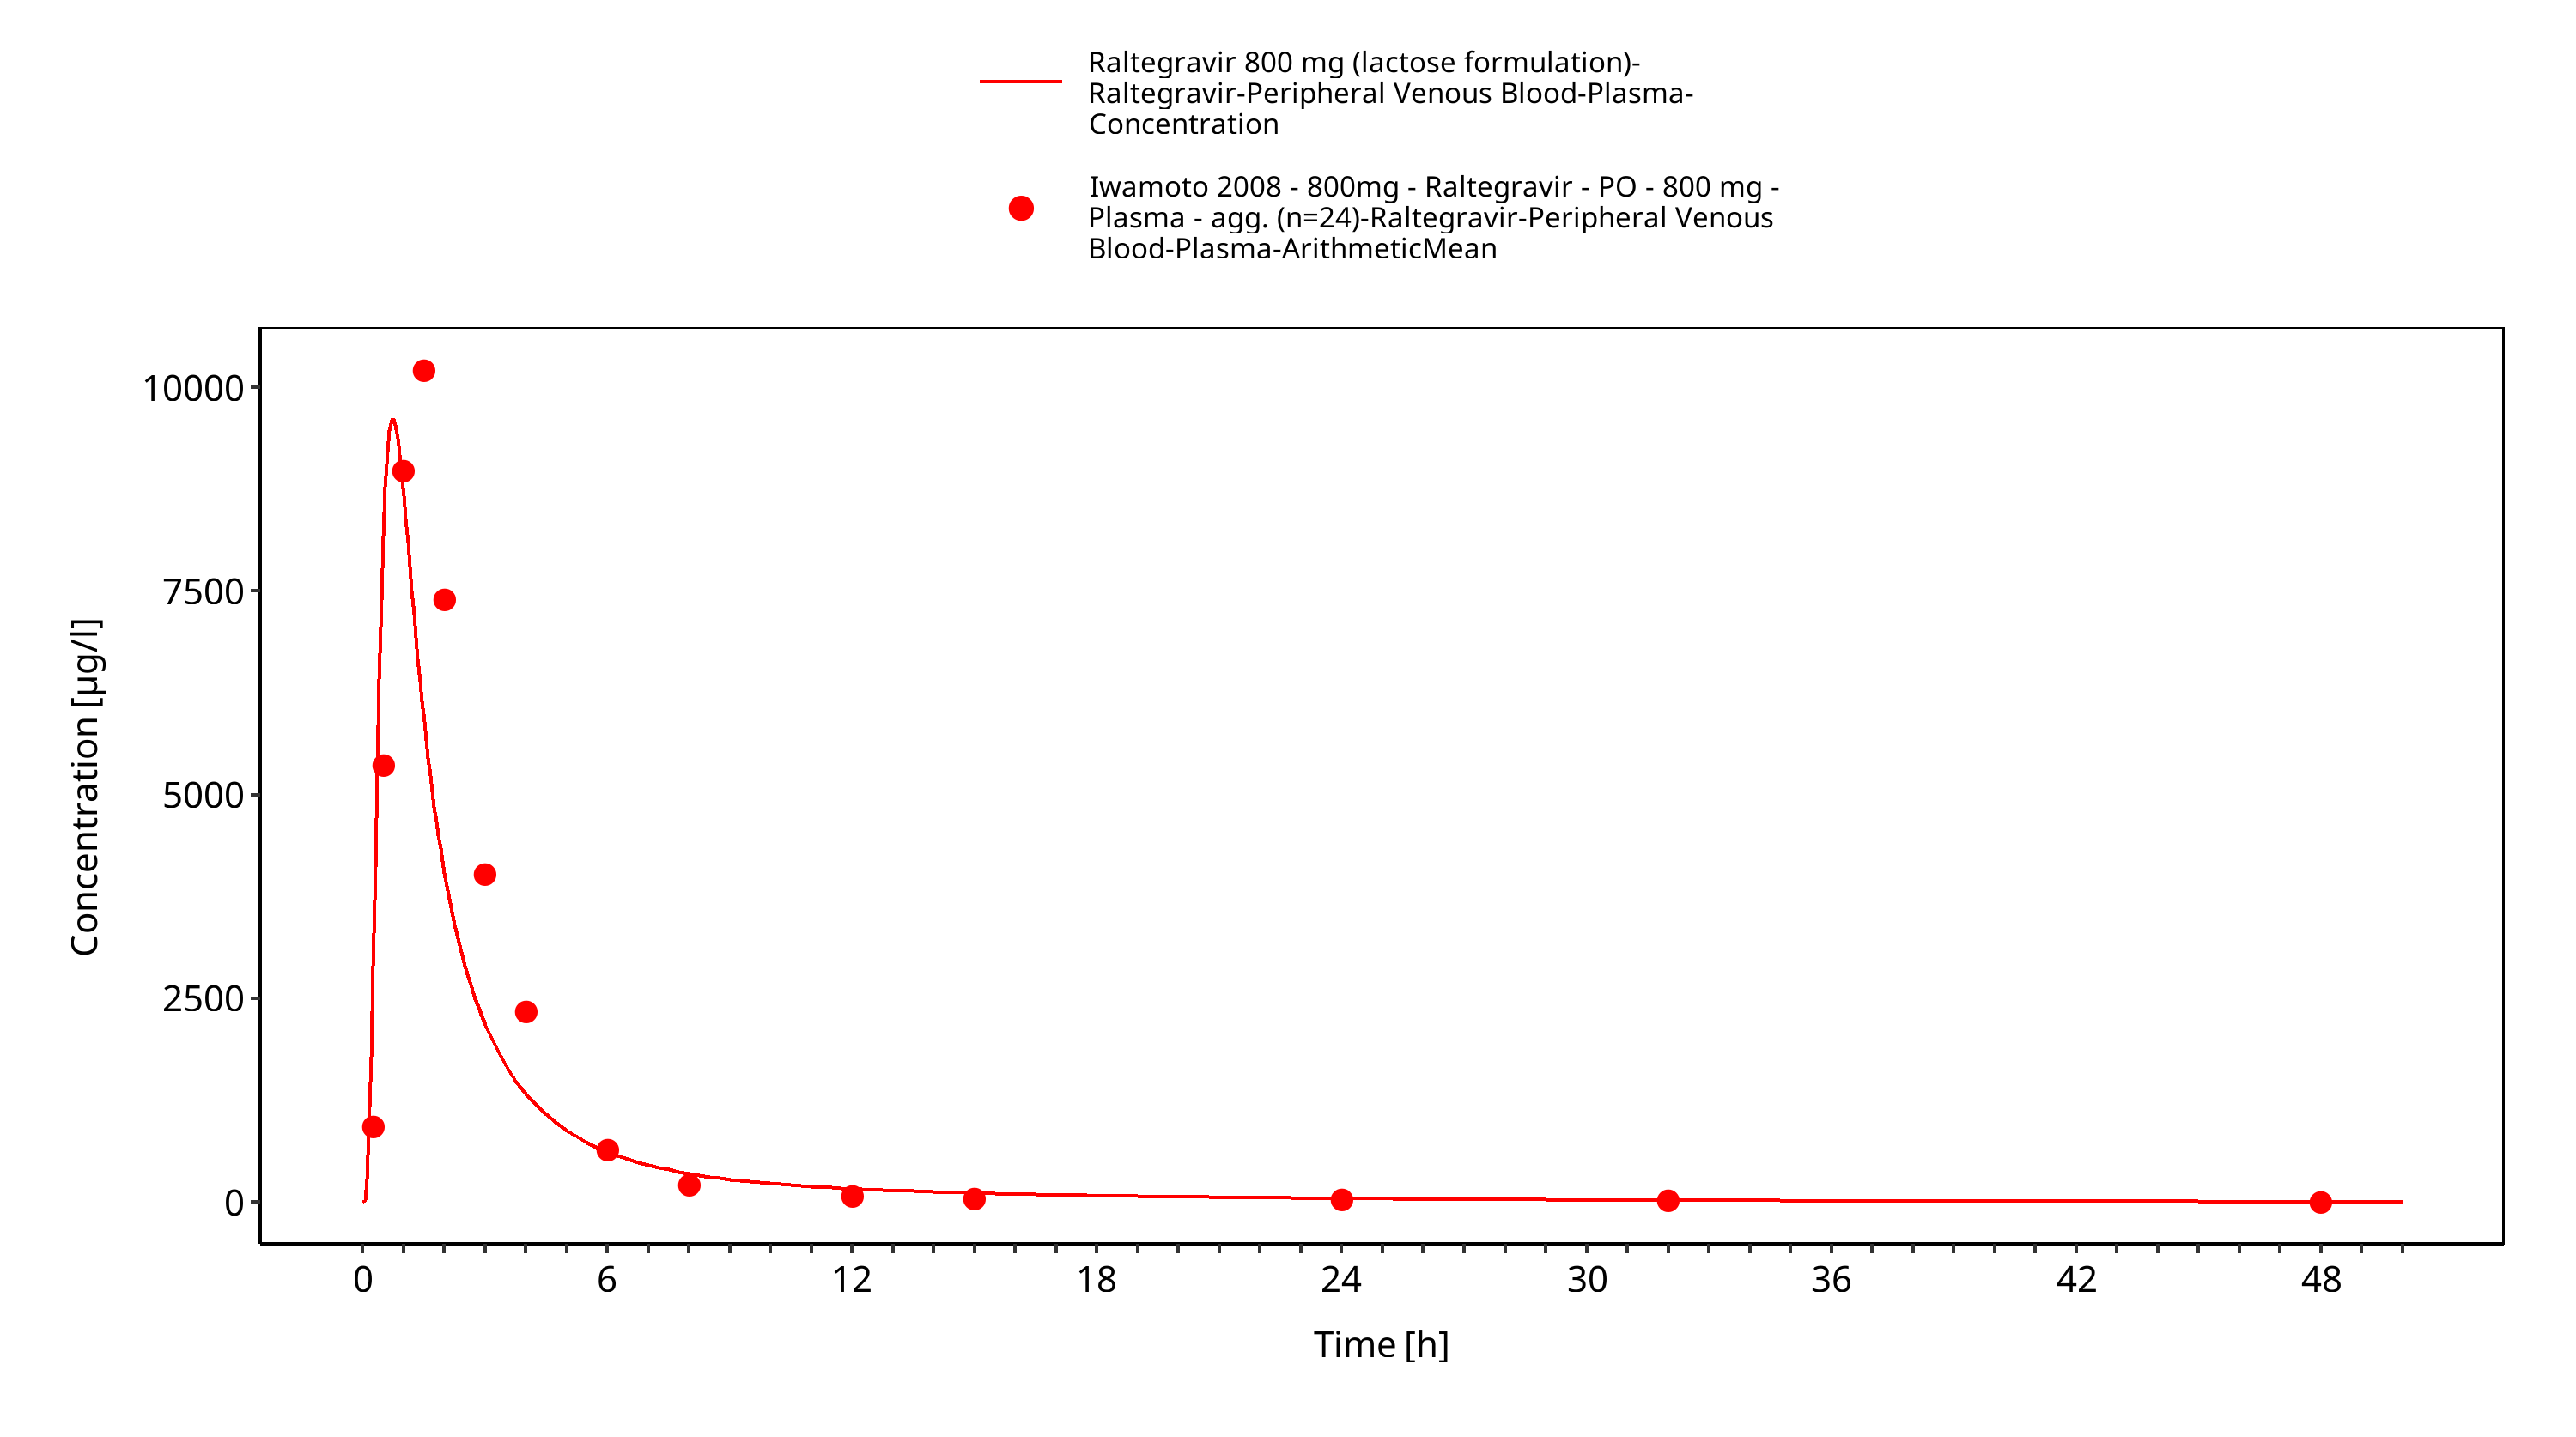
Figure 3-34: Time Profile Analysis 1
4 Conclusion
The final raltegravir PBPK model applies metabolism by UGT1A1, UGT1A9 and glomerular filtration and adequately describes the pharmacokinetics of raltegravir in adults receiving SD, MD of Raltegravir ranging from 10mg to 1600mg, including four different oral formulations.
This model could be applied for the investigation of drug-drug interactions (DDI), and translation to special populations such as pediatrics with regard to UGT1A1 and 1A9 metabolism.
5 References
Barau 2013 Caroline Barau, Valérie Furlan, Yazdan Yazdanpanah, Catherine Fagard, Jean-Michel Molina, Anne-Marie Taburet, and Aurélie Barrail-Tran. Characterization of Binding of Raltegravir to Plasma Proteins. Antimicrob Agents Chemother. 2013 Oct; 57(10): 5147–5150. doi: 10.1128/AAC.00625-13.
Drugbank.ca (https://www.drugbank.ca/drugs/DB06817 )
Iwamoto 2008 Iwamoto M, Wenning LA, Petry AS, Laethem M, De Smet M, Kost JT, Merschman SA, Strohmaier KM, Ramael S, Lasseter KC, Stone JA, Gottesdiener KM, Wagner JA. Safety, tolerability, and pharmacokinetics of raltegravir after single and multiple doses in healthy subjects. Clin Pharmacol Ther. 2008 Feb;83(2):293-9. Epub 2007 Aug 22.
Iwamoto 2009 Iwamoto M, Wenning LA, Nguyen BY, Teppler H, Moreau AR, Rhodes RR, Hanley WD, Jin B, Harvey CM, Breidinger SA, Azrolan N, Farmer HF Jr, Isaacs RD, Chodakewitz JA, Stone JA, Wagner JA. Effects of omeprazole on plasma levels of raltegravir. Clin Infect Dis. 2009 Feb 15;48(4):489-92. doi: 10.1086/596503.
Kassahun 2007 Kassahun K, McIntosh I, Cui D, Hreniuk D, Merschman S, Lasseter K, Azrolan N, Iwamoto M, Wagner JA, Wenning LA. Metabolism and disposition in humans of raltegravir (MK-0518), an anti-AIDS drug targeting the human immunodeficiency virus 1 integrase enzyme. Drug Metab Dispos. 2007 Sep;35(9):1657-63. Epub 2007 Jun 25.
Kuepfer 2016 Kuepfer L, Niederalt C, Wendl T, Schlender JF, Willmann S, Lippert J, Block M, Eissing T, Teutonico D. Applied Concepts in PBPK Modeling: How to Build a PBPK/PD Model.CPT Pharmacometrics Syst Pharmacol. 2016 Oct;5(10):516-531. doi: 10.1002/psp4.12134. Epub 2016 Oct 19.
Laufer 2009 Laufer R, Paz OG, Di Marco A, Bonelli F, Monteagudo E, Summa V, Rowley M. Quantitative prediction of human clearance guiding the development of Raltegravir (MK-0518, isentress) and related HIV integrase inhibitors. Drug Metab Dispos. 2009 Apr;37(4):873-83. doi: 10.1124/dmd.108.023804. Epub 2009 Jan 14.
Markowitz 2006 Markowitz M, Morales-Ramirez JO, Nguyen BY, Kovacs CM, Steigbigel RT, Cooper DA, Liporace R, Schwartz R, Isaacs R, Gilde LR, Wenning L, Zhao J, Teppler H. Antiretroviral activity, pharmacokinetics, and tolerability of MK-0518, a novel inhibitor of HIV-1 integrase, dosed as monotherapy for 10 days in treatment-naive HIV-1-infected individuals. J Acquir Immune Defic Syndr. 2006 Dec 15;43(5):509-15.
Moss 2012 Moss DM, Siccardi M, Murphy M, Piperakis MM, Khoo SH, Back DJ, Owen A. Divalent metals and pH alter raltegravir disposition in vitro. Antimicrob Agents Chemother. 2012 Jun;56(6):3020-6. doi: 10.1128/AAC.06407-11. Epub 2012 Mar 26.
Moss 2013 Moss DM, Siccardi M, Back DJ, Owen A. Predicting intestinal absorption of raltegravir using a population-based ADME simulation. J Antimicrob Chemother. 2013 Jul;68(7):1627-34. doi: 10.1093/jac/dkt084. Epub 2013 Mar 20.
Parrott 2008 Parrott N, Lave T. Applications of physiologically based absorption models in drug discovery and development. Mol Pharm. 2008 Sep-Oct;5(5):760-75. doi: 10.1021/mp8000155. Epub 2008 Jun 12.
PK-Sim Ontogeny Database Version 7.3 (https://github.com/Open-Systems-Pharmacology/OSPSuite.Documentation/blob/38cf71b384cfc25cfa0ce4d2f3addfd32757e13b/PK-Sim%20Ontogeny%20Database%20Version%207.3.pdf)
Rhee 2014 Rhee EG, Rizk ML, Brainard DM, Gendrano IN 3rd, Jin B, Wenning LA, Wagner JA, Iwamoto M. A pharmacokinetic comparison of adult and paediatric formulations of raltegravir in healthy adults. Antivir Ther. 2014;19(6):619-24. doi: 10.3851/IMP2765. Epub 2014 Mar 7.
Schlender 2016 Schlender JF, Meyer M, Thelen K, Krauss M, Willmann S, Eissing T, Jaehde U. Development of a Whole-Body Physiologically Based Pharmacokinetic Approach to Assess the Pharmacokinetics of Drugs in Elderly Individuals. Clin Pharmacokinet. 2016 Dec;55(12):1573-1589.
Sjögren 2013 Sjögren E, Westergren J, Grant I, Hanisch G, Lindfors L, Lennernäs H, Abrahamsson B, Tannergren C. In silico predictions of gastrointestinal drug absorption in pharmaceutical product development: application of the mechanistic absorption model GI-Sim. Eur J Pharm Sci. 2013 Jul 16;49(4):679-98. doi: 10.1016/j.ejps.2013.05.019. Epub 2013 May 29.
Sun 2002 Sun D, Lennernas H, Welage LS, Barnett JL, Landowski CP, Foster D, Fleisher D, Lee KD, Amidon GL. Comparison of human duodenum and Caco-2 gene expression profiles for 12,000 gene sequences tags and correlation with permeability of 26 drugs. Pharm Res. 2002 Oct;19(10):1400-16.
Thelen 2011 Thelen K, Coboeken K, Willmann S, Burghaus R, Dressman JB, Lippert J. Evolution of a detailed physiological model to simulate the gastrointestinal transit and absorption process in humans, part 1: oral solutions. J Pharm Sci. 2011 Dec;100(12):5324-45. doi: 10.1002/jps.22726. Epub 2011 Oct 12
Wenning 2009 Larissa A. Wenning,, William D. Hanley, Diana M. Brainard, Amelia S. Petry, Kalyan Ghosh, Bo Jin, Eric Mangin, Thomas C. Marbury, Jolene K. Berg, Jeffrey A. Chodakewitz, Julie A. Stone,1 Keith M. Gottesdiener, John A. Wagner, and Marian Iwamoto. Effect of Rifampin, a Potent Inducer of Drug-Metabolizing Enzymes, on the Pharmacokinetics of Raltegravir. Antimicrob Agents Chemother. 2009 Jul; 53(7): 2852–2856.
Related Models
Explore other Antivirals models in this library:
- Atazanavir - PBPK model and evaluation report
- Efavirenz - PBPK model and evaluation report