Building and evaluation of a PBPK model for Moclobemide in adults
| Version | 2.0-OSP12.3 |
|---|---|
| based on Model Snapshot and Evaluation Plan | https://github.com/Open-Systems-Pharmacology/Moclobemide-Model/releases/tag/v2.0 |
| OSP Version | 12.3 |
| Qualification Framework Version | 3.7 |
This evaluation report and the corresponding PK-Sim project file are filed at:
https://github.com/Open-Systems-Pharmacology/OSP-PBPK-Model-Library/
Table of Contents
- 1 Introduction
- 2 Methods
- 2.1 Modeling Strategy
- 2.2 Data
- 2.3 Model Parameters and Assumptions
- 3 Results and Discussion
- 3.1 Final input parameters
- 3.2 Diagnostics Plots
- 3.3 Concentration-Time Profiles
- 4 Conclusion
- 5 References
- 6 Glossary
1 Introduction
The presented PBPK model of moclobemide has been developed to be used in a PBPK Drug-Drug-Interactions (DDI) network with moclobemide as a substrate and a moderate inhibitor of CYP2C19.
Moclobemide is a reversible inhibitor of monoamine oxidase A (RIMA), a drug primarily used to treat depression and social anxiety (Mayersohn 1995). Moclobemide pharmacokinetics is characterized by non-linearity in dose and time. Cmax concentrations decrease with dose for doses above 100 mg. Furthermore, a saturation in clearance at higher doses (200 mg and up) could be seen, as indicated by a longer terminal phase. In addition, multiple doses administration resulted in higher moclobemide concentrations compared to single dose. This could be indicative of the previously reported auto-inhibitory effect (Nair 1993).
Absorption: Moclobemide is highly soluble, and consequently fast and completely absorbed. Absolute bioavailability has been reported to be dependent on the dose, likely due to saturable (first-pass) metabolism (Mayersohn 1995).
Distribution: Moclobemide is moderately bound to plasma proteins and due to its lipophilicity distributes widely in the body (Vss ~ 1.2 L/kg) (MHRA Label Moclobemide).
Metabolism: About 99% of a dose is metabolized mainly via CYP2C19 (C-oxidation, producing metabolite RO12-8095) and FMO3 (N-oxidation, producing metabolite RO12-5637) (Gram 1995, Hoskins 2001, Mayersohn 1995).
Excretion: Less than 1% of a dose is excreted unchanged via the kidneys.
2 Methods
2.1 Modeling Strategy
The general workflow for building an adult PBPK model has been described by Kuepfer et al. (Kuepfer 2016). Relevant information on the anthropometry (height, weight) was gathered from the respective clinical study, if reported. Information on physiological parameters (e.g. blood flows, organ volumes, hematocrit) in adults was gathered from the literature and has been incorporated in PK-Sim® as described previously (Willmann 2007). The applied activity and variability of plasma proteins and active processes that are integrated into PK-Sim® are described in the publicly available 'PK-Sim® Ontogeny Database Version 7.3' (PK-Sim Ontogeny Database Version 7.3).
In general, the following step-wise workflow was followed:
- Fit total hepatic CL as a placeholder using single dose i.v. (50 mg (Raaflaub 1984) and 150 mg (Schoerlin 1987)) data with renal clearance fixed to 0.034 ml/min/kg as derived from Schoerlin 1987 to select the appropriate distribution (i.e. partition coefficient) model.
- Estimate the contribution of non-CYP2C19 mediated metabolism using data (p.o.) from CYP2C19 poor metabolizers (PM) (Yu 2001, Gram 1995). This pathway is assumed to be mainly attributed to FMO (flavin-containing monooxygenase) – however, also other unspecific CL would be captured here. An Asian individual was used for simulations of data reported by Yu 2001.
- Use single dose data (i.v. and p.o.) to estimate Vmax and Km of CYP2C19.
- Predict concentrations after multiple oral dosing and compare to literature. Steady state levels were not predicted very well, and the model was refined by including time-dependent auto-inhibition to account for a change in CL over time.
- Predict single and multiple doses profiles (both i.v. and p.o.) with the updated model and compare to published profiles. Qualify model by comparing predicted CL/F and Cmax to the corresponding parameters in a review across multiple studies. Population prediction to verify the variability components of the model.
A typical European male subject (age = 30 years, weight = 73 kg, height = 176 cm, BMI = 23.57 kg/m2) was created in PK-Sim using the predefined database “European (ICRP, 2002)”, by adding CYP2C19 ( PK-Sim RT PCR database) and FMO (other) expression and used in simulations, until stated otherwise. For simulations of Asian subjects, a typical Asian individual (Age = 30 y, weight = 60.03 kg, height = 169.96 cm, BMI = 20.78 kg/m2) was created from the predefined database “Asian (Tanaka, 1996)” by adding CYP2C19 ( PK-Sim RT PCR database) and FMO (other) expression.
For simulations of the Ignjatovic 2009 data set, a typical European female subject (Age = 30 years, weight = 64 kg, height = 163 cm, BMI = 24.09 kg/m2) was created from the predefined database “European (ICRP, 2002)” by adding CYP2C19 ( PK-Sim RT PCR database) and FMO (other) expression.
Initially, attempts were made to also unravel the contribution of the FMO3-specific clearance pathway and the unspecific pathway using the in vitro FMO-CL of moclobemide in a microsomal assay reported by Hoskins 2001. However, this route was abandoned as predictions were not in line with observations, potentially requiring the need for an in vivo - in vitro scaling factor. For the purpose of DDI predictions, the details of the CYP2C19 pathway only were considered relevant.
Population simulations were carried out to evaluate if the variability incorporated in the model matches the literature reports. A population of 2000 Asian subjects with age and weight in the same range as reported by Yu 2001 (age: 20-36 years, weight: 40-120 kg, 13% female) was generated, and the concentration time profile following a single dose of 300 mg p.o. was simulated for each virtual subject and summarized as mean +/- SD. The simulation was also performed for CYP2C19 poor metabolizers.
Details about input data (physicochemical, in vitro and clinical) can be found in Section 2.2.
Details about the structural model and its parameters can be found in Section 2.3.
2.2 Data
2.2.1 In vitro and physico-chemical data
A literature search was performed to collect available information on physico-chemical properties of moclobemide, see Table 1.
| Parameter | Unit | Value | Source | Description |
|---|---|---|---|---|
| MW+ | g/mol | 268.74 | DrugBank DB01171 | Molecular weight |
| pKa,base+ | 6.2 | IPCS INCHEM | Acidic dissociation constant | |
| Solubility (pH)+ | mg/mL | 3 (6.8) |
Moclobemide, INCHEM | Aqueous Solubility |
| logD | 1.79 | Pons 1990 | Distribution coefficient | |
| fu+ | % | 50 | MHRA Label Moclobemide | Fraction unbound in plasma |
| Km_FMO (microsomes) | mmol/L | 0.77 | Hoskins 2001 | |
| Vmax_FMO (microsomes) | nmol/min/mg prot. | 1.39 | Hoskins 2001 | |
| Renal Elimination | ml/min/kg | 0.03 | Schoerlin 1987 | Schoerlin reports 2.6 ml/min/76kg |
| Ki_CYP2C19 (free) | µmol/L | 203.8 | Kramer-Nielsen 1996 | The total ki value reported by Kramer was 210 umol/L and corrected with an fu_mic of 0.97 |
Table 1: Physico-chemical and in-vitro metabolization properties of moclobemide extracted from literature. +: Value used in final model
2.2.2 Clinical data
A literature search was performed to collect available clinical data on moclobemide in adults, see Table 2.
| Source | Route | Dose [mg]/ Schedule * | Pop. | Age [yrs] (mean or range) | Weight [kg] (mean or range) | Sex | N | Form. | Comment |
|---|---|---|---|---|---|---|---|---|---|
| Gram 1995+ | p.o. | 300 s.d. / b.i.d. | HV | 26 | - | m/f | 8 | tablet | EM + PM |
| Yu 2001+ | p.o. | 300 s.d. | HV-Asian | - | 60.3 | m | 8 | tablet | EM, PM and EM+OMP40 |
| Wiesel 1985+ | p.o. | 50, 100, 200 s.d. | HV or patient etc | 26.3 | 75.8 | m | 6 | tablet | |
| Ignjatovic 2009 | p.o. | 150 t.i.d. | Pat | - | - | m/f | 6 | tablet | |
| Dingemanse 1998 | p.o. | 300 s.d. | HV | - | - | f/m | 12 | tablet | |
| Schoerlin 1987+ | p.o. & i.v. infusion | 150 t.i.d. /s.d. | HV | 27 | 76 | m | 12 | tablet/ solution | |
| Guentert 1990+ | p.o. | 150 t.i.d. | HV | 19-29 | 59-86 | m/f | 14 | tablet | |
| Raaflaub 1984+ | p.o. & i.v. infusion | 50 s.d. | HV | 42 | 4 | m | 6 | tablet/ solution |
Table 2: Literature sources of clinical concentration data of moclobemide used for model development and validation. -: respective information was not provided in the literature source; *:single dose unless otherwise specified; EM: extensive metabolizers; PM: poor metabolizers; +: Data used for final parameter identification
2.3 Model Parameters and Assumptions
2.3.1 Absorption
Particle dissolution for the formulation has been selected.
2.3.2 Distribution
Physico-chemical parameters were set to the reported values (see Section 2.2.1). It was assumed that the major binding partner in plasma is albumin.
After testing the available organ-plasma partition coefficient and cell permeability calculation methods available in PK-Sim, observed clinical data were best described by choosing the partition coefficient calculation by Rodgers and Rowland and cellular permeability calculation by PK-Sim Standard.
2.3.3 Metabolism and Elimination
Two metabolic pathways were implement in the model:
- Saturable CYP2C19 mediated metabolization.
- Linear FMO mediated to account for lumped non-CYP metabolization.
Data after repeated dosing indicates some sort of time-dependent elimination. The addition of an inhibitory metabolite may be an explanation. However, it would be very challenging to incorporate the kinetics of such a metabolite in the existing model, taking into account that no data on IC50 or Ki are available for such a metabolite. Therefore, it was decided to account for the time-dependency by simply including a time-dependent autoinhibition on CYP2C19 enzyme system.
Given the available data, the parameters Kinact and Kinact_half defining the time-dependent autoinhibition could not be estimated together (not separately identifiable). Assuming Kinact is enzyme but not substance specific, it was decided to fix Kinact to the value reported by Wu 2014 for omeprazole and only estimate Kinact_half.
2.3.4 Automated Parameter Identification
Following parameter values were estimated for the base model:
-
Km_2C19
-
Vmax_2C19
-
Intrinsic Clearance FMO (i.e. non CYP2C19 metabolism)
-
Kinacthalf CYP2C19 for time-dependent autoinhibition
3 Results and Discussion
The next sections show:
- Final model input parameters for the building blocks: Section 3.1.
- Overall goodness of fit: Section 3.2.
- Simulated vs. observed concentration-time profiles for the clinical studies used for model building and for model verification: Section 3.3.
3.1 Final input parameters
The parameter values of the final PBPK model are illustrated below.
Compound: Moclobemide
Parameters
| Name | Value | Value Origin | Alternative | Default |
|---|---|---|---|---|
| Solubility at reference pH | 3 mg/ml | Internet-Moclobemide, INCHEM | Measurement | True |
| Reference pH | 6.8 | Internet-Moclobemide, INCHEM | Measurement | True |
| Lipophilicity | 1.79 Log Units | Publication-Pons 1990 | logD | True |
| Fraction unbound (plasma, reference value) | 0.5 | Other-MHRA Label Moclobemide | Measurement | True |
| Cl | 1 | Database-DrugBank DB01171 | ||
| Is small molecule | Yes | |||
| Molecular weight | 268.74 g/mol | Database-DrugBank DB01171 | ||
| Plasma protein binding partner | Albumin |
Calculation methods
| Name | Value |
|---|---|
| Partition coefficients | Rodgers and Rowland |
| Cellular permeabilities | PK-Sim Standard |
Processes
Metabolizing Enzyme: CYP2C19-Intrinsic-CL_MM_fit
Species: Human
Molecule: CYP2C19
Parameters
| Name | Value | Value Origin |
|---|---|---|
| Vmax (liver tissue) | 2.03 µmol/min/kg tissue | Parameter Identification |
| Km | 1.11 µmol/l | Parameter Identification |
Metabolizing Enzyme: FMO_other-Intrinsic-CL-fit
Species: Human
Molecule: FMO_other
Parameters
| Name | Value | Value Origin |
|---|---|---|
| Intrinsic clearance | 0.24 l/min | Parameter Identification |
Systemic Process: Renal Clearances-Schoerlin 1987
Species: Human
Parameters
| Name | Value | Value Origin |
|---|---|---|
| Fraction unbound (experiment) | 0.5 | |
| Plasma clearance | 0.034 ml/min/kg | Publication-Schoerlin 1987 |
Inhibition: CYP2C19-Kramer-unbound
Molecule: CYP2C19
Parameters
| Name | Value | Value Origin |
|---|---|---|
| Ki | 203.82 µmol/l | Publication-Kramer-Nielsen 1996 |
Inhibition: CYP2C19-TimeDep_AutoInh-fit
Molecule: CYP2C19
Parameters
| Name | Value | Value Origin |
|---|---|---|
| kinact | 5 1/h | Publication-Wu2014 |
| K_kinact_half | 94.85 µmol/l | Parameter Identification |
Formulation: Moclobemide tablet
Type: Particle Dissolution
Parameters
| Name | Value | Value Origin |
|---|---|---|
| Thickness (unstirred water layer) | 20 µm | Publication-Willmann S, Thelen K, Becker C, et al. Mechanism-based prediction of particle size-dependent dissolution and absorption: cilostazol pharmacokinetics in dogs. Eur J Pharm Biopharm. 2010 Sep;76(1):83-94 https://doi.org/10.1016/j.ejpb.2010.06.003 |
| Type of particle size distribution | Monodisperse | |
| Particle radius (mean) | 10 µm |
3.2 Diagnostics Plots
The following section displays the goodness-of-fit visual diagnostic plots for the PBPK model performance of all data listed in Section 2.2.2.
The first plot shows observed versus simulated plasma concentration, the second weighted residuals versus time.
Table 3-1: GMFE for Moclobemide concentration in plasma
| Group | GMFE |
|---|---|
| iv administration (model building) | 1.29 |
| Oral administration (model building) | 1.56 |
| Oral administration (model validation) | 1.31 |
| All | 1.46 |
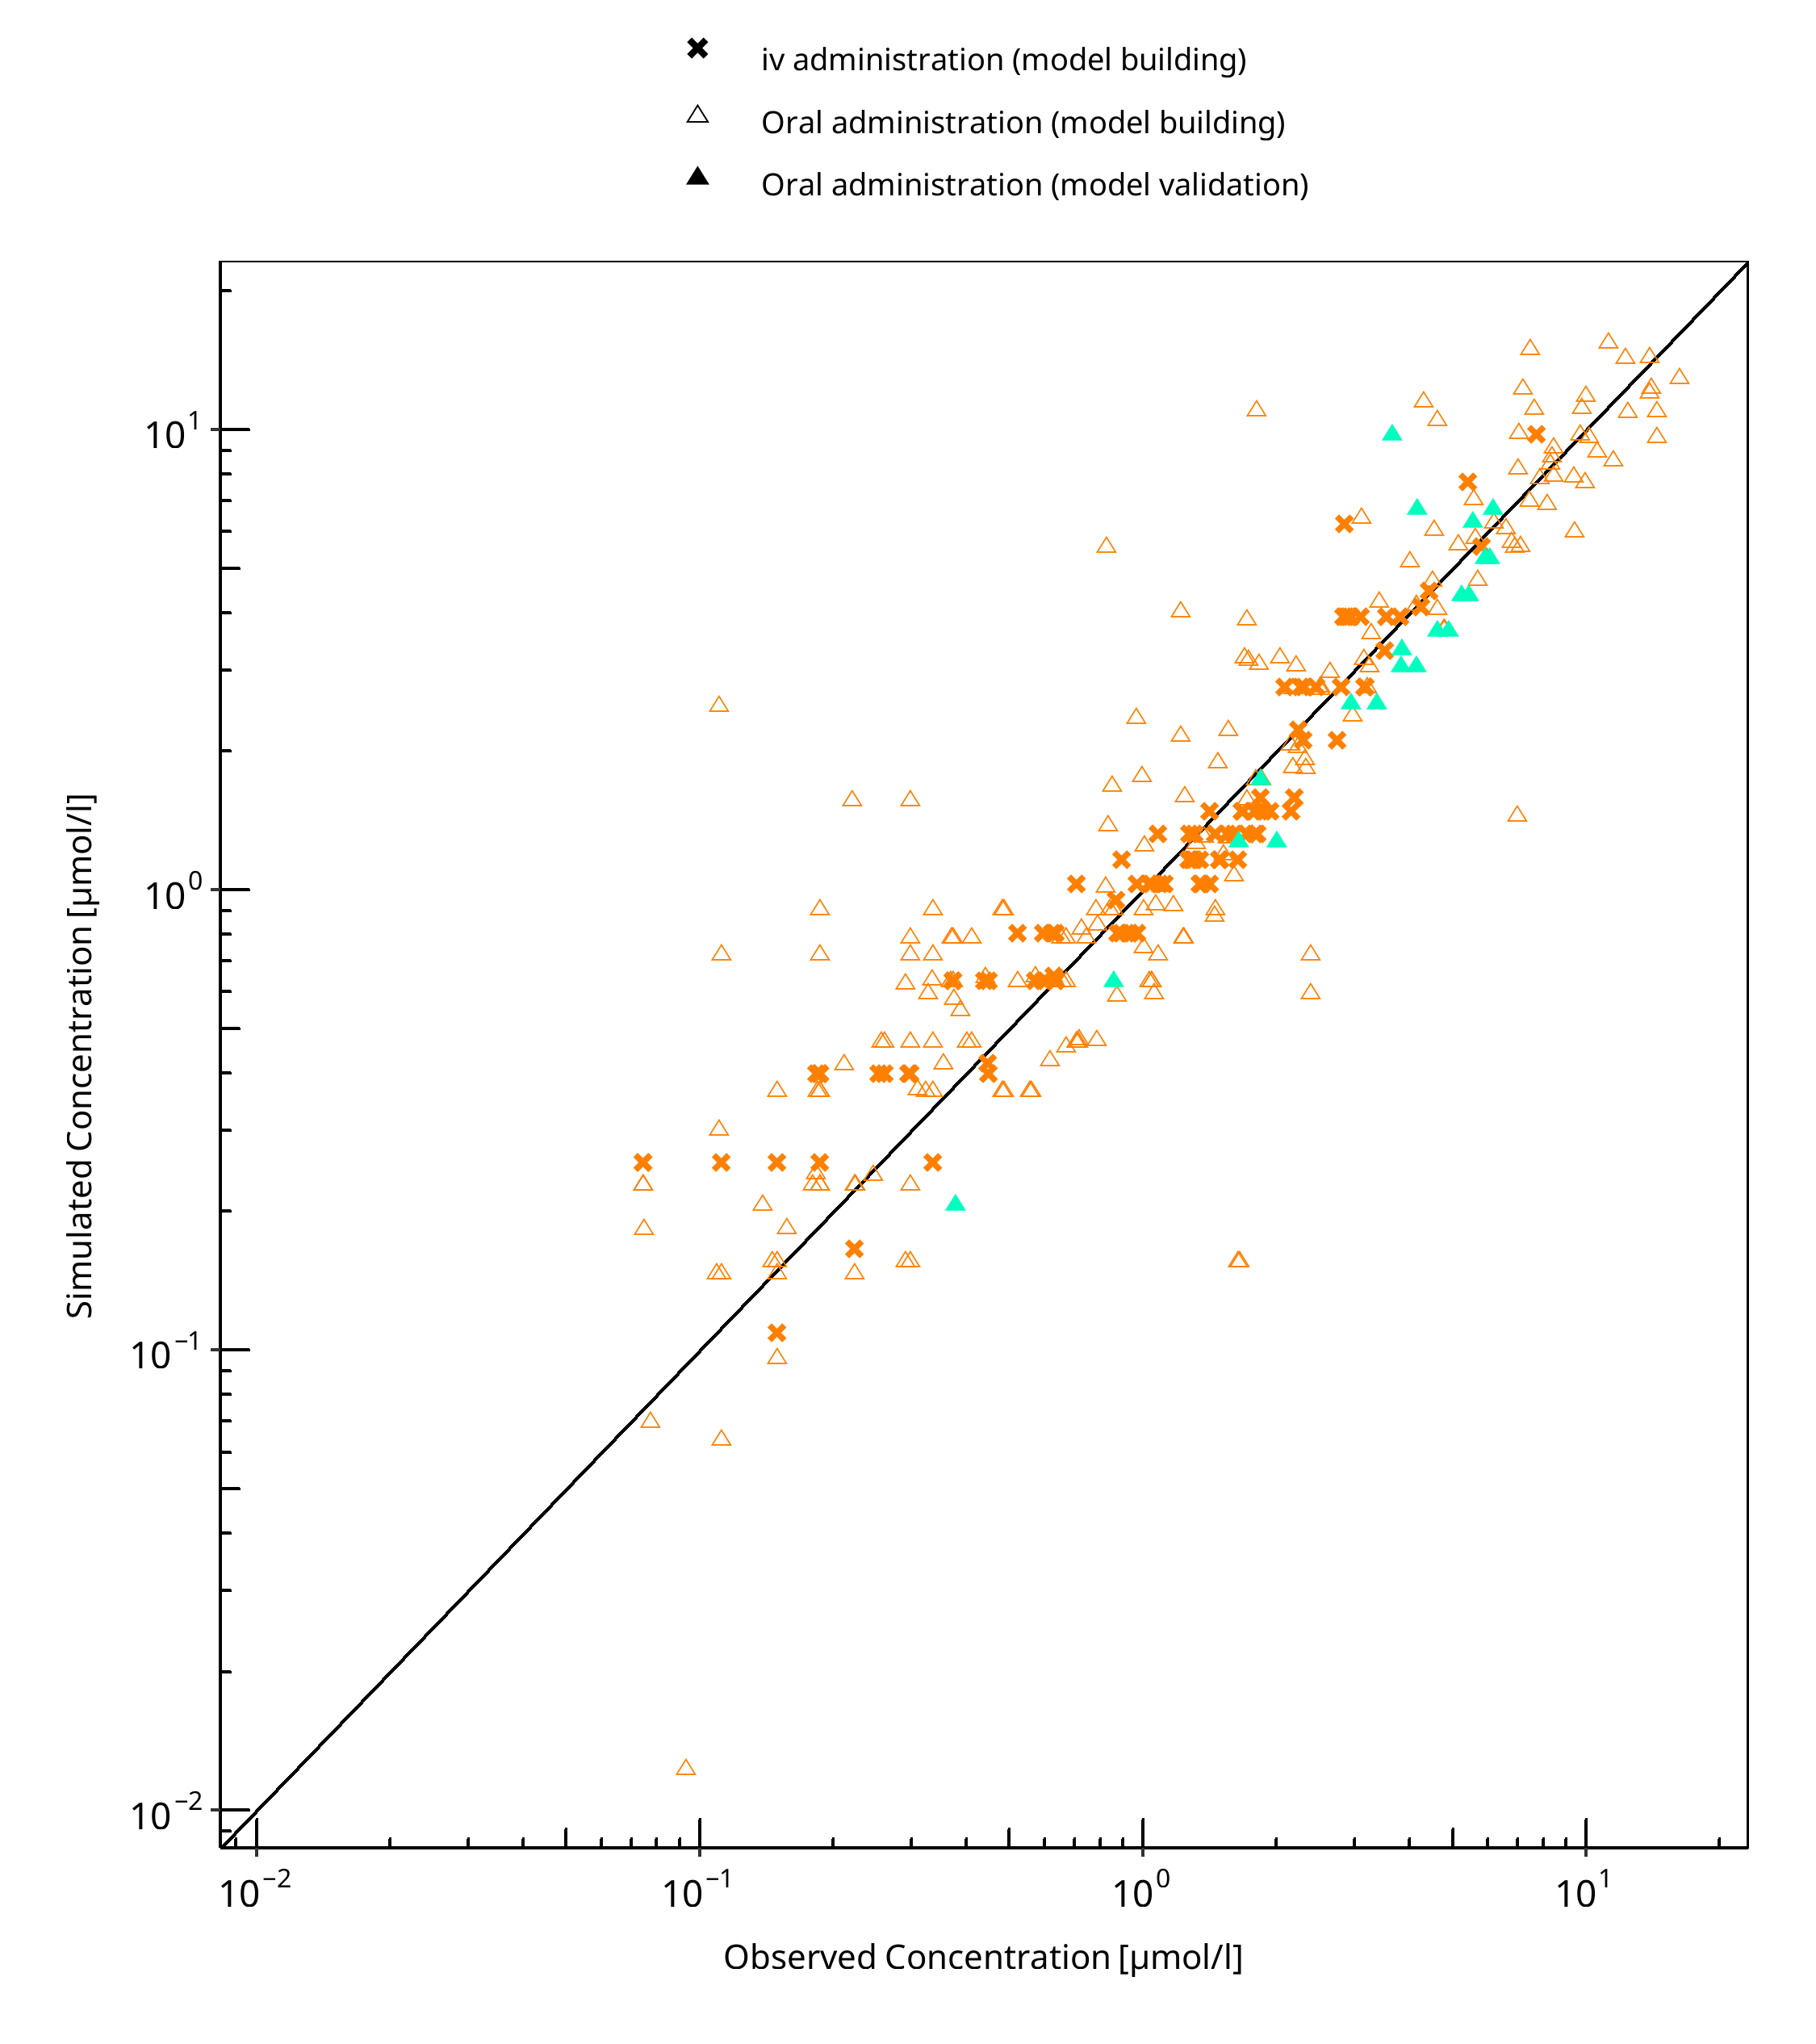
Figure 3-1: Moclobemide concentration in plasma
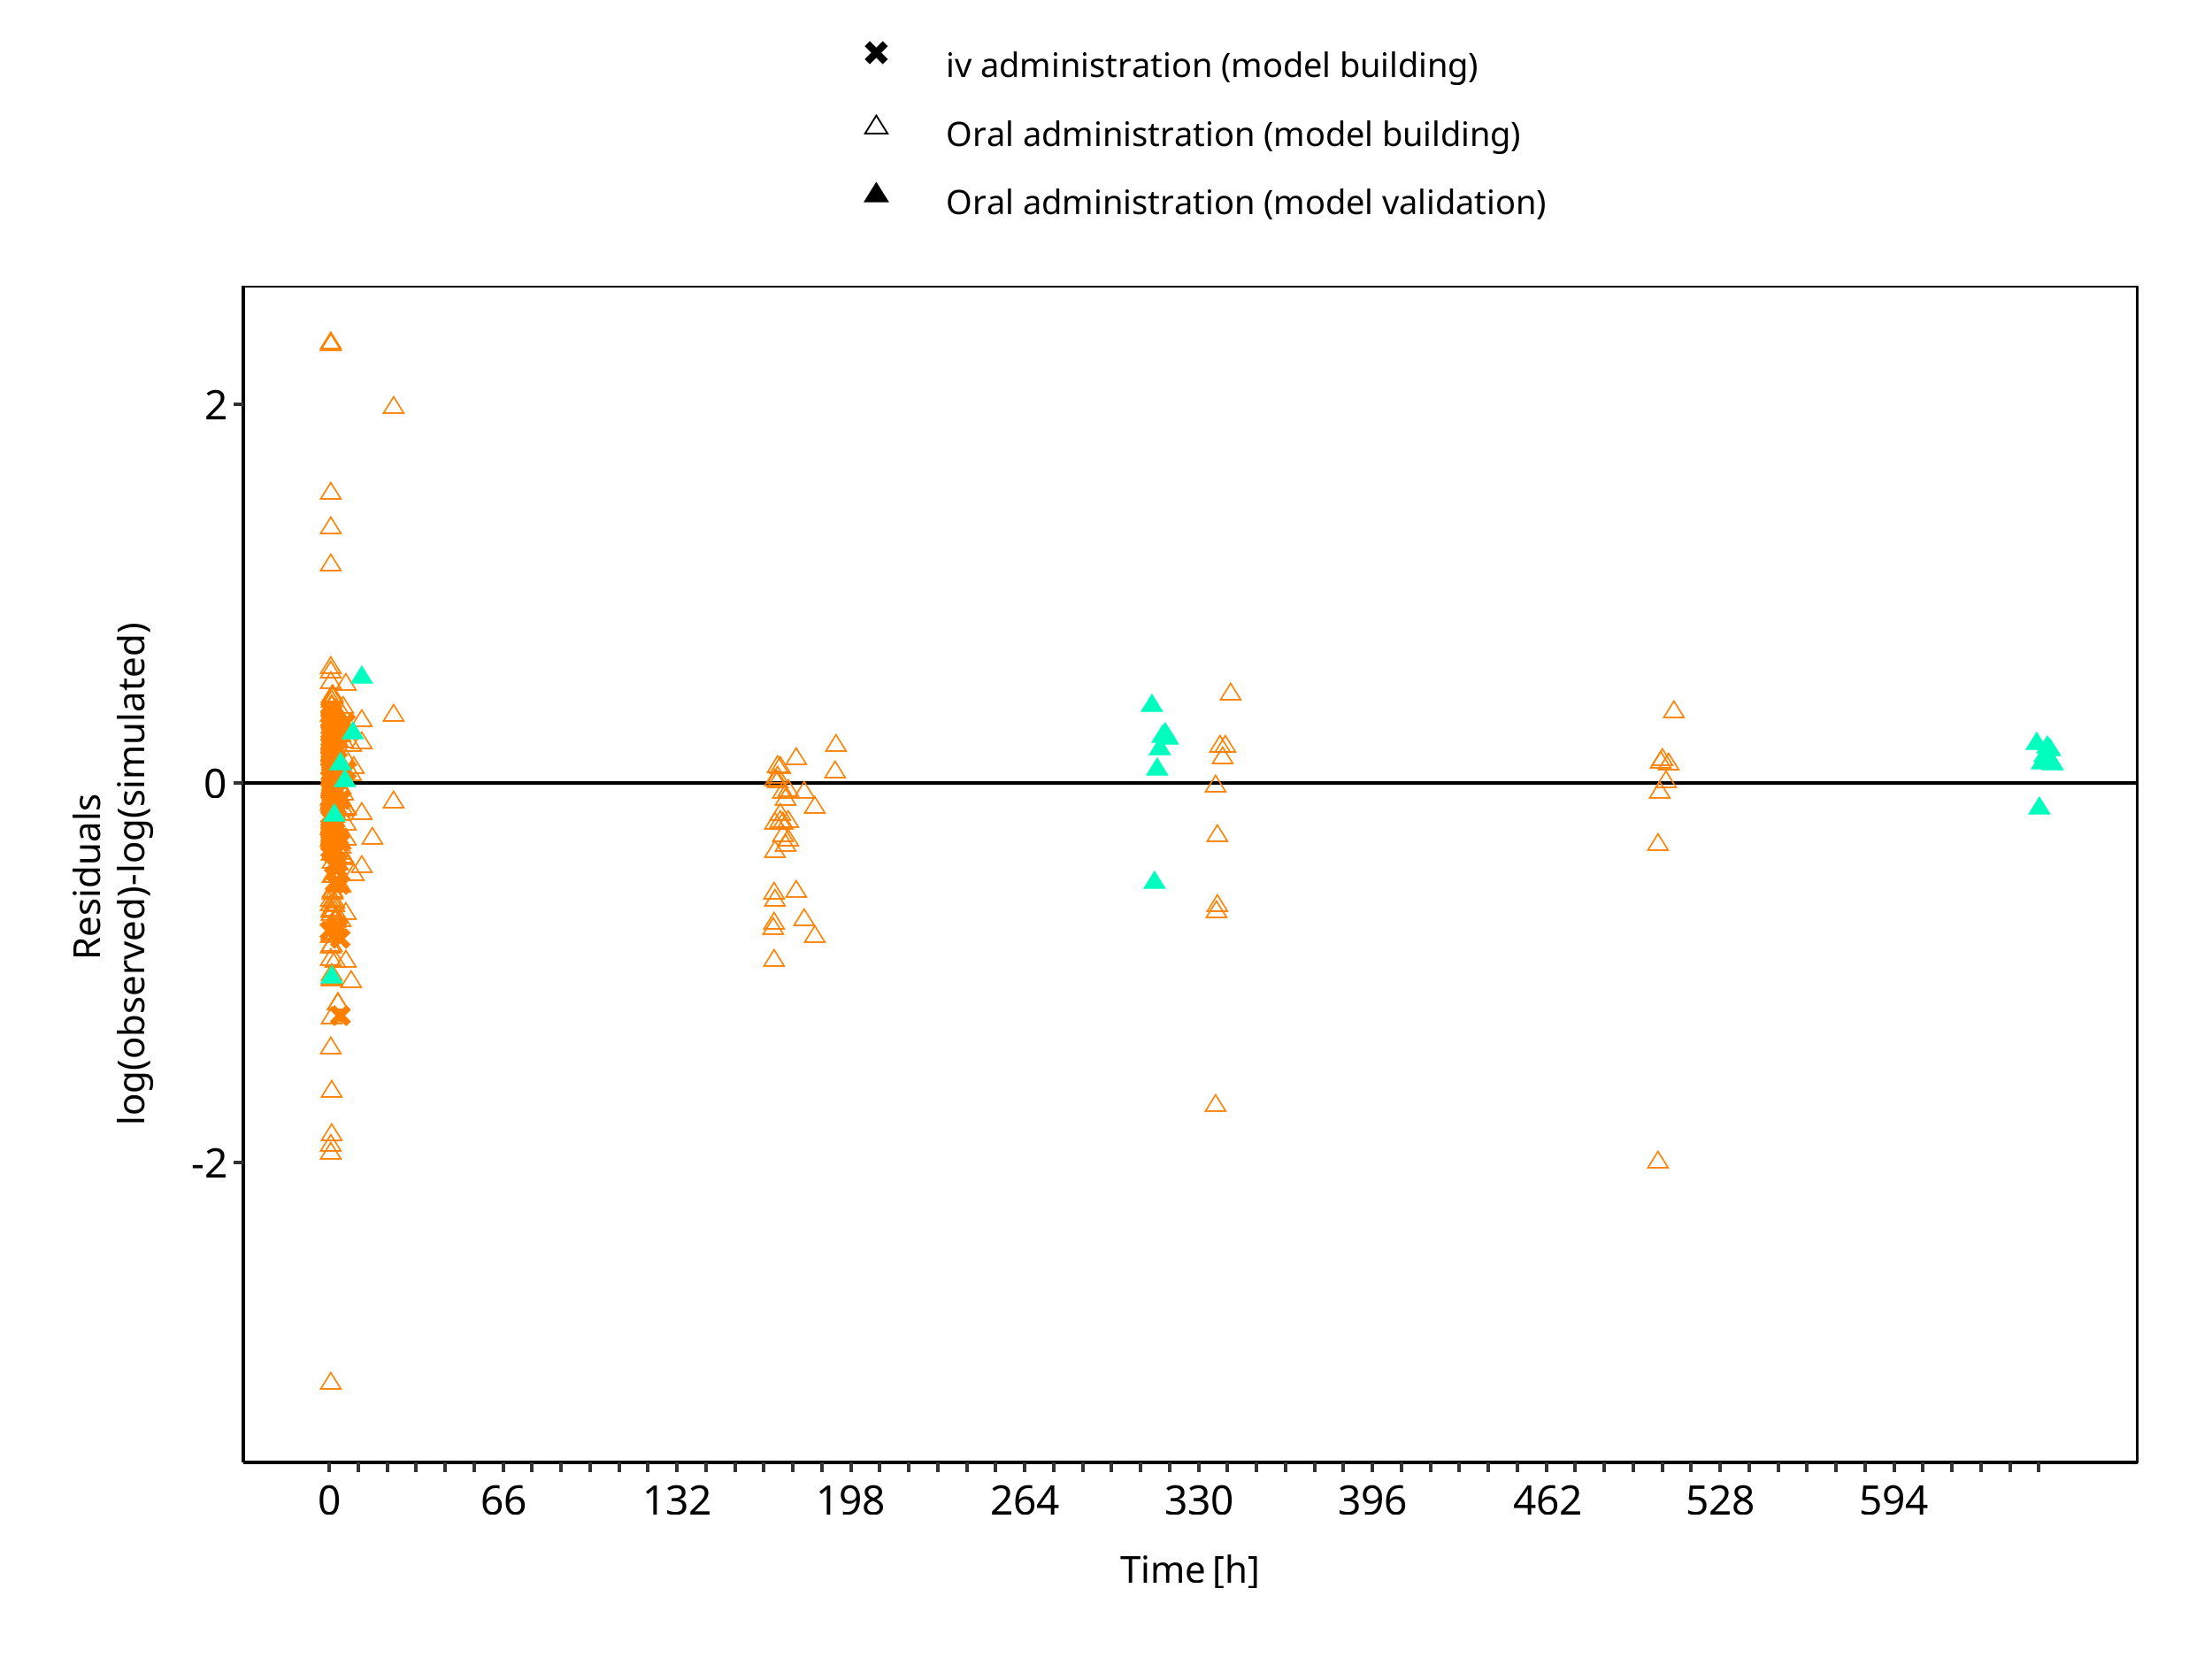
Figure 3-2: Moclobemide concentration in plasma
3.3 Concentration-Time Profiles
Simulated versus observed concentration-time profiles of all data listed in Section 2.2.2 are presented below.
3.3.1 Model Building
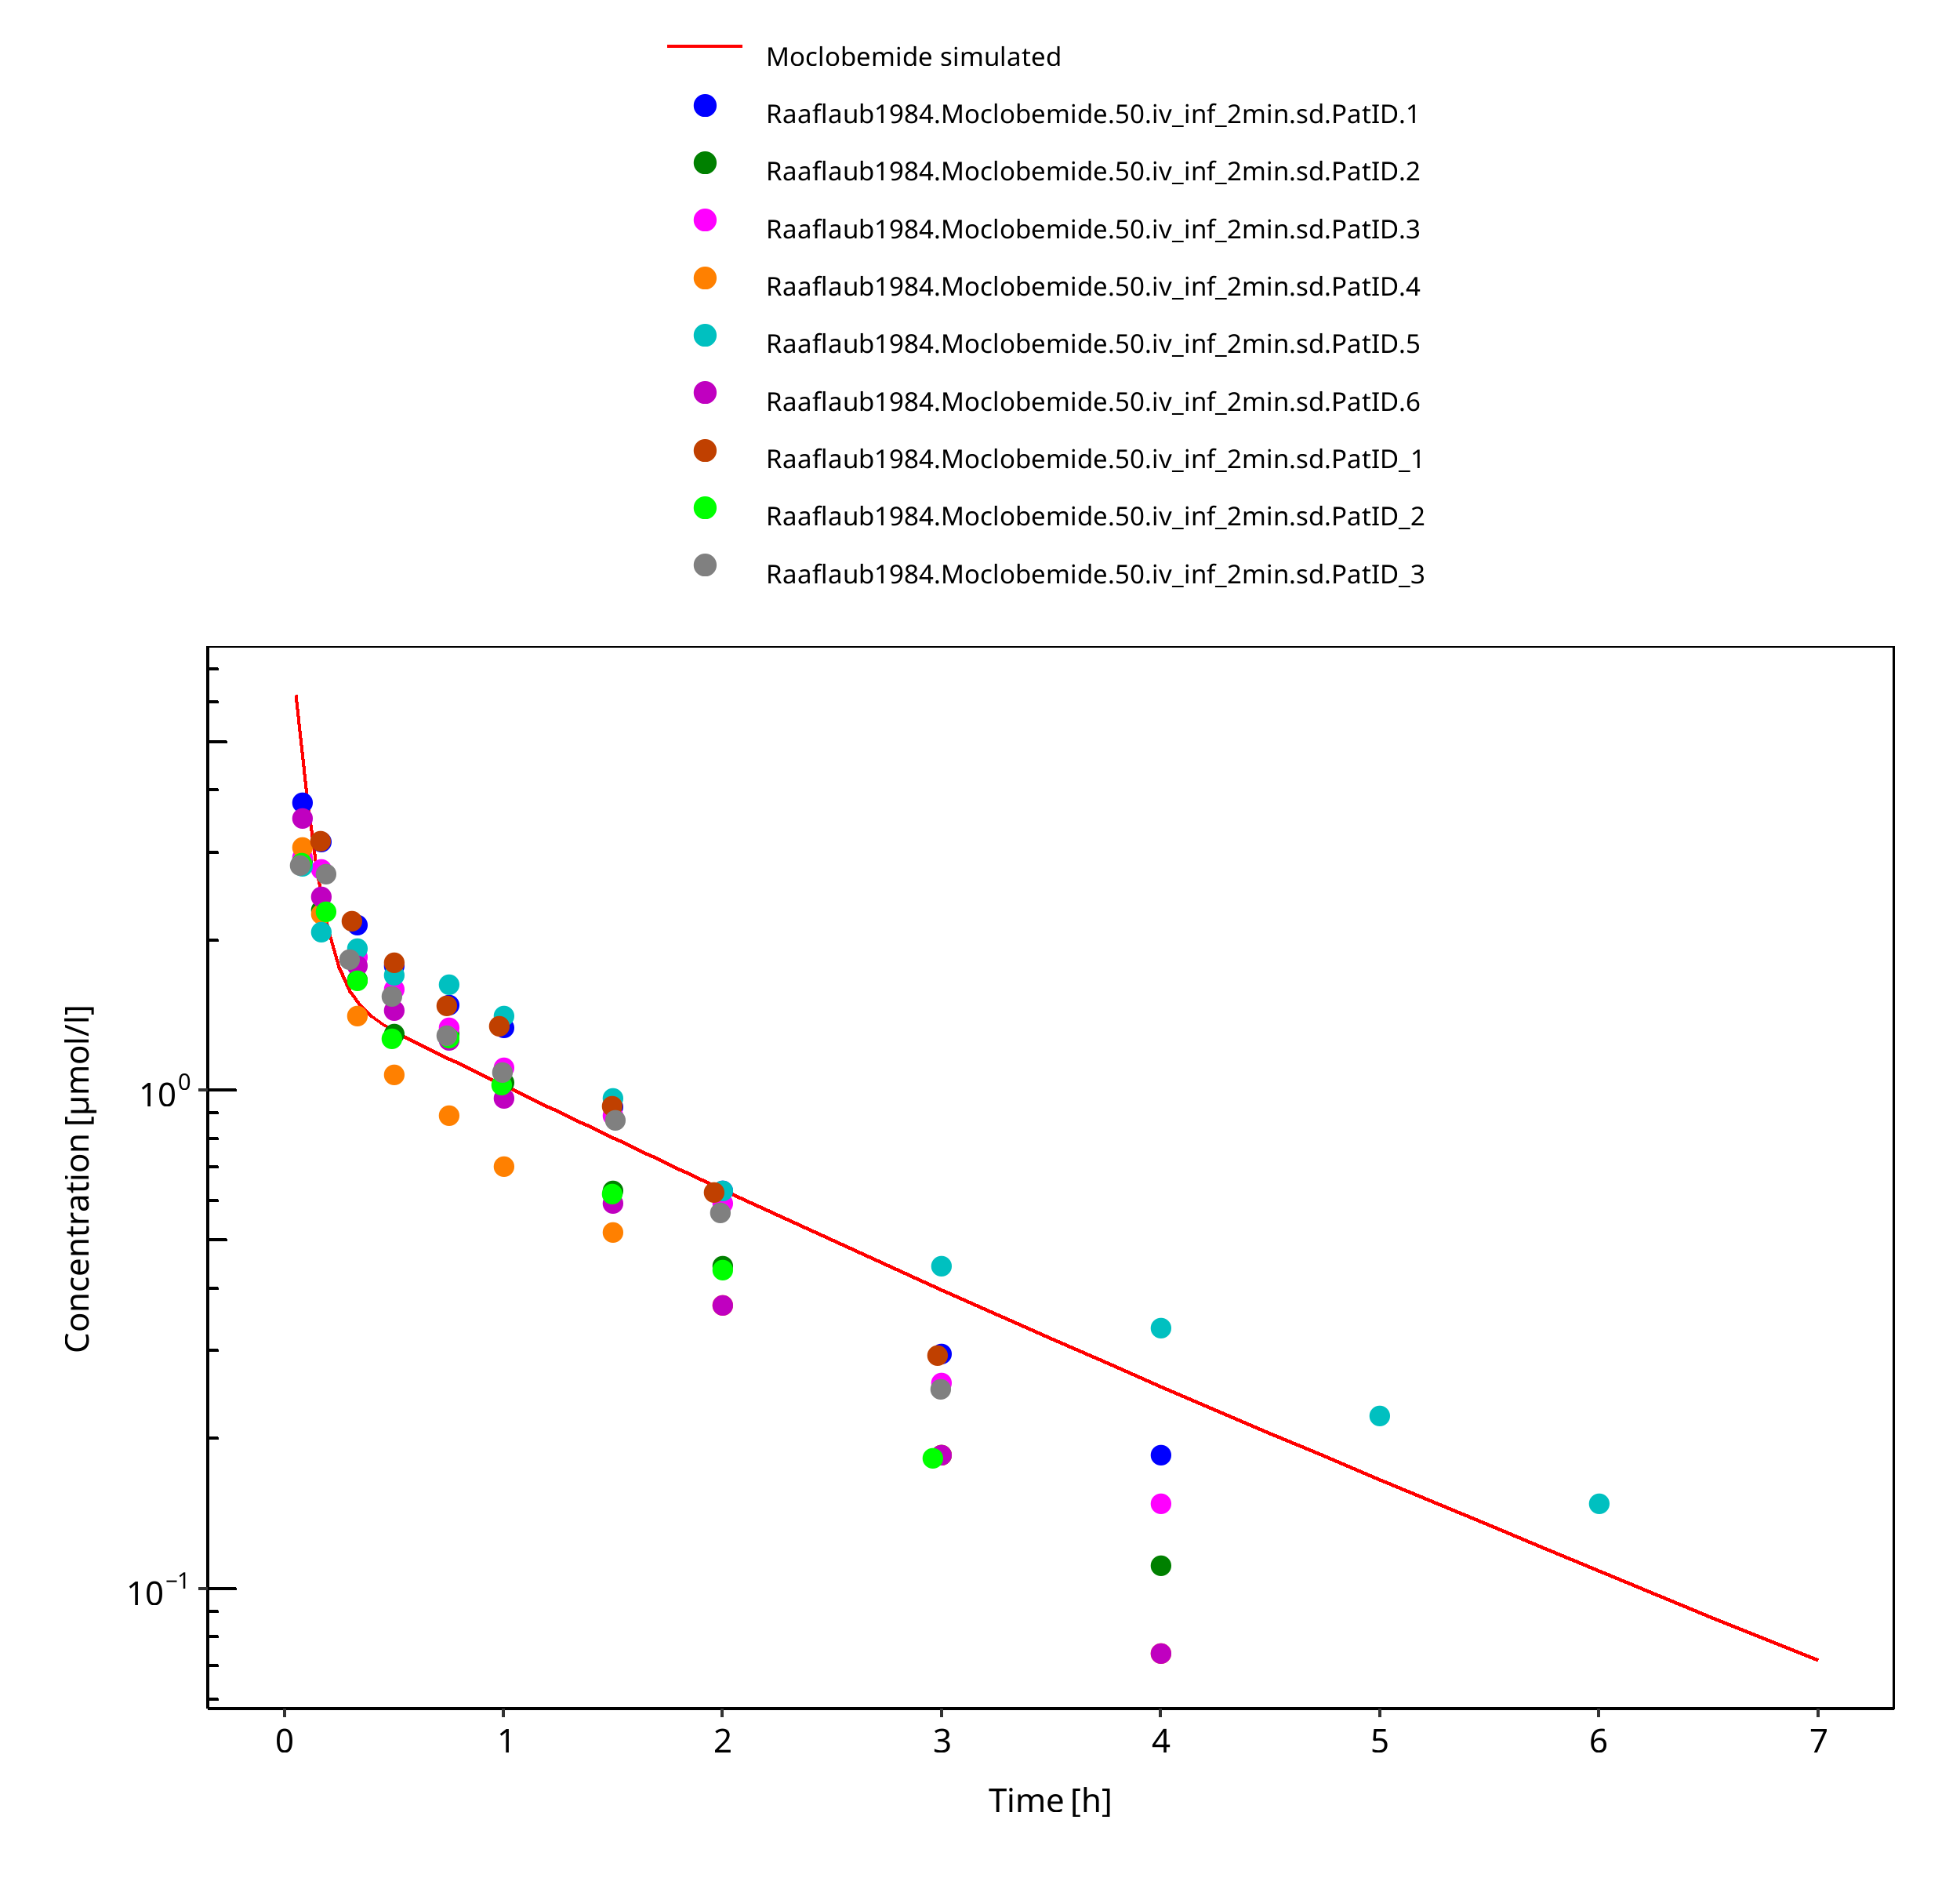
Figure 3-3: 50 mg moclobemide iv
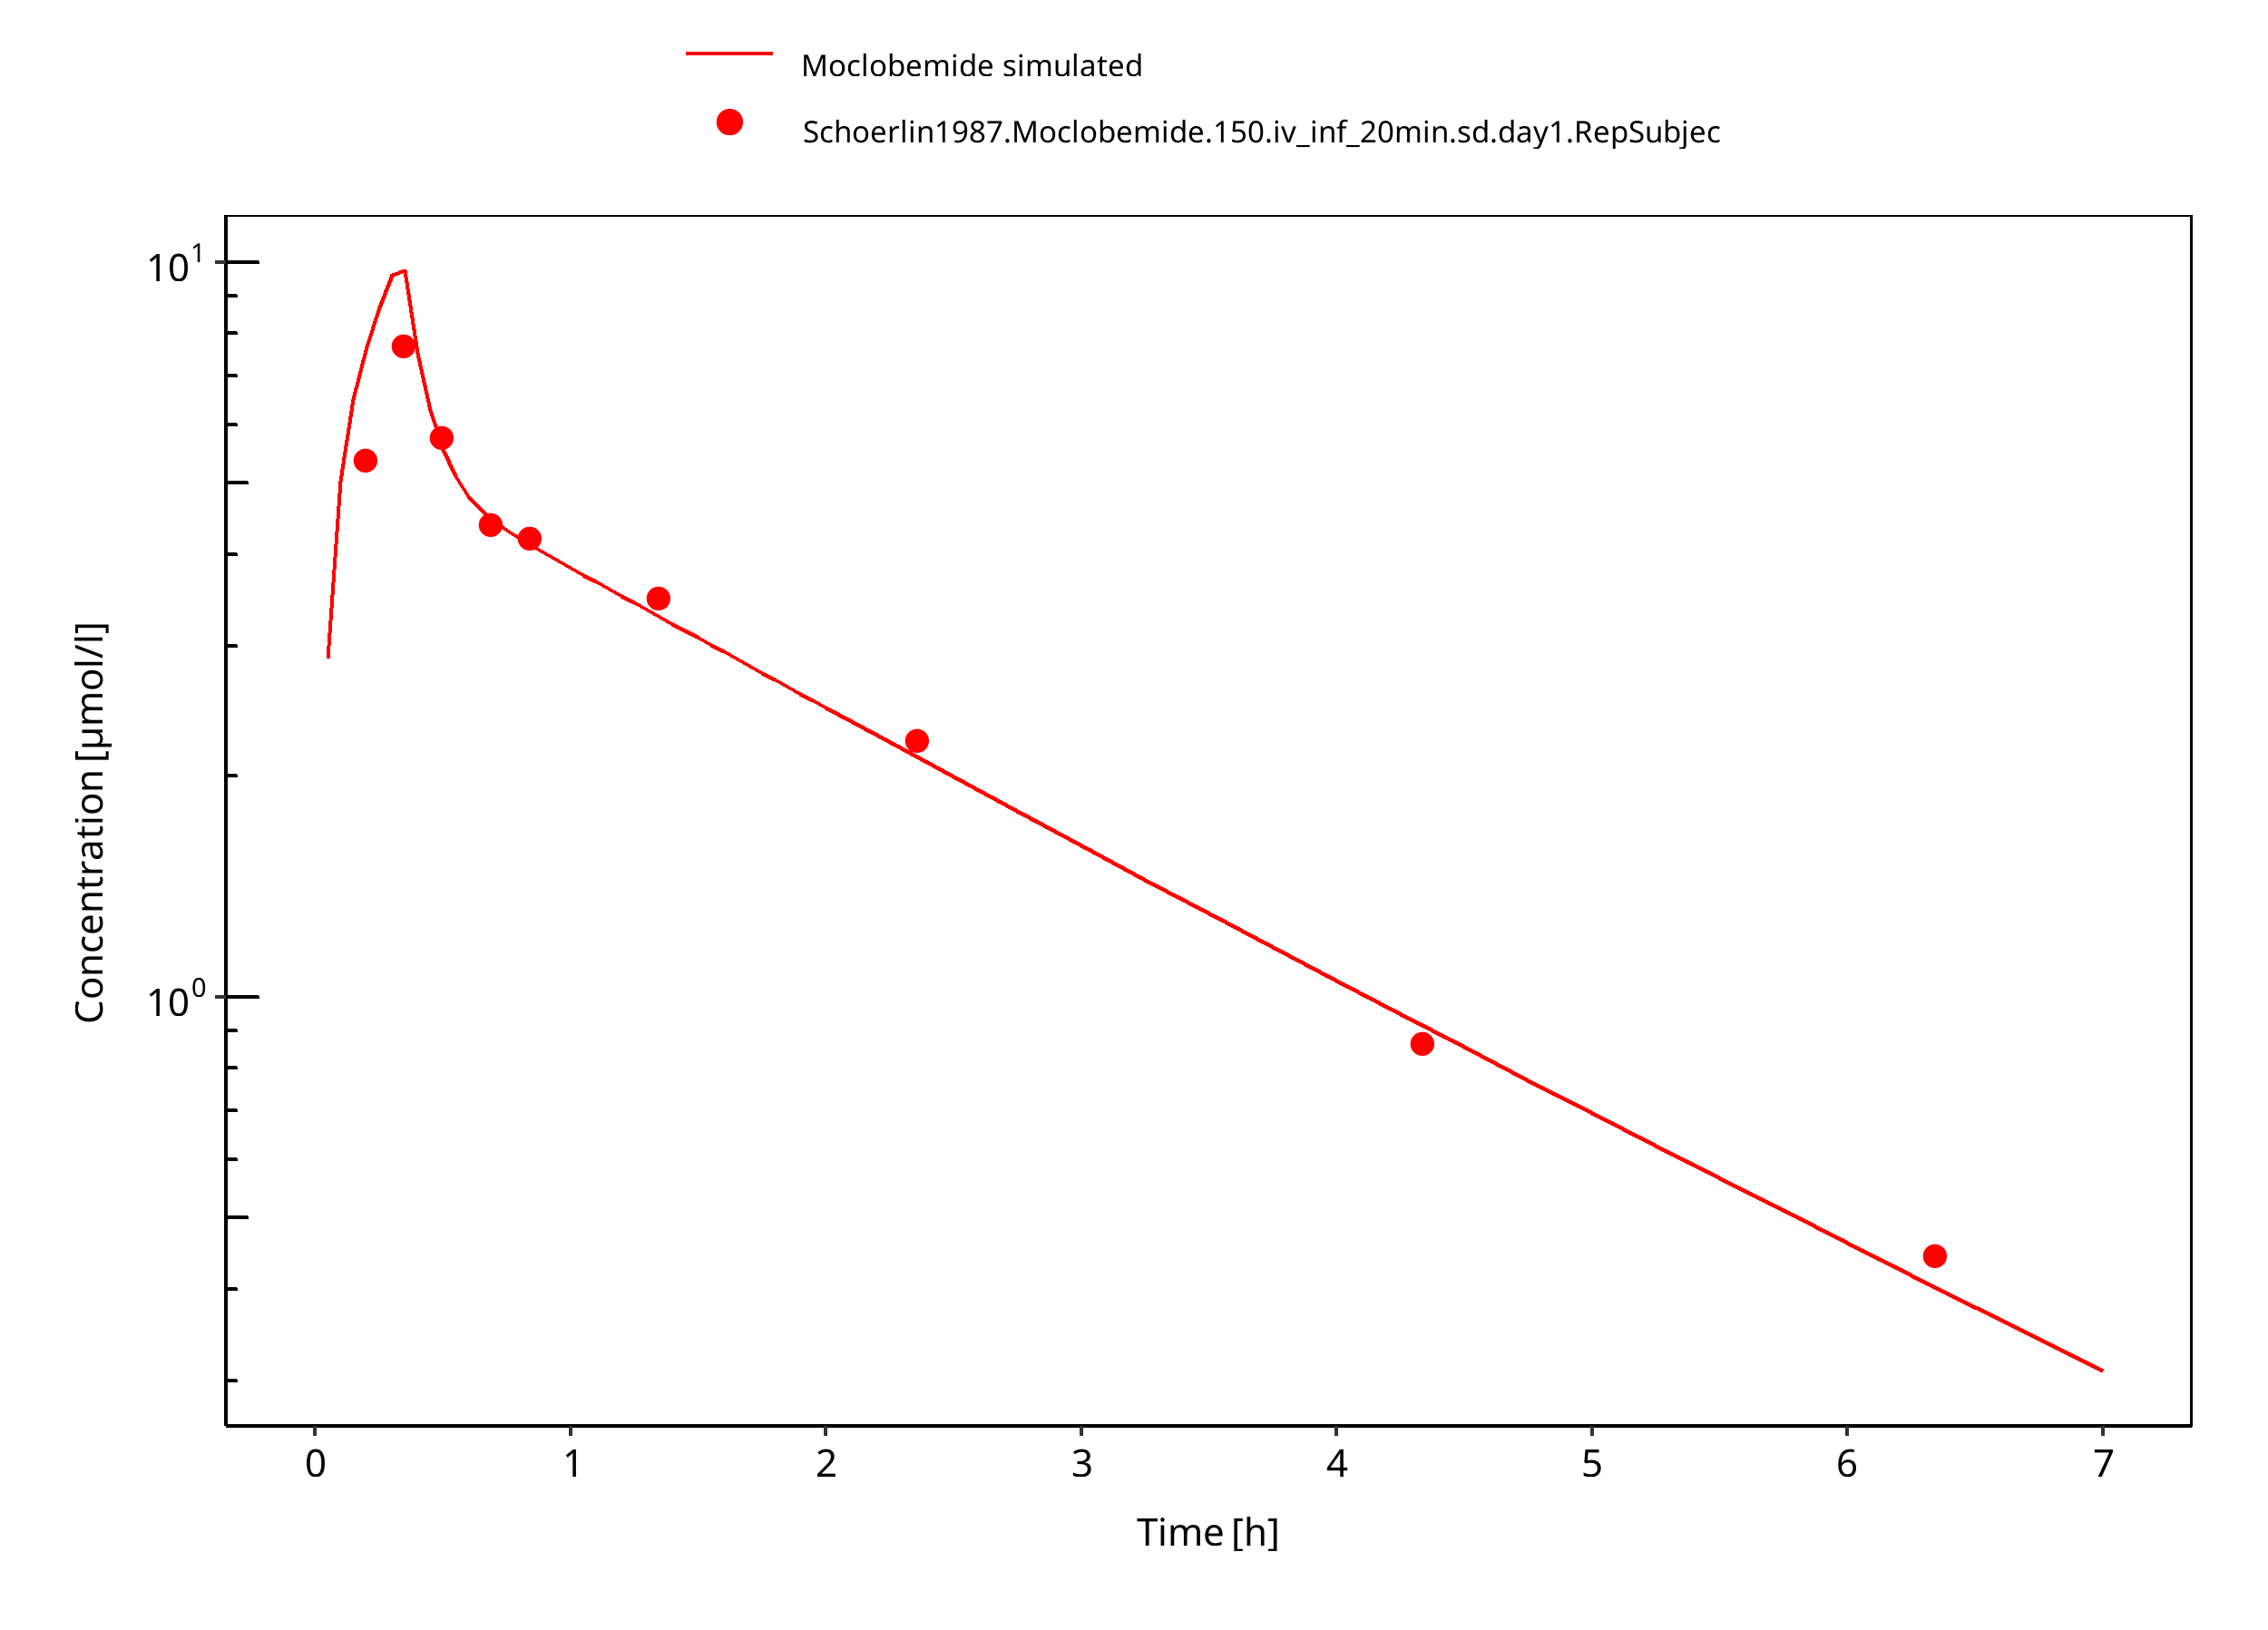
Figure 3-4: 150 mg moclobemide iv 20min
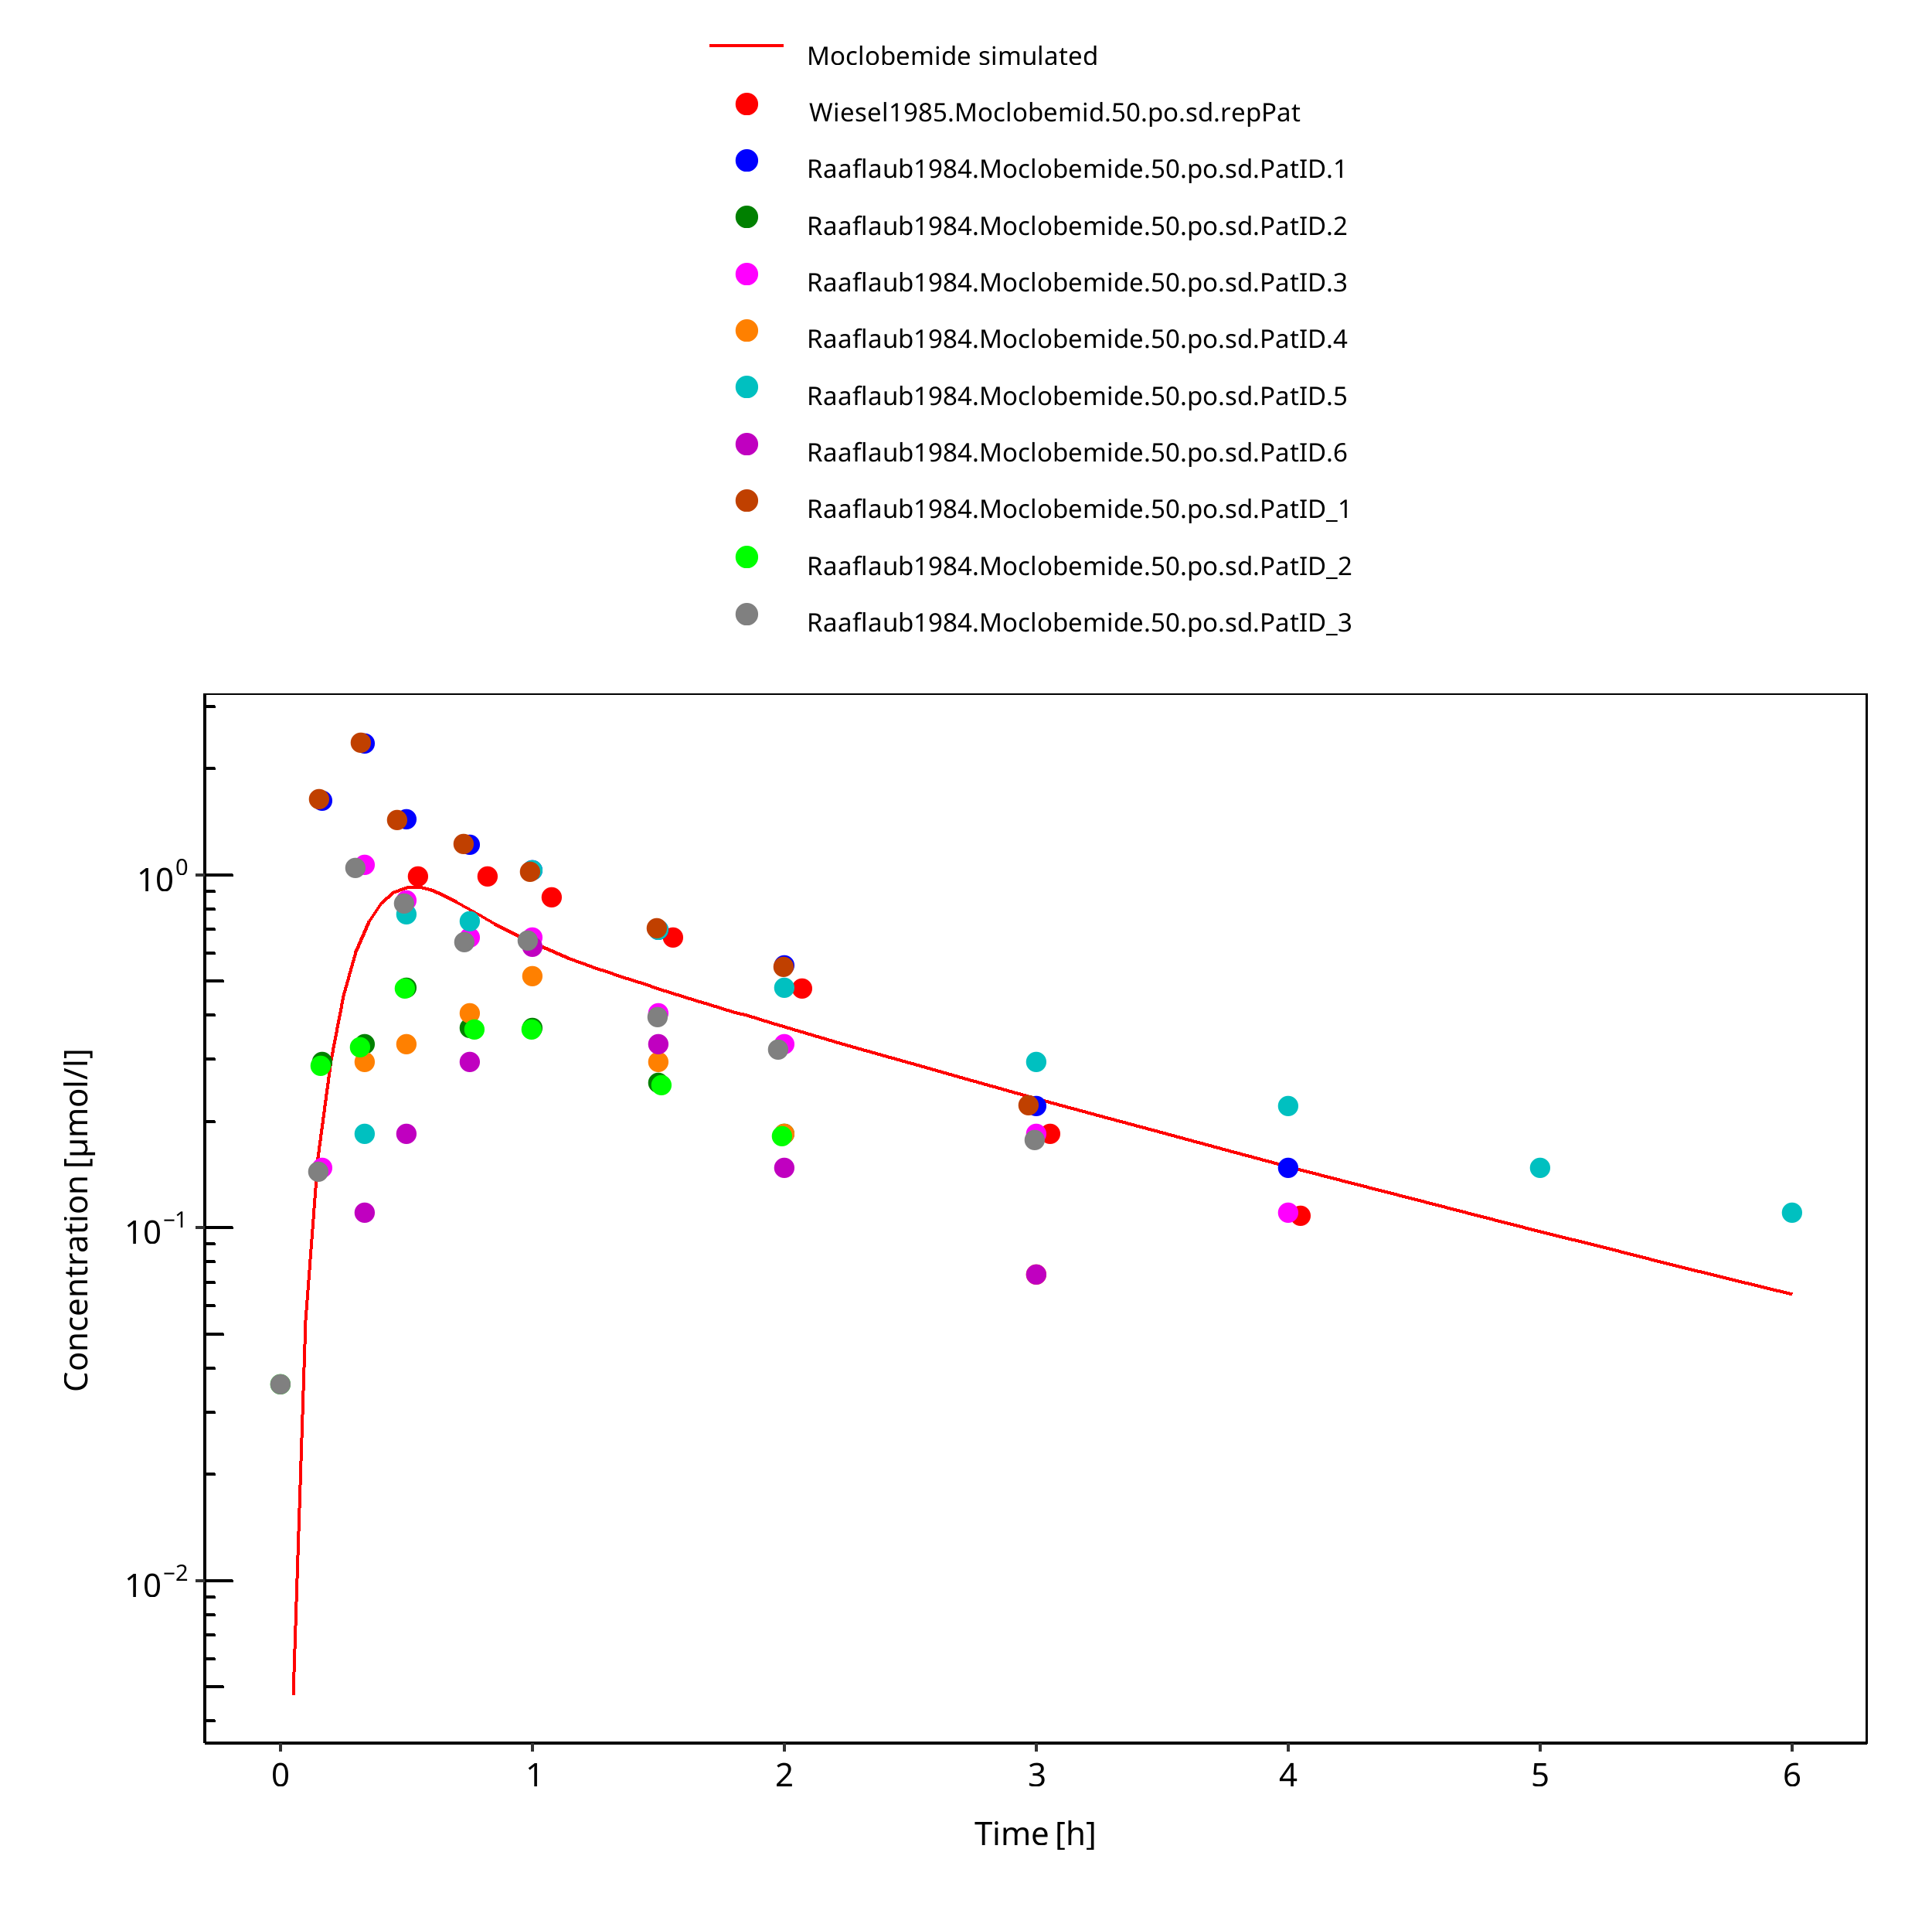
Figure 3-5: 50 mg moclobemide po
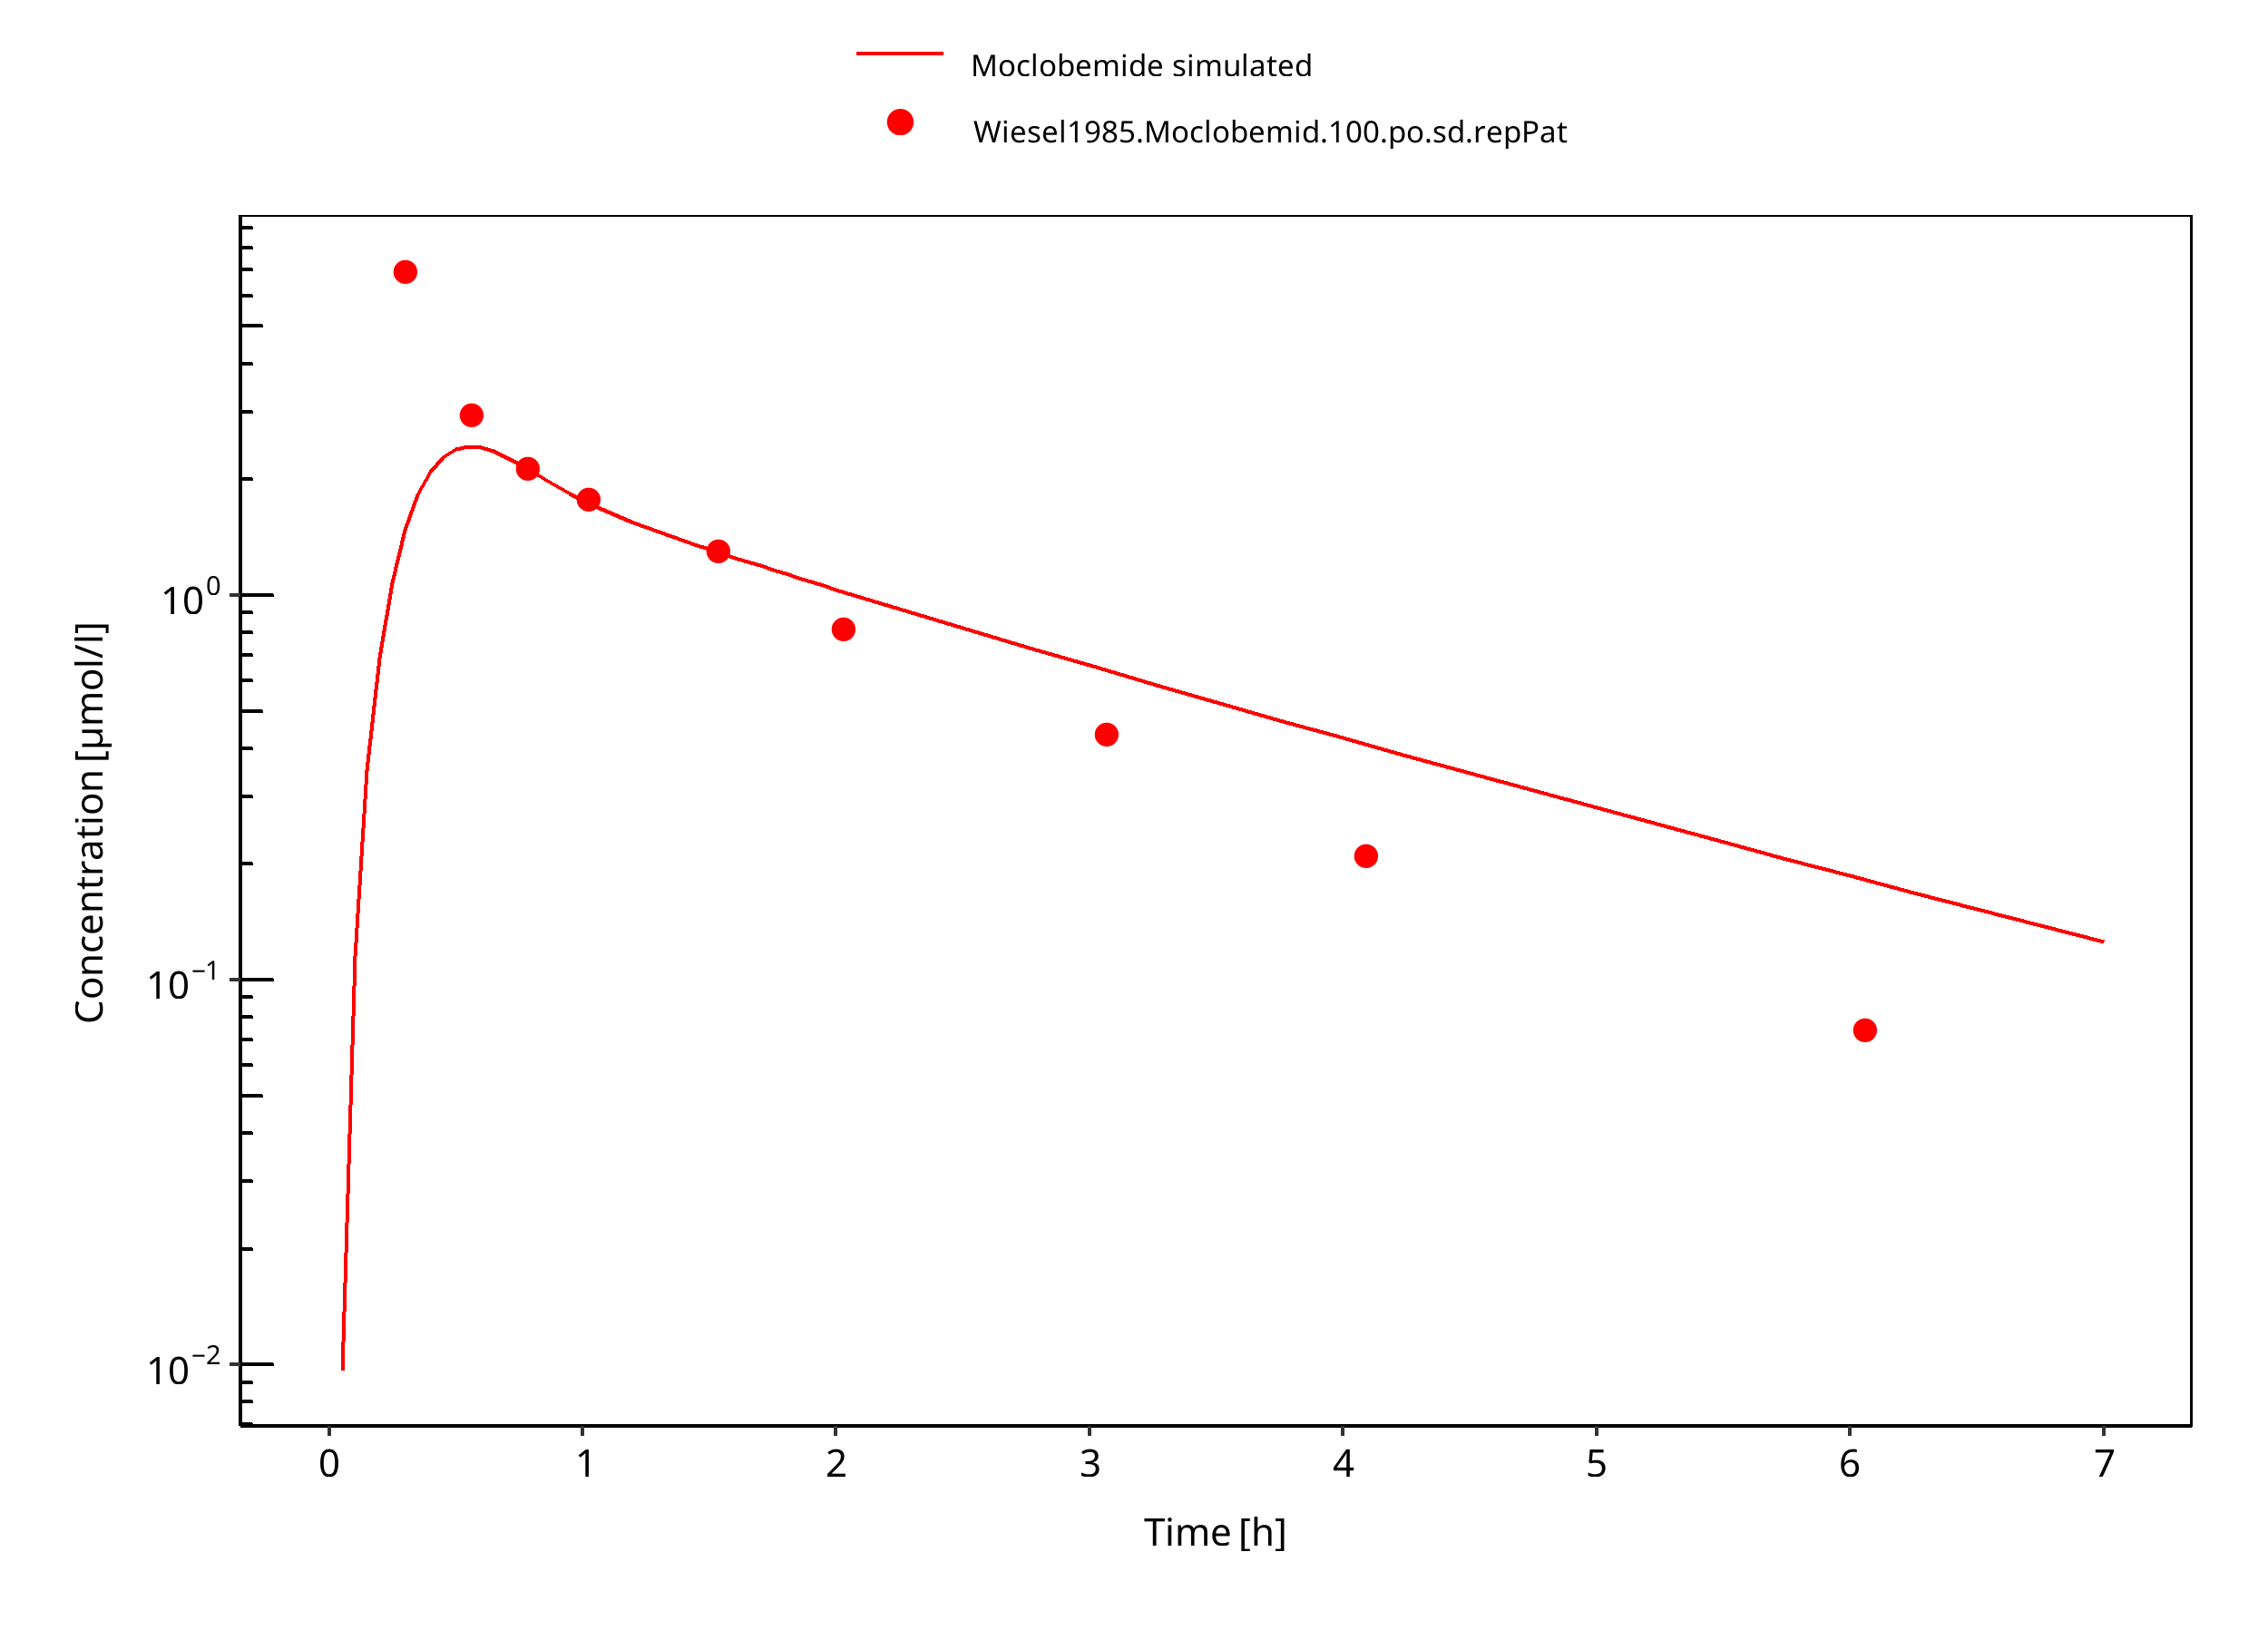
Figure 3-6: 100 mg moclobemide po
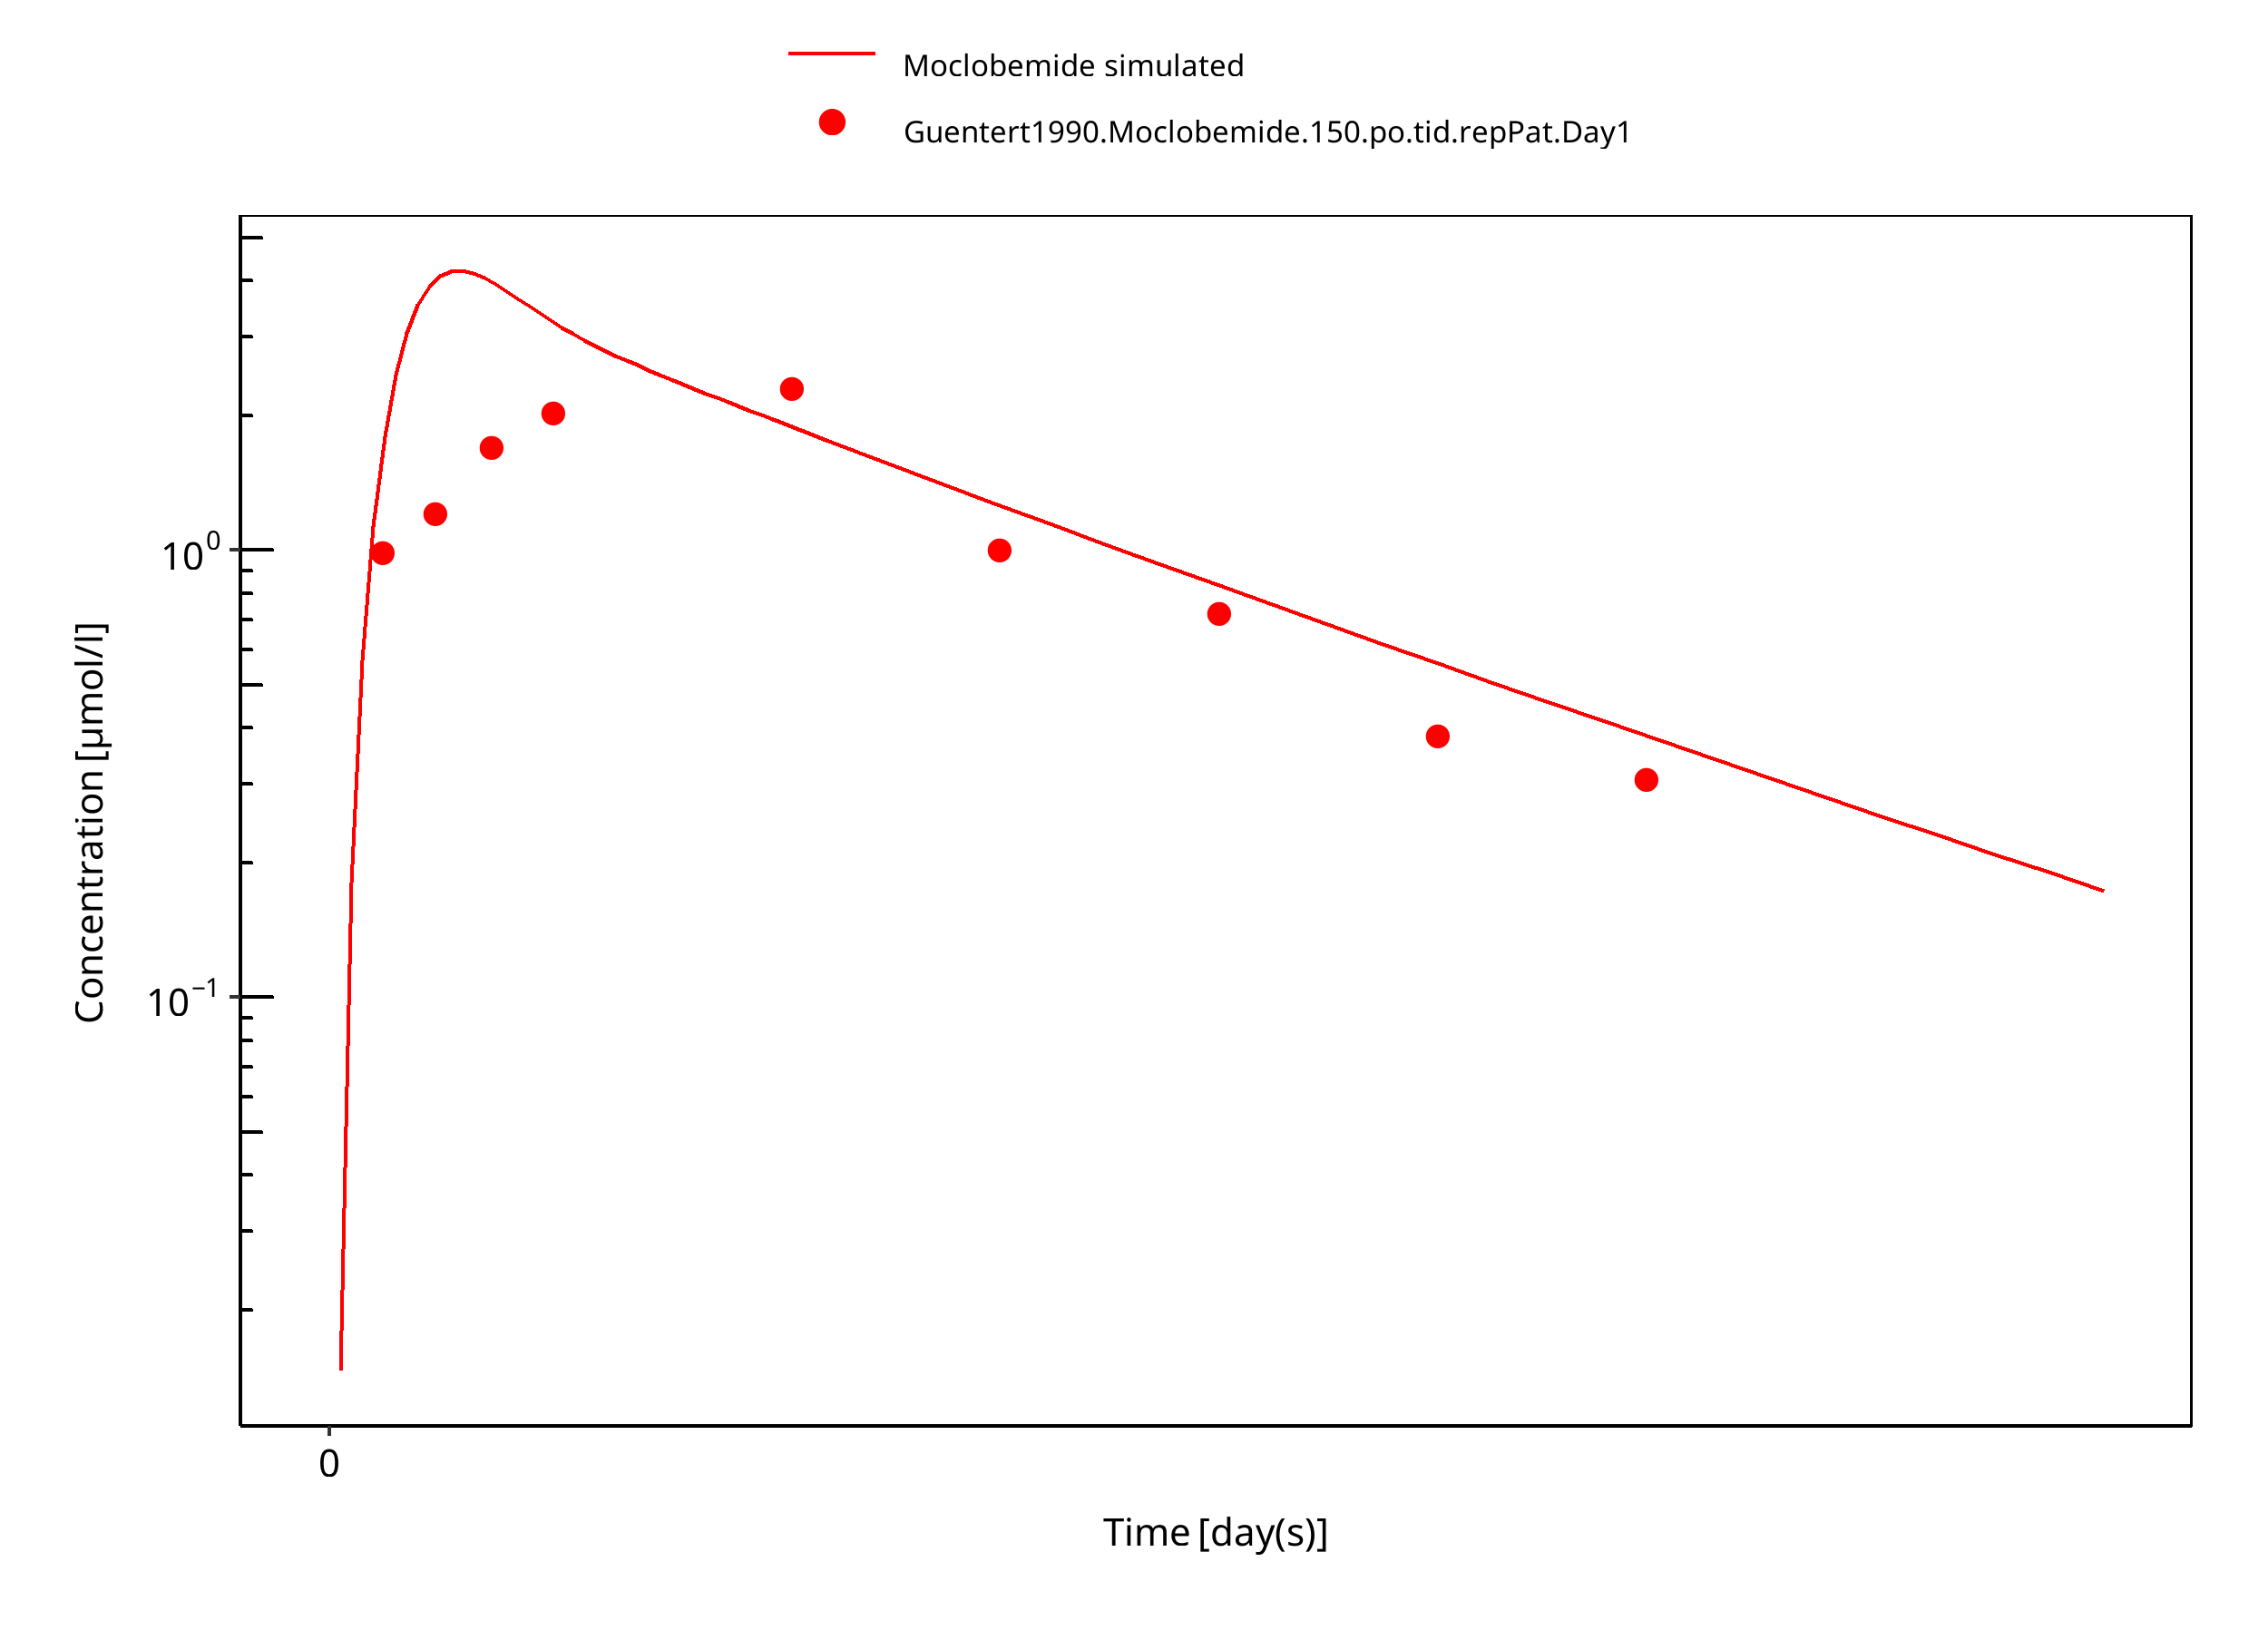
Figure 3-7: 150 mg moclobemide po
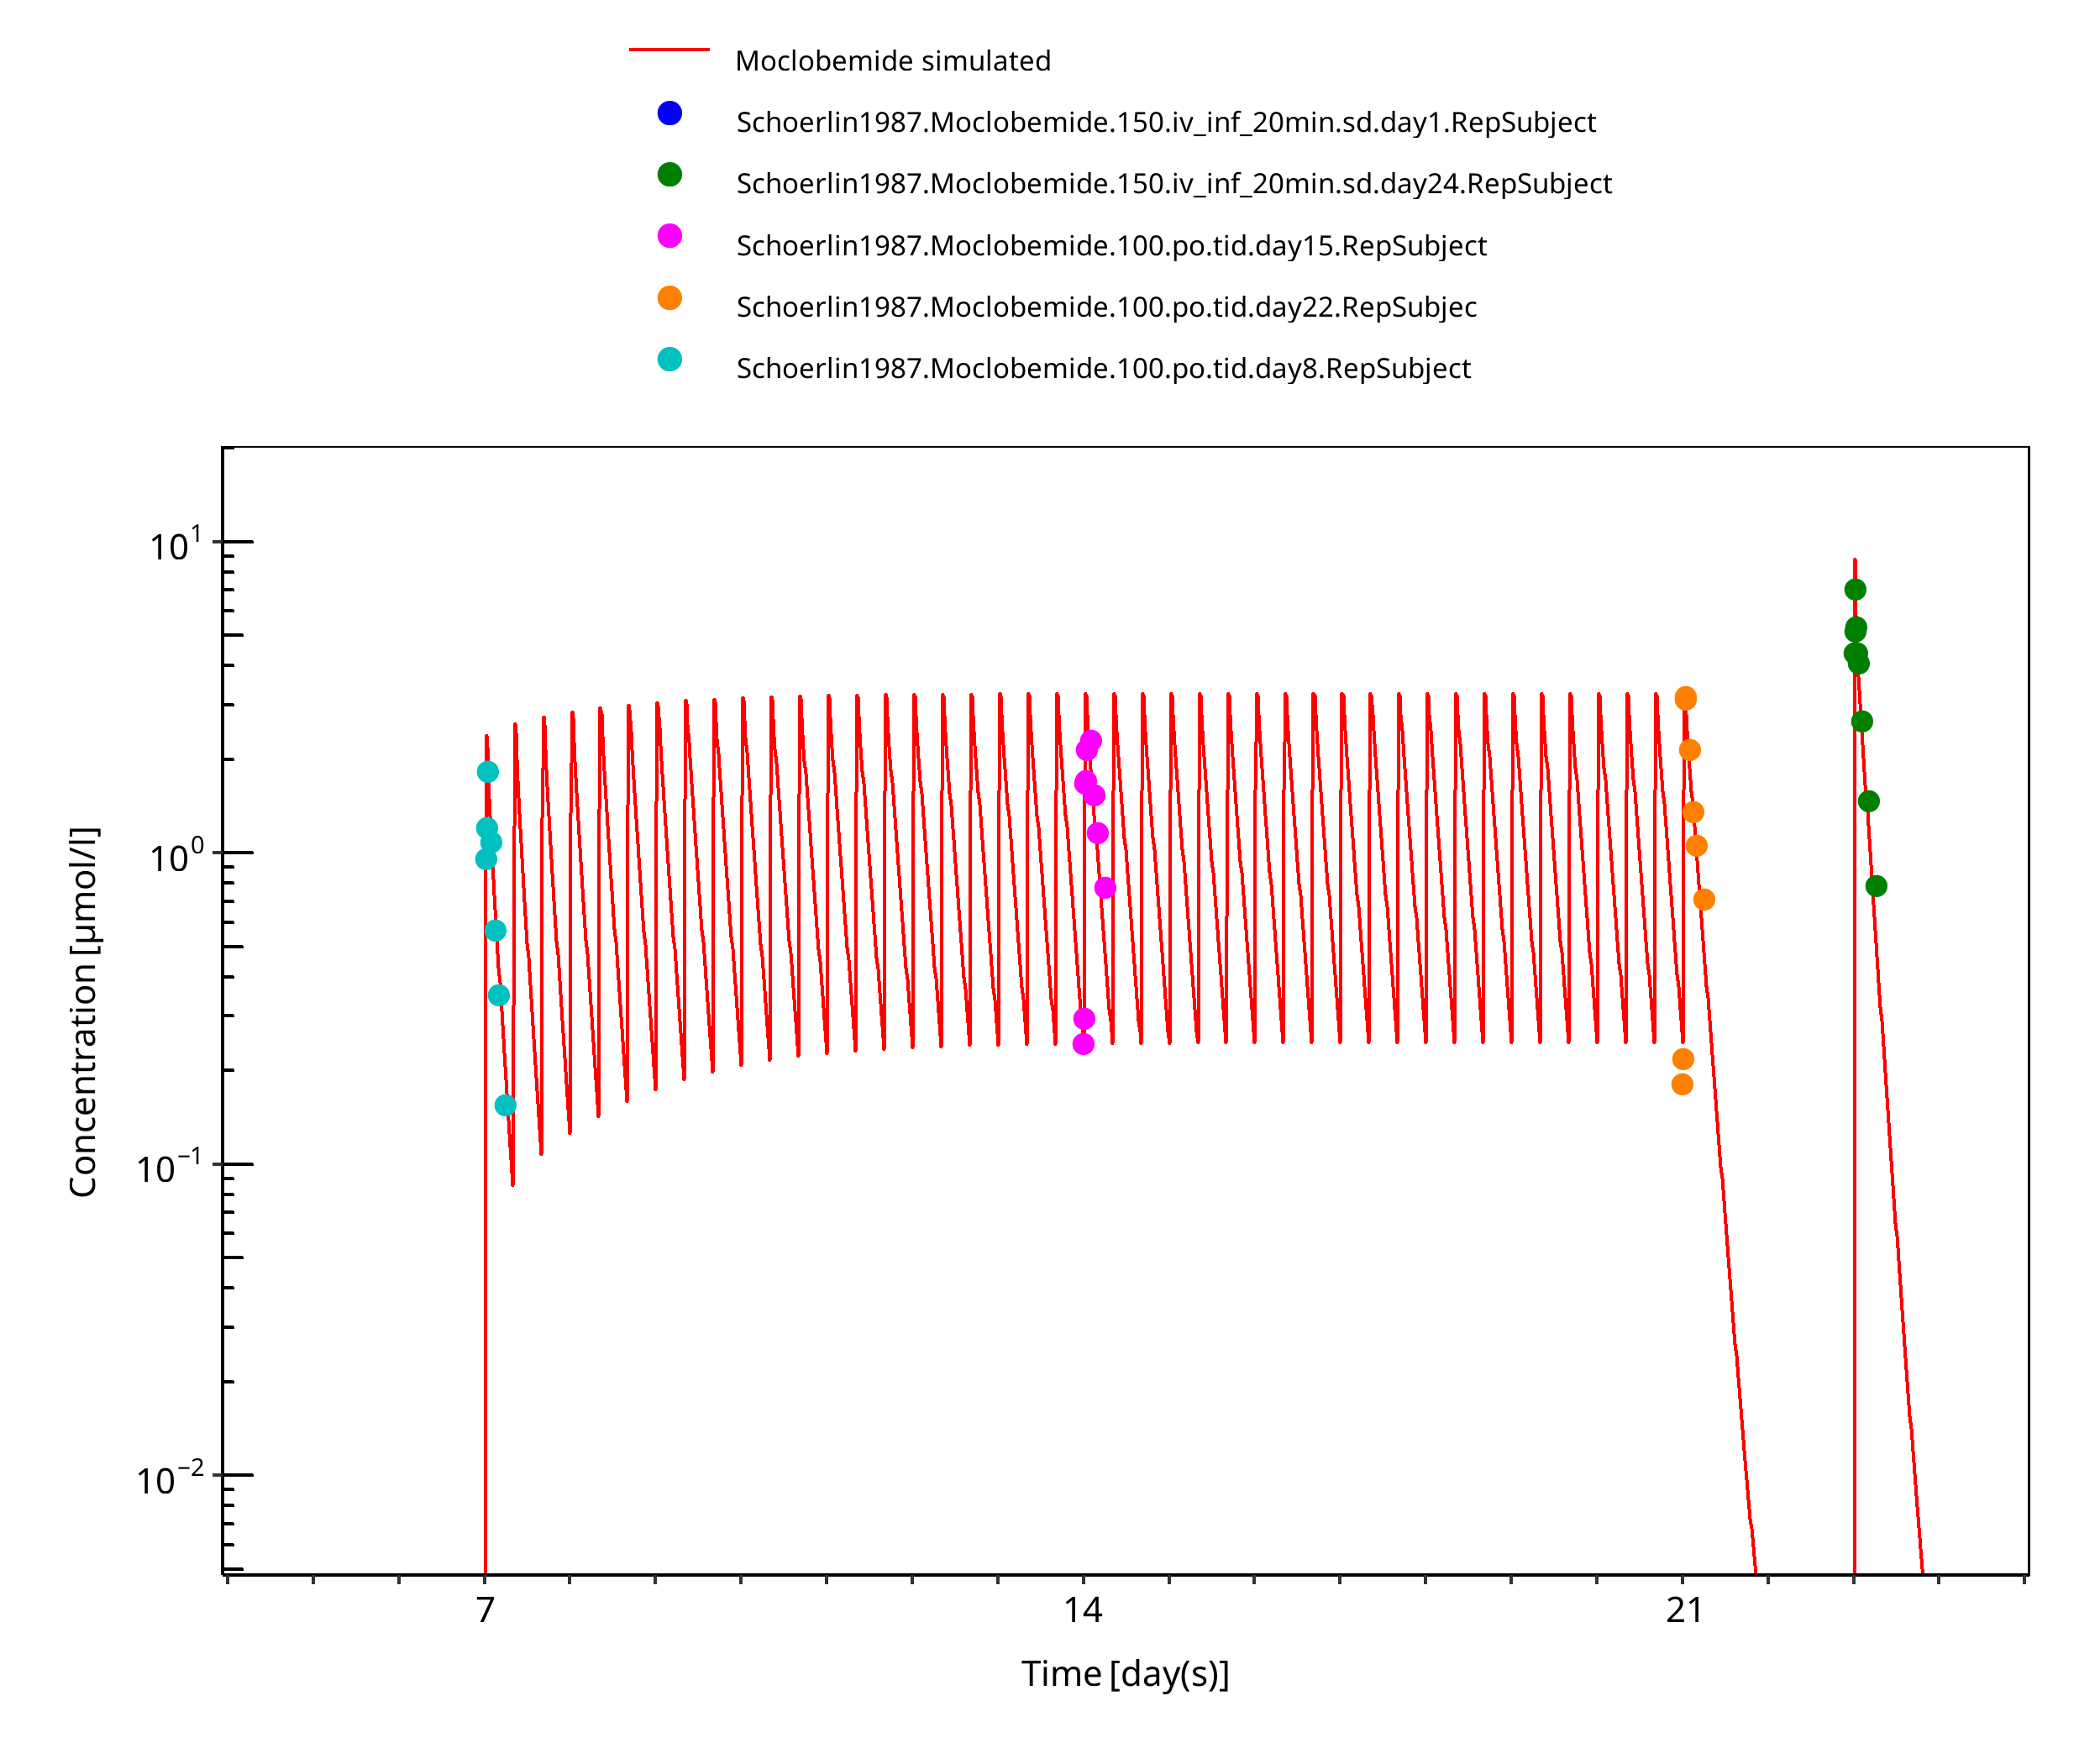
Figure 3-8: 150 mg moclobemide po 14d
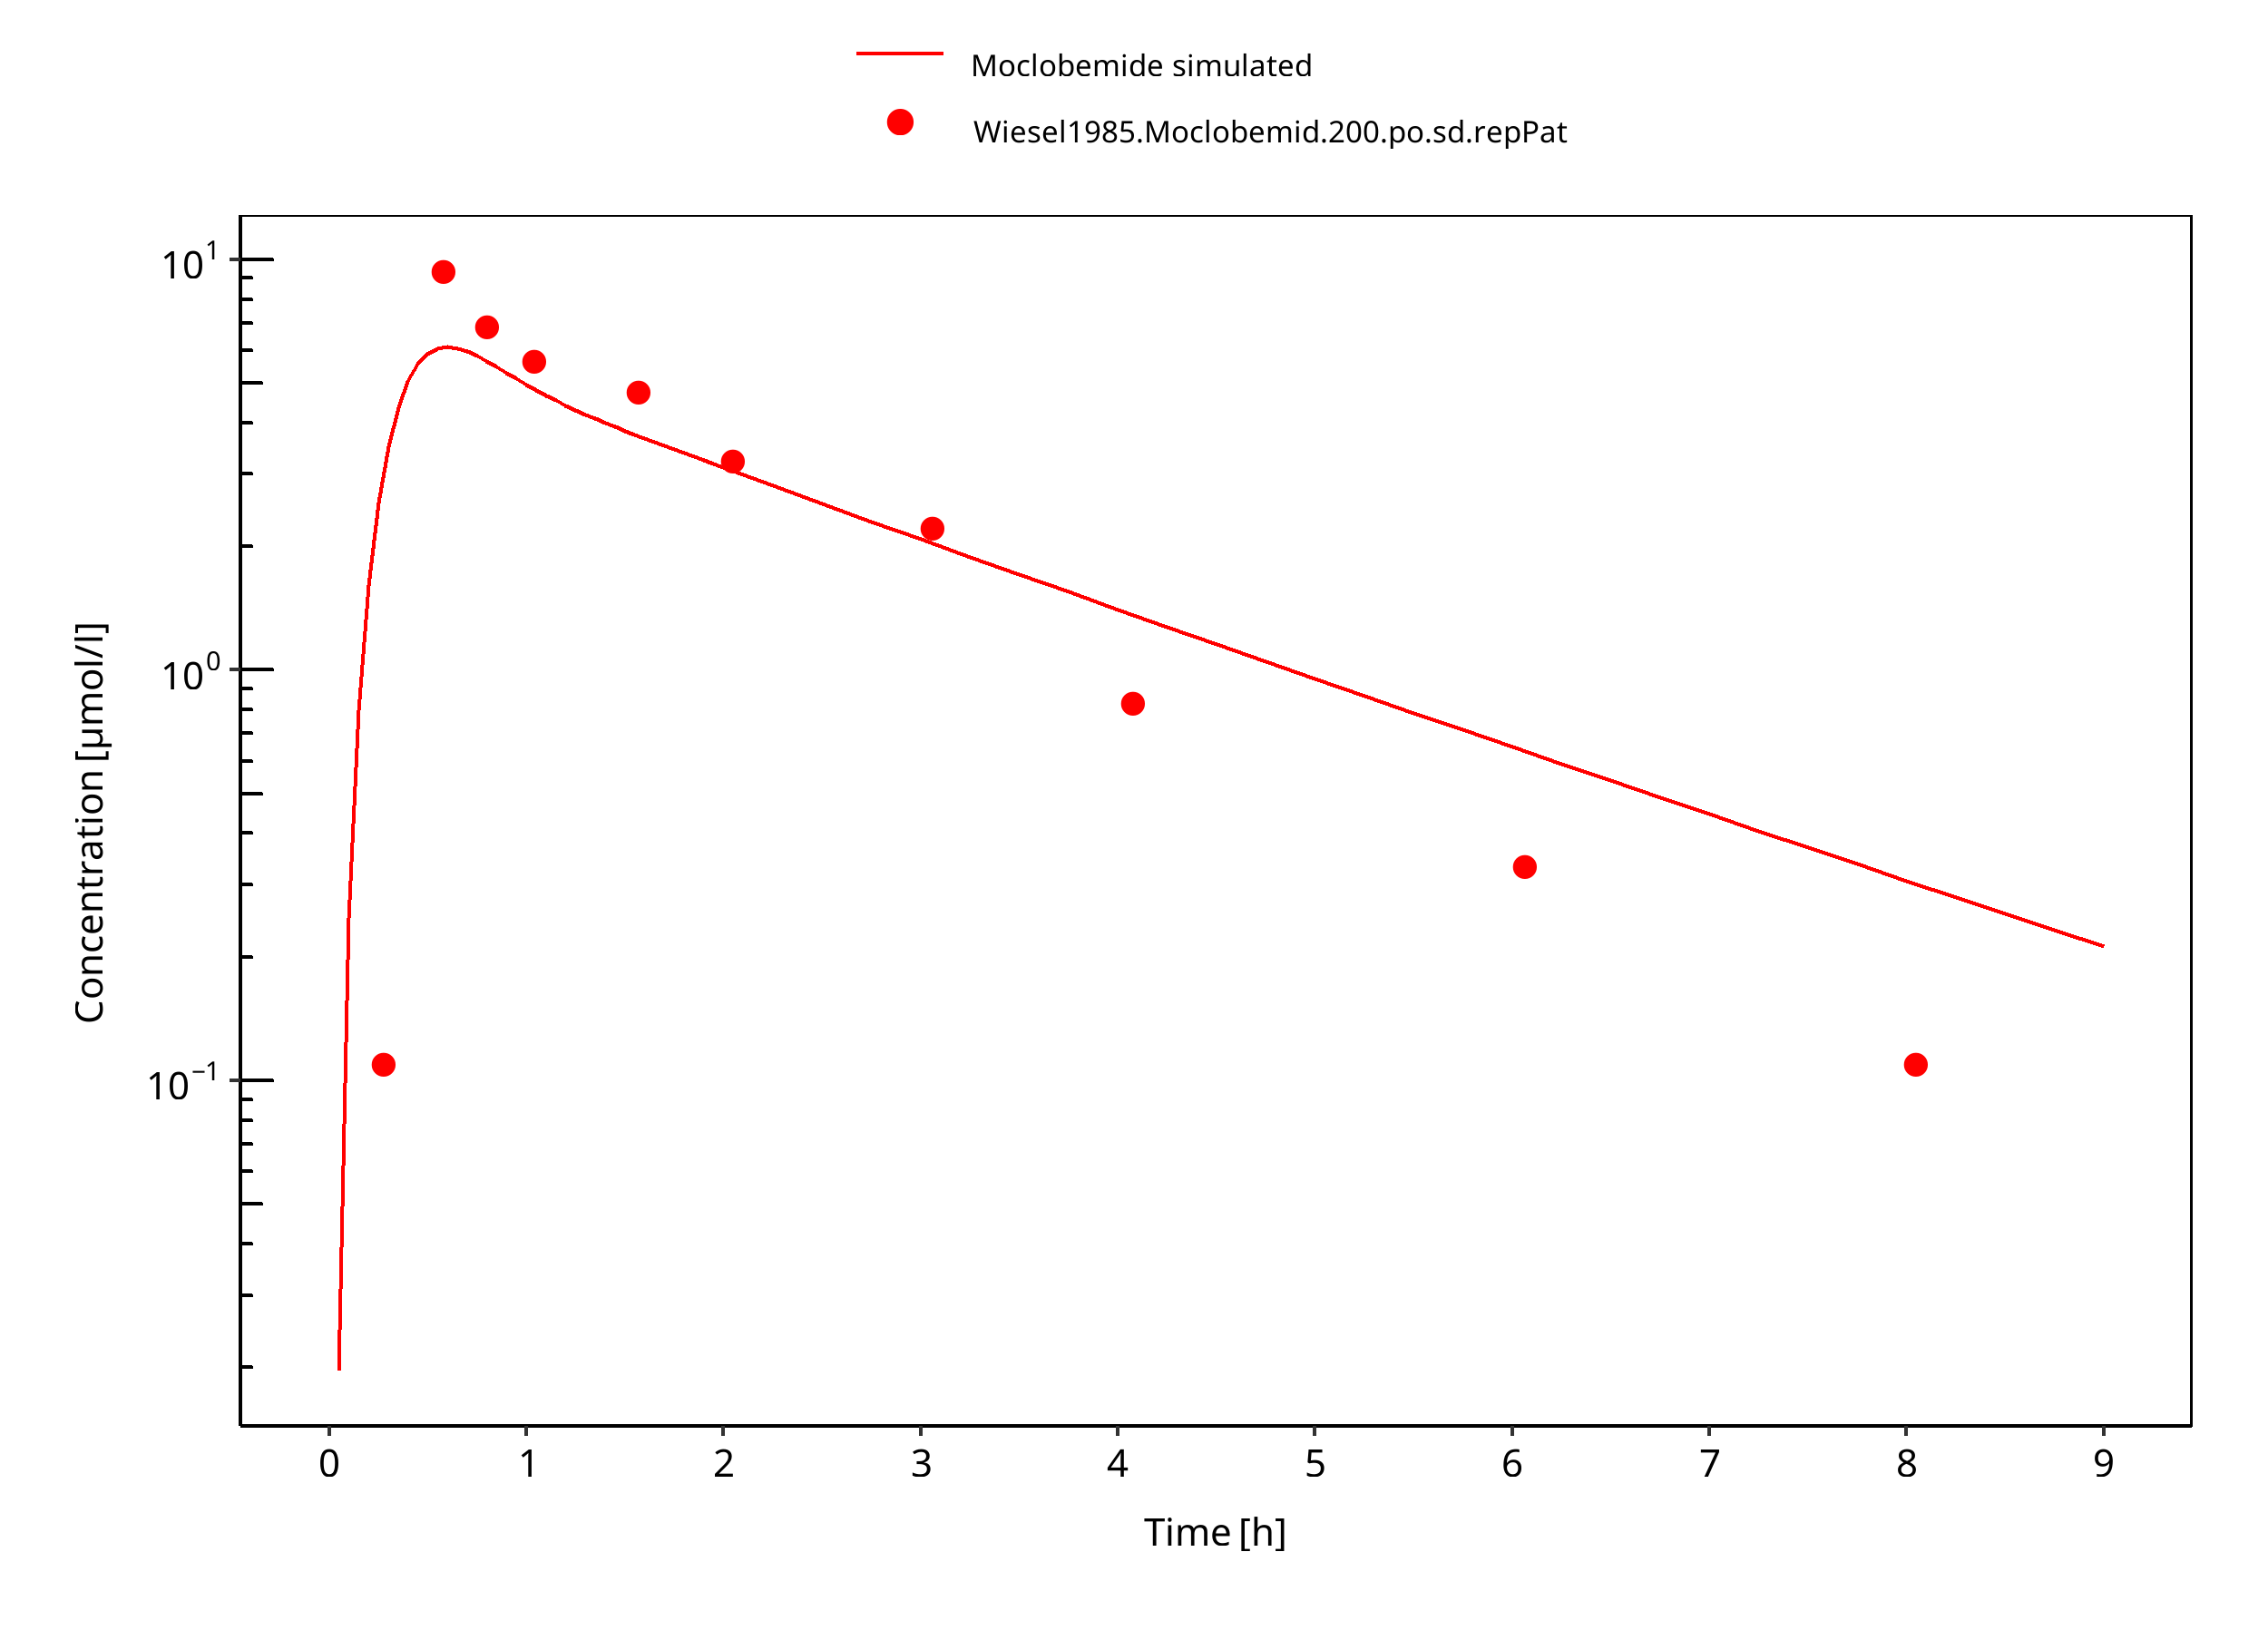
Figure 3-9: 200 mg moclobemide po
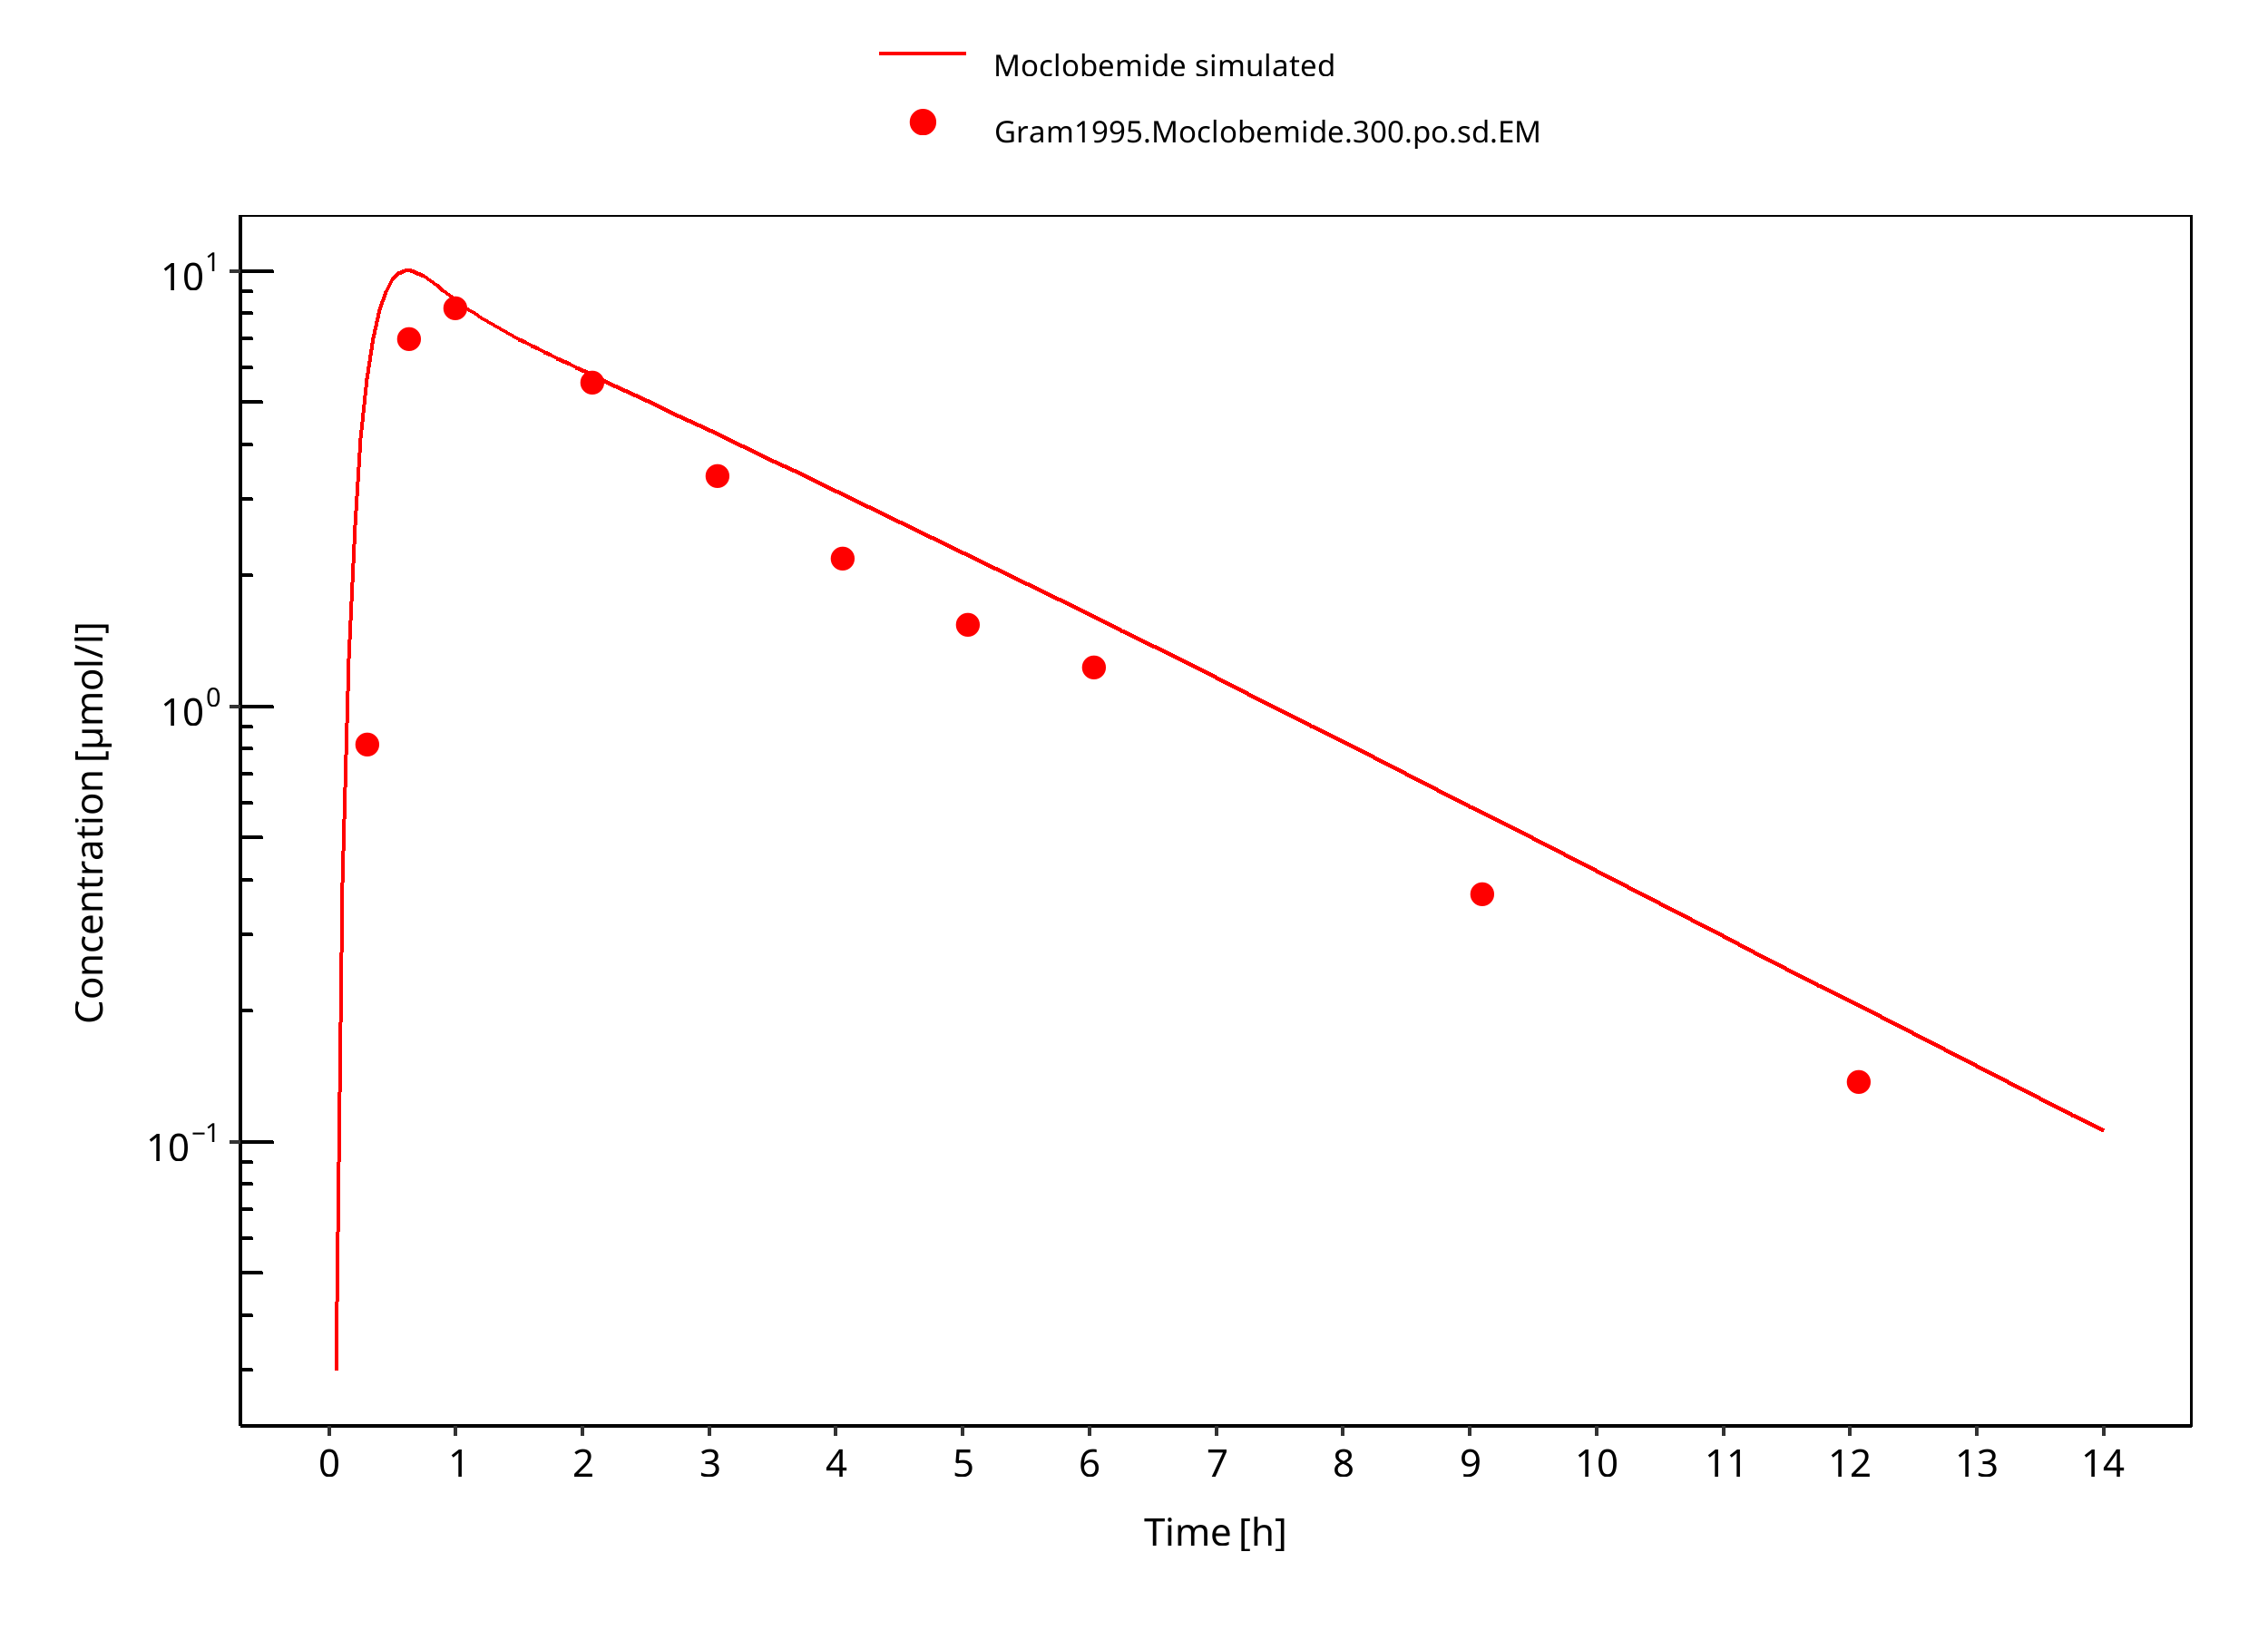
Figure 3-10: 300 mg moclobemide po
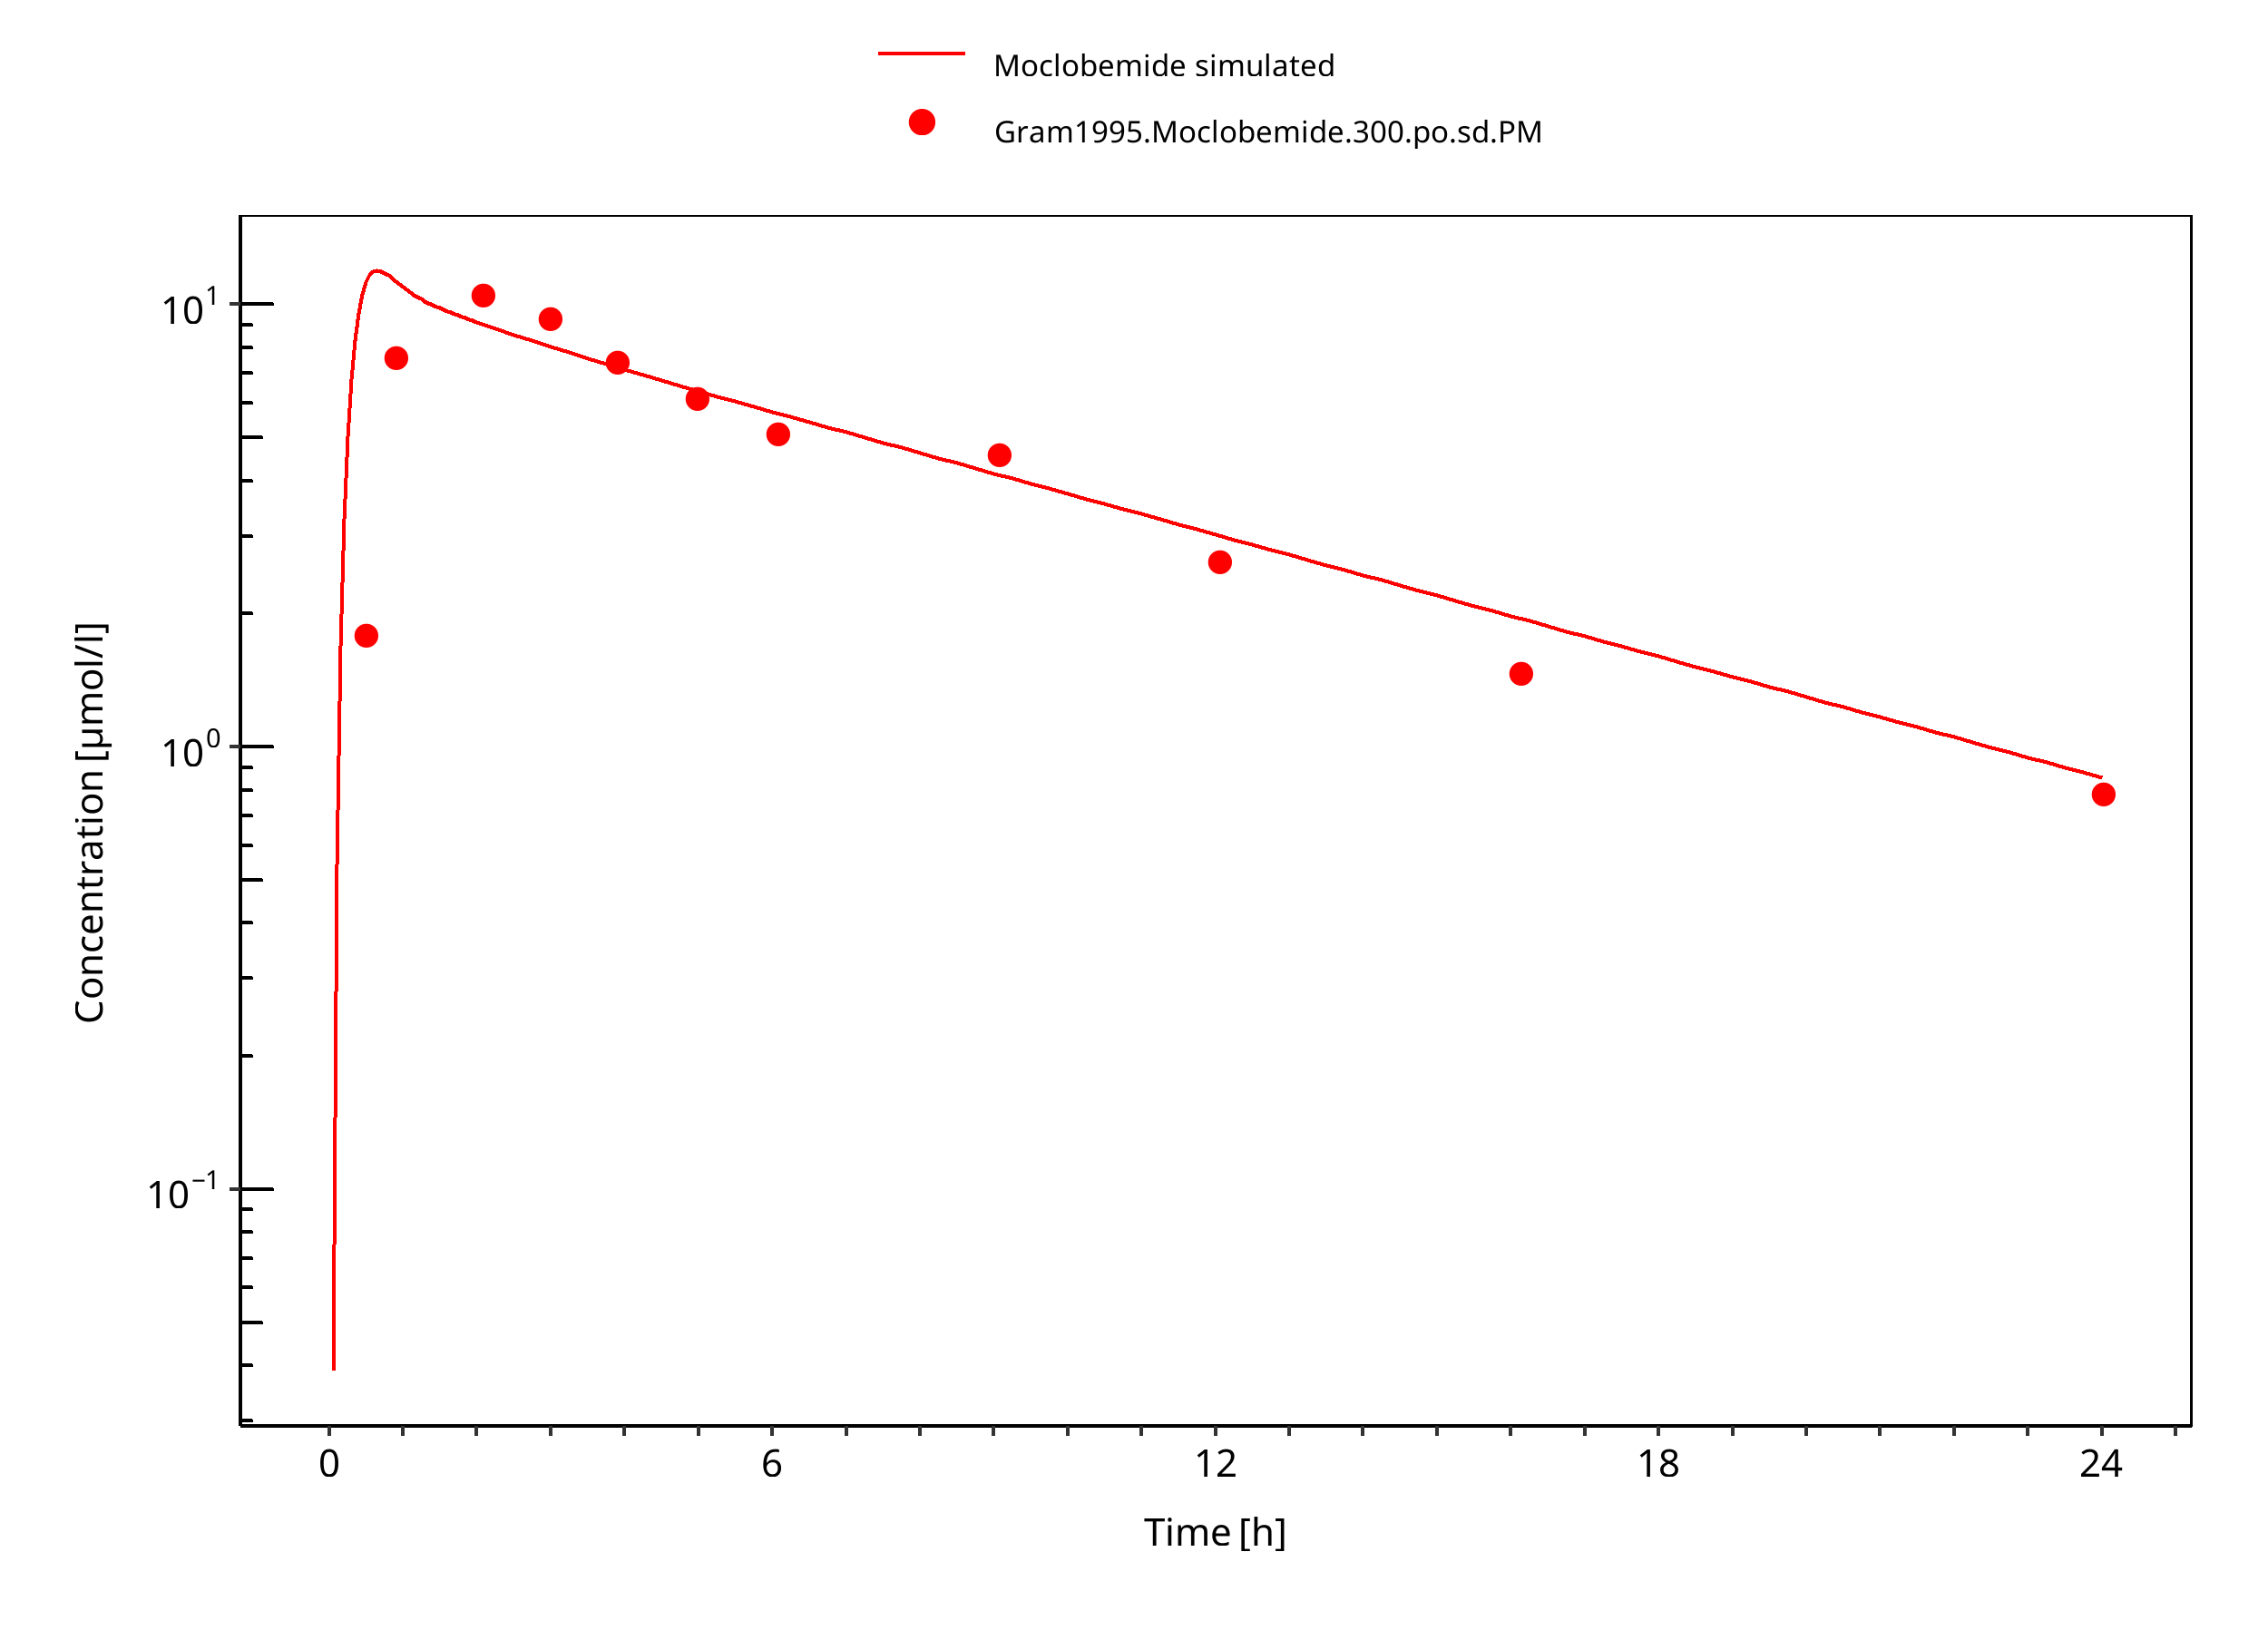
Figure 3-11: 300 mg moclobemide po PM
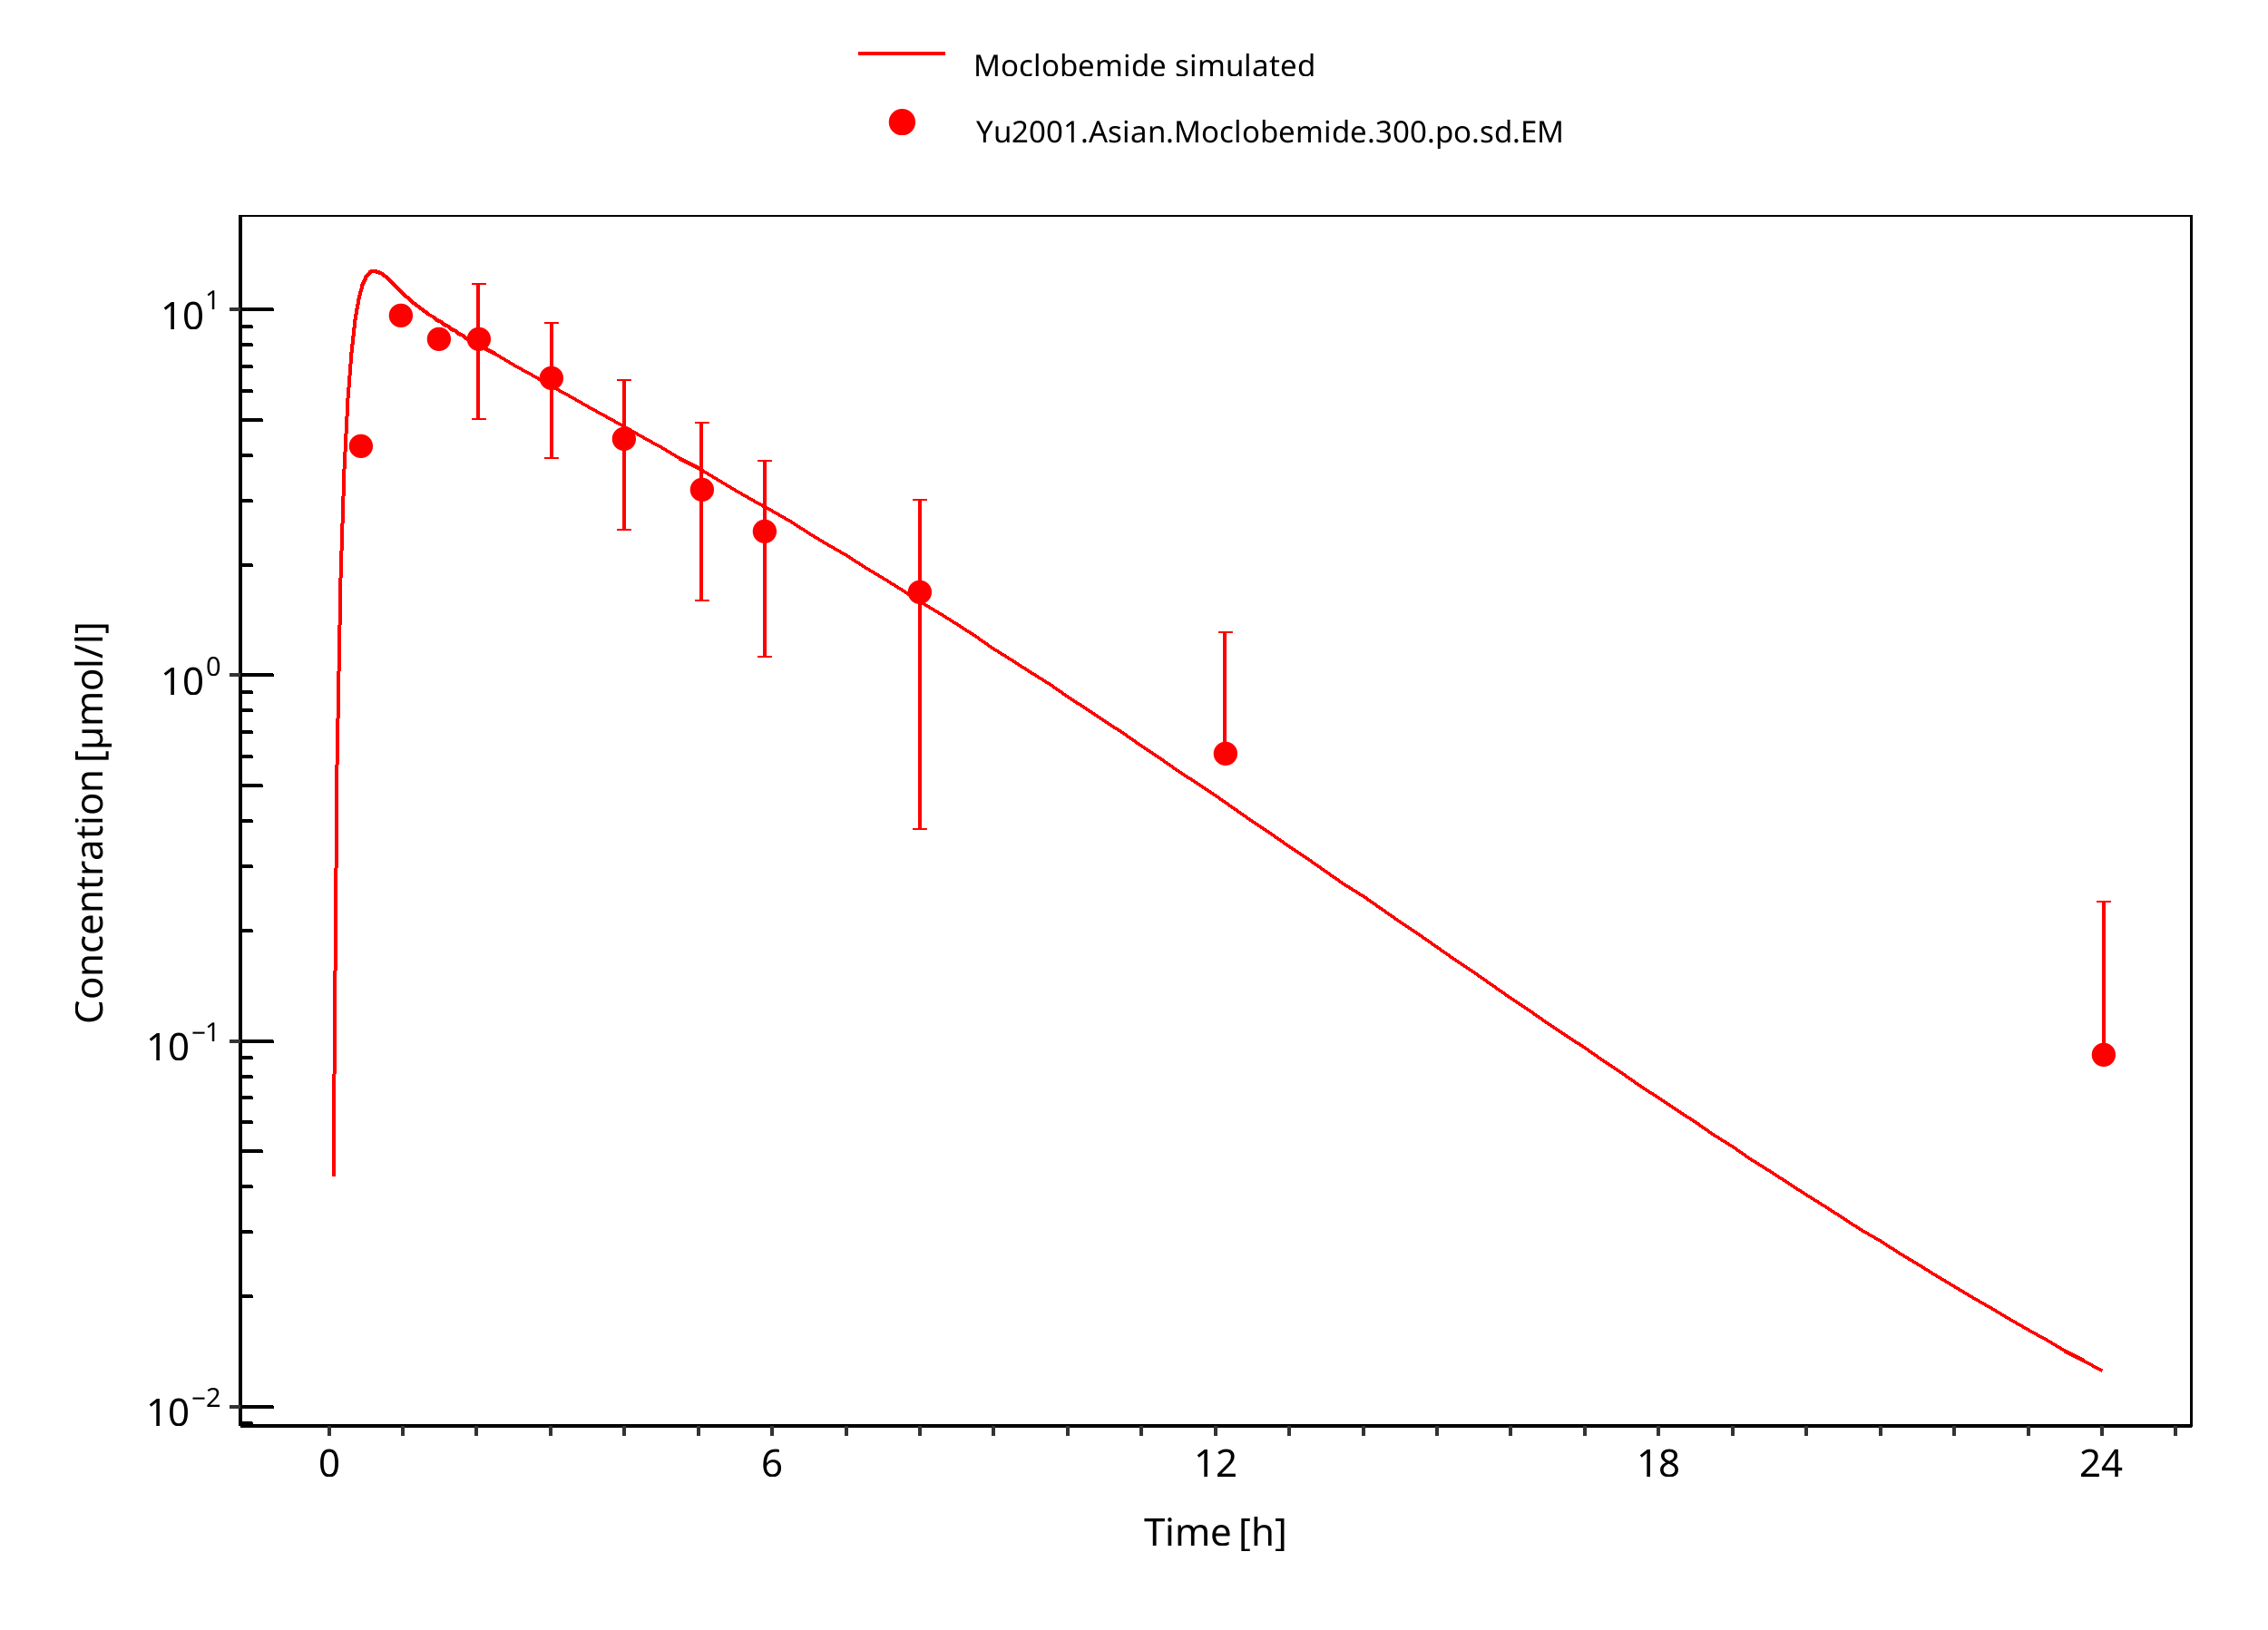
Figure 3-12: 300 mg moclobemide po asian
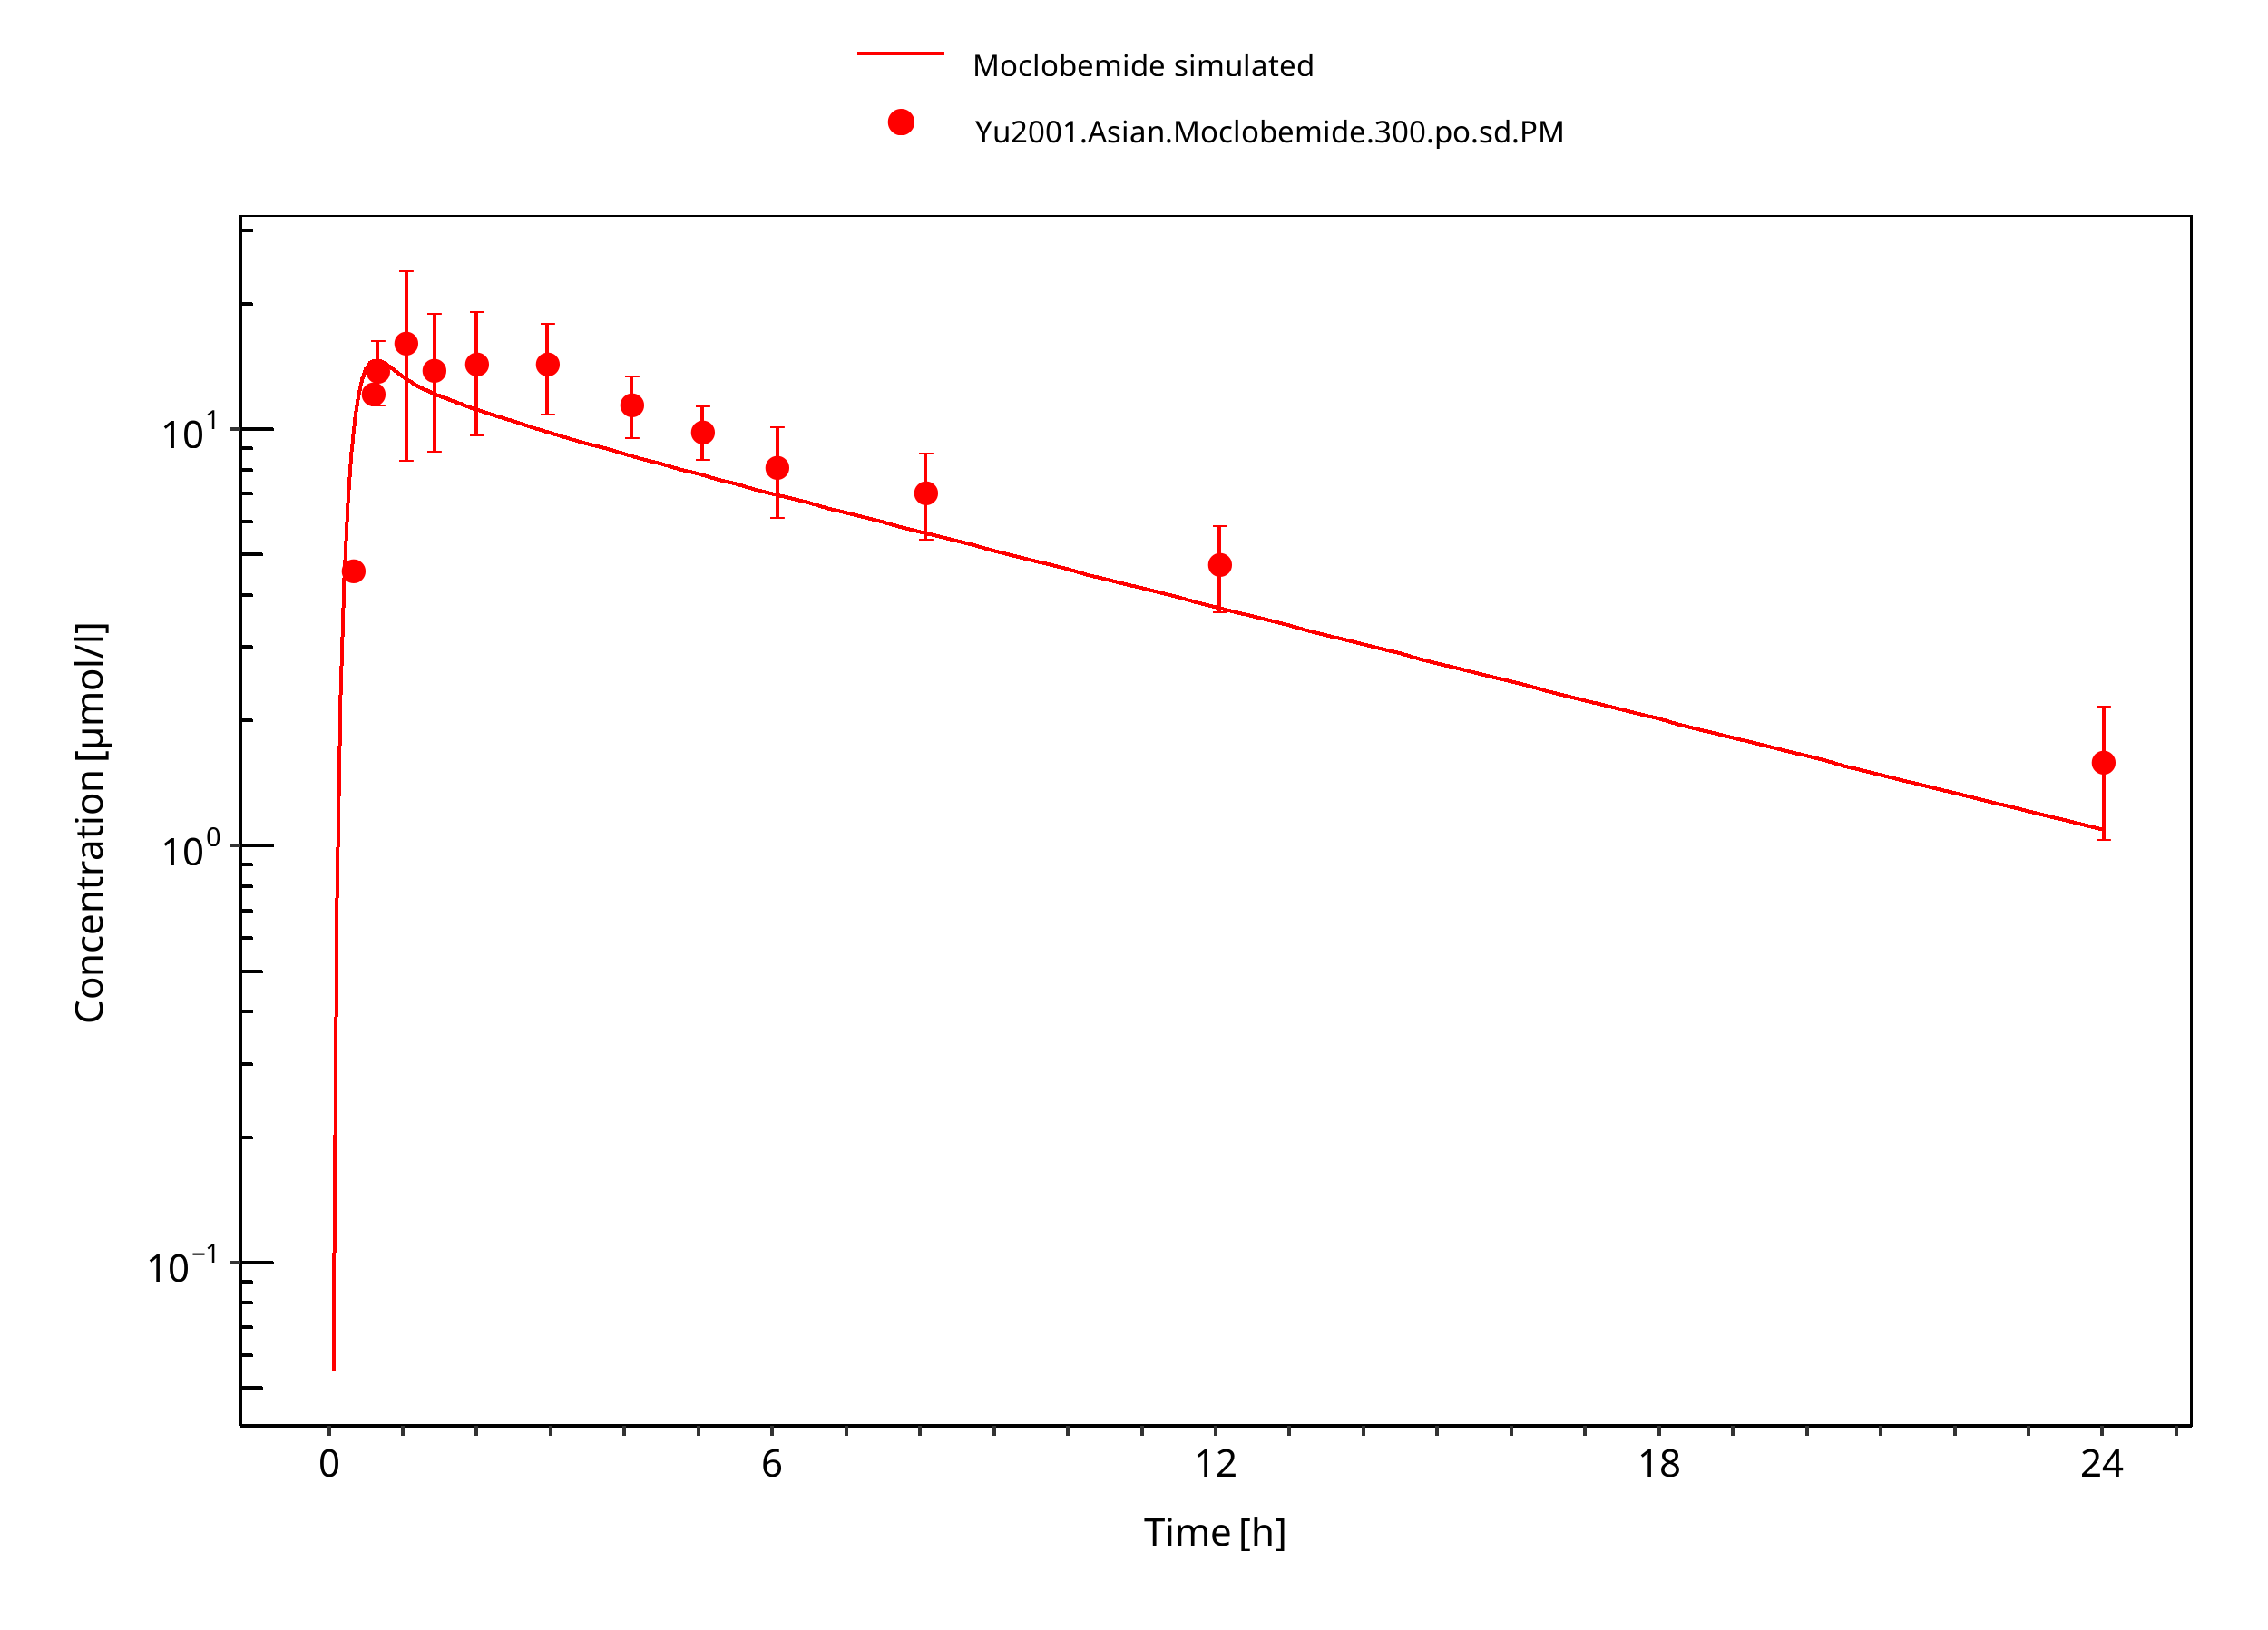
Figure 3-13: 300 mg moclobemide po asian PM
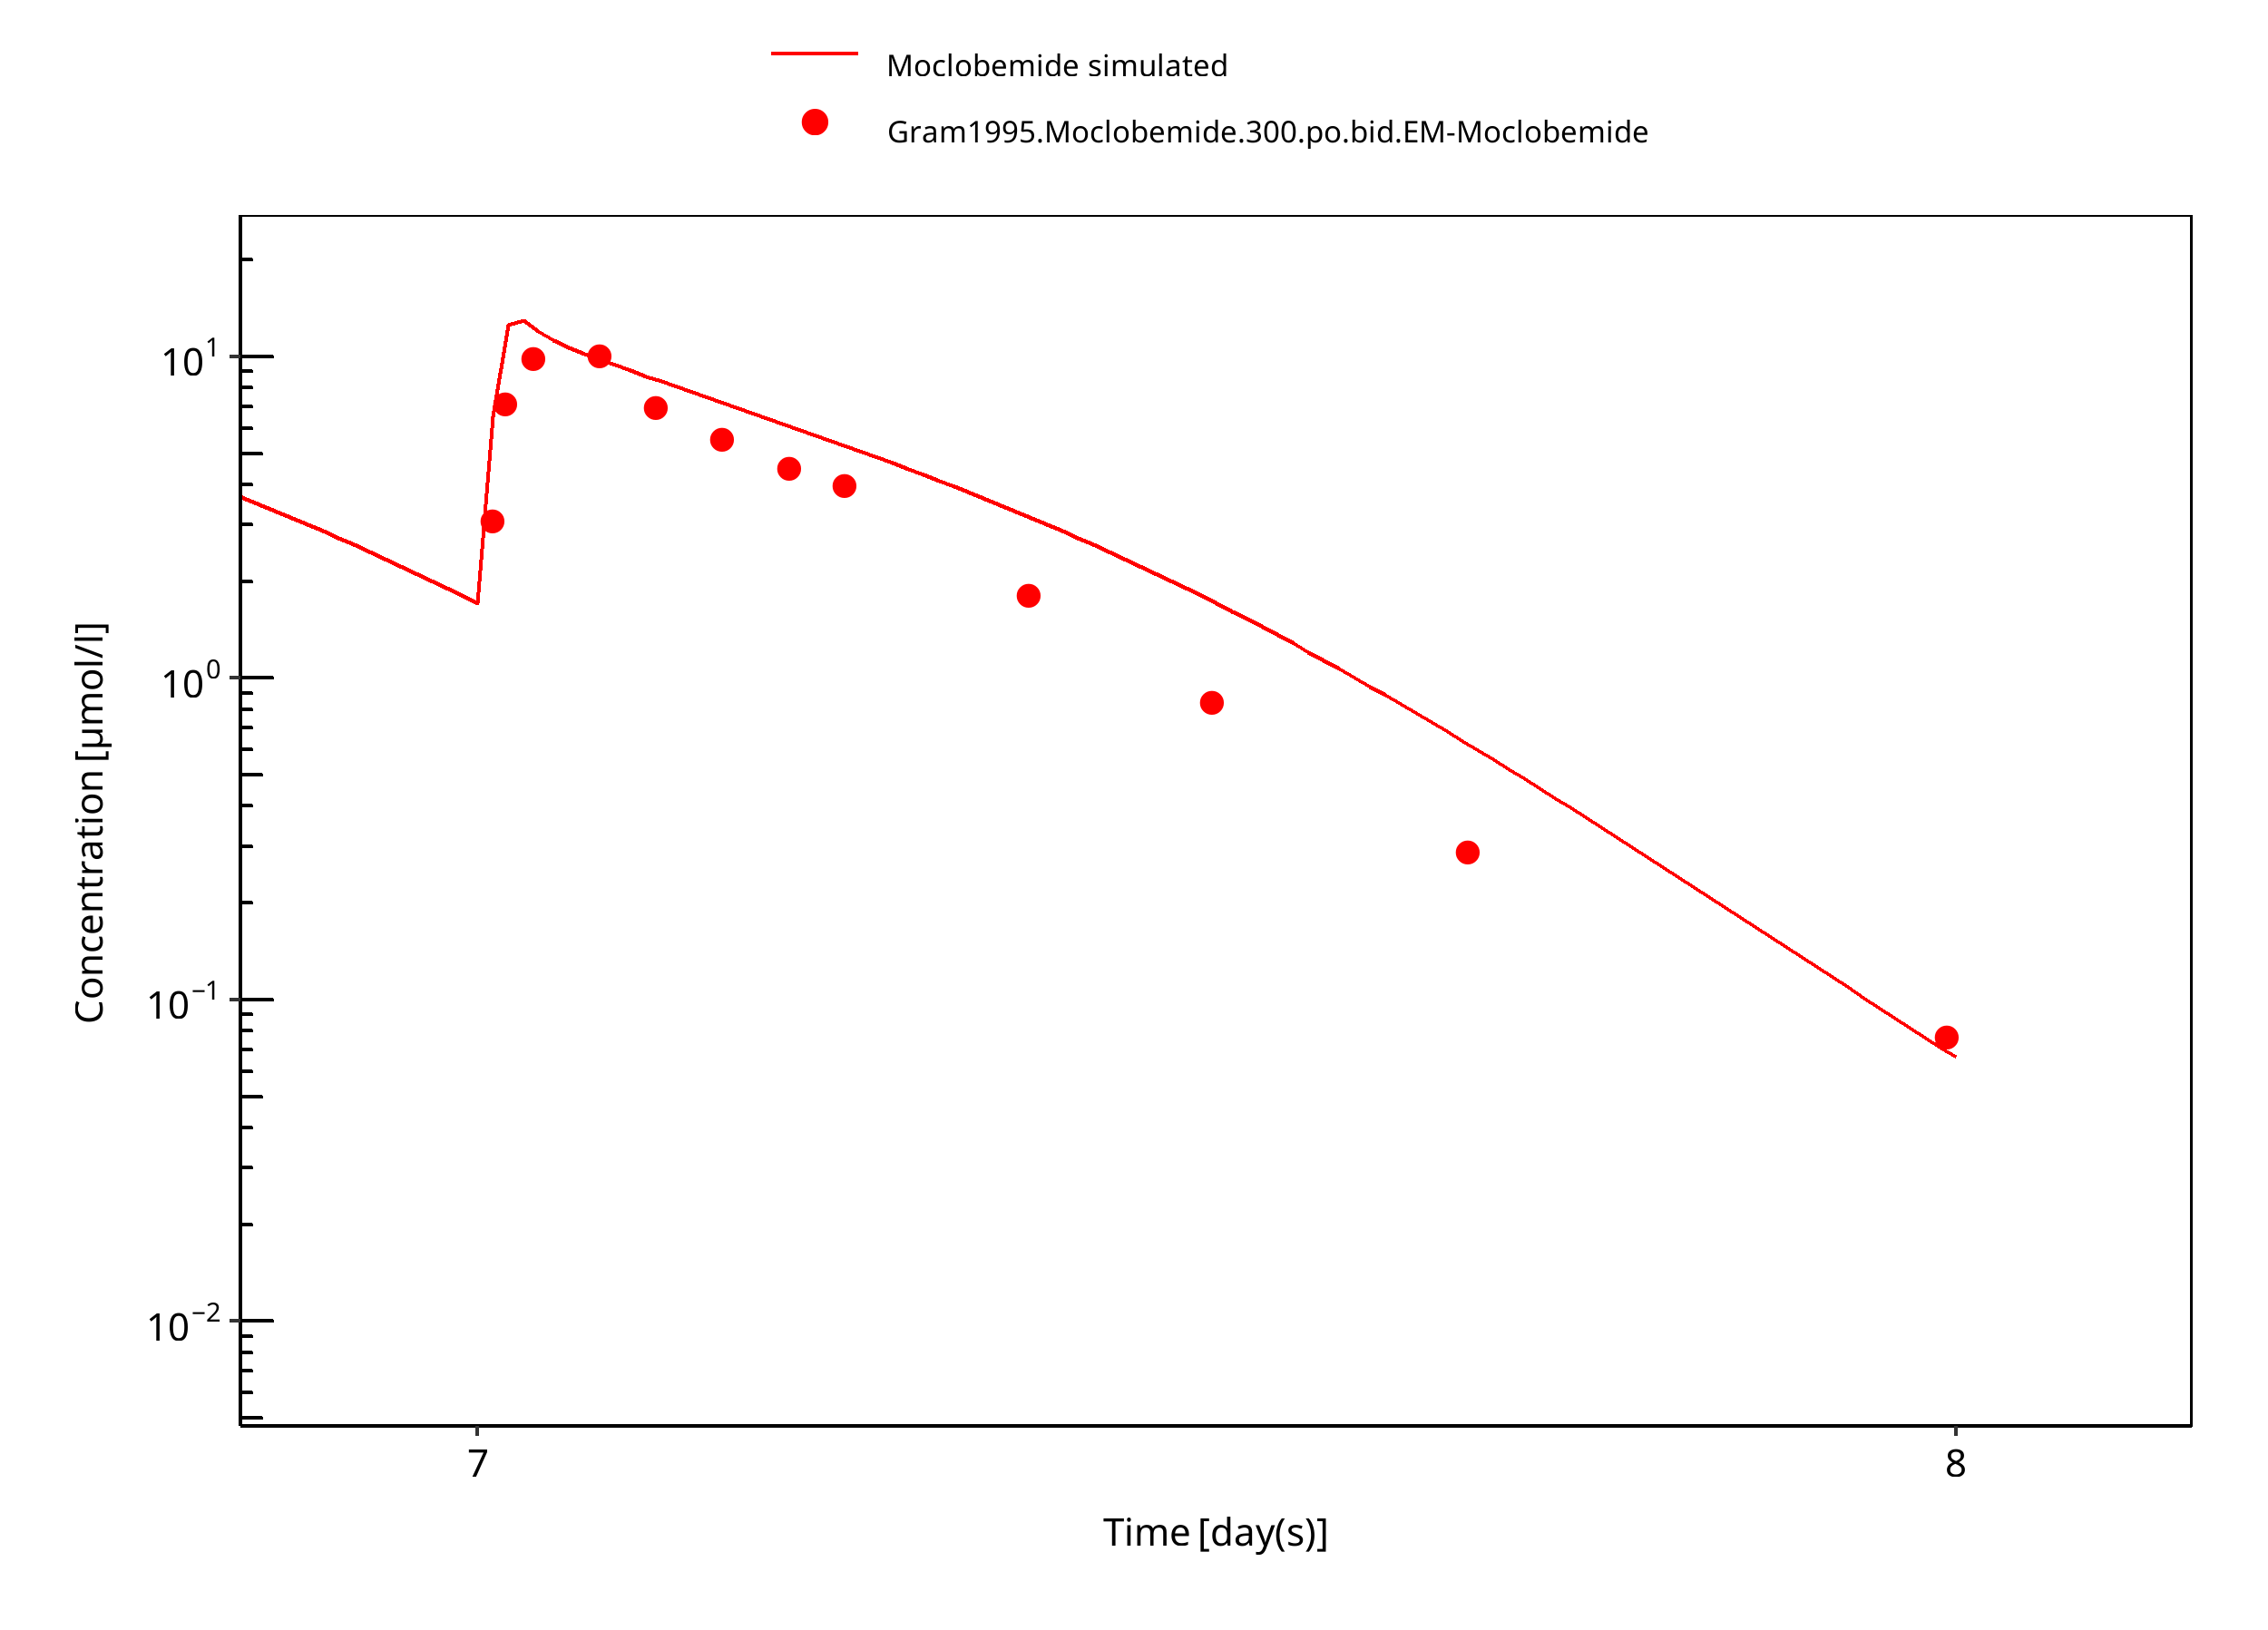
Figure 3-14: 300 mg moclobemide po 7d
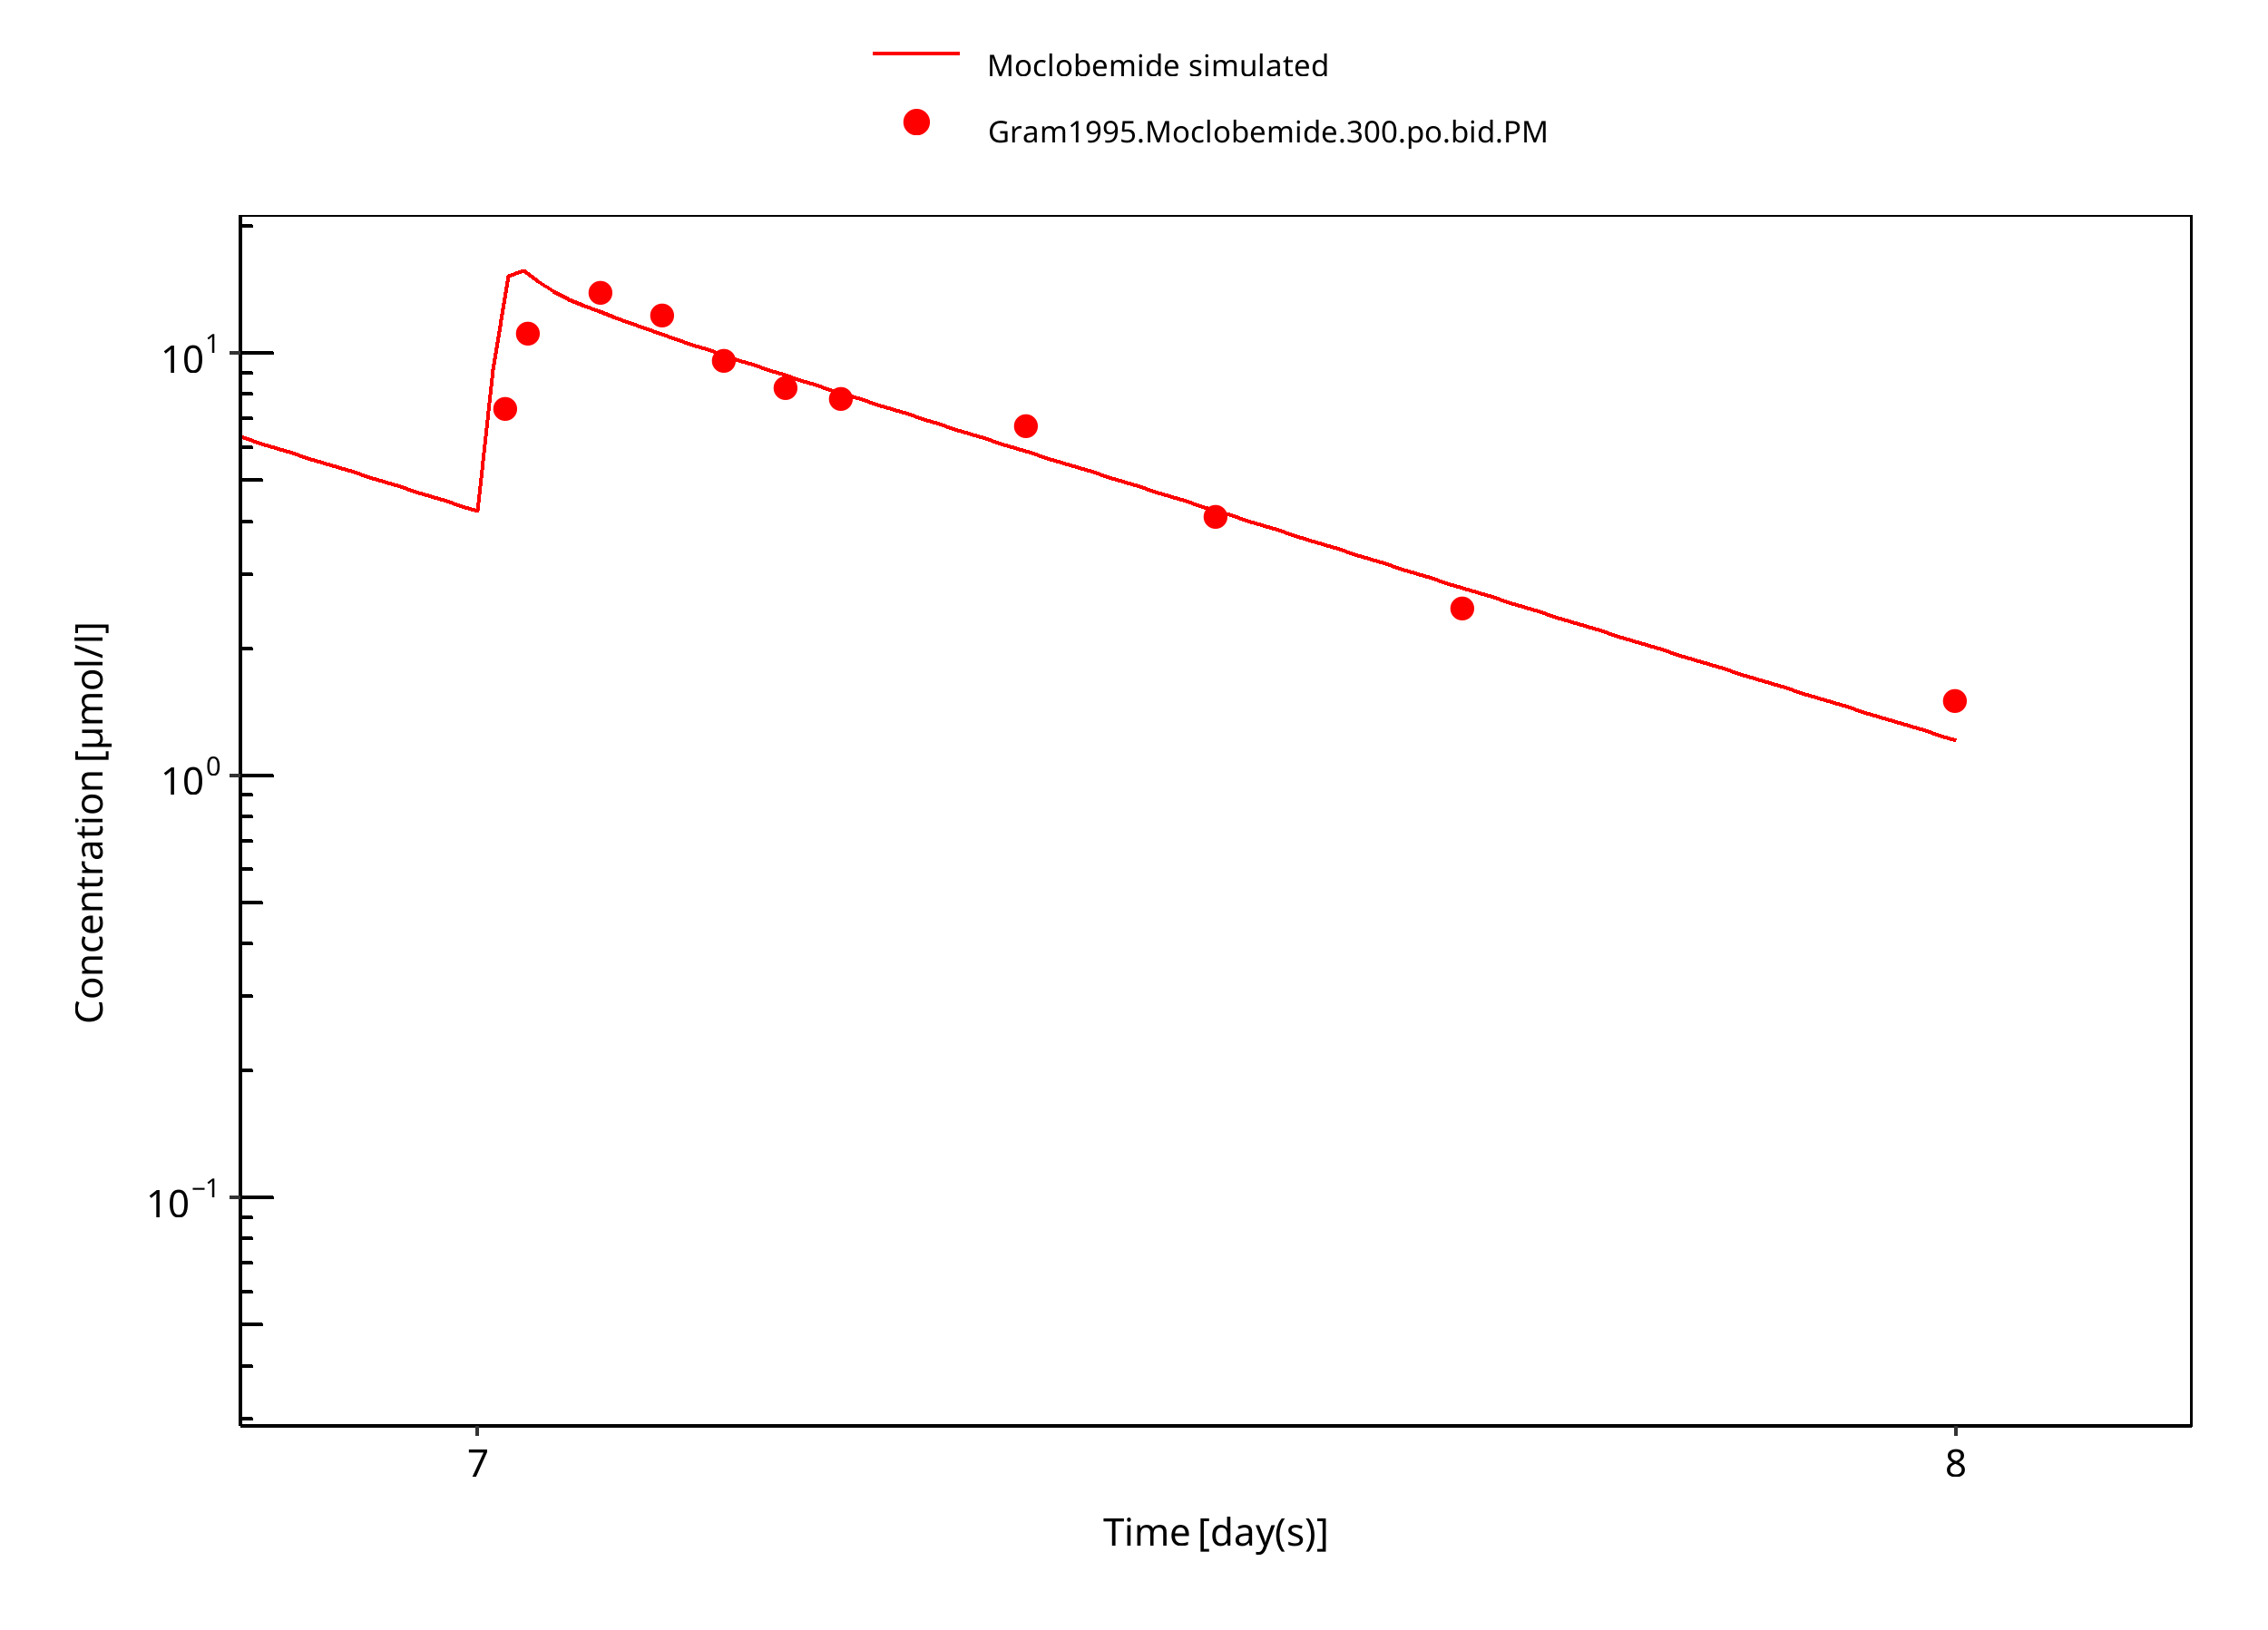
Figure 3-15: 300 mg moclobemide po PM 7d
3.3.2 Model Verification
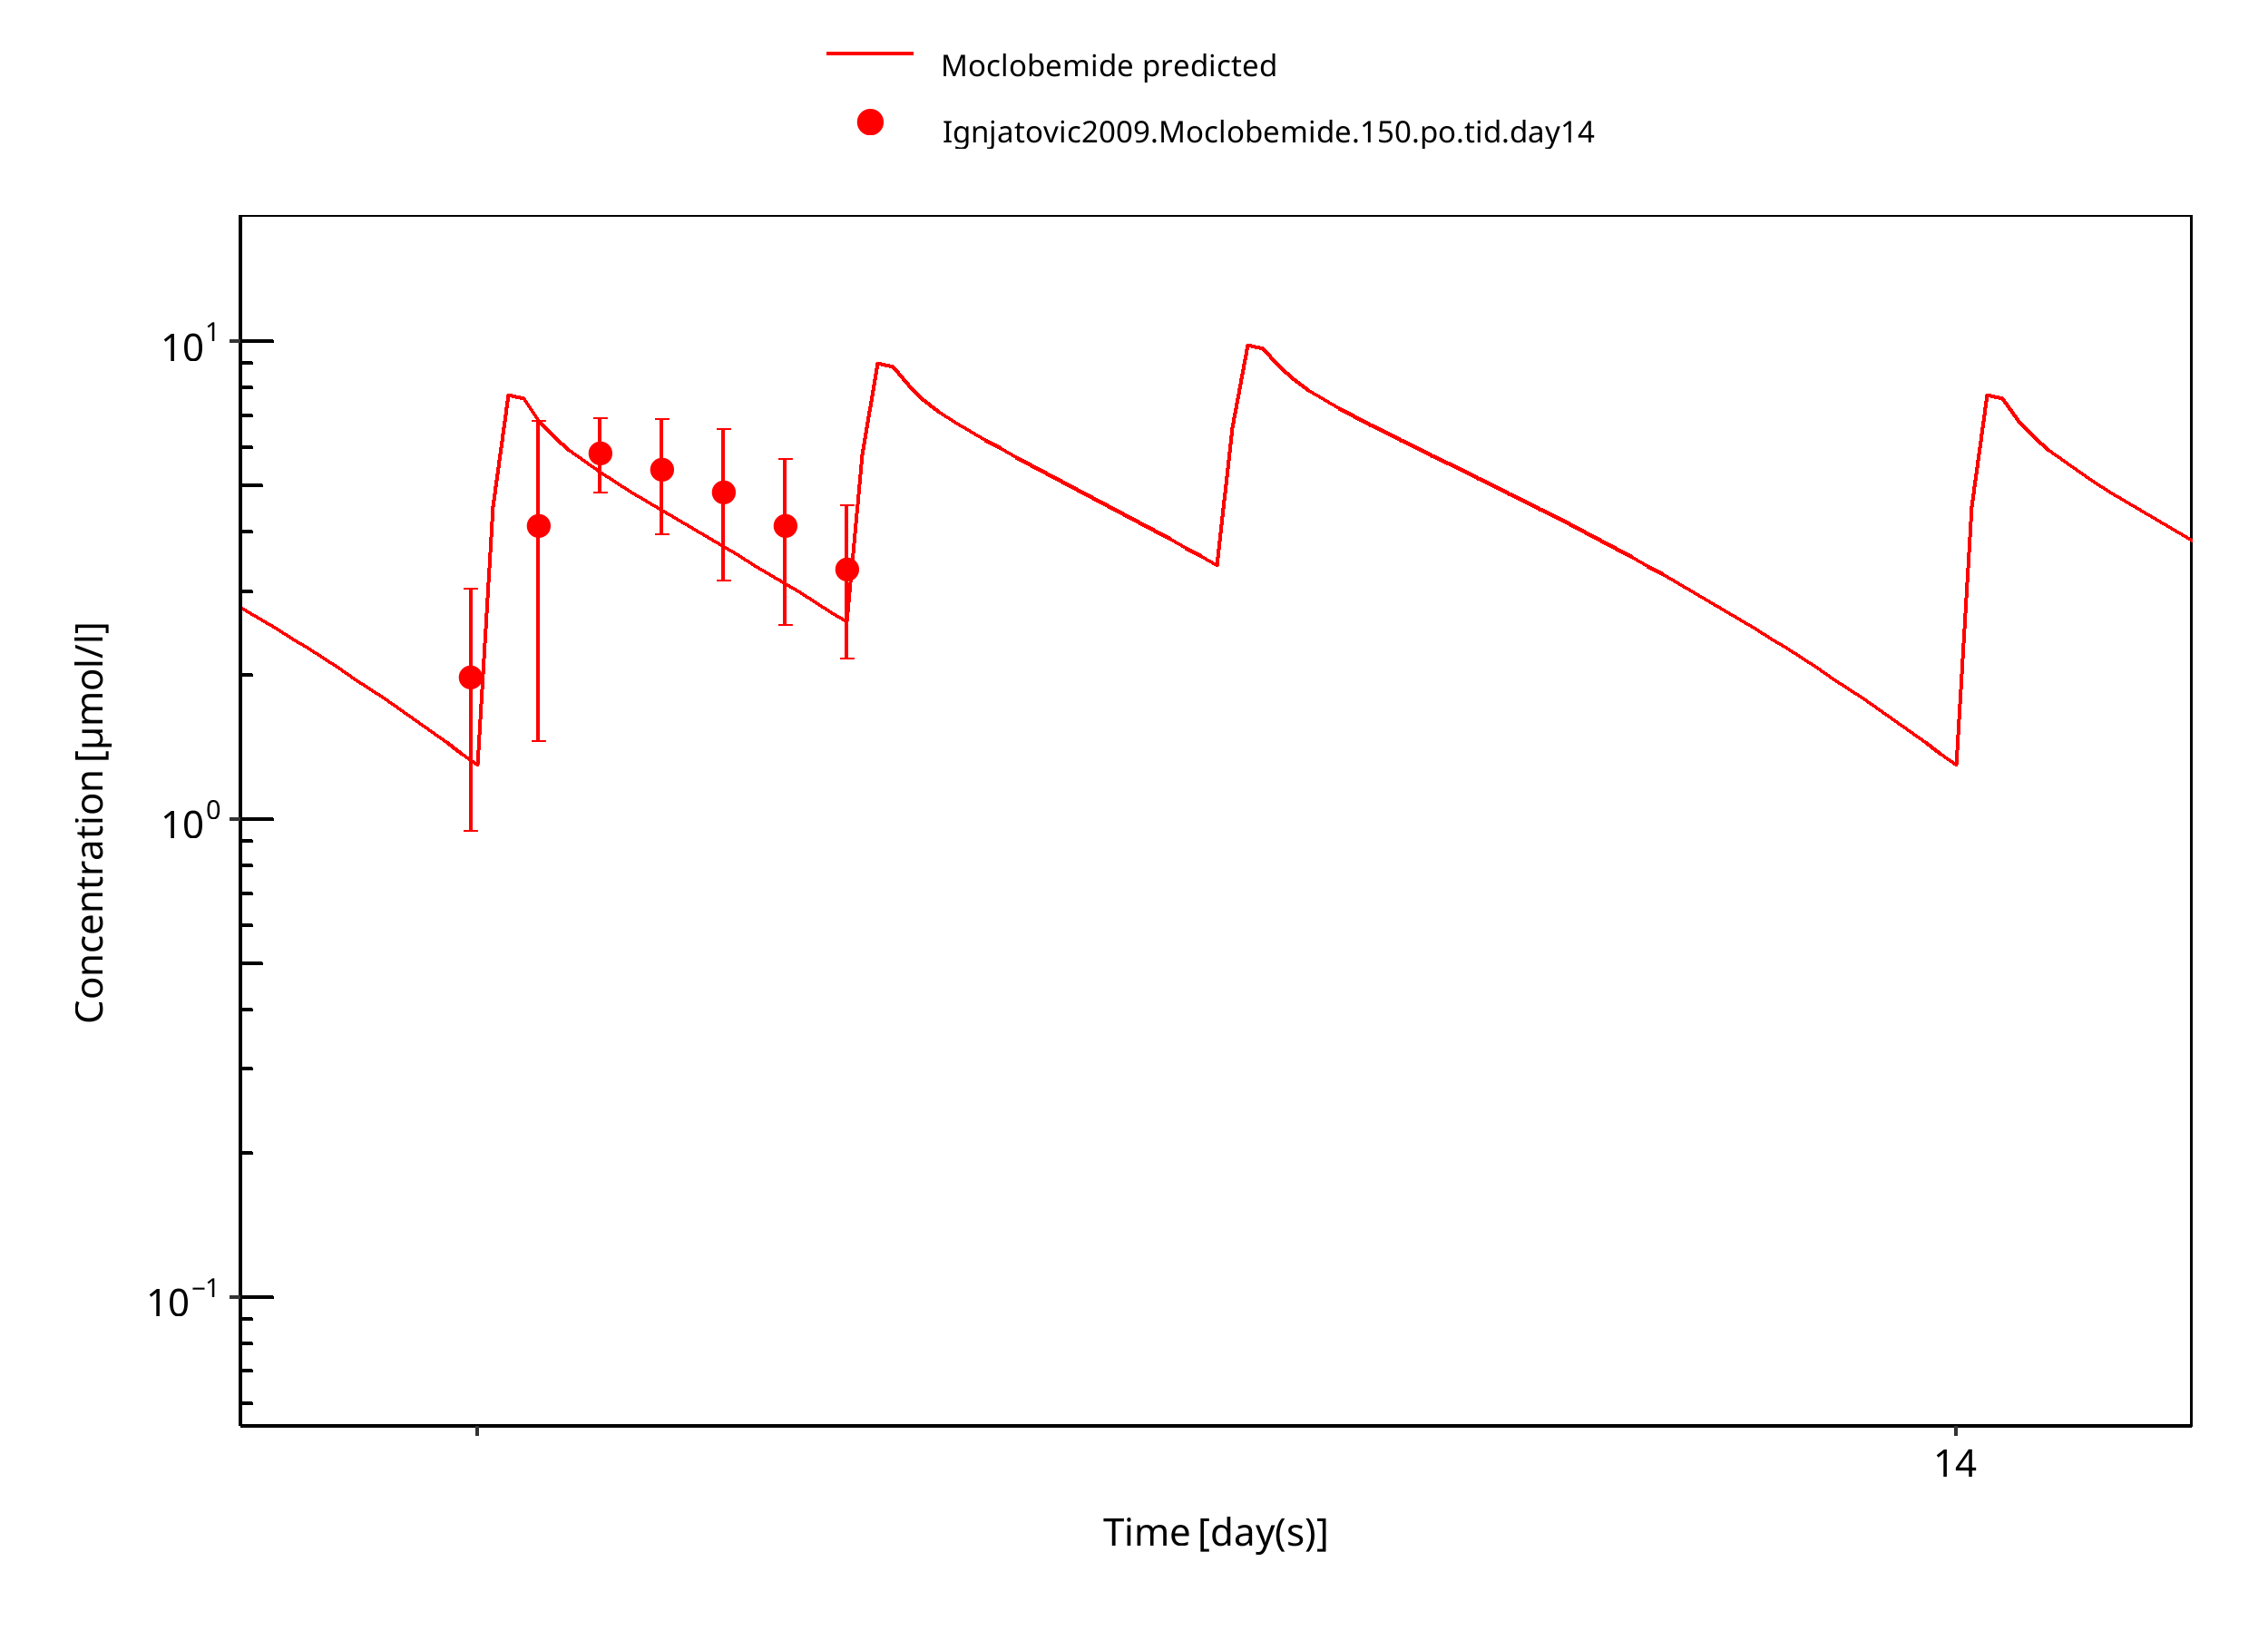
Figure 3-16: 150 mg moclobemide po female day14
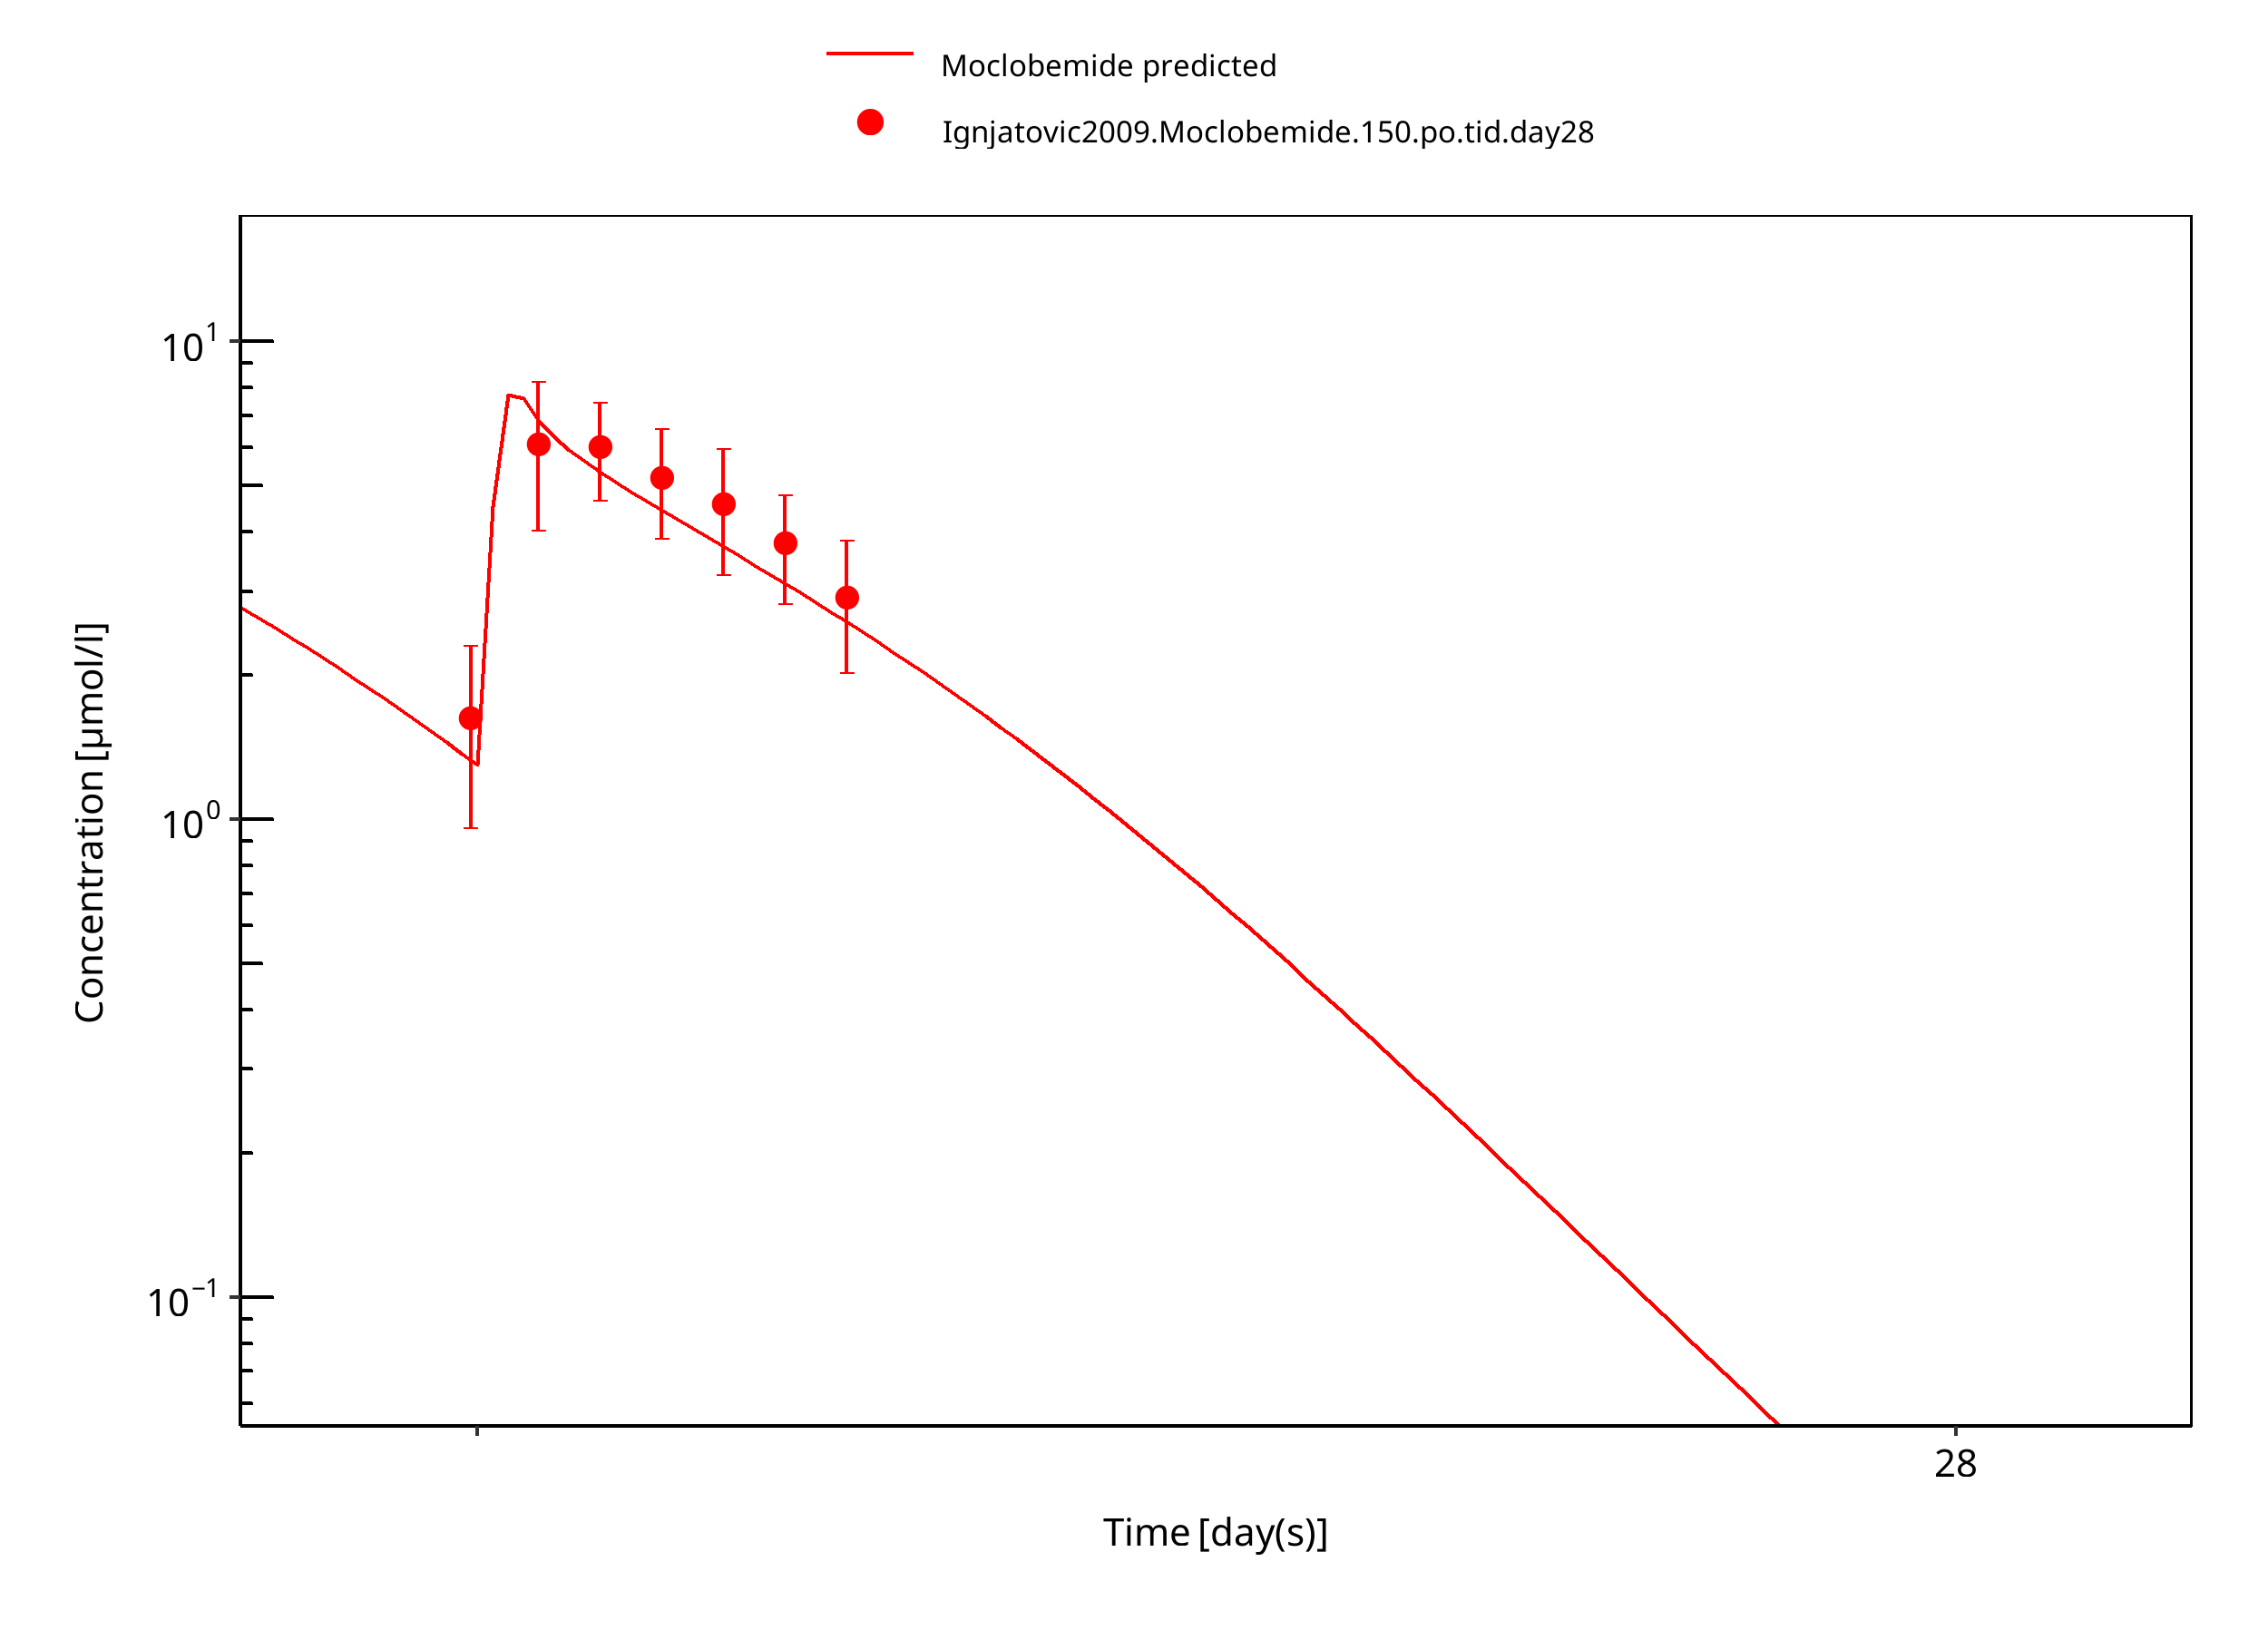
Figure 3-17: 150 mg moclobemide po female day28
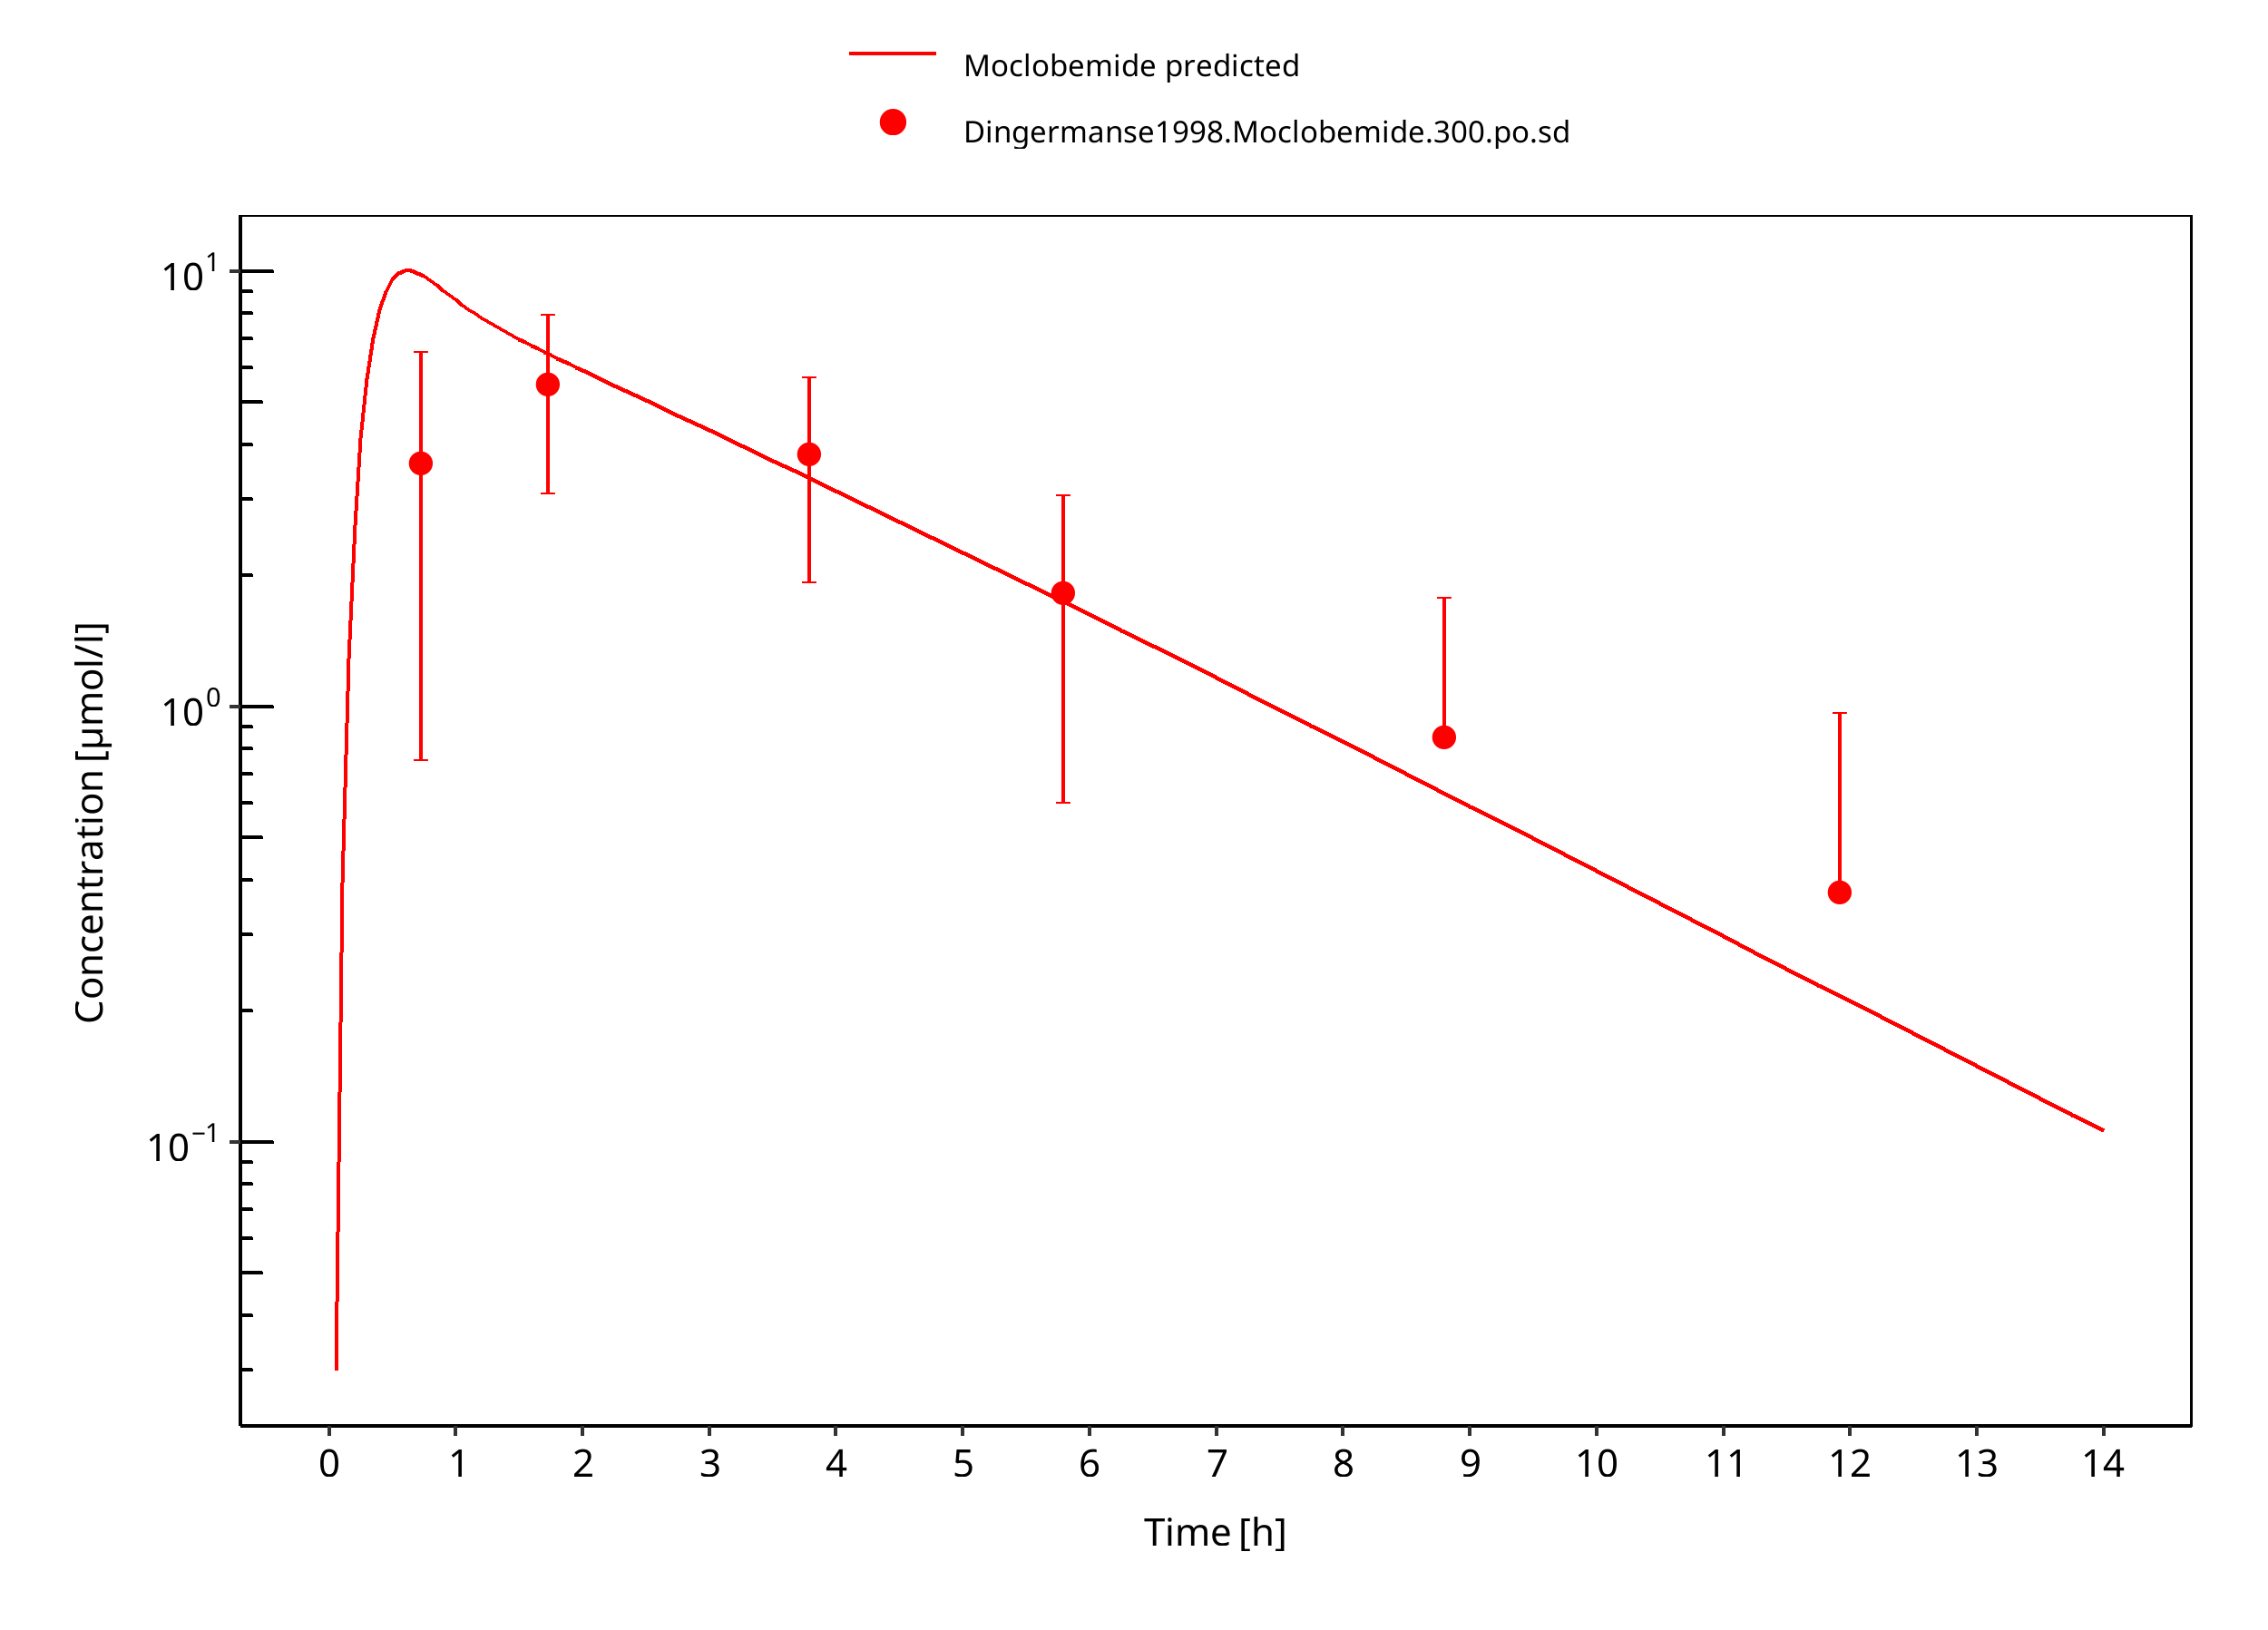
Figure 3-18: 300 mg moclobemide po
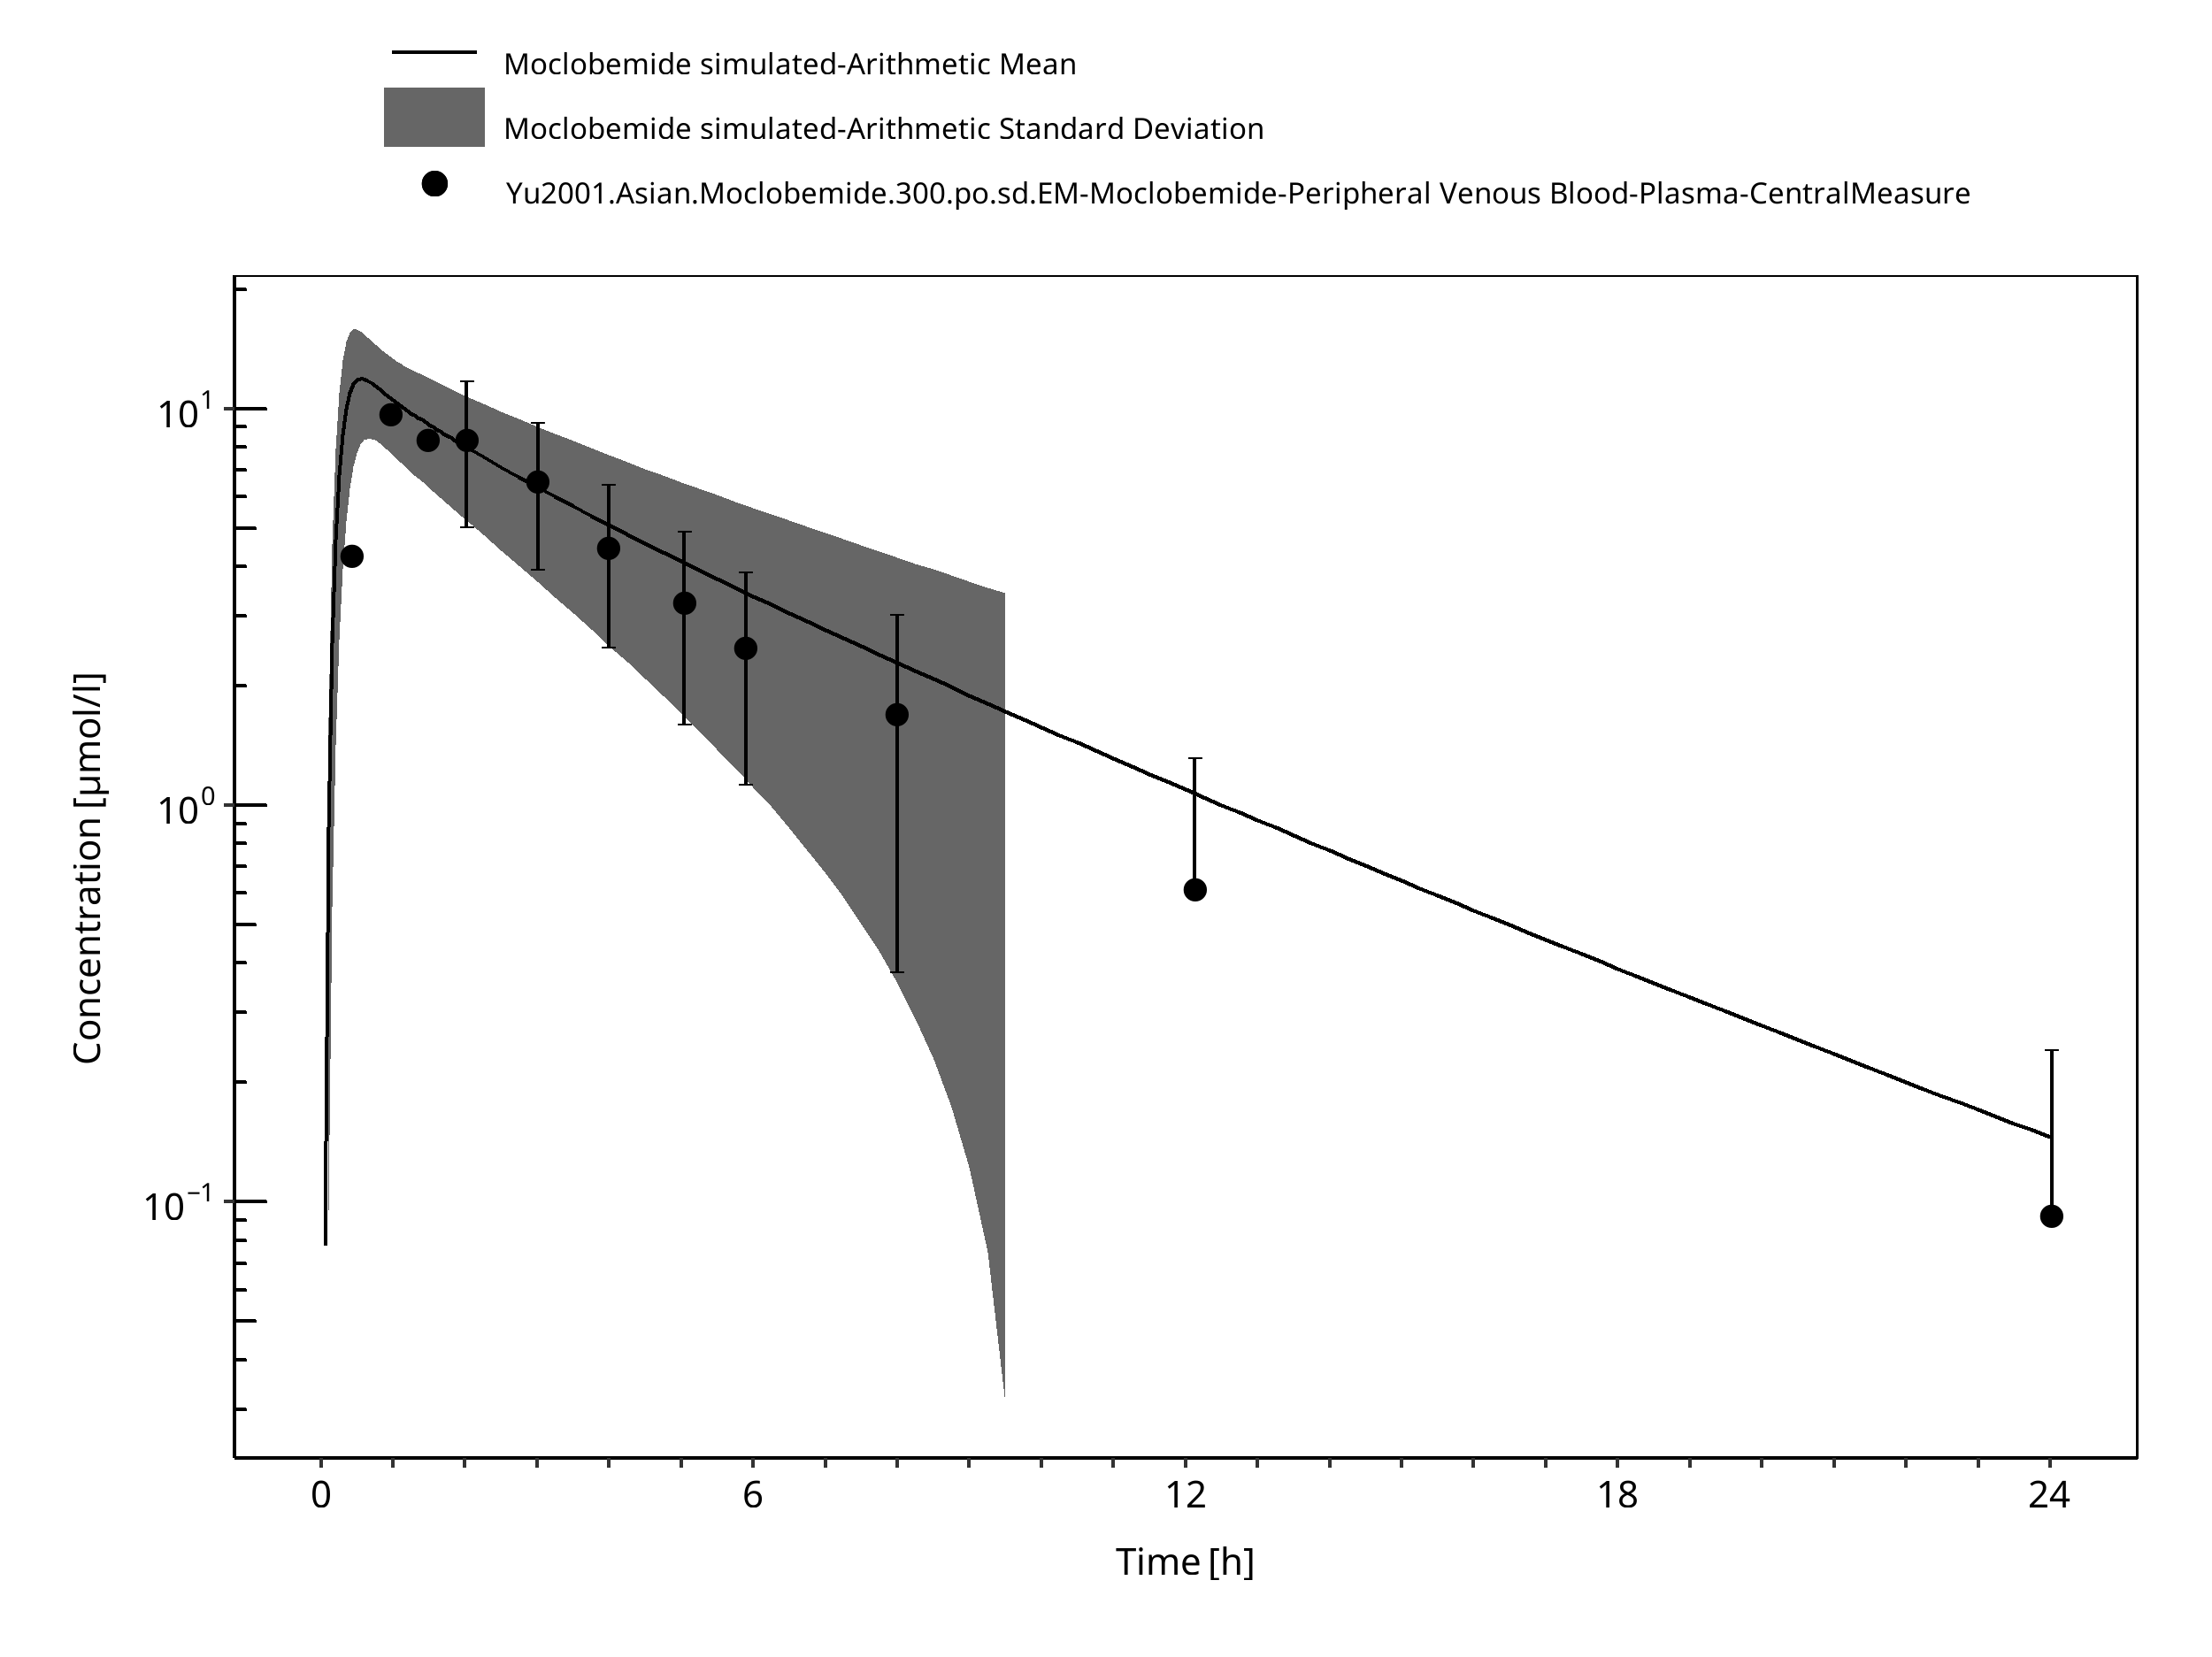
Figure 3-19: Time Profile Analysis
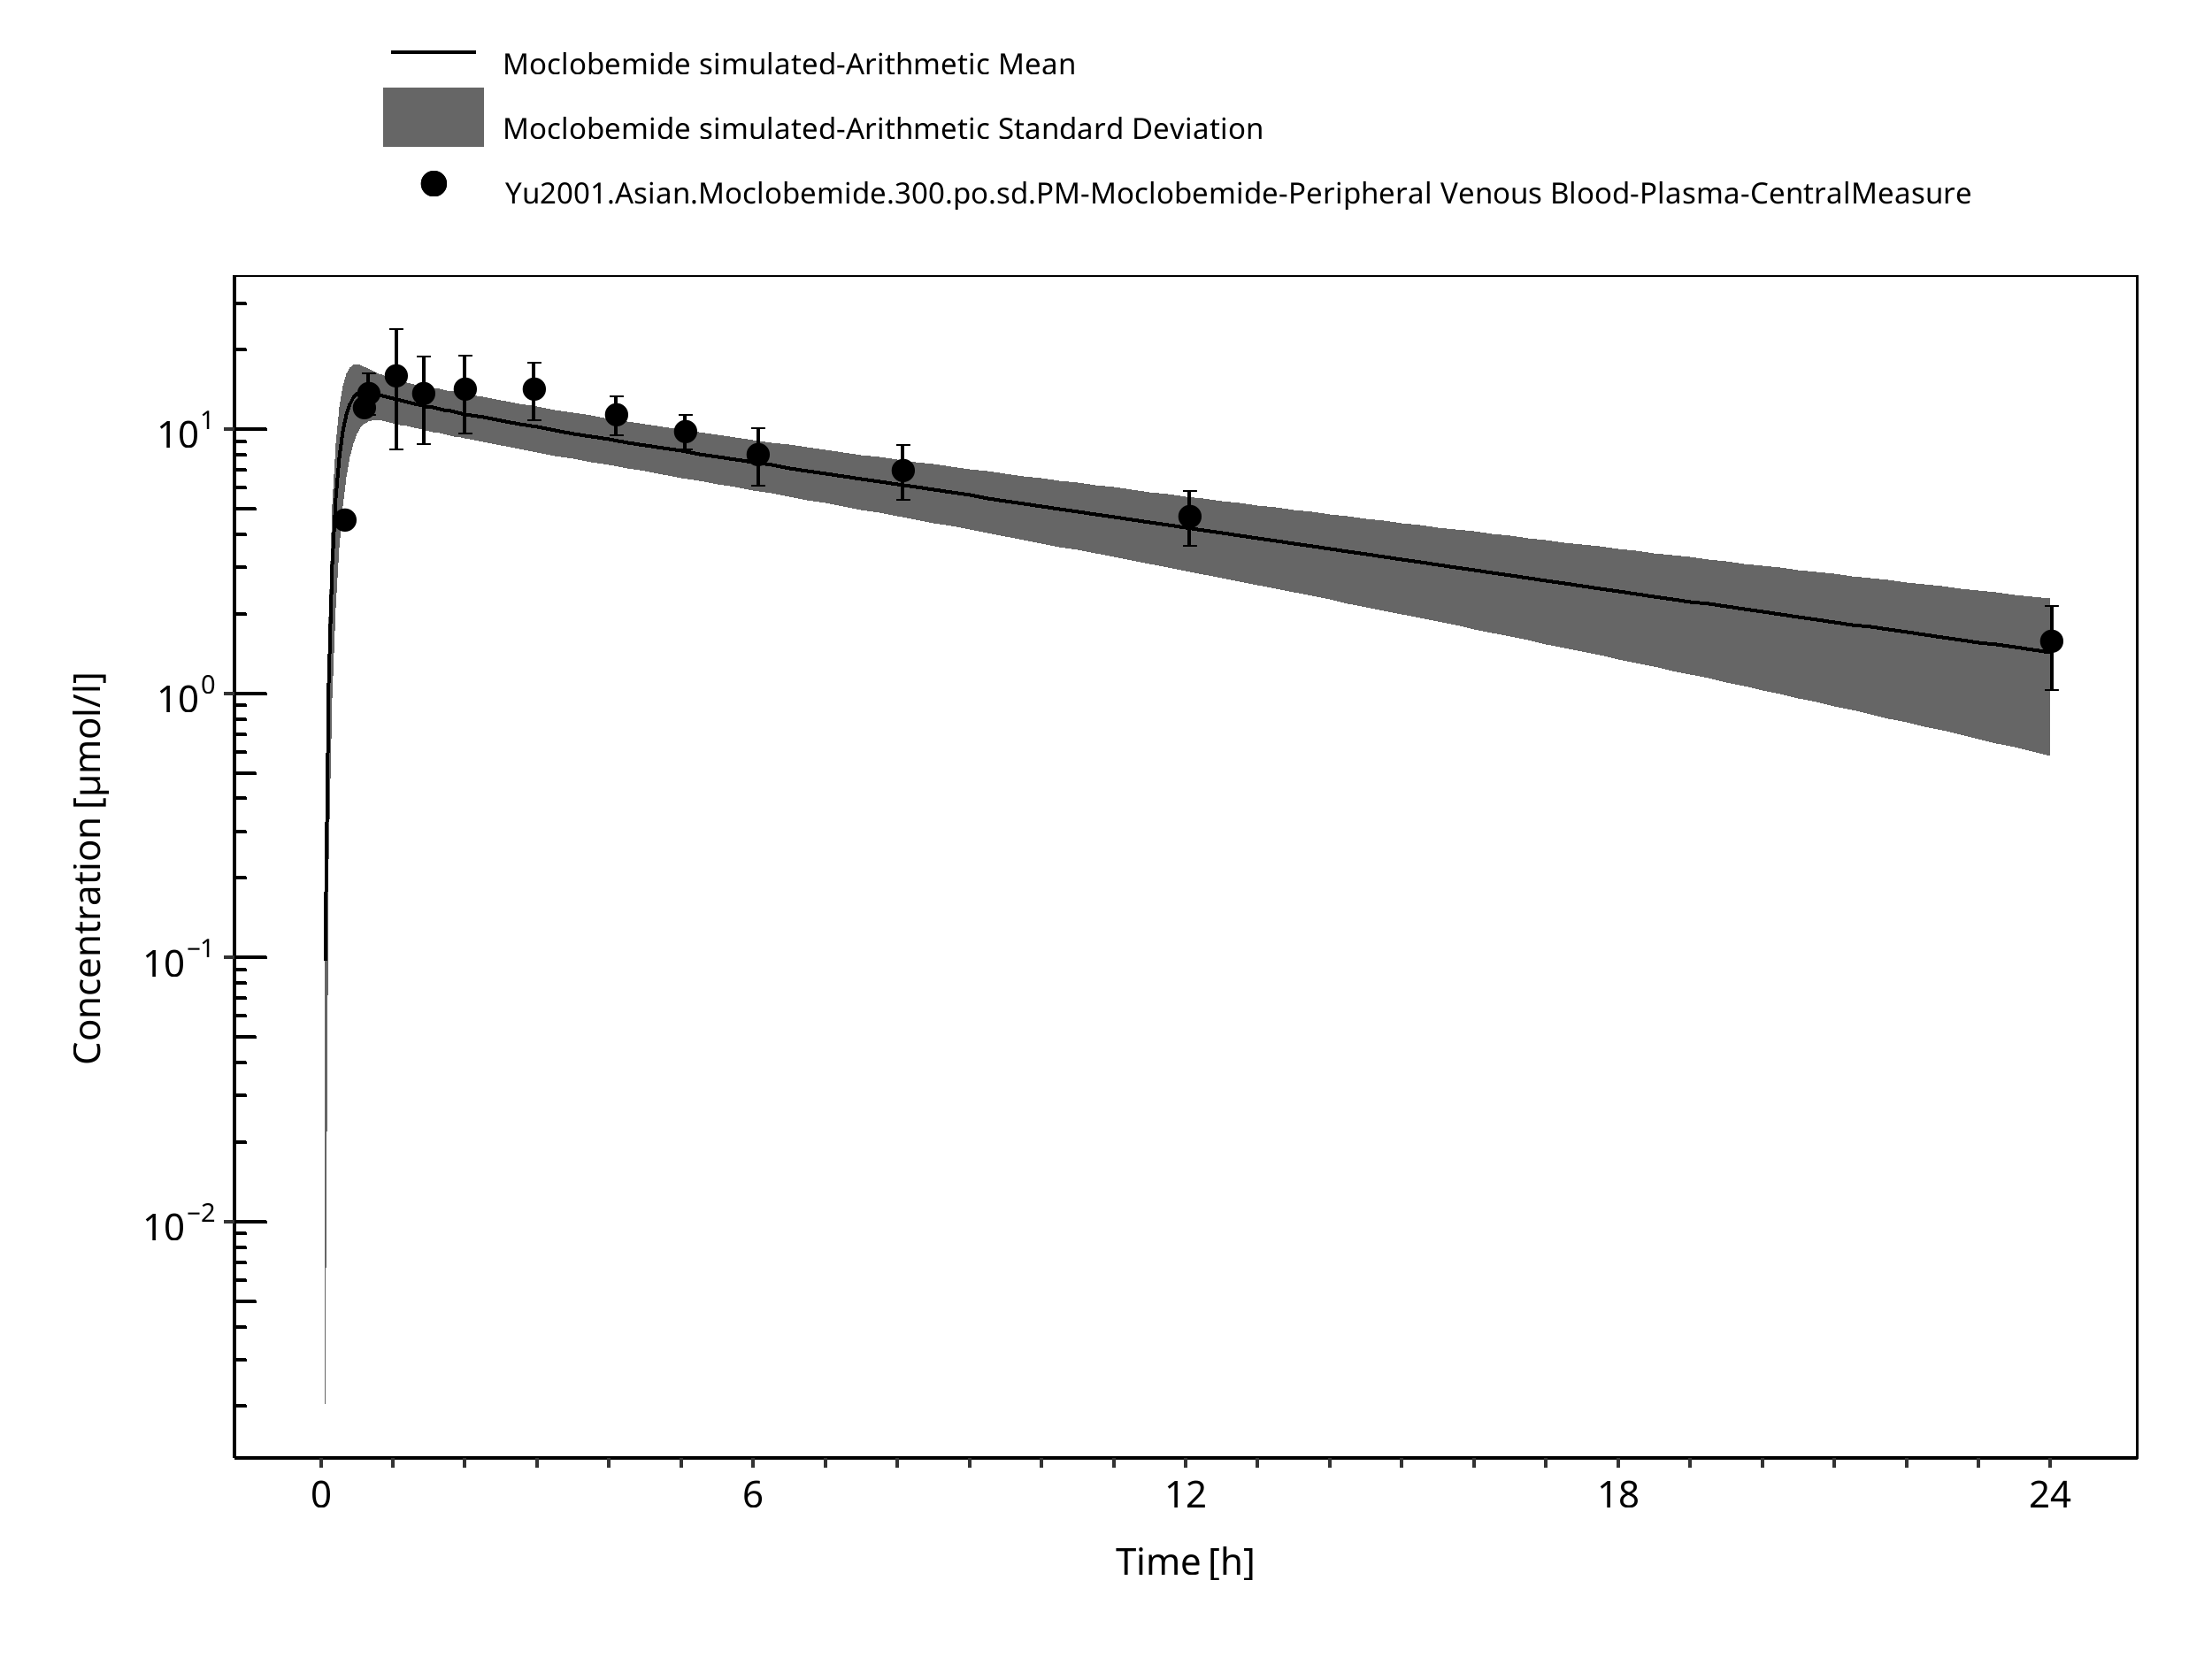
Figure 3-20: Time Profile Analysis
4 Conclusion
The developed PBPK model of moclobemide describes the observed concentration-time courses very well.
As most of the non-CYP2C19 metabolism is via FMO3 which is mainly expressed in the liver, non-CYP2C19 CL is modeled in the liver only.
Given not enough data to evaluate inhibition of emerging moclobemide metabolites, auto-inhibition of moclobemide appears appropriate approximation.
5 References
Dingemanse 1998 Dingemanse J, Wallnöfer A, Gieschke R, Guentert T, Amrein R. Pharmacokinetic and pharmacodynamic interactions between fluoxetine and moclobemide in the investigation of development of the “serotonin syndrome”. Clin Pharmacol Ther. 1998;63(4):403-413.
DrugBank DB01171 (https://www.drugbank.ca/drugs/DB01171)
Gram 1995 Gram LF, Guentert TW, Grange S, Vistisen K, Brøsen K. Moclobemide, a substrate of CYP2C19 and an inhibitor of CYP2C19, CYP2D6, and CYP1A2: A panel study. Clinical Pharmacology & Therapeutics. 1995 Jun;57(6):670–7.
Guentert 1990 Guentert TW, Tucker G, Korn A, Pfefen JP, Haefelfinger P, Schoerlin MP. Pharmacokinetics of moclobemide after single and multiple oral dosing with 150 milligrams 3 times daily for 15 days. Acta Psychiatr Scand. 1990;82(S360):91-93.
Hoskins 2001 Hoskins J, Shenfield G, Murray M, Gross A. Characterization of moclobemide N -oxidation in human liver microsomes. Xenobiotica. 2001 Jan;31(7):387–97.
IPCS INCHEM Website: https://inchem.org/documents/pims/pharm/pim151.htm#SectionTitle:3.3%20%20Physical%20properties
Ignjatovic 2009 Ignjatovic AR, Miljkovic B, Todorovic D, Timotijevic I, Pokrajac M. Moclobemide monotherapy vs. combined therapy with valproic acid or carbamazepine in depressive patients: A pharmacokinetic interaction study. Br J Clin Pharmacol. 2009;67(2):199-208.
Kuepfer 2016 Kuepfer L, Niederalt C, Wendl T, Schlender JF, Willmann S, Lippert J, Block M, Eissing T, Teutonico D. Applied Concepts in PBPK Modeling: How to Build a PBPK/PD Model.CPT Pharmacometrics Syst Pharmacol. 2016 Oct;5(10):516-531.
Kramer-Nielsen 1996 Kramer-Nielsen KK, Flinois JP, Beaune P, Brøsen K. The biotransformation of clomipramine in vitro, identification of the cytochrome P450s responsible for the separate metabolic pathways. J Pharmacol Exp Ther. 1996 Jun;277(3):1659–64.
Mayersohn 1995 Mayersohn M, Guentert TW. Clinical Pharmacokinetics of the Monoamine Oxidase-A Inhibitor Moclobemide, Clinical Pharmacokinetics. 1995 Nov;29(5):292–332.
MHRA Label Moclobemide MHRA label of Moclobemide film-coated tablets. Website: http://www.mhra.gov.uk/home/groups/par/documents/websiteresources/con097060.pdf
Moclobemide, INCHEM, Website https://inchem.org/documents/pims/pharm/pim151.htm#PartTitle:3.%20%20PHYSICO-CHEMICAL%20PROPERTIES
Nair 1993 Nair NPV, Ahmed SK, Ng Ying Kin NMK. Biochemistry and pharmacology of reversible inhibitors of MAO-A agents: Focus on moclobemide. J Psychiatry Neurosci. 1993;18(5):214-225.
PK-Sim Ontogeny Database Version 7.3 (https://github.com/Open-Systems-Pharmacology/OSPSuite.Documentation/blob/38cf71b384cfc25cfa0ce4d2f3addfd32757e13b/PK-Sim%20Ontogeny%20Database%20Version%207.3.pdf)
Pons 1990 Pons G, Schoerlin MP, Tam Y. Moclobemide excretion in human breast milk. Br J Clin Pharmacol. 1990;29(1):27–31.
Raaflaub 1984 Raaflaub J, Haefelfinger P, Trautmann KH. Single-dose Pharmacokinetics of the MAO-Inhibitor Moclobemide in Man. Drug Res. 1984; 34:80–2.
Schoerlin 1987 Schoerlin M-P, Mayersohn M, Korn A, Eggers H. Disposition kinetics of moclobemide, a monoamine oxidase-A enzyme inhibitor: Single and multiple dosing in normal subjects. Clinical Pharmacology and Therapeutics. 1987 Oct;42(4):395–404.
Wiesel 1985 Wiesel FA, Raaflaub J, Kettler R. Pharmacokinetics of oral moclobemide in healthy human subjects and effects on MAO-activity in platelets and excretion of urine monoamine metabolites. Eur J Clin Pharmacol. 1985;28(1 Supplement):89-95.
Willmann 2007 Willmann S, Höhn K, Edginton A, Sevestre M, Solodenko J, Weiss W, Lippert J, Schmitt W. Development of a physiology-based whole-body population model for assessing the influence of individual variability on the pharmacokinetics of drugs. J Pharmacokinet Pharmacodyn 2007, 34(3): 401-431.
Wu 2014 Wu F, Gaohua L, Zhao P, Jamei M, Huang S-M, Bashaw ED, et al. Predicting Nonlinear Pharmacokinetics of Omeprazole Enantiomers and Racemic Drug Using Physiologically Based Pharmacokinetic Modeling and Simulation: Application to Predict Drug/Genetic Interactions. Pharmaceutical Research. 2014 Aug;31(8):1919–29.
Yu 2001 Yu K, Yim DS, Cho J-Y, Park SS. Effect of omeprazole on the pharmacokinetics of moclobemide according to the genetic polymorphism of CYP2C19. Clinical Pharmacology & Therapeutics. 2001 Apr;69(4):266–73.
6 Glossary
| ADME | Absorption, Distribution, Metabolism, Excretion |
|---|---|
| AUC | Area under the plasma concentration versus time curve |
| AUCinf | AUC until infinity |
| AUClast | AUC until last measurable sample |
| AUCR | Area under the plasma concentration versus time curve Ratio |
| b.i.d. | Twice daily (bis in diem) |
| CL | Clearance |
| Clint | Intrinsic liver clearance |
| Cmax | Maximum concentration |
| CmaxR | Maximum concentration Ratio |
| CYP | Cytochrome P450 oxidase |
| CYP1A2 | Cytochrome P450 1A2 oxidase |
| CYP2C19 | Cytochrome P450 2C19 oxidase |
| CYP3A4 | Cytochrome P450 3A4 oxidase |
| DDI | Drug-drug interaction |
| e.c. | Enteric coated |
| EE | Ethinylestradiol |
| EM | Extensive metabolizers |
| fm | Fraction metabolized |
| FMO | Flavin-containing monooxygenase |
| fu | Fraction unbound |
| FDA | Food and Drug administration |
| GFR | Glomerular filtration rate |
| HLM | Human liver microsomes |
| hm | homozygous |
| ht | heterozygous |
| IM | Intermediate metabolizers |
| i.v. | Intravenous |
| IVIVE | In Vitro to In Vivo Extrapolation |
| Ka | Absorption rate constant |
| kcat | Catalyst rate constant |
| Ki | Inhibitor constant |
| Kinact | Rate of enzyme inactivation |
| Km | Michaelis Menten constant |
| m.d. | Multiple dose |
| OSP | Open Systems Pharmacology |
| PBPK | Physiologically-based pharmacokinetics |
| PK | Pharmacokinetics |
| PI | Parameter identification |
| PM | Poor metabolizers |
| RT-PCR | Reverse transcription polymerase chain reaction |
| p.o. | Per os |
| q.d. | Once daily (quaque diem) |
| SD | Single Dose |
| SE | Standard error |
| s.d.SPC | Single dose Summary of Product Characteristics |
| SD | Standard deviation |
| TDI | Time dependent inhibition |
| t.i.d | Three times a day (ter in die) |
| UGT | Uridine 5'-diphospho-glucuronosyltransferase |
| UM | Ultra-rapid metabolizers |
Related Models
Explore other Other Compounds models in this library:
- Fluvoxamine - PBPK model and evaluation report
- Tizanidine - PBPK model and evaluation report