Building and evaluation of a PBPK model for Omeprazole in adults
| Version | 2.0-OSP12.3 |
|---|---|
| based on Model Snapshot and Evaluation Plan | https://github.com/Open-Systems-Pharmacology/Omeprazole-Model/releases/tag/v2.0 |
| OSP Version | 12.3 |
| Qualification Framework Version | 3.7 |
This evaluation report and the corresponding PK-Sim project file are filed at:
https://github.com/Open-Systems-Pharmacology/OSP-PBPK-Model-Library/
Table of Contents
- 1 Introduction
- 2 Methods
- 2.1 Modeling Strategy
- 2.2 Data
- 2.3 Model Parameters and Assumptions
- 3 Results and Discussion
- 3.1 Final input parameters
- 3.2 Diagnostics Plots
- 3.3 Concentration-Time Profiles
- 4 Conclusion
- 5 References
- 6 Glossary
1 Introduction
The presented PBPK model of omeprazole has been developed to be used in a PBPK Drug-Drug-Interactions (DDI) network with omeprazole as a substrate of CYP2C19 and CYP3A4 and an inhibitor of CYP2C19.
Omeprazole is a proton pump inhibitor (PPI) for the treatment of gastric acid related diseases. Omeprazole is administered as a racemic mixture of its two enantiomers, S-omeprazole and R-omeprazole.
The following ADME characteristics for (R-/S-) omeprazole were taken from omeprazole 20 mg capsule FDA SPC:
Absorption: Absorption of (R-/S-) omeprazole is rapid, with peak plasma levels occurring approximately 1-2 hours after dose. Absorption of omeprazole takes place in the small intestine and is usually completed within 3-6 hours. The systemic availability (bioavailability) from a single oral dose of omeprazole is approximately 40%. After repeated once-daily administration, the bioavailability increases to about 60%.
Distribution: The apparent volume of distribution in healthy subjects is approximately 0.3 l/kg body weight. Omeprazole is 97% plasma protein bound.
Metabolism: (R-/S-) Omeprazole is completely metabolized by the cytochrome P450 system (CYP). The major part of its metabolism is dependent on the polymorphically expressed CYP2C19, responsible for the formation of hydroxyomeprazole, the major metabolite in plasma. The remaining part is dependent on another specific isoform, CYP3A4, responsible for the formation of omeprazole sulphone. As a consequence of high affinity of omeprazole to CYP2C19, there is a potential for competitive inhibition and metabolic drug-drug interactions. No metabolite has been found to be pharmacologically active.
Elimination: Almost 80% of an oral dose of omeprazole is excreted as metabolites in the urine, the remainder in the faeces, primarily originating from bile secretion.
Linearity/non-linearity: The AUC of omeprazole increases with repeated administration following a non-linear dose-AUC relationship. This time- and dose- dependency is due to a decrease of first pass metabolism and systemic clearance probably caused by an inhibition of the CYP2C19 enzyme by omeprazole and/or its metabolites (e.g. the sulphone).
Stereoselectivity: Because both enantiomers are substrates and inhibitors of CYP2C19, the PK profile of each enantiomer is expected to differ when the racemic mixture is administered as compared to as a single agent because of mutual inhibition between the enantiomers (Äbelö 2000). The Ki for R-omeprazole is 2-5 higher compared to S-omeprazole (Liu 2005, Wu 2014).
2 Methods
2.1 Modeling Strategy
The general workflow for building an adult PBPK model has been described by Kuepfer et al. (Kuepfer 2016). Relevant information on the anthropometry (height, weight) was gathered from the respective clinical study, if reported. Information on physiological parameters (e.g. blood flows, organ volumes, hematocrit) in adults was gathered from the literature and has been incorporated in PK-Sim® as described previously (Willmann 2007). The applied activity and variability of plasma proteins and active processes that are integrated into PK-Sim® are described in the publicly available 'PK-Sim® Ontogeny Database Version 7.3' (PK-Sim Ontogeny Database Version 7.3).
The model includes distinct molecules for S- and R-omeprazole, the racemic omeprazole is represented by an observer that sums up the concentrations of S- and R-omeprazole. It was assumed that both isomers correspond to the half of the racemic omeprazole dose.
In general, the following step-wise workflow was followed:
1a. Define distribution and metabolism for S-omeprazole
1b. Mechanism based inactivation of CYP2C19 by omeprazole
-
Define S-omeprazole absorption based on p.o.
-
Capsule formulation
-
3a. Building racemic omeprazole
-
3b. Adjust CYP2C19 expression in gut
-
Define metabolism for R-omeprazole
-
Refine CYP3A4 metabolism on CYP2C19 PM data
-
Refine CYP2C19 metabolism on CYP2C19 EM data
The predefined “Standard European Male for DDI” individual was used (age = 30 y, weight = 73 kg, height = 176 cm, BMI = 23.57 kg/m2) until stated otherwise. CYP2C19 expression from the PK-Sim in-built RT-PCR database was added and adjusted as described in Section 2.3.3.
Selection of the distribution model for S-omeprazole and estimation of the lipophilicity parameter were performed with i.v. data (Wilder-Smith 2005, Hassan-Alin 2000).
The kinetics of CYP2C19 and CYP3A4 metabolization processes of S-omeprazole and R-omeprazole were estimated using the Parameter Identification module provided in PK-Sim® with i.v. and p.o. data including administration of S-, R- or racemic omeprazole, see Table 3, Table 4, and Table 5 for more details. The kinetic parameters were assumed not to be identical for the isomers. For simulations of CYP2C19 poor metabolizers, the CYP2C19 pathway was switched off.
For studies in Japanese subjects, a typical Japanese subject (age = 30 y, weight = 61.87 kg, height = 168.99 cm, BMI = 21.67 kg/m2) was created in PK-Sim from predefined database “Japanese (2015)” by adding CYP3A4 and CYP2C19 expression from PK-Sim RT PCR database, and adapting CYP2C19 expression in gut as described in Section 2.3.3.
Intestinal permeability of S-omeprazole was estimated by fitting the model to concentration-time data measured after p.o. administration of 20 or 40 mg given as solution (Hassan-Alin 2005).
Parameters Dissolution time (50% dissolved) and Dissolution shape describing the dissolution of capsule formulation were fitted to the data after single dose S-omeprazole 40 mg capsule (Wilder-Smith 2005).
Details about input data (physicochemical, in vitro and clinical) can be found in Section 2.2.
Details about the structural model and its parameters can be found in Section 2.3.
Population simulations of single and multiple i.v. or p.o. administration over a wide range of dose levels were conducted to visually compare the predicted concentration-time profile to the observed concentrations reported in the literature, in terms of mean and variability. The simulated populations matched the race (European or Asian) and the age-weight ranges reported in the respective clinical studies. A total of 1000 individuals were generated for studies in males only, while 2000 were generated for mixed gender populations. The concentration time profile was simulated for each virtual subject and summarized as geometric mean and 95% CI. The simulations were performed for extensive and poor CYP2C19 metabolizers.
2.2 Data
2.2.1 In vitro and physico-chemical data
A literature search was performed to collect available information on physico-chemical properties of S- and R-omeprazole and summarized in Table 1 and Table 2, respectively.
| Parameter | Unit | Value | Source | Description |
|---|---|---|---|---|
| MW+ | g/mol | 345.42 | DrugBank DB00338 | Molecular weight. |
| pKa,acid+ | 9.29 | DrugBank DB00338 | Acidic dissociation constant | |
| pKa,base+ | 4.77 | DrugBank DB00338 | Basic dissociation constant | |
| Solubility (pH)+ | mg/mL | 0.36 (7) |
DrugBank DB00338 | Aqueous Solubility |
| logD | 2.23 | Ogilvie 2011 | Distribution coefficient | |
| fu+ | % | 3 | Nexium prescribing information | Fraction unbound in plasma |
| Kinact CYP2C19+ | l/h | 5 | Wu 2014 | Kinact of time dependent inhibition on CYP2C19 |
| Ki CYP2C19+ | µM | 0.3 | Wu 2014 | KI of time dependent inhibition on CYP2C19 |
| Ki CYP2C19 (competitive inhibition)+ | µM | 3.1 | Liu 2005 | The total ki value reported by Liu was 3.4 µmol/L and corrected with an fu_mic of 0.92 |
| Renal Elimination+ | l/h | 0.037 | Wu 2014 | Assumed same as omeprazole |
Table 1: Physico-chemical and in-vitro metabolization properties of S-omeprazole extracted from literature. +: Value used in final model
| Parameter | Unit | Value | Source | Description |
|---|---|---|---|---|
| MW+ | g/mol | 345.42 | DrugBank DB00338 | Molecular weight. |
| pKa,acid+ | 9.29 | DrugBank DB00338 | Acidic dissociation constant | |
| pKa,base+ | 4.77 | DrugBank DB00338 | Basic dissociation constant | |
| Solubility (pH)+ | mg/mL | 0.36 (7) |
DrugBank DB00338 | Aqueous Solubility |
| logD | 2.23 | Ogilvie 2011 | Distribution coefficient | |
| fu+ | % | 4 | Ogilvie 2011 | Fraction unbound in plasma; assumed same as omeprazole |
| Kinact CYP2C19+ | l/h | 4 | Wu 2014 | Kinact of time dependent inhibition on CYP2C19 |
| Ki CYP2C19+ | µM | 1.6 | Wu 2014 | KI of time dependent inhibition on CYP2C19 |
| Ki CYP2C19 (competitive inhibition)+ | µM | 5.3 | Liu 2005 | The total ki value reported by Liu was 5.7 µmol/L and corrected with an fu_mic of 0.92 |
| Renal Elimination+ | l/h | 0.037 | Wu 2014 | Assumed same as omeprazole |
Table 2: Physico-chemical and in-vitro metabolization properties of R-omeprazole extracted from literature. +: Value used in final model
2.2.2 Clinical data
A literature search was performed to collect available clinical data on omeprazole in adults. Data used for model development and validation for omeprazole, S-omeprazole, and R-omeprazole are listed in Table 3, Table 4, and Table 5, respectively.
| Source | Route | Dose [mg]/ Schedule * | Pop. | Sex | N | Form. | Comment |
|---|---|---|---|---|---|---|---|
| Andersson 1990+ | i.v. | 40 - 80 | HV | M | 10 | solution | |
| Andersson 1990 | p.o. | 40 - 80 | HV | M | 10 | Oral solution | |
| Andersson 1991 | p.o. | 10 - 20 – 40 q.d. | HV | M | 12 | e.c. granules | |
| Andersson 1991+ | i.v. | 10 - 20 - 40 | HV | M | 12 | solution | |
| Andersson 1998 | p.o. | 20 q.d. | HV | M | 12 | capsule | EM |
| Andersson 1998 | p.o. | 20 q.d. | HV | M | 2 | capsule | PM |
| Oosterhuis 1992+ | i.v. | 40 - 80 | HV | M | 8 | solution | |
| Uno 2007+ | i.v. | 20 | HV japanese | M - F | 6 | solution | hmEM |
| Uno 2007+ | i.v. | 20 | HV japanese | M - F | 6 | solution | PM |
| Uno 2007 | p.o. | 40 | HV japanese | M - F | 6 | tablet | hmEM |
| Uno 2007 | p.o. | 40 | HV japanese | M - F | 6 | tablet | PM |
| Regårdh 1990+ | i.v. | 10 | HV | M | 8 | solution | |
| Regårdh 1990 | p.o. | 20 | HV | M | 8 | Oral solution | |
| Andersson 2000 | p.o. | 15 q.d. | HV | - | 4 | Oral solution | EM |
| Andersson 2000 | p.o. | 60 q.d. | HV | - | 5 | Oral solution | PM |
| Hassan-Alin 2005 | p.o. | 20 – 40 q.d. | HV | - | - | Oral solution | |
| Cho 2002 | p.o. | 20 | HV asian | - | - | capsule | EM +/- moclobemide |
| Cho 2002 | p.o. | 20 | HV asian | - | - | capsule | PM +/- moclobemide |
| Yasui-Furukori 2004 | p.o. | 40 | HV japanese | M - F | 6 | omepral | |
| Yasui-Furukori 2004 | p.o. | 40 | HV japanese | M - F | 6 | omepral | PM +/- fluvoxamine |
| Wu 2016 | p.o. | 40 q.d. | HV caucasian | M - F | 15 | gastro-resistant hard capsule |
Table 3: Literature sources of clinical concentration data of omeprazole used for model development and validation. e.c.: enteric coated; -: respective information was not provided in the literature source; *:single dose unless otherwise specified; EM: extensive metabolizers; PM: poor metabolizers; +: Data used for final parameter identification
| Source | Route | Dose [mg]/ Schedule * | Pop. | Sex | N | Form. | Comment |
|---|---|---|---|---|---|---|---|
| Wilder-Smith 2005+ | i.v. | 40 q.d. | HV | M - F | 39 | solution | |
| Wilder-Smith 2005+ | p.o. | 40 q.d. | HV | M - F | 37 | capsule | |
| Hassan-Alin 2000+ | i.v. | 20 - 40 | HV | - | - | solution | |
| Andersson 2000 | p.o. | 15 q.d. | HV | - | 4 | oral solution | EM |
| Andersson 2000+ | p.o. | 60 q.d. | HV | - | 5 | oral solution | PM |
| Hassan-Alin 2005+ | p.o. | 20 - 40 q.d. | HV | - | - | oral solution | |
| FDA Nexium Review | p.o. | 40 | HV | M | - | - | EM |
| FDA Nexium Review+ | p.o. | 40 | HV | M | - | - | PM |
| Rohss 2007+ | i.v. | 120mg(30min)+8mg/h - 120mg(2h)+8mg/h - 80mg(30min)+4mg/h - 80mg(30min)+8mg/h - 40mg(30min)+8mg/h | HV | - | 25 | solution |
Table 4: Literature sources of clinical concentration data of S-omeprazole used for model development and validation. e.c.: enteric coated; -: respective information was not provided in the literature source; *:single dose unless otherwise specified; EM: extensive metabolizers; PM: poor metabolizers; +: Data used for final parameter identification
| Source | Route | Dose [mg]/ Schedule * | Pop. | Sex | N | Form. | Comment |
|---|---|---|---|---|---|---|---|
| Andersson 2000+ | p.o. | 15 q.d. | HV | - | 4 | oral solution | EM |
| Andersson 2000+ | p.o. | 60 q.d. | HV | - | 5 | oral solution | PM |
| Hassan-Alin 2005+ | p.o. | 20 - 40 q.d. | HV | - | - | oral solution |
Table 5: Literature sources of clinical concentration data of R-omeprazole used for model development and validation. e.c.: enteric coated; -: respective information was not provided in the literature source; *:single dose unless otherwise specified; EM: extensive metabolizers; PM: poor metabolizers; +: Data used for final parameter identification
2.3 Model Parameters and Assumptions
2.3.1 Absorption
The model parameter Specific intestinal permeability for S-omeprazole was optimized to best match clinical data (see Section 2.3.4). The same parameter value was assumed for R-omeprazole.
The dissolution of the capsule formulation was implemented via an empirical Weibull dissolution equation with parameters Dissolution time (50% dissolved) and Dissolution shape fitted to observed data. A Lag time = 30 min was used to account for the gastric emptying time.
2.3.2 Distribution
Physico-chemical parameter values of S- and R-omeprazole were set to the reported values (see Section 2.2.1) except for lipophilicity of S-omeprazole, which was estimated with i.v. data. It was assumed that the major binding partner in plasma is albumin.
After testing the available organ-plasma partition coefficient and cell permeability calculation methods available in PK-Sim, observed clinical data were best described by choosing the partition coefficient calculation by Rodgers and Rowland and cellular permeability calculation by PK-Sim Standard.
The same distribution model and parameter values were assumed for R-omeprazole, as no i.v. data are available for R-omeprazole.
2.3.3 Metabolism and Elimination
Two linear metabolic pathways for S- and R-omeprazole were implement in the model:
- CYP2C19
- CYP3A4
To describe multiple dose oral solution data, time-dependent autoinhibition (TDI) on CYP2C19 was added as irreversible inhibition / Mechanism-based inactivation as described by Wu 2014.
Competitive inhibition of CYP2C19 by both isomers was implemented in addition to TDI (Liu 2005).
Simulation results suggested that the expression of CYP2C19 isoenzymes in the GI tract as provided by the RT-PCR PK-Sim database is significantly preventing R-omeprazole from entering the circulation. This was less apparent for S-omeprazole. To note, while the absolute mean CYP3A4 abundance in liver (1.03e7 pmol per liver) and the intestinal/liver CYP3A4 ratio in PK-Sim default individual are similar to values used in other models, the relative intestinal CYP2C19 and CYP2D6 abundances differ (Table 6). The relative expression of CYP2C19 in gut was therefore reduced according to Olivares-Morales 2016 for the final model.
| Ratio | Olivares-Morales 20161 | Galetin and Houston 20062 | GastroPlus | RT-PCR PK-Sim | Comment |
|---|---|---|---|---|---|
| CYP3A4/2C19 relative abundance liver | 9.8 | 11.1 | 8.1 | 5.68 | CYP2C19 abundance in liver 1.8-fold higher than other literature sources |
| CYP3A4/2C19 relative abundance intestine | 43.8 | 43.0 | - | 1.28 | CYP2C19 abundance in intestine 22-fold higher than other literature sources |
| CYP3A4/2D6 relative abundance liver | 17.1 | 19.4 | 14.2 | 10.80 | CYP2D6 abundance in liver 1.6-fold higher than other literature sources |
| CYP3A4/2D6 relative abundance intestine | 83.8 | 86.0 | - | 8.64 | CYP2D6 abundance in intestine 6-fold higher than other literature sources |
| CYP3A4 abundance Small intestine/liver | 0.66% | - | - | 0.44% | in range with literature |
| CYP2C19 abundance Small intestine/liver | 0.15% | - | - | 1.95% | 23-fold higher than in literature |
| CYP2D6 Small intestine/liver | 0.14% | - | - | 0.55% | 4-fold higher than in literature |
Table 6: Comparison of CYP3A4, CYP2C19 and CYP2D6 relative abundance in liver and small intestine from different literature sources. 1 Based on Sjörgen 2014: CYP relative expressions (pmol/mg_mic_p) from Paine 2006 calibrated against total intestinal CYP3A4 abundance. 2 Mean hepatic and intestinal relative abundance based on Rowland and Yeo 2003 and Paine 2006
Additionally, renal plasma clearance was implemented (Wu 2014).
2.3.4 Observer for racemic omeprazole
Omeprazole concentrations in peripheral venous blood plasma at any specific time points were obtained by adding the simulated concentrations of two enantiomers together at the corresponding time points to generate the omeprazole PK profiles, according to the following formula:
fQ_art*(C_pls_art_Eso+C_pls_art_R_O) +fQ_bon*(C_pls_bon_Eso+C_pls_bon_R_O)+fQ_fat*(C_pls_fat_Eso + C_pls_fat_R_O)+fQ_mus*(C_pls_mus_Eso + C_pls_mus_R_O) +fQ_skn*(C_pls_skn_Eso + C_pls_skn_R_O)
where fQ_ are fraction of blood flow and C_pls_ concentrations in plasma compartment respectively in the arterial (art), bone (bon), fat (fat), muscle (mus) or skin (skn) tissues. Eso and R_O stand for S- and R-omeprazole respectively.
2.3.5 Automated Parameter Identification
Following parameter values were estimated for the base model:
| Parameter | Compound |
|---|---|
| Lipophilicity | S-Omeprazole |
| Specific intestinal permeability (transcellular) | S-Omeprazole |
| Dissolution time (Weibull) | S-Omeprazole |
| Dissolution shape (Weibull) | S-Omeprazole |
| Specific CL_2C19 | S-Omeprazole |
| Specific CL_2C19 | R-Omeprazole |
| Specific CL_3A4 | S-Omeprazole |
| Specific CL_3A4 | R-Omeprazole |
3 Results and Discussion
The next sections show:
- Final model input parameters for the building blocks: Section 3.1.
- Overall goodness of fit: Section 3.2.
- Simulated vs. observed concentration-time profiles for the clinical studies used for model building and for model verification: Section 3.3.
3.1 Final input parameters
The parameter values of the final PBPK model are illustrated below.
Compound: Esomeprazole
Parameters
| Name | Value | Value Origin | Alternative | Default |
|---|---|---|---|---|
| Solubility at reference pH | 0.359 mg/ml | Database-DrugBank DB00338 | Measurement | True |
| Reference pH | 7 | Database-DrugBank DB00338 | Measurement | True |
| Lipophilicity | 1.6835584938 Log Units | Parameter Identification-Parameter Identification | LogP fit | True |
| Fraction unbound (plasma, reference value) | 0.03 | Database-DrugBank DB00338 | Fu DrugBank | True |
| Specific intestinal permeability (transcellular) | 9.79E-05 cm/min | Parameter Identification-Parameter Identification | Fit | True |
| Is small molecule | Yes | |||
| Molecular weight | 345.416 g/mol | Database-DrugBank DB00338 | ||
| Plasma protein binding partner | Albumin |
Calculation methods
| Name | Value |
|---|---|
| Partition coefficients | Rodgers and Rowland |
| Cellular permeabilities | PK-Sim Standard |
Processes
Metabolizing Enzyme: CYP2C19-2C19 Linear Fit
Species: Human
Molecule: CYP2C19
Parameters
| Name | Value | Value Origin |
|---|---|---|
| Intrinsic clearance | 0 l/min | |
| Specific clearance | 13.98 1/min | Parameter Identification-Parameter Identification |
Metabolizing Enzyme: CYP3A4-3A4 Linear Fit
Species: Human
Molecule: CYP3A4
Parameters
| Name | Value | Value Origin |
|---|---|---|
| Intrinsic clearance | 0 l/min | |
| Specific clearance | 0.3707655759 1/min | Parameter Identification-Parameter Identification |
Systemic Process: Renal Clearances-Wu2014 - Table1 - CLr
Species: Human
Parameters
| Name | Value | Value Origin |
|---|---|---|
| Fraction unbound (experiment) | 0.05 | |
| Plasma clearance | 0.000507 l/h/kg | Unknown-0.037l/h/73kg |
Inhibition: CYP2C19-Liu 2005 - Ki in vivo unbound
Molecule: CYP2C19
Parameters
| Name | Value | Value Origin |
|---|---|---|
| Ki | 3.1 µmol/l | Publication-Liu 2005 |
Inhibition: CYP2C19-Wu2014 - Table1 - TDI
Molecule: CYP2C19
Parameters
| Name | Value | Value Origin |
|---|---|---|
| kinact | 5 1/h | Publication-Wu 2014 |
| K_kinact_half | 0.3 µmol/l |
Compound: R-omeprazole
Parameters
| Name | Value | Value Origin | Alternative | Default |
|---|---|---|---|---|
| Solubility at reference pH | 0.359 mg/ml | Database-DrugBank DB00338 | Measurement | True |
| Reference pH | 7 | Database-DrugBank DB00338 | Measurement | True |
| Lipophilicity | 1.6835584938 Log Units | Other-Assumption-Same as S-omeprazole | LogP fit | True |
| Fraction unbound (plasma, reference value) | 0.04 | Publication-Ogilvie 2011 | Fu DrugBank | True |
| Specific intestinal permeability (transcellular) | 9.79E-05 cm/min | Other-Assumption-Assumend same as S-omeprazole | Fit | True |
| Is small molecule | Yes | |||
| Molecular weight | 345.416 g/mol | Database-DrugBank DB00338 | ||
| Plasma protein binding partner | Albumin |
Calculation methods
| Name | Value |
|---|---|
| Partition coefficients | Rodgers and Rowland |
| Cellular permeabilities | PK-Sim Standard |
Processes
Metabolizing Enzyme: CYP2C19-2C19 Linear Fit
Species: Human
Molecule: CYP2C19
Parameters
| Name | Value | Value Origin |
|---|---|---|
| Intrinsic clearance | 0 l/min | |
| Specific clearance | 50 1/min | Parameter Identification-Parameter Identification-Upper bound limited |
Metabolizing Enzyme: CYP3A4-3A4 Linear Fit
Species: Human
Molecule: CYP3A4
Parameters
| Name | Value | Value Origin |
|---|---|---|
| Intrinsic clearance | 0 l/min | |
| Specific clearance | 0.161397262 1/min | Parameter Identification-Parameter Identification |
Systemic Process: Renal Clearances-Wu2014 - Table1 - CLr
Species: Human
Parameters
| Name | Value | Value Origin |
|---|---|---|
| Fraction unbound (experiment) | 0.03 | |
| Plasma clearance | 0 ml/min/kg | |
| Specific clearance | 0.0282095334 1/min | Publication-Wu 2014 |
Inhibition: CYP2C19-Liu 2005 - Ki in vivo unbound
Molecule: CYP2C19
Parameters
| Name | Value | Value Origin |
|---|---|---|
| Ki | 5.3 µmol/l | Publication-Liu 2005 |
Inhibition: CYP2C19-Wu2014 - Table1 - TDI
Molecule: CYP2C19
Parameters
| Name | Value | Value Origin |
|---|---|---|
| kinact | 4 1/h | Publication-Wu 2014 |
| K_kinact_half | 1.6 µmol/l |
Formulation: Omeprazole capsule
Type: Weibull
Parameters
| Name | Value | Value Origin |
|---|---|---|
| Dissolution time (50% dissolved) | 41.65 min | Parameter Identification-Parameter Identification |
| Lag time | 30 min | Other-Assumption-Gastric emptying |
| Dissolution shape | 1.02 | Parameter Identification-Parameter Identification |
| Use as suspension | Yes |
3.2 Diagnostics Plots
The following section displays the goodness-of-fit visual diagnostic plots for the PBPK model performance of all data listed in Section 2.2.2.
The first plot shows observed versus simulated plasma concentration, the second weighted residuals versus time.
Table 3-1: GMFE for S-omeprazole concentration in plasma - mean data
| Group | GMFE |
|---|---|
| iv administration (model building) | 1.39 |
| Oral administration (model building) | 1.43 |
| Oral administration (model validation) | 1.72 |
| All | 1.50 |
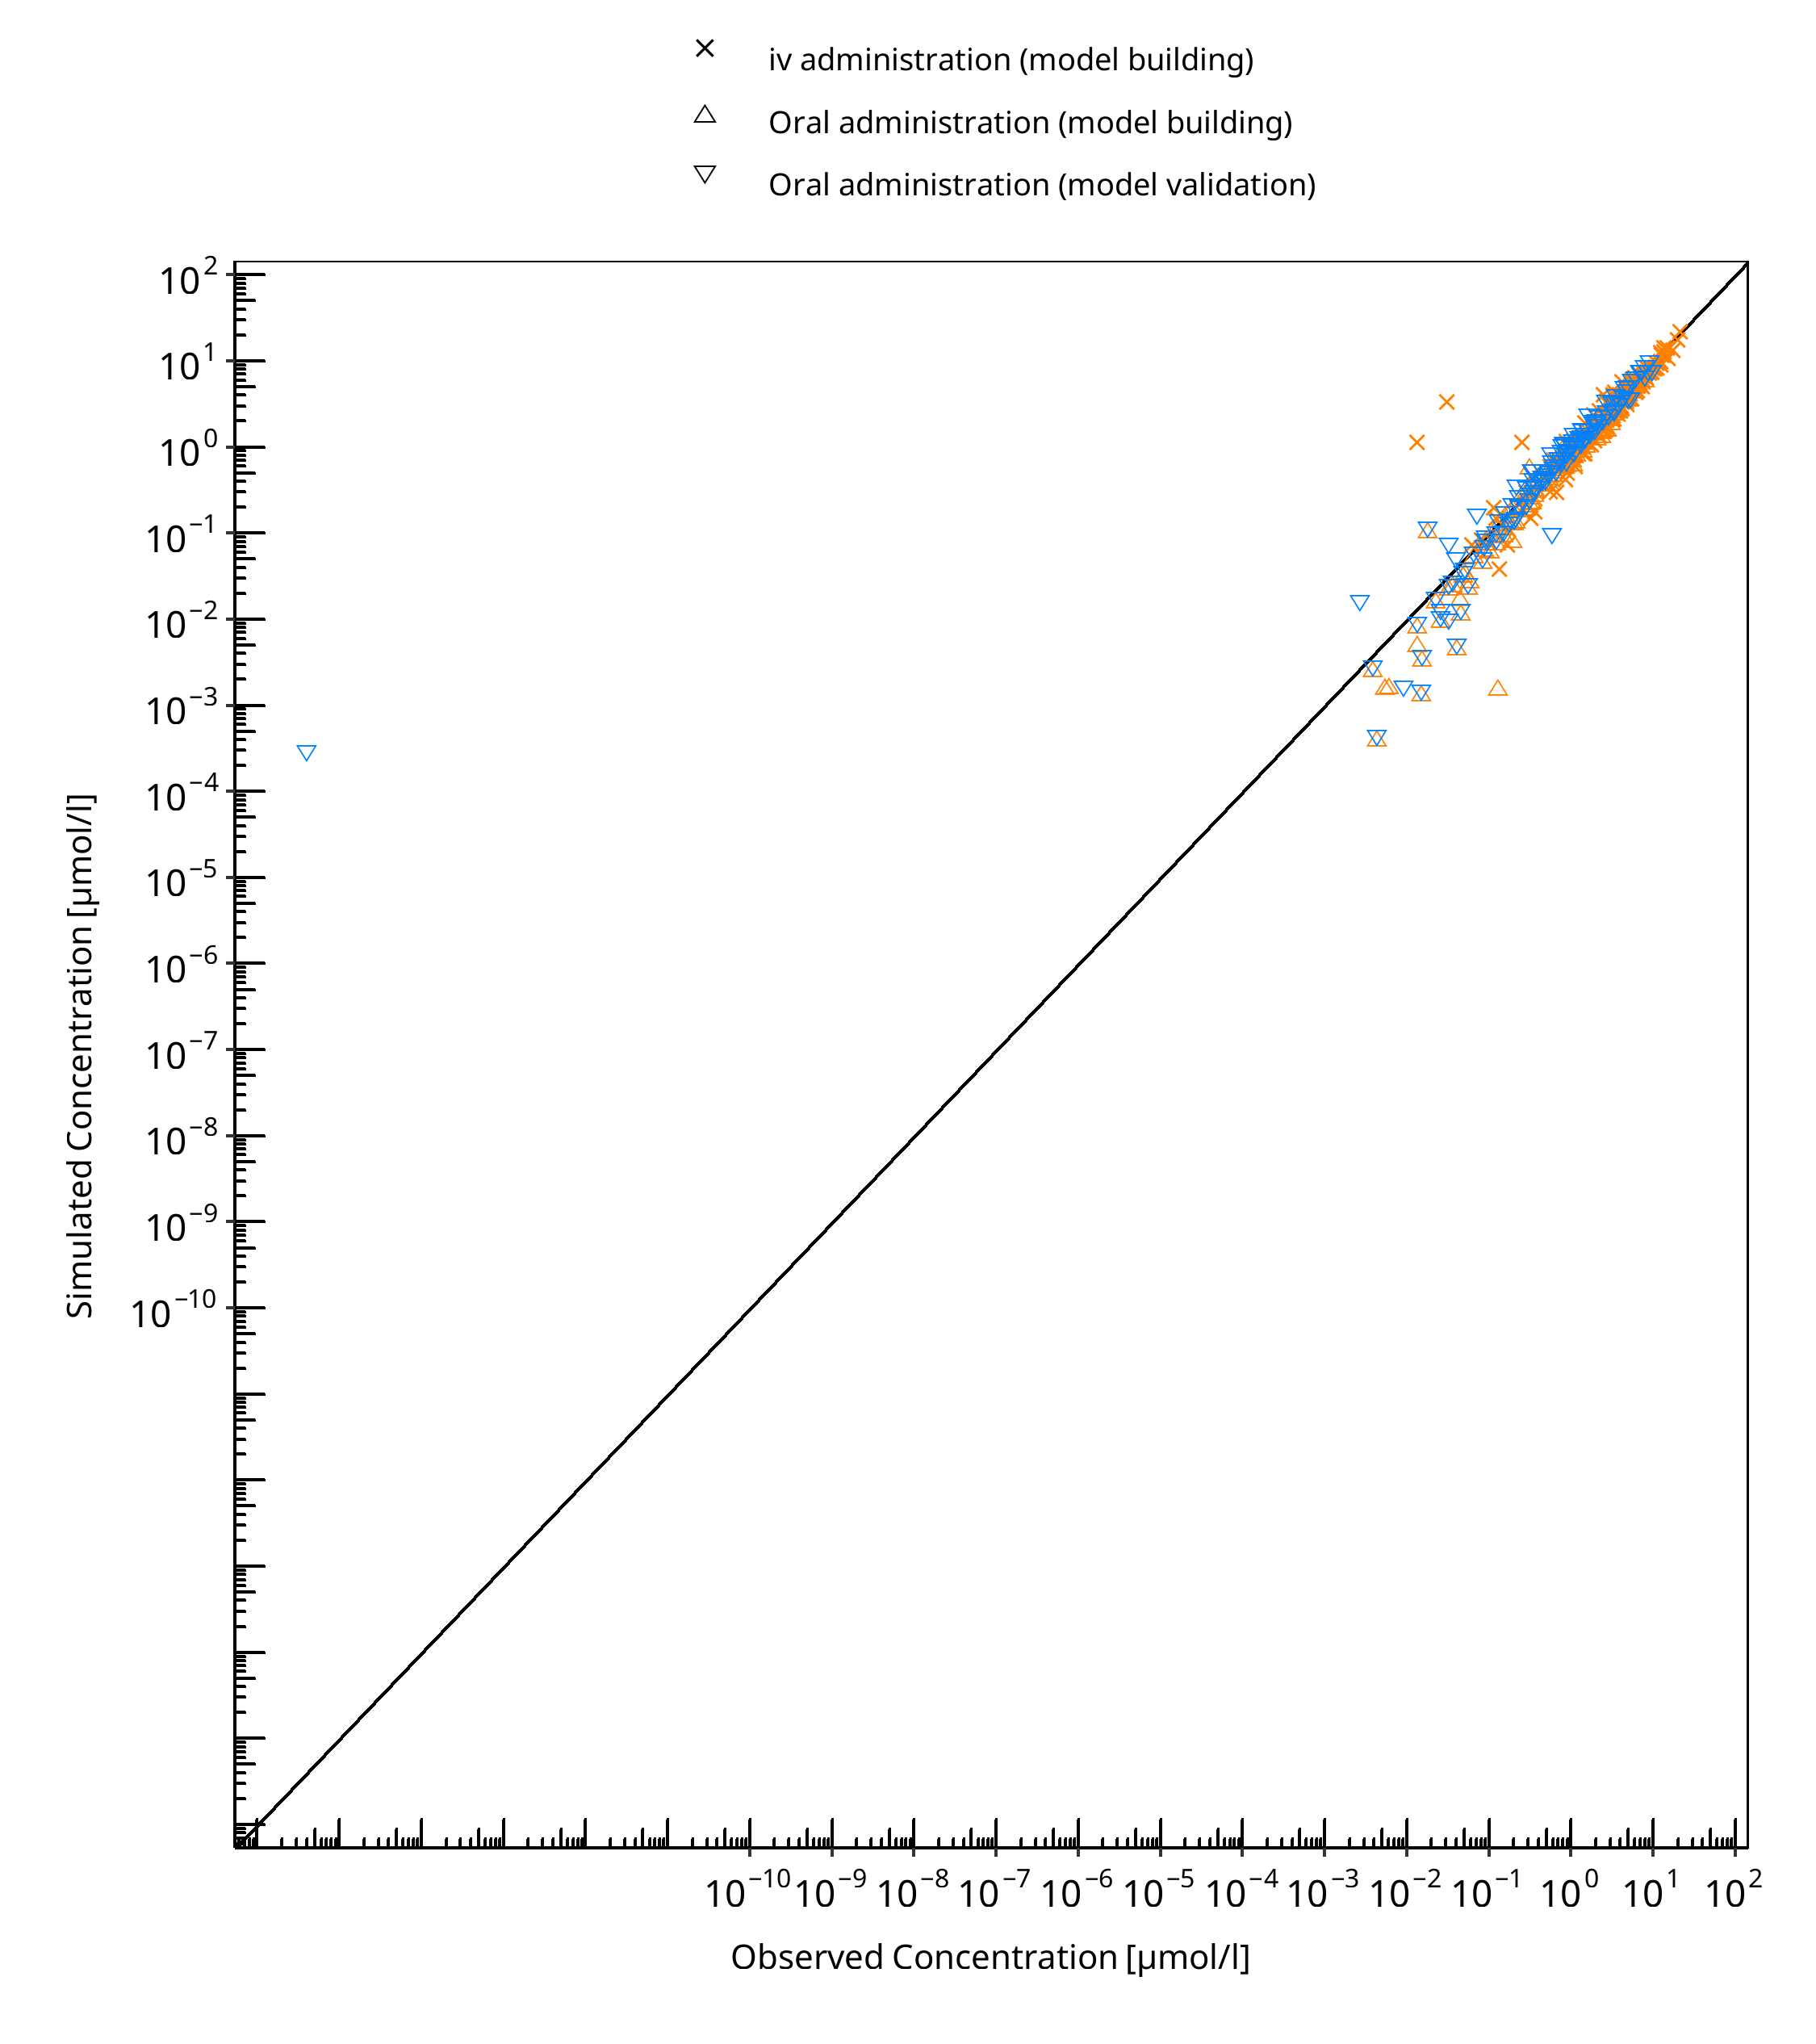
Figure 3-1: S-omeprazole concentration in plasma - mean data
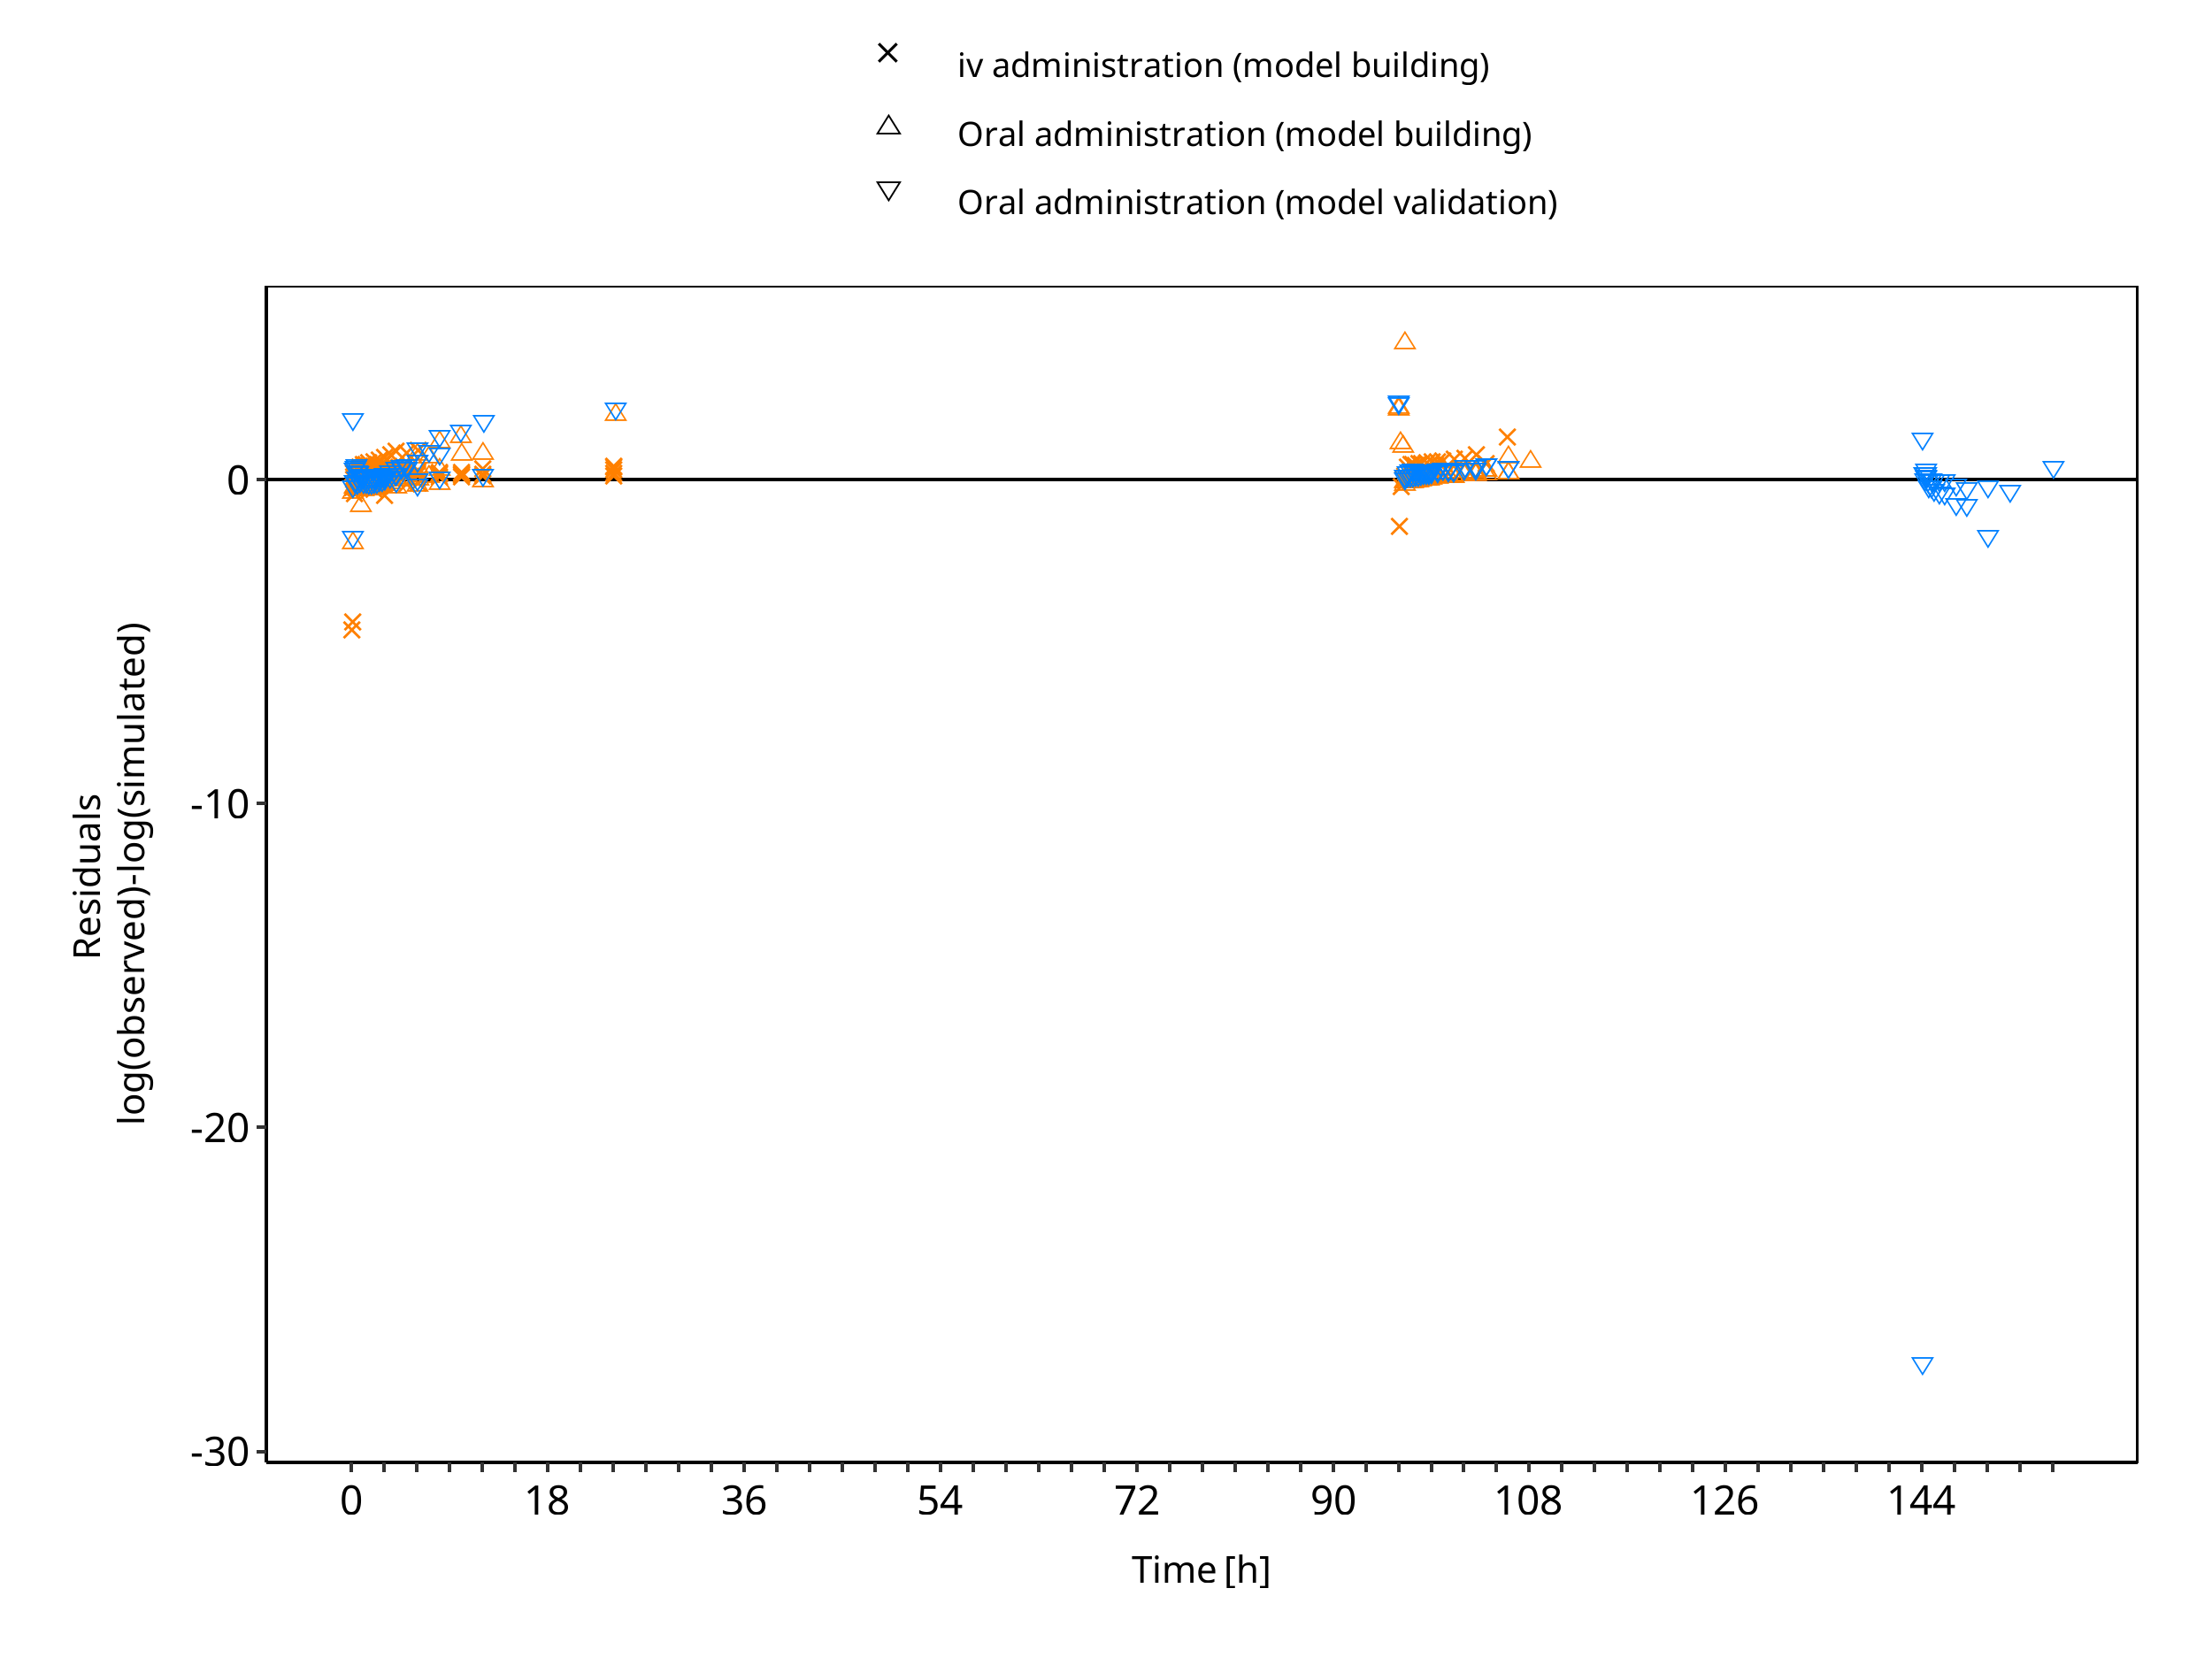
Figure 3-2: S-omeprazole concentration in plasma - mean data
Table 3-2: GMFE for R-omeprazole concentration in plasma - mean data
| Group | GMFE |
|---|---|
| Oral administration (model building) | 2.40 |
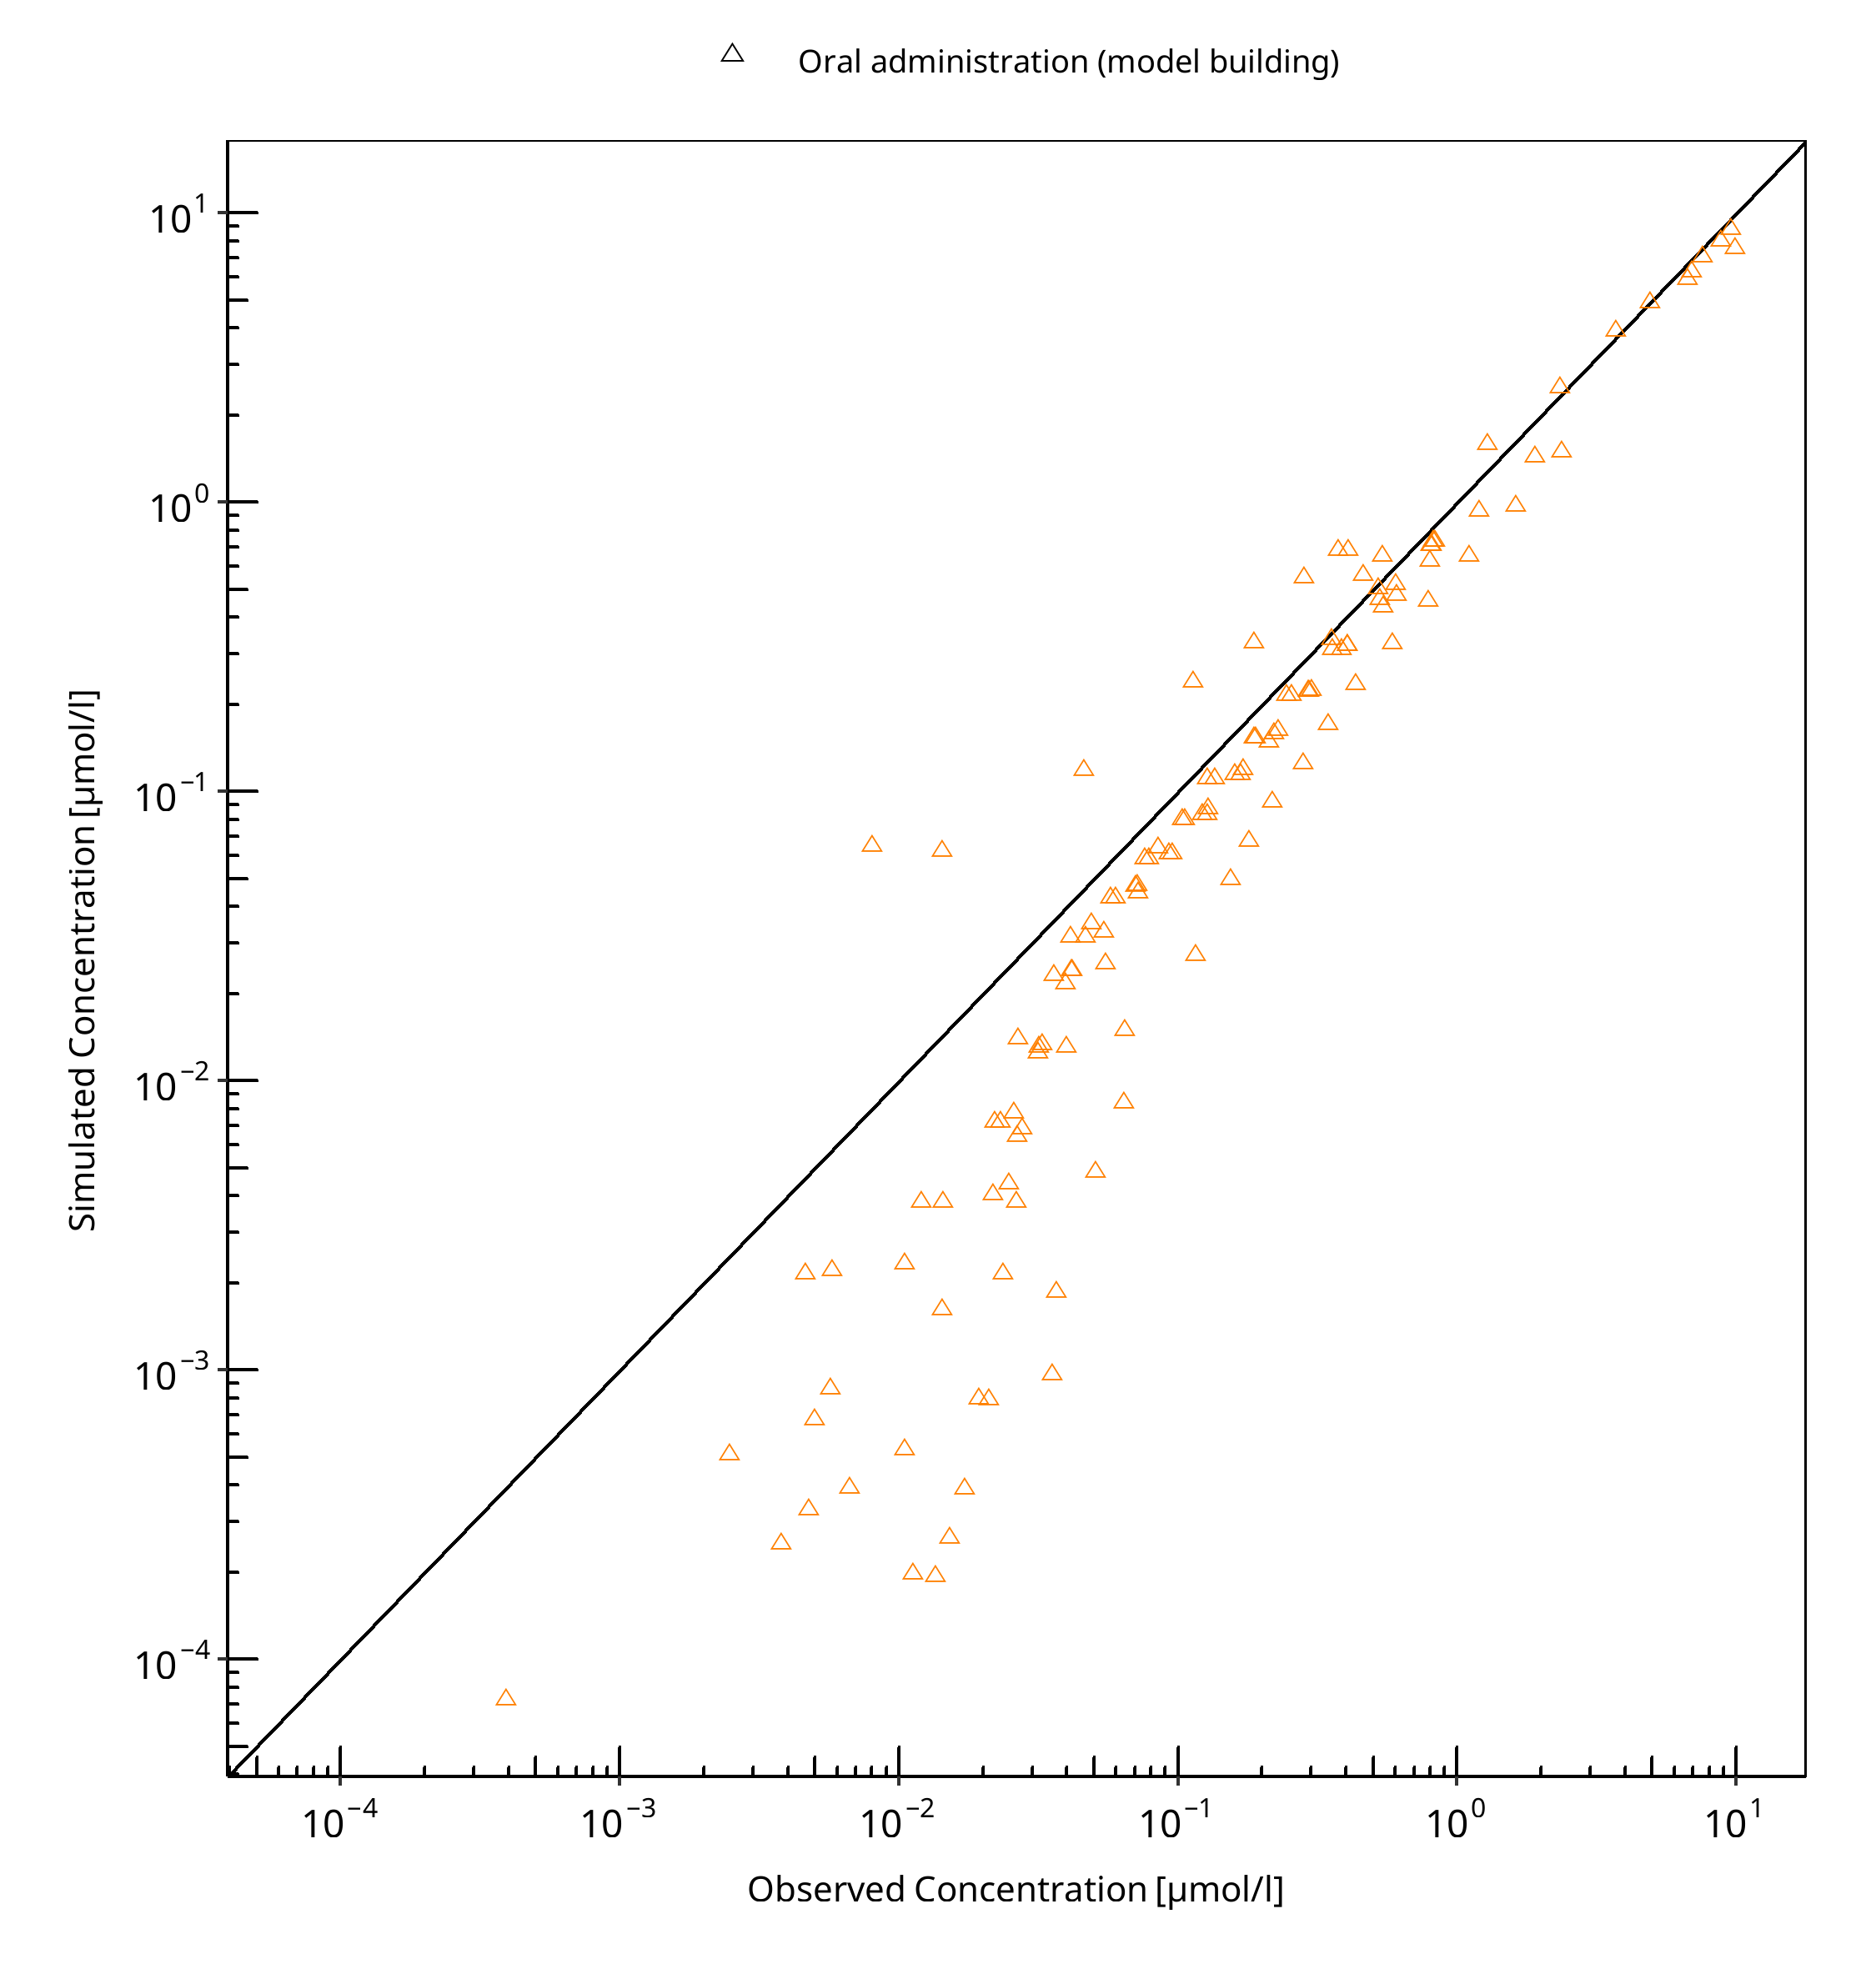
Figure 3-3: R-omeprazole concentration in plasma - mean data
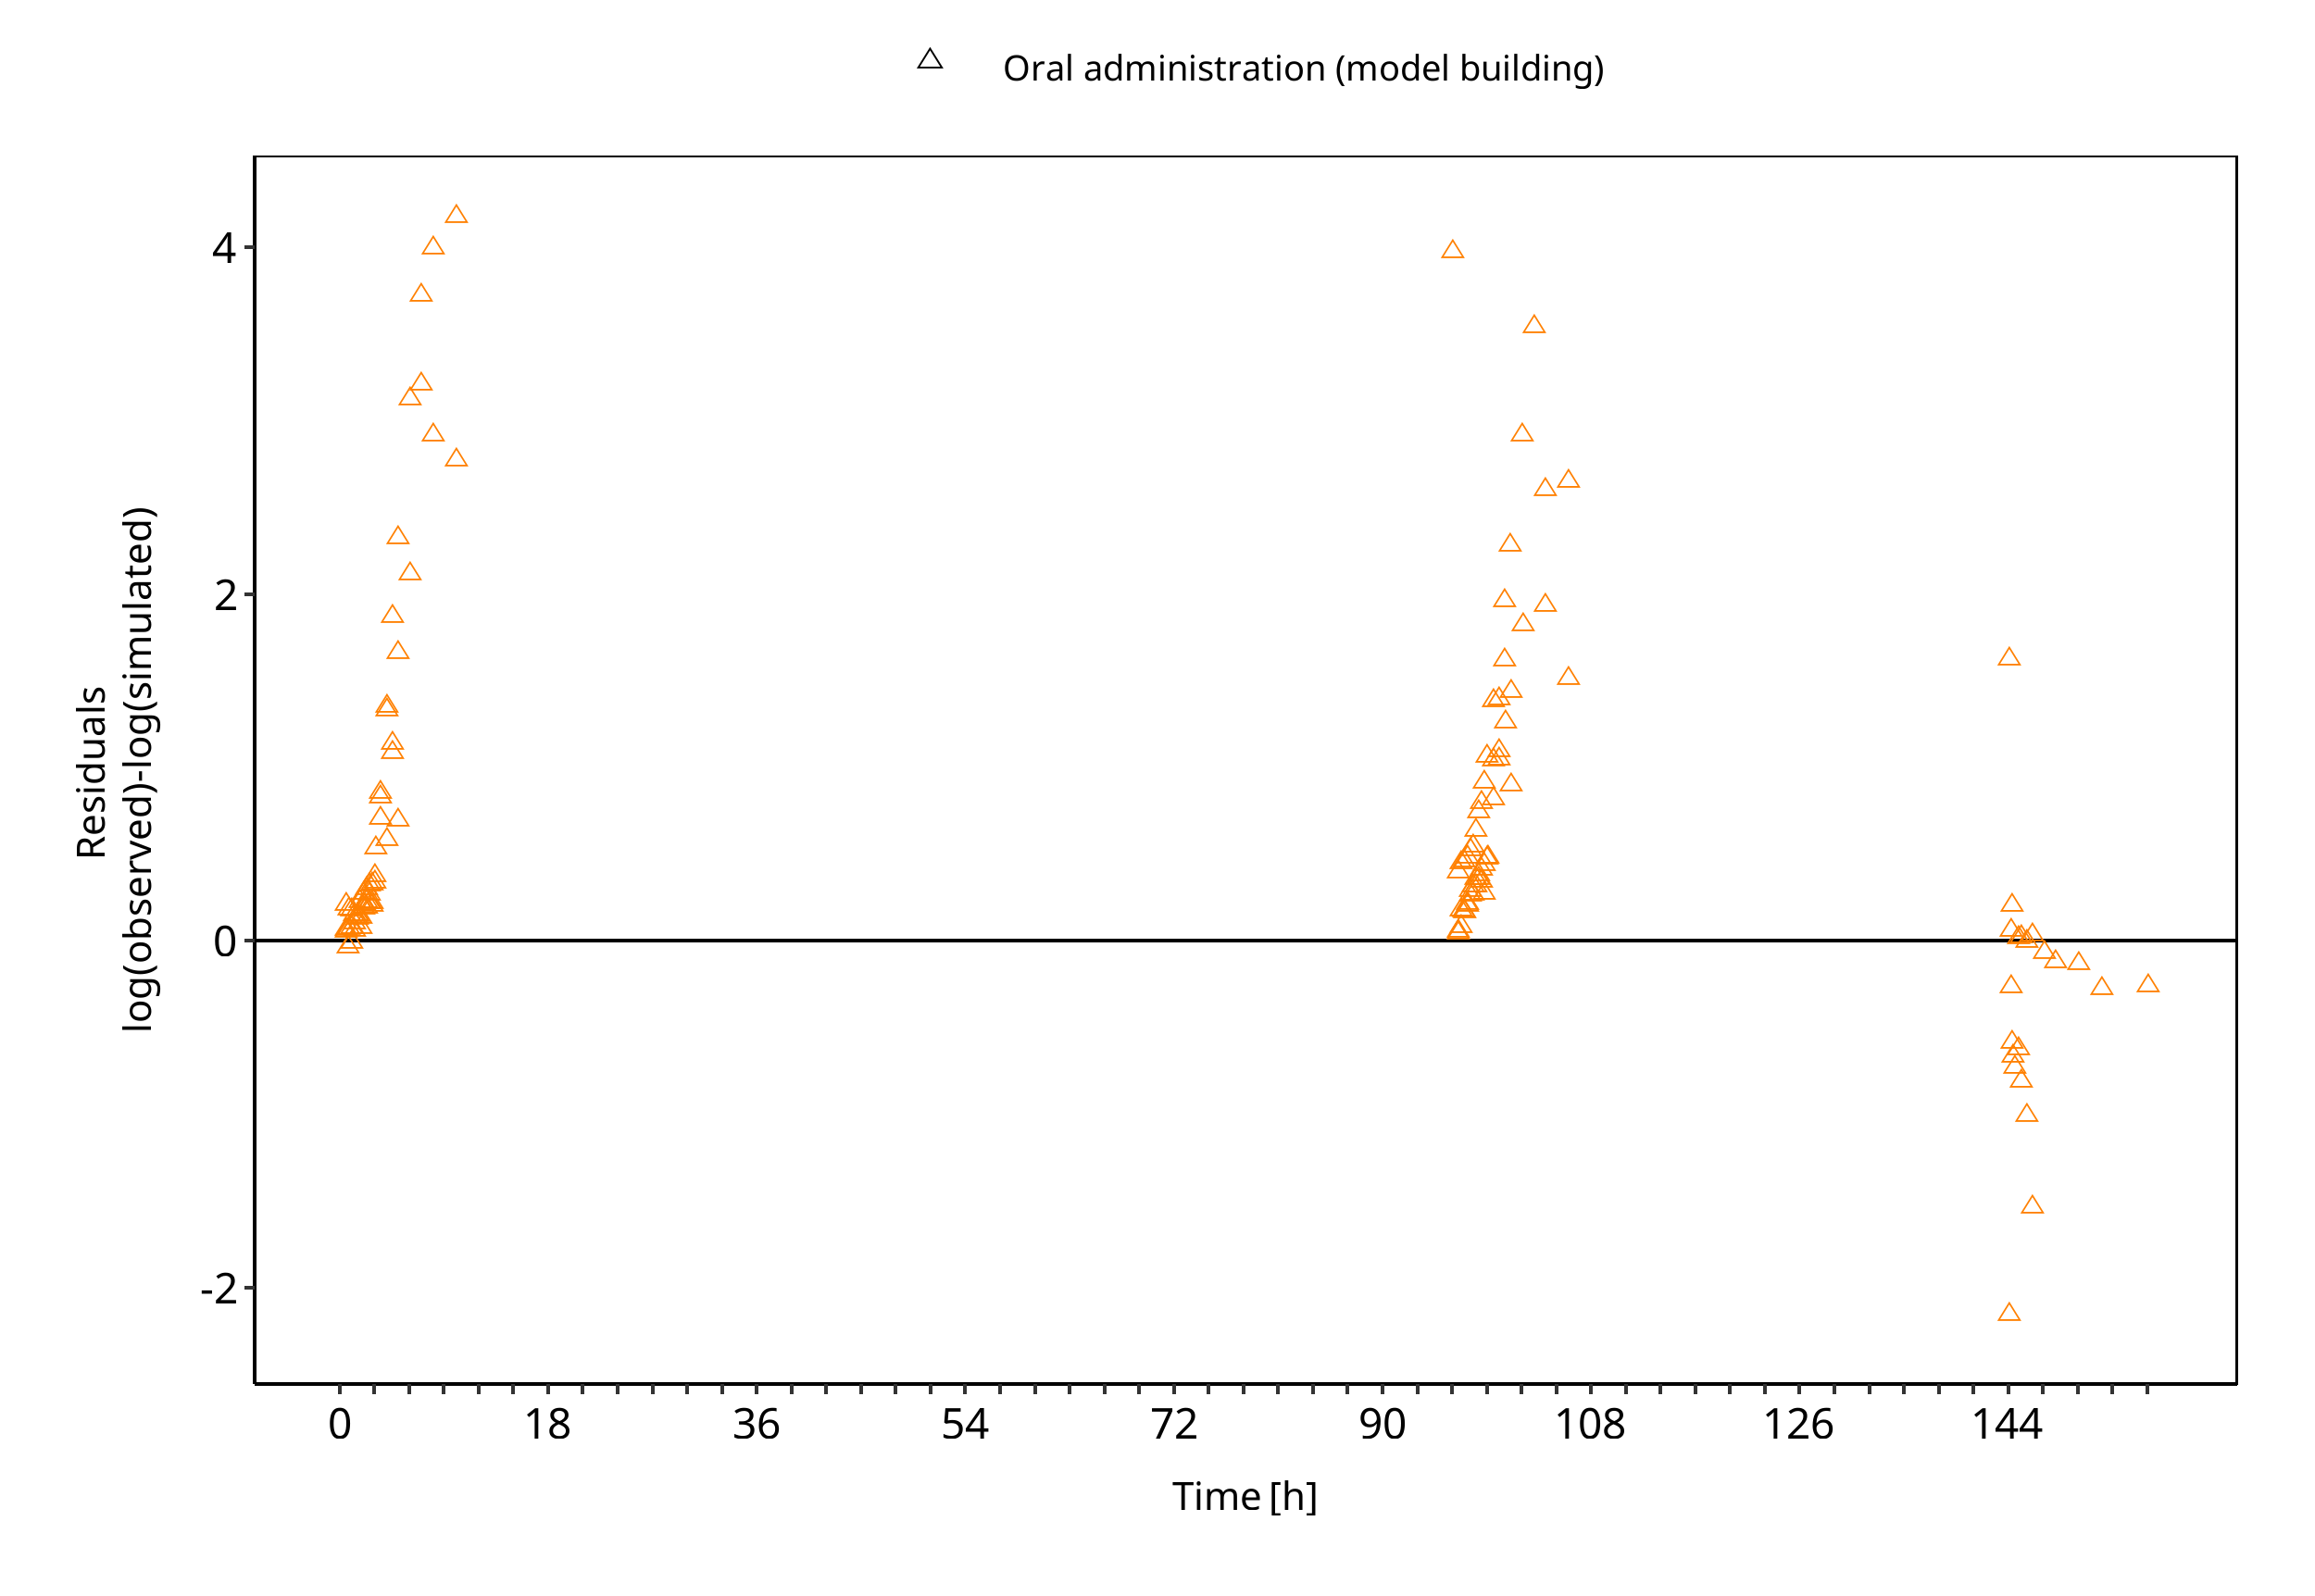
Figure 3-4: R-omeprazole concentration in plasma - mean data
Table 3-3: GMFE for Omeprazole concentration in plasma - mean data
| Group | GMFE |
|---|---|
| iv administration (model building) | 1.70 |
| iv administration (model validation) | 1.30 |
| Oral administration (model building) | 1.30 |
| Oral administration (model validation) | 2.45 |
| All | 2.09 |
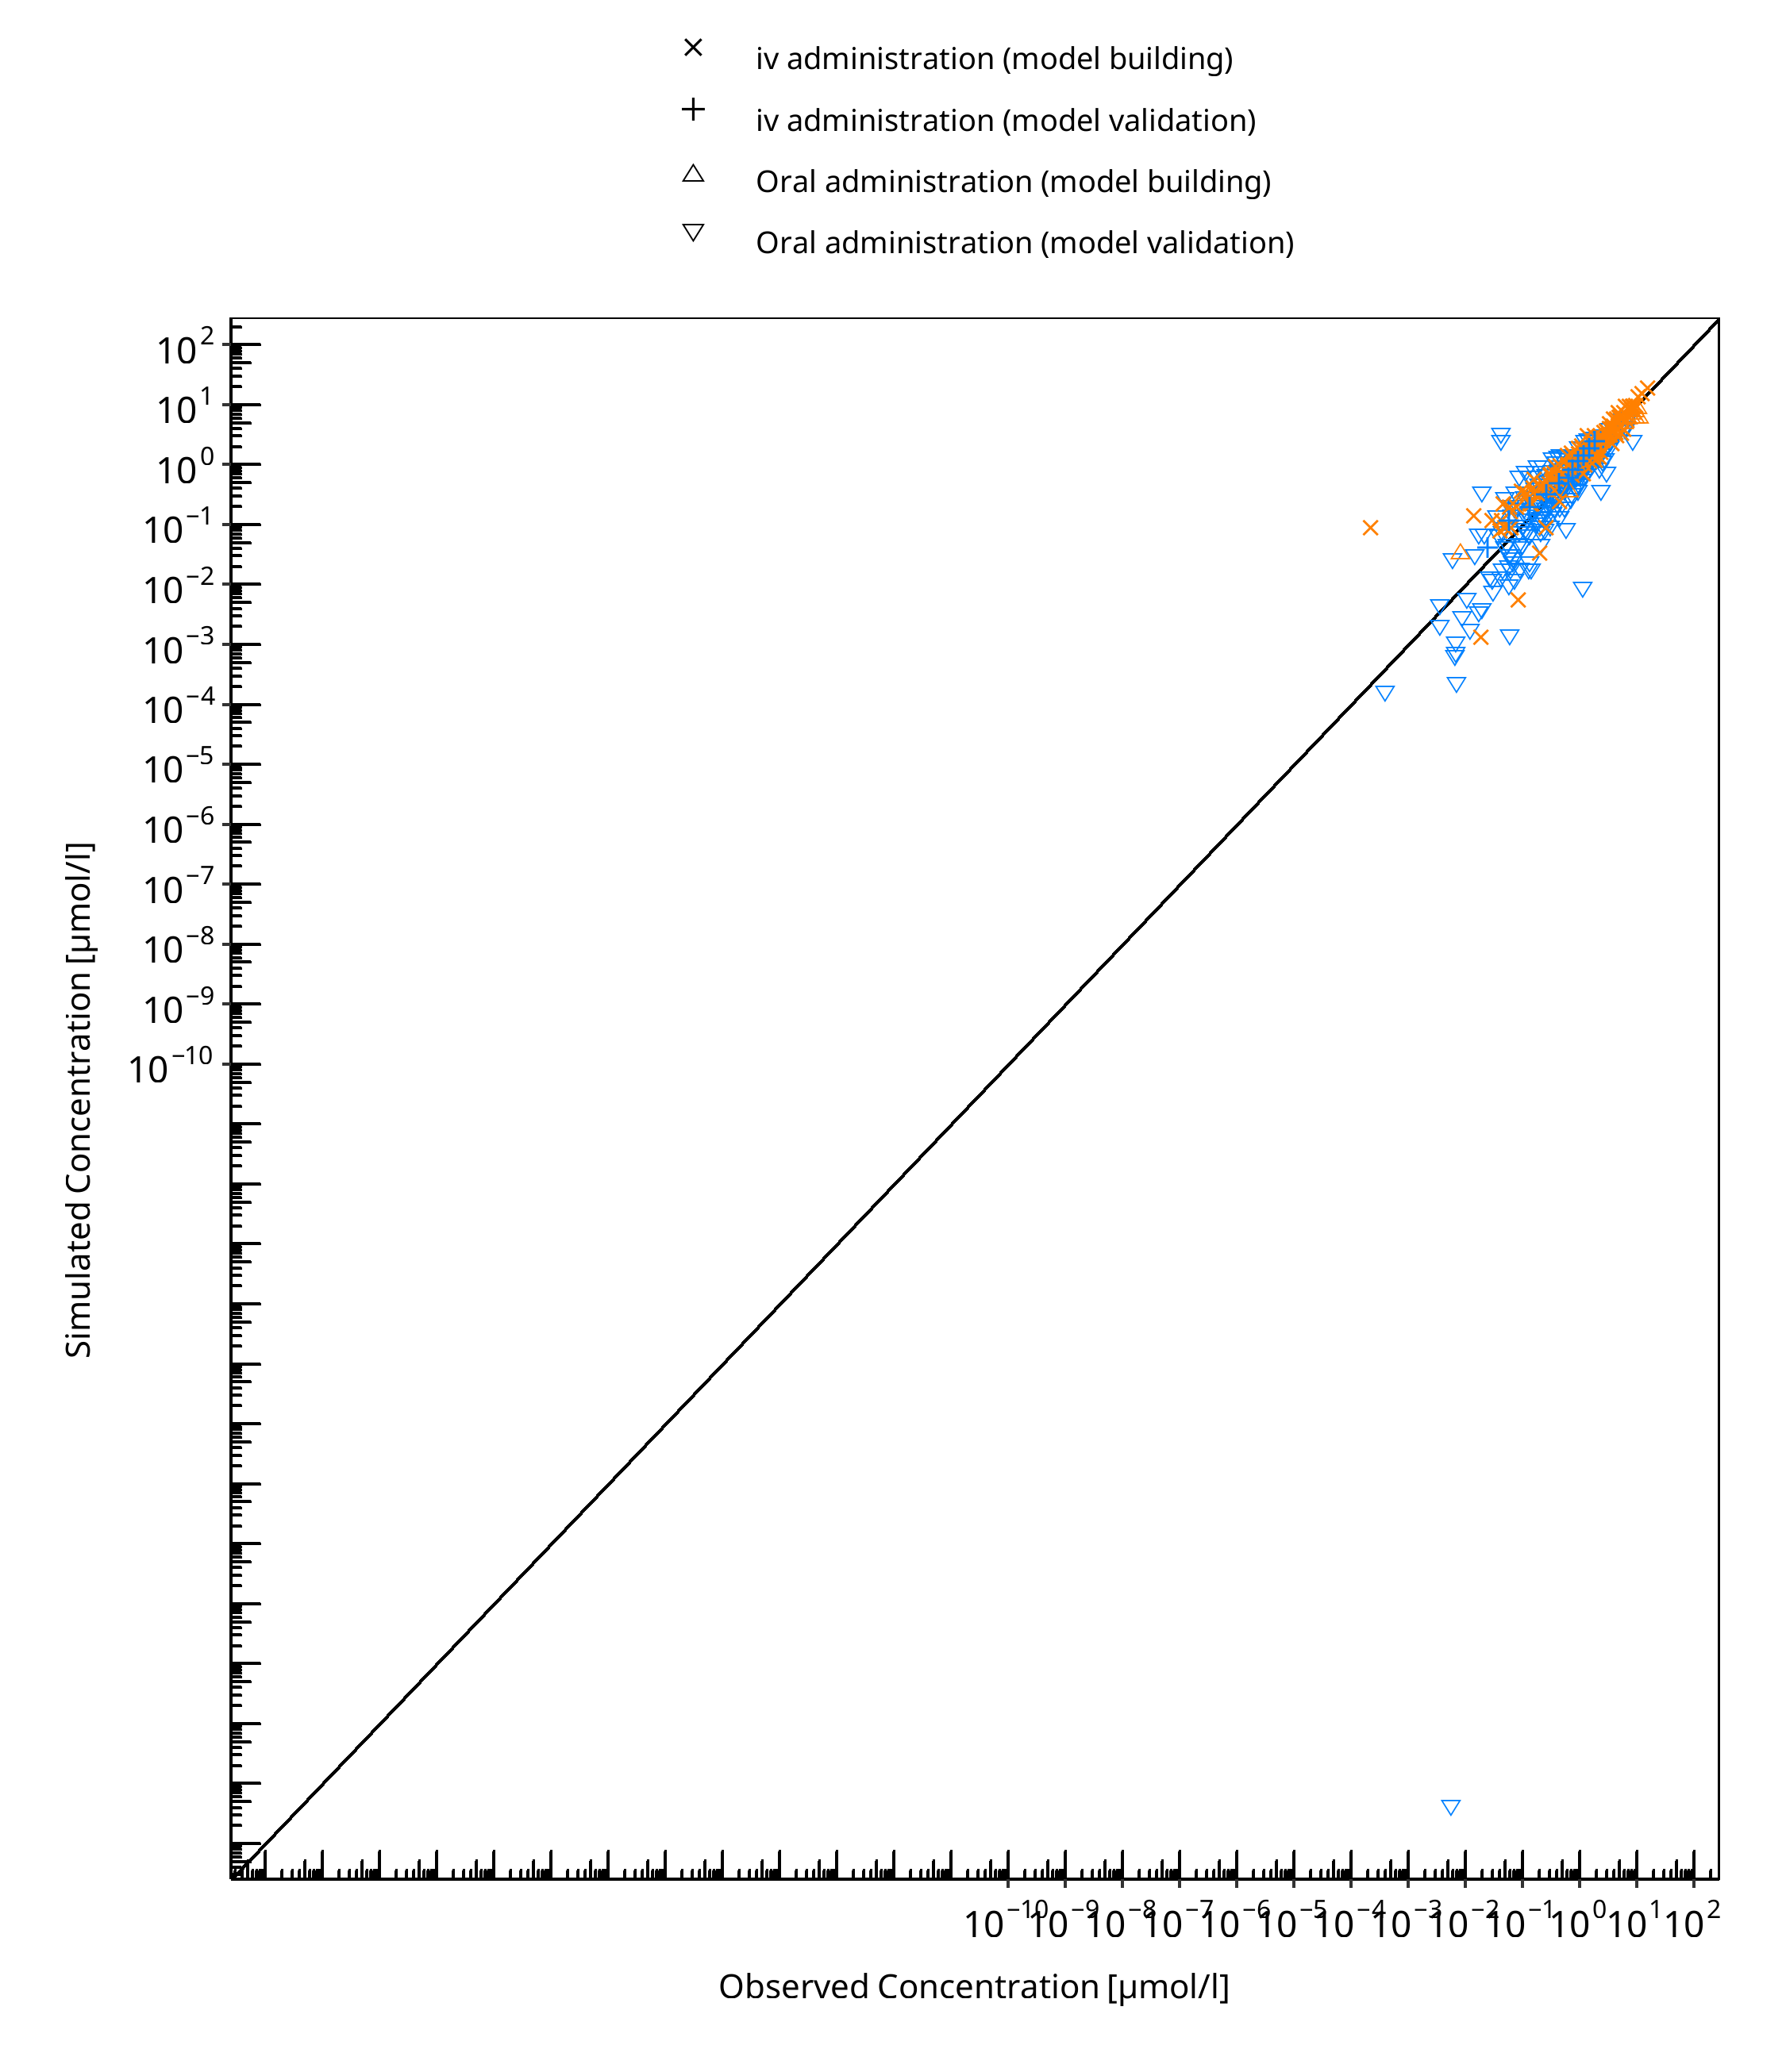
Figure 3-5: Omeprazole concentration in plasma - mean data
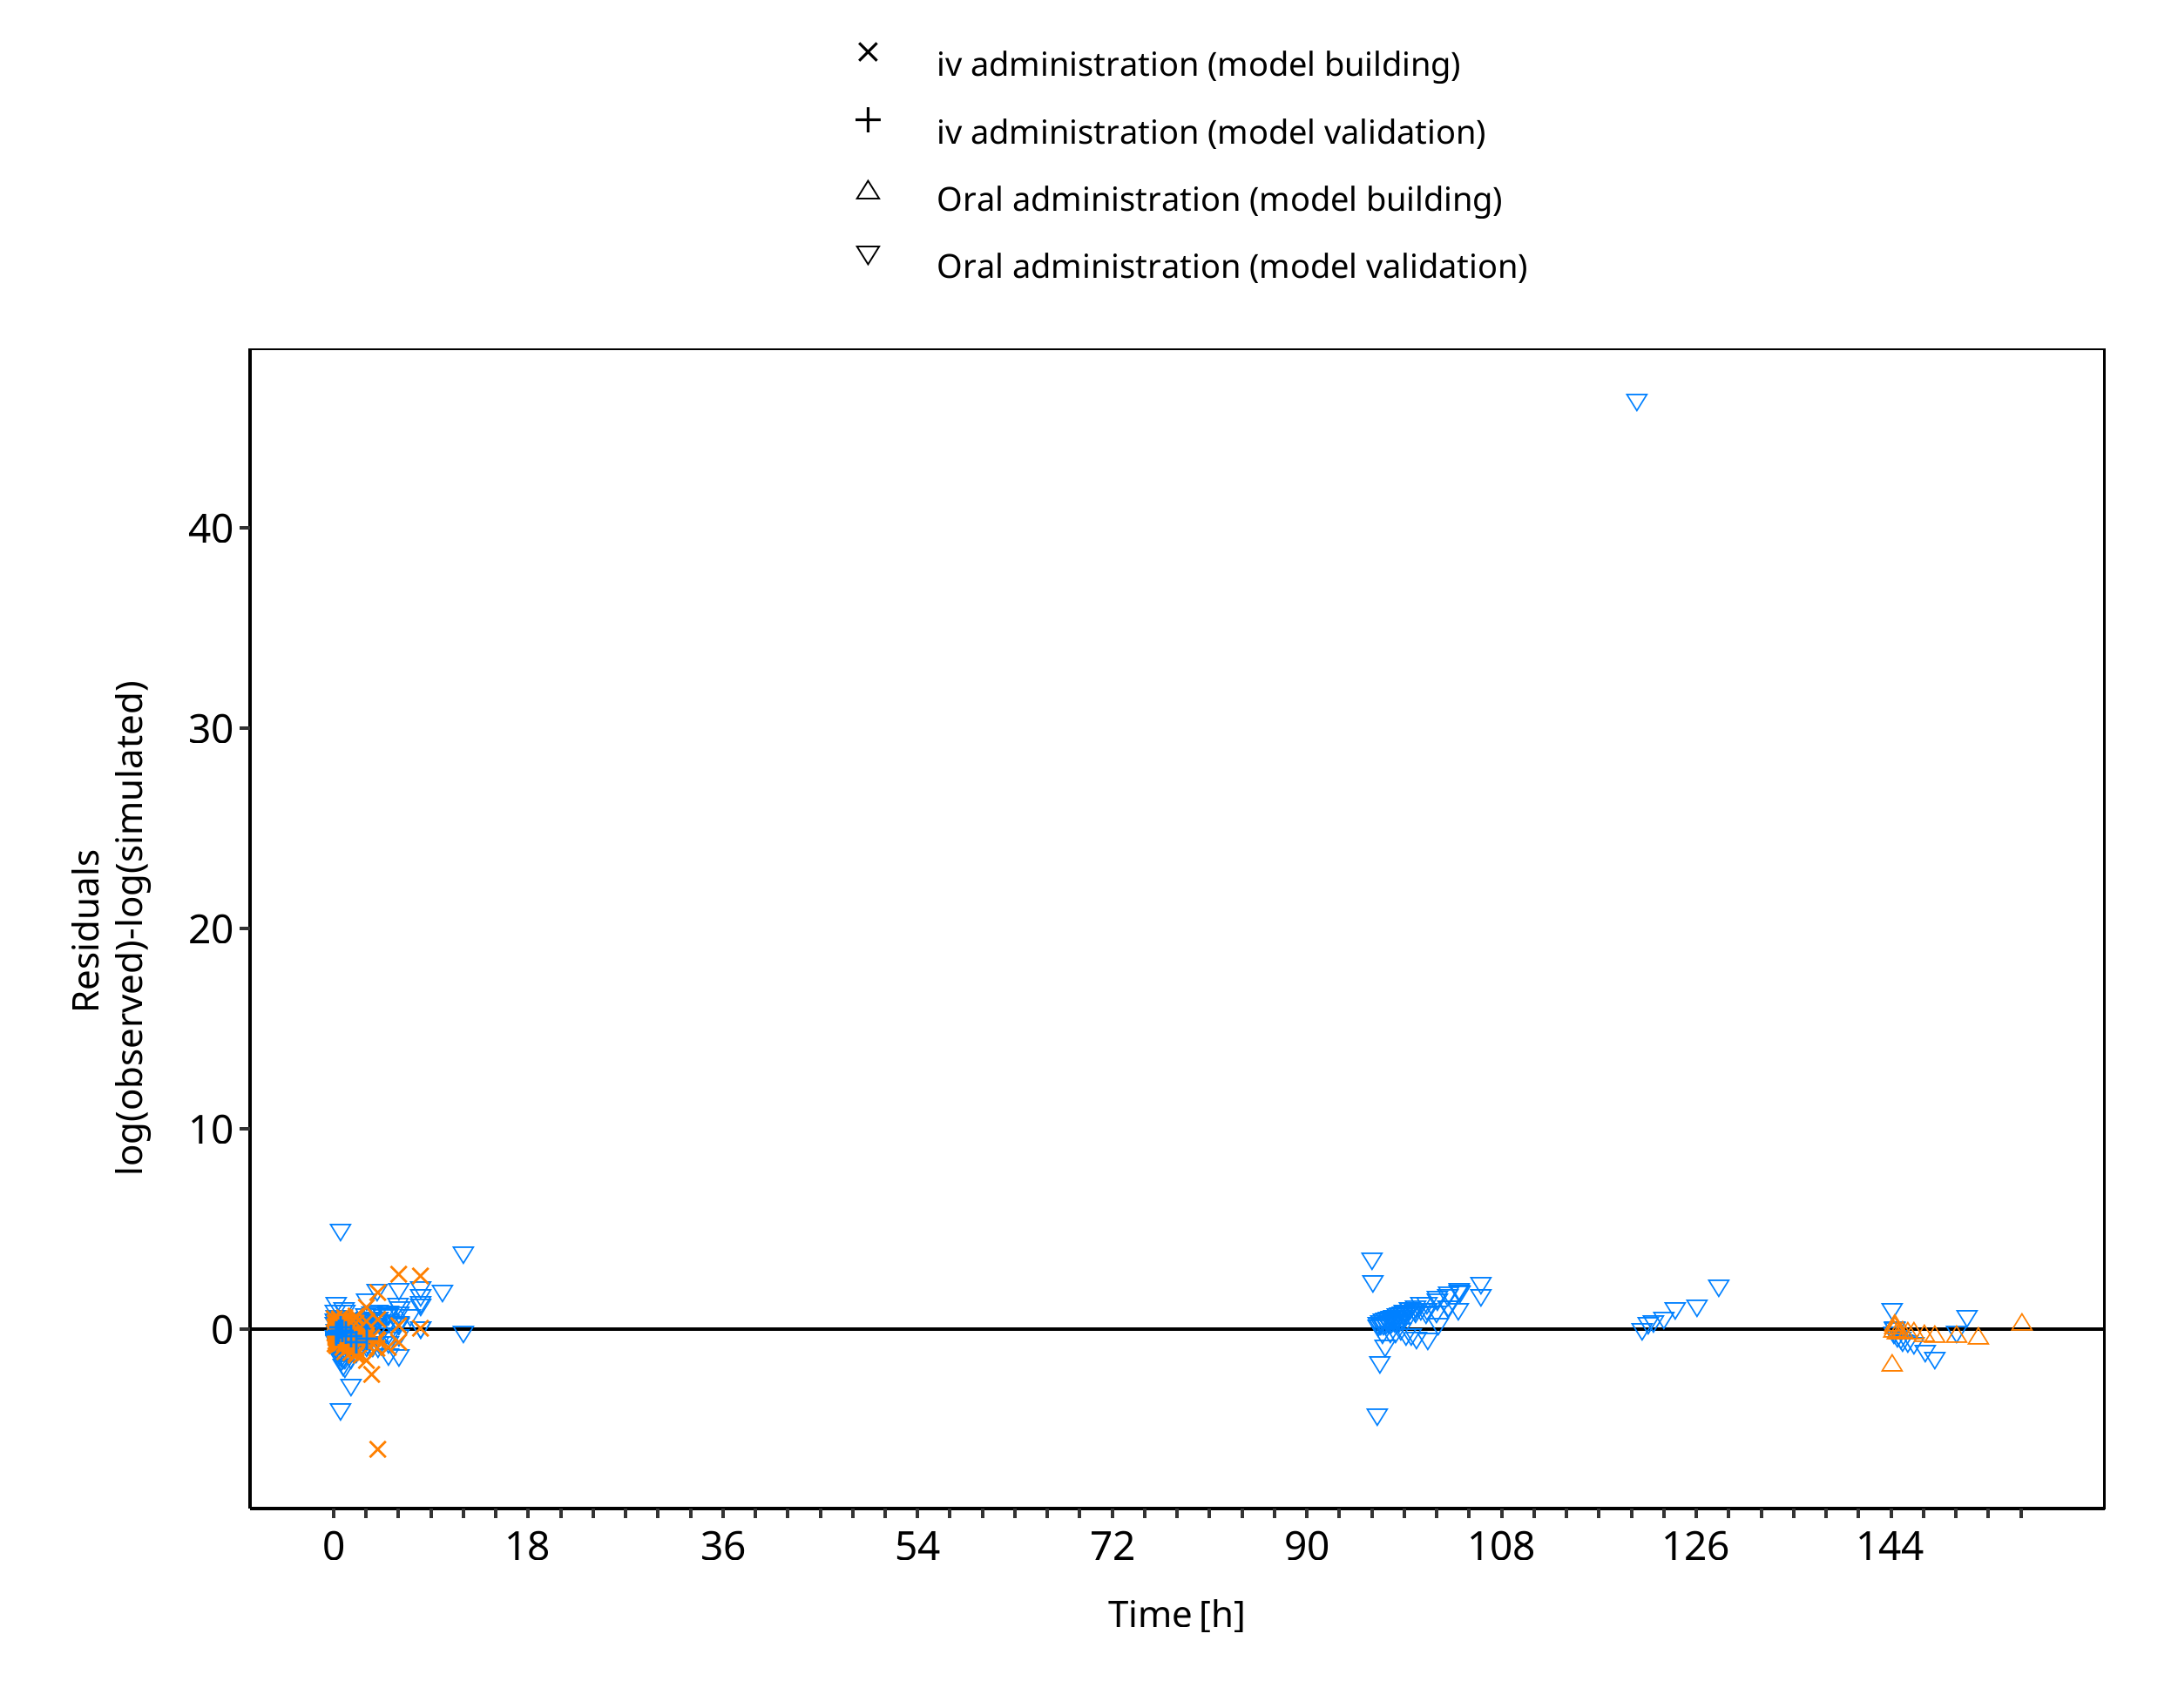
Figure 3-6: Omeprazole concentration in plasma - mean data
3.3 Concentration-Time Profiles
Simulated versus observed concentration-time profiles of all data listed in Section 2.2.2 are presented below.
3.3.1 Model Building
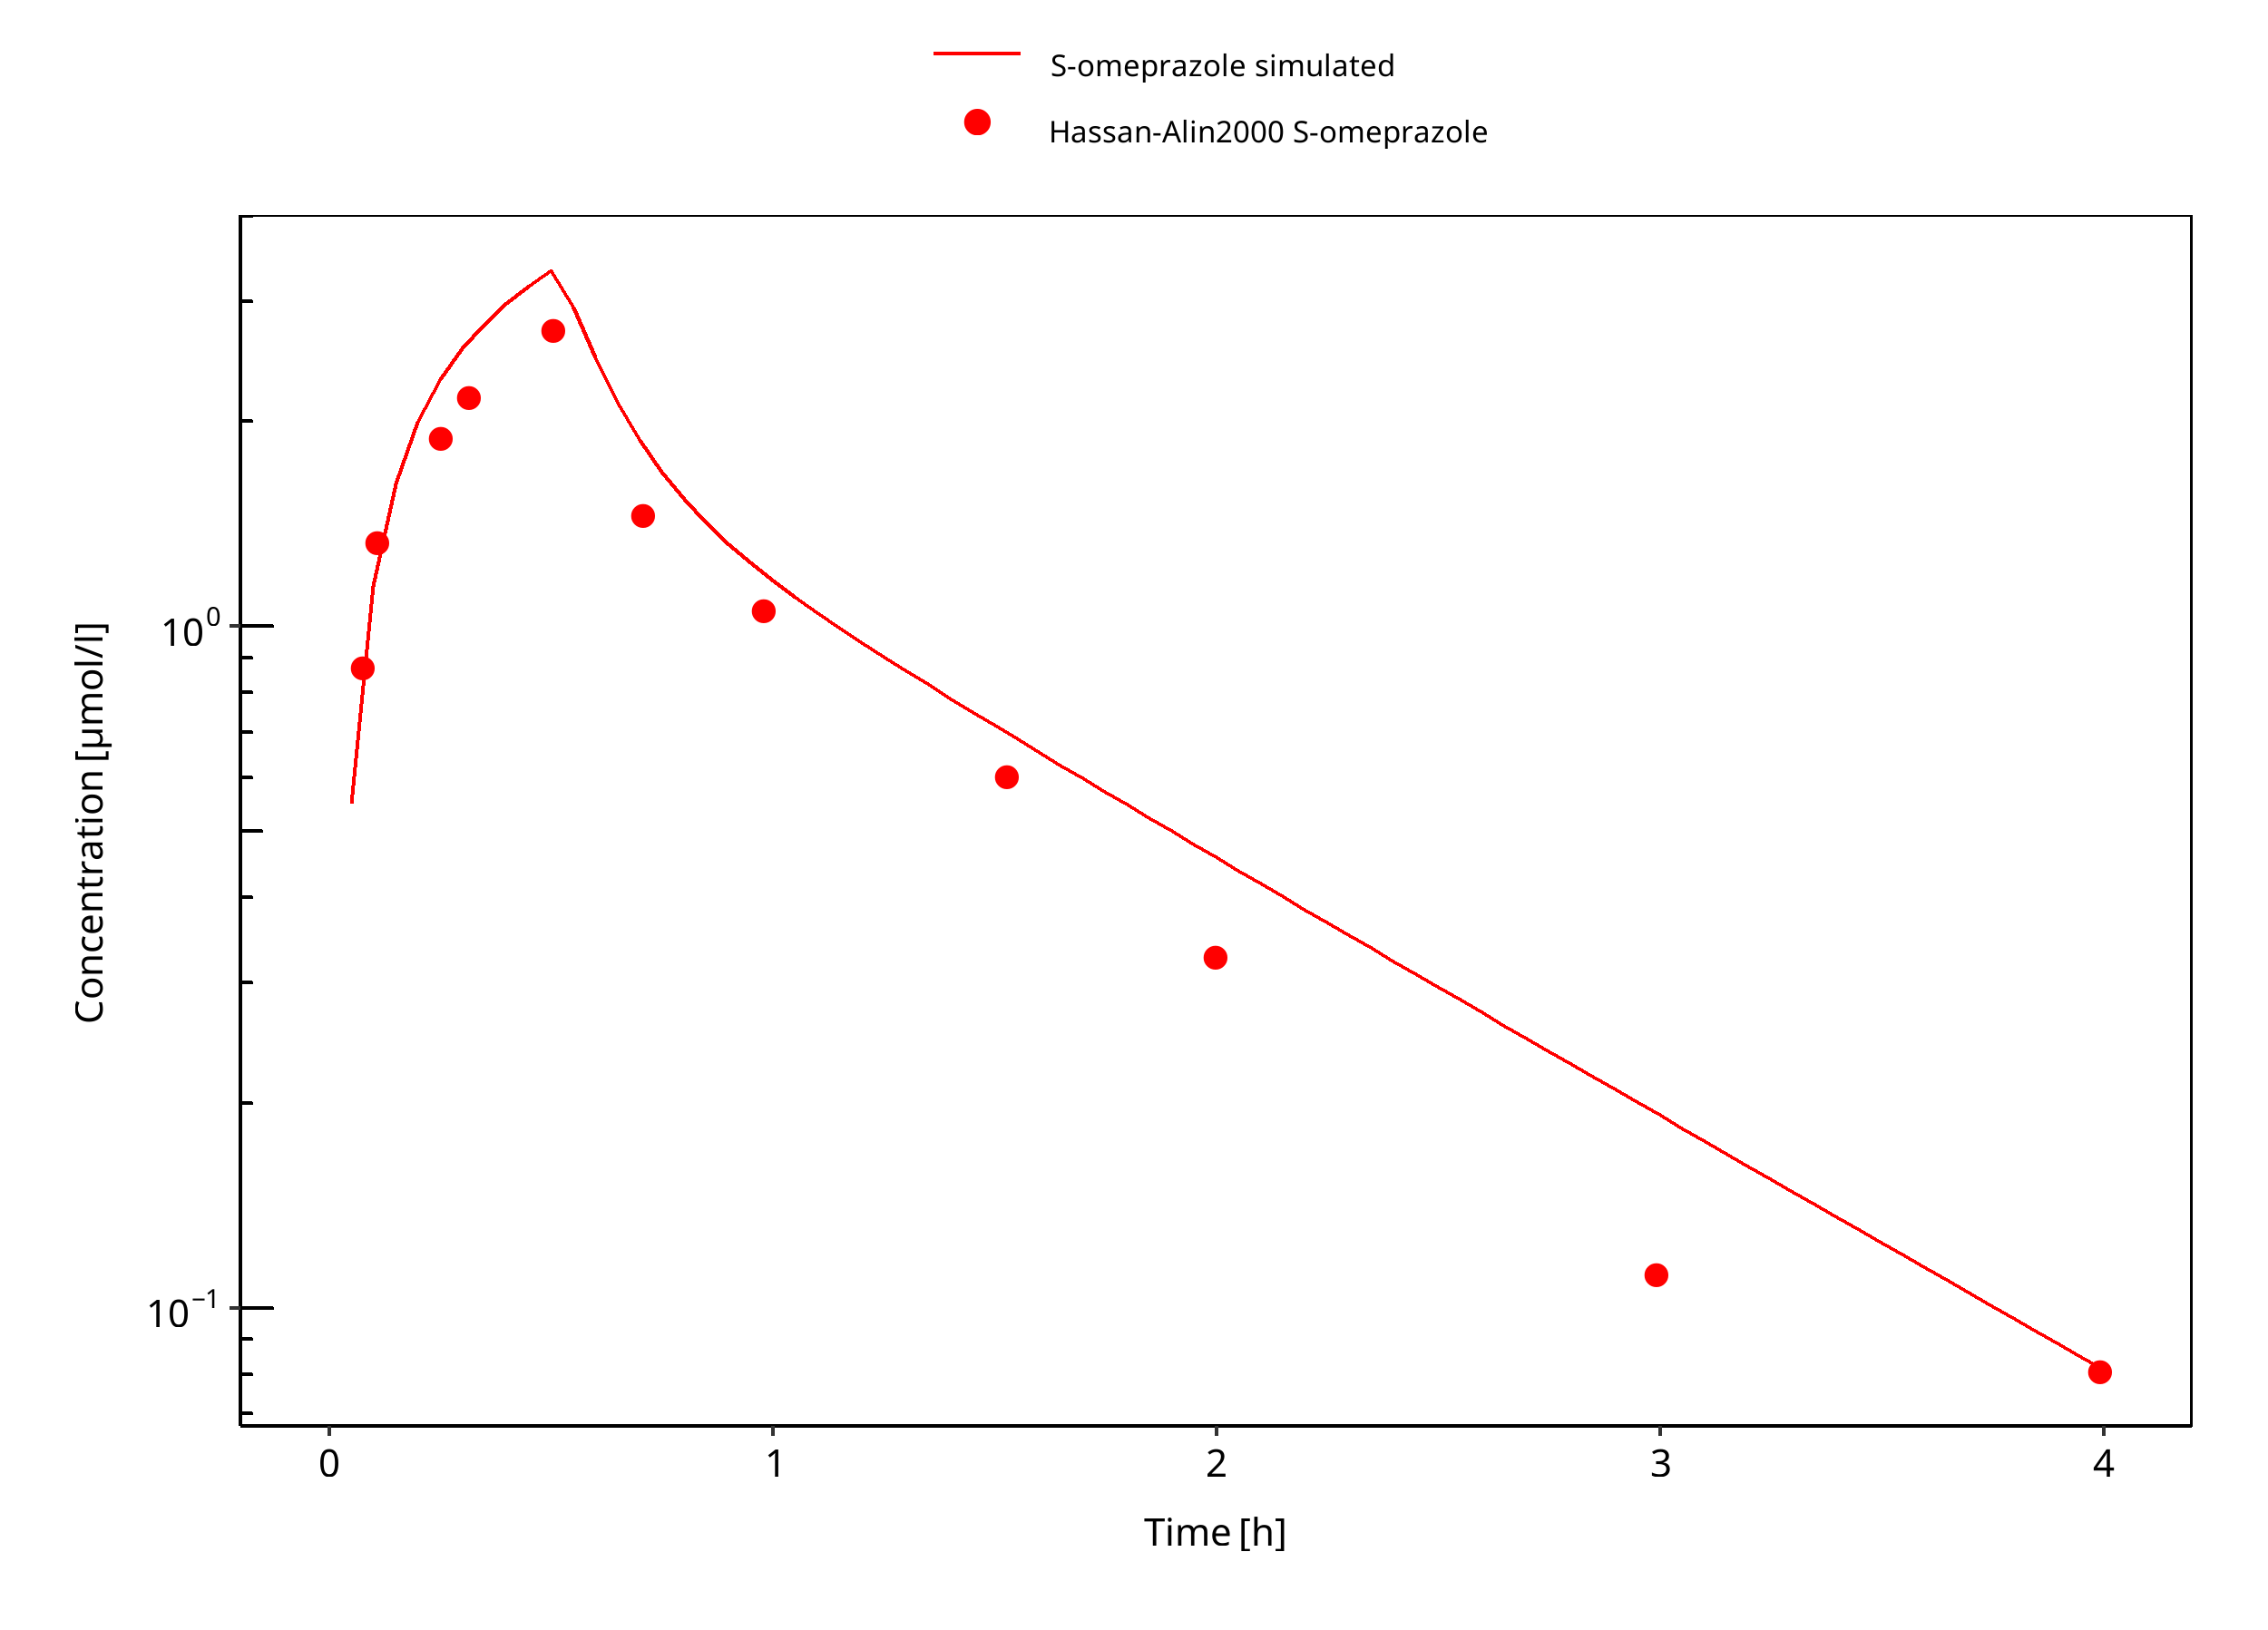
Figure 3-7: 20 mg S-omeprazole iv infusion
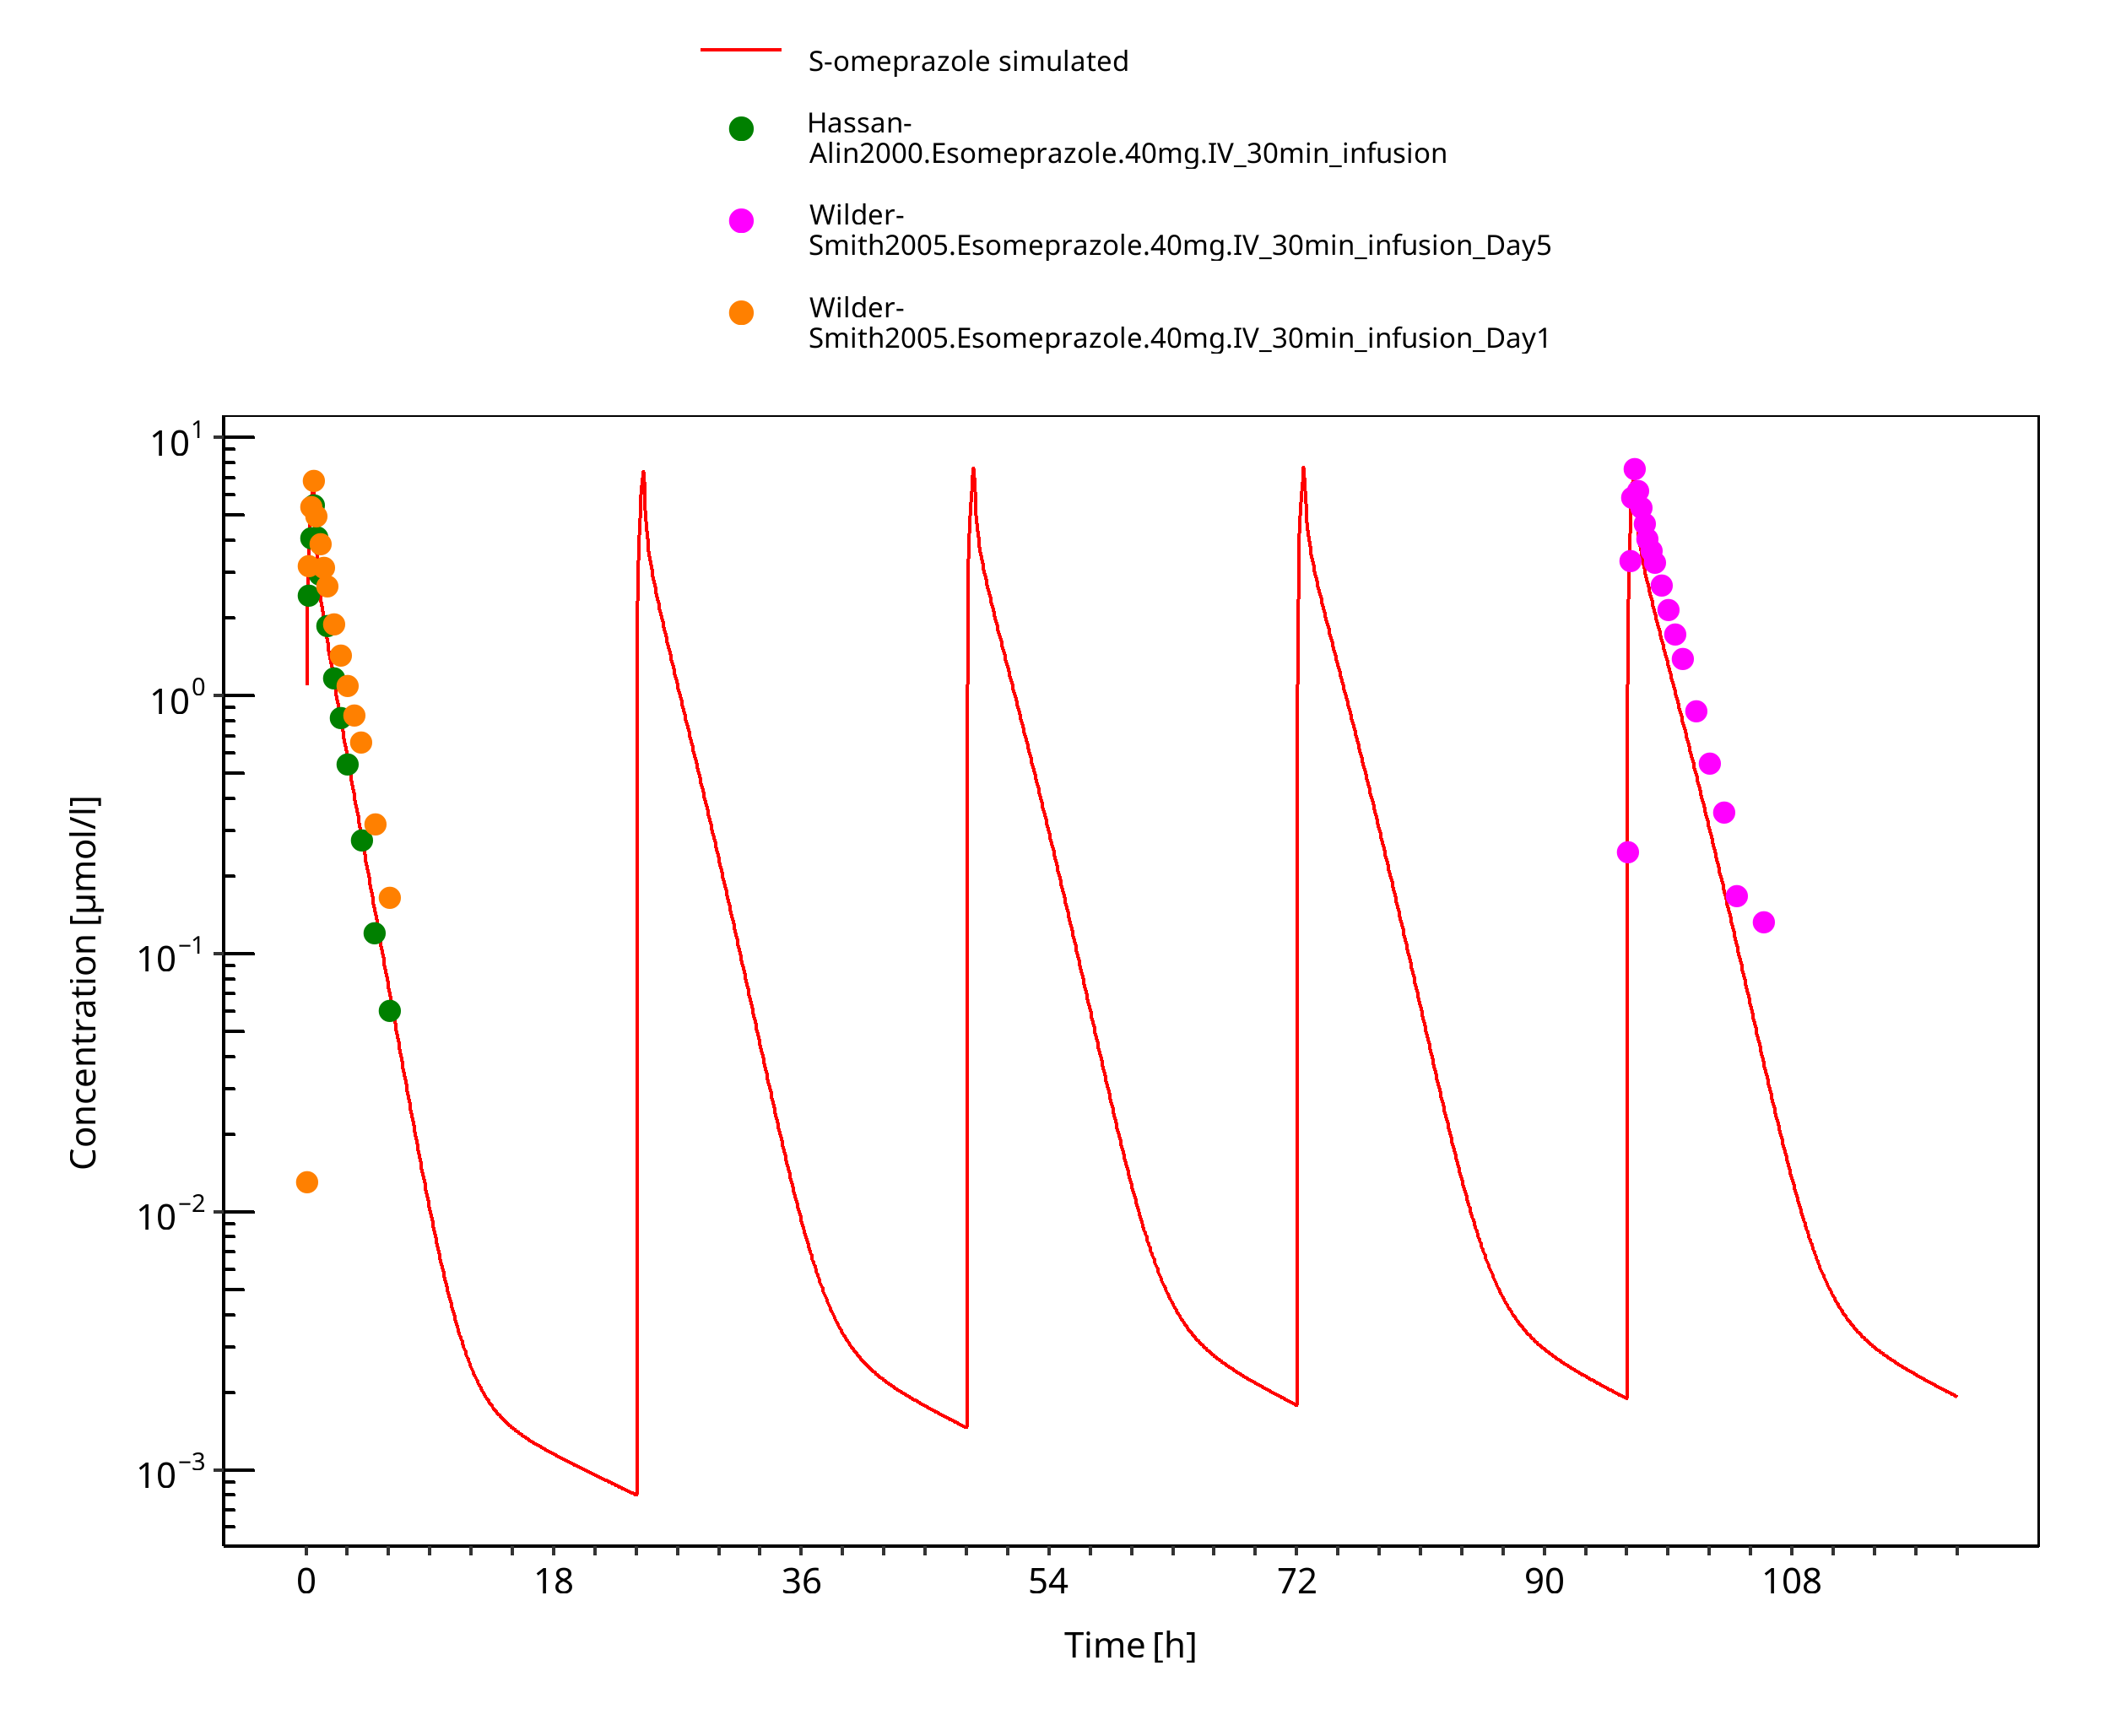
Figure 3-8: 40 mg S-omeprazole iv infusion
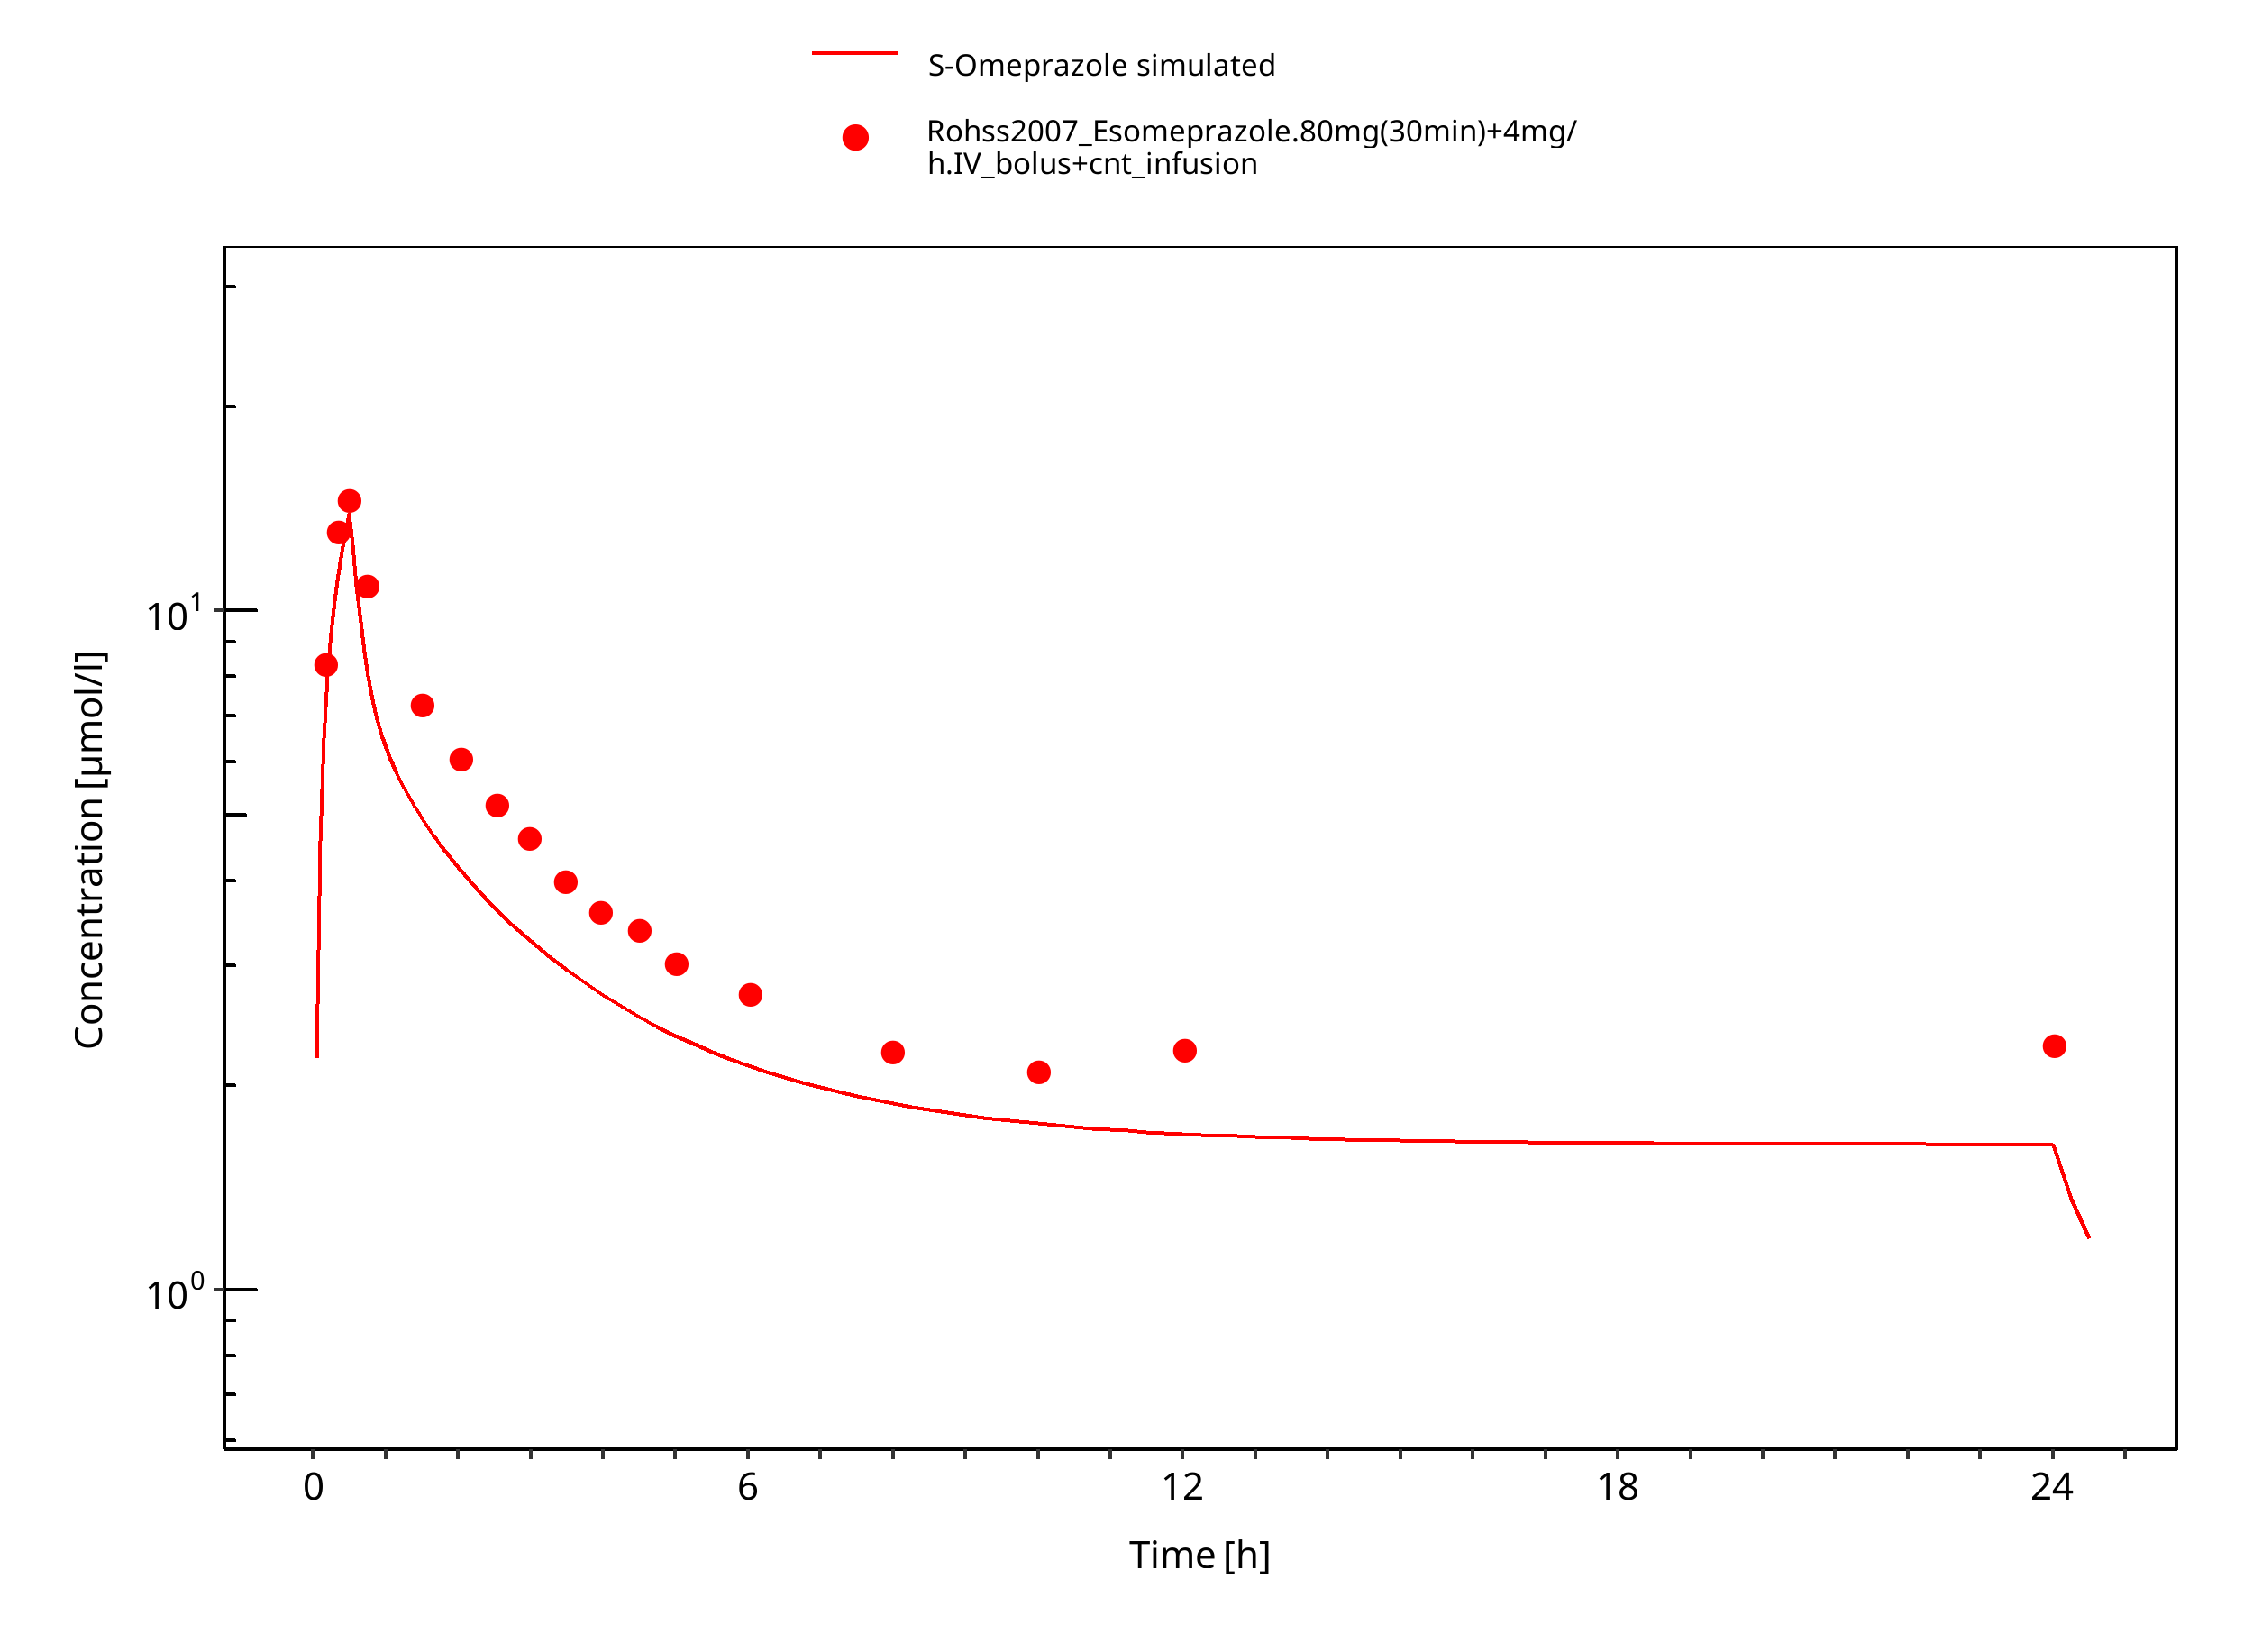
Figure 3-9: 80 mg 30 min + 4 mg/h iv
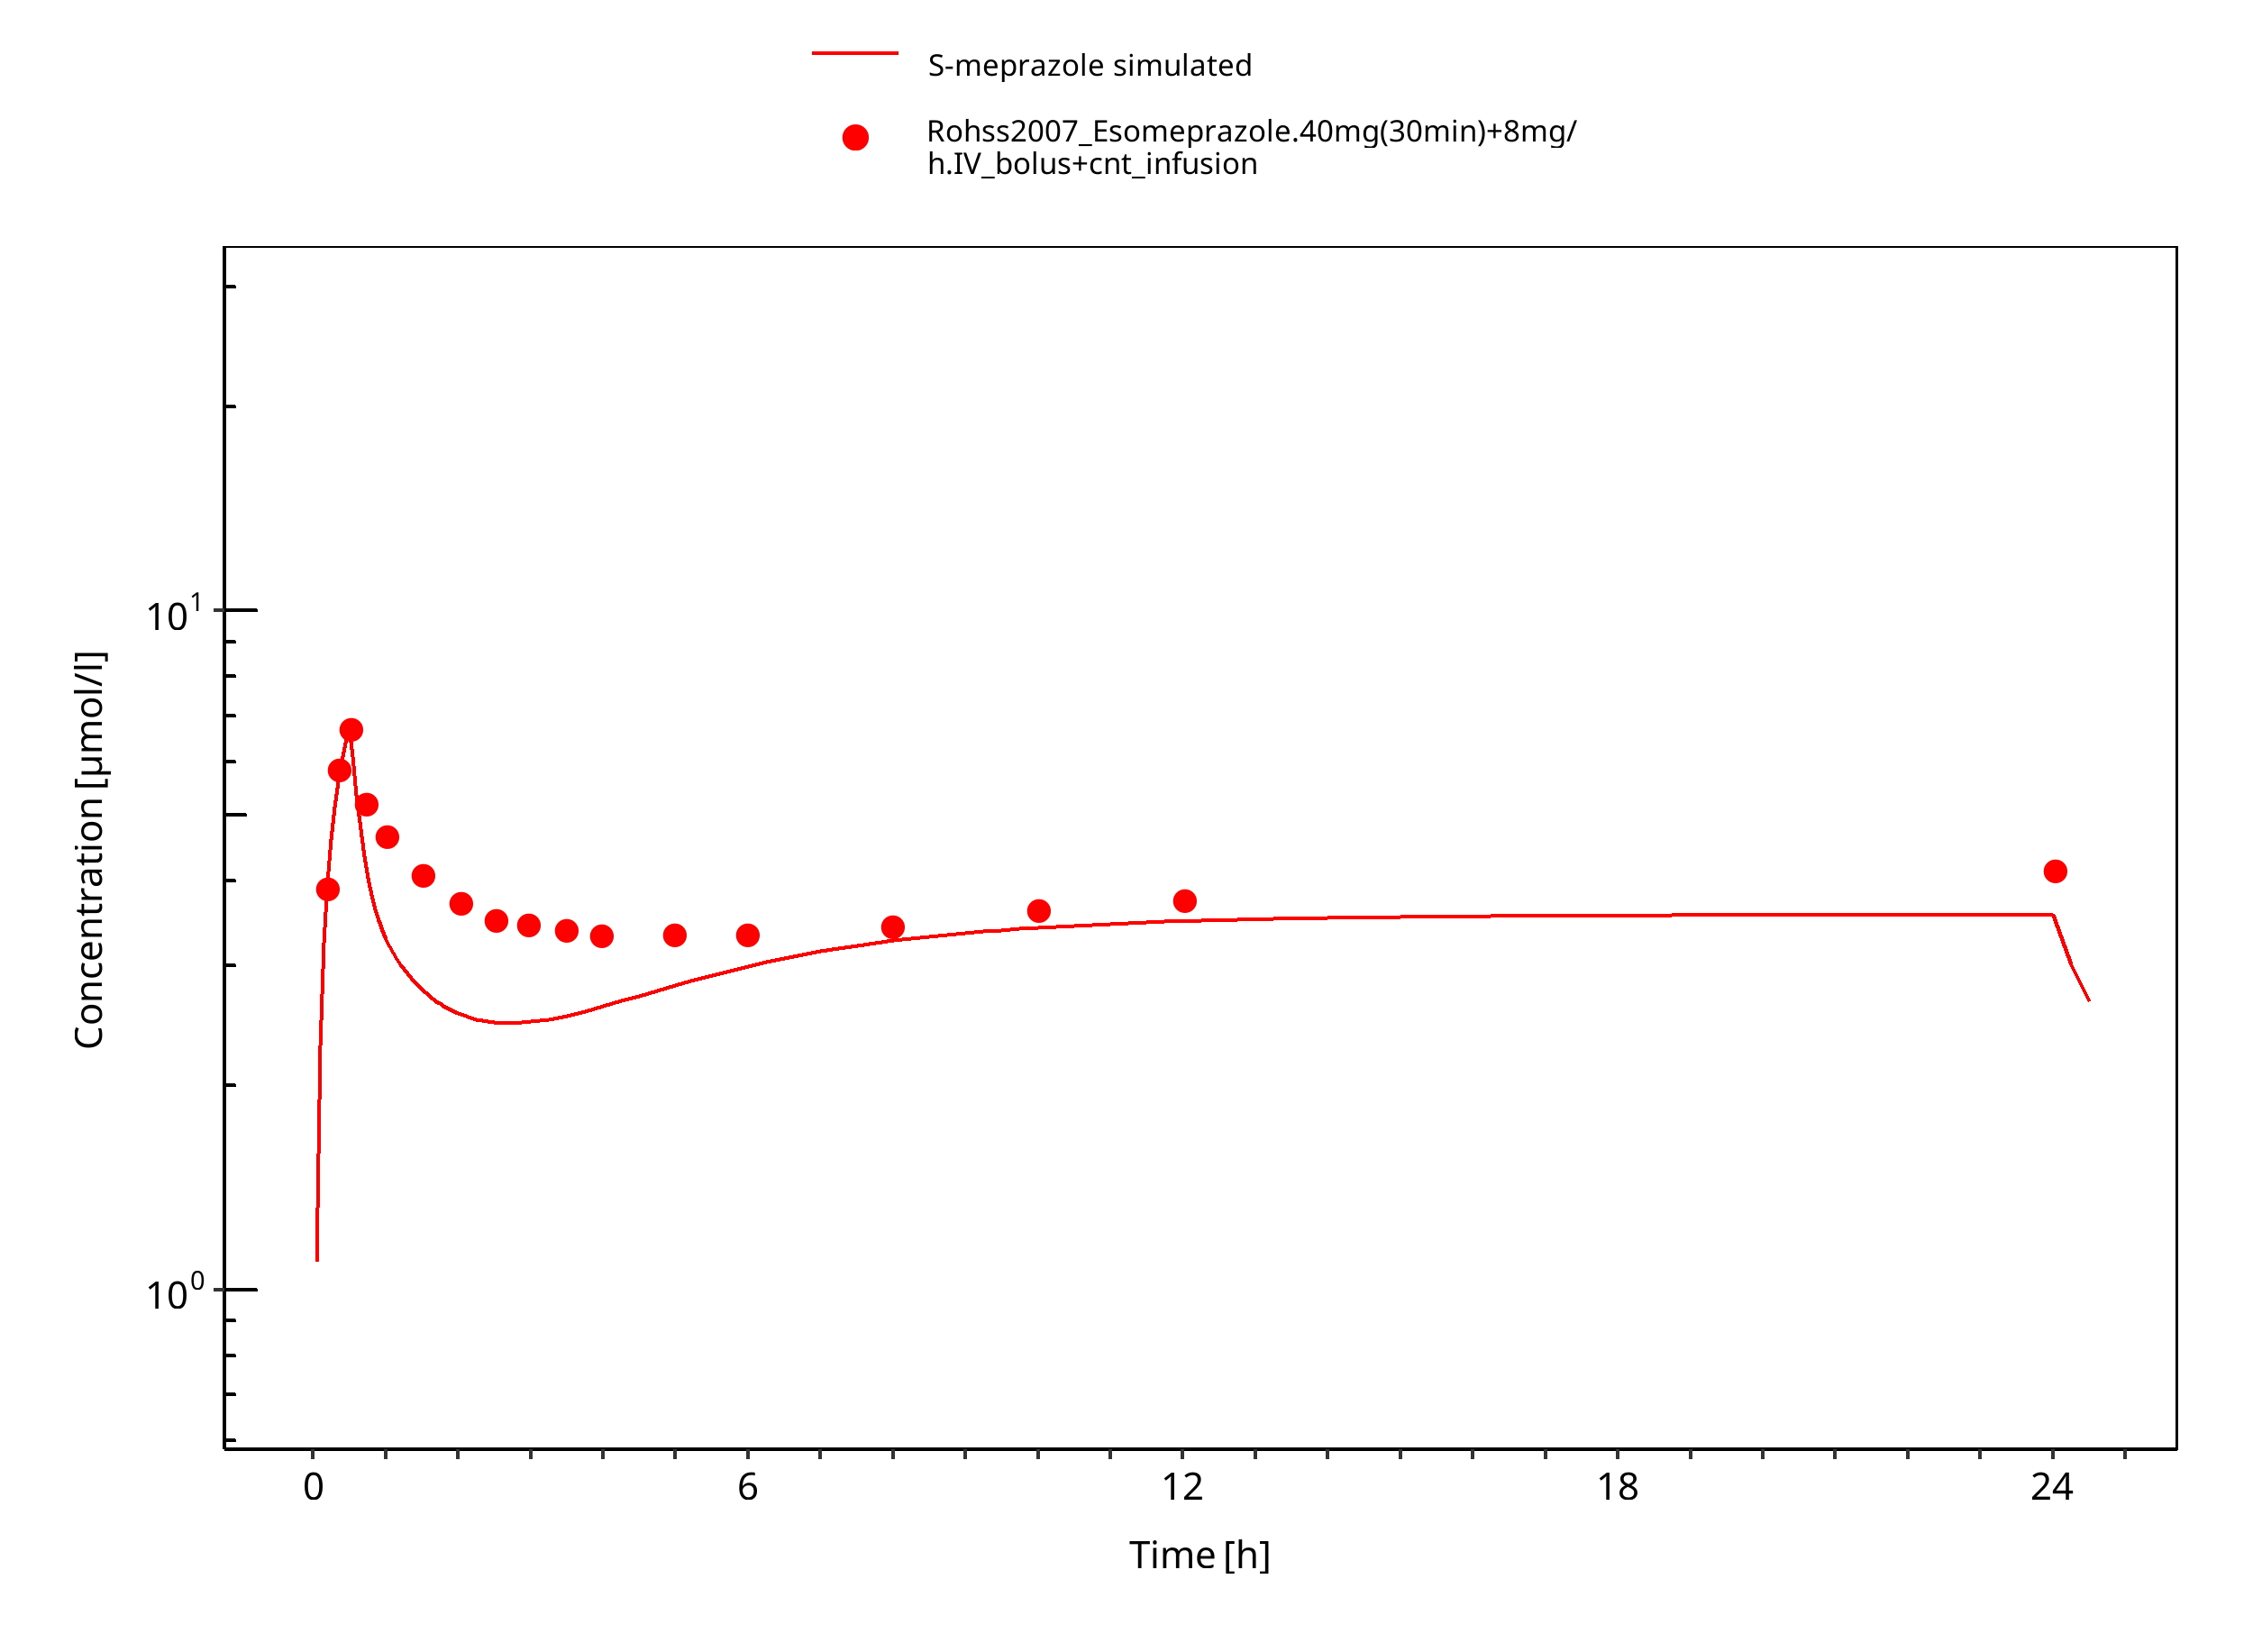
Figure 3-10: 40 mg 30 min + 8 mg/h iv S-omeprazole
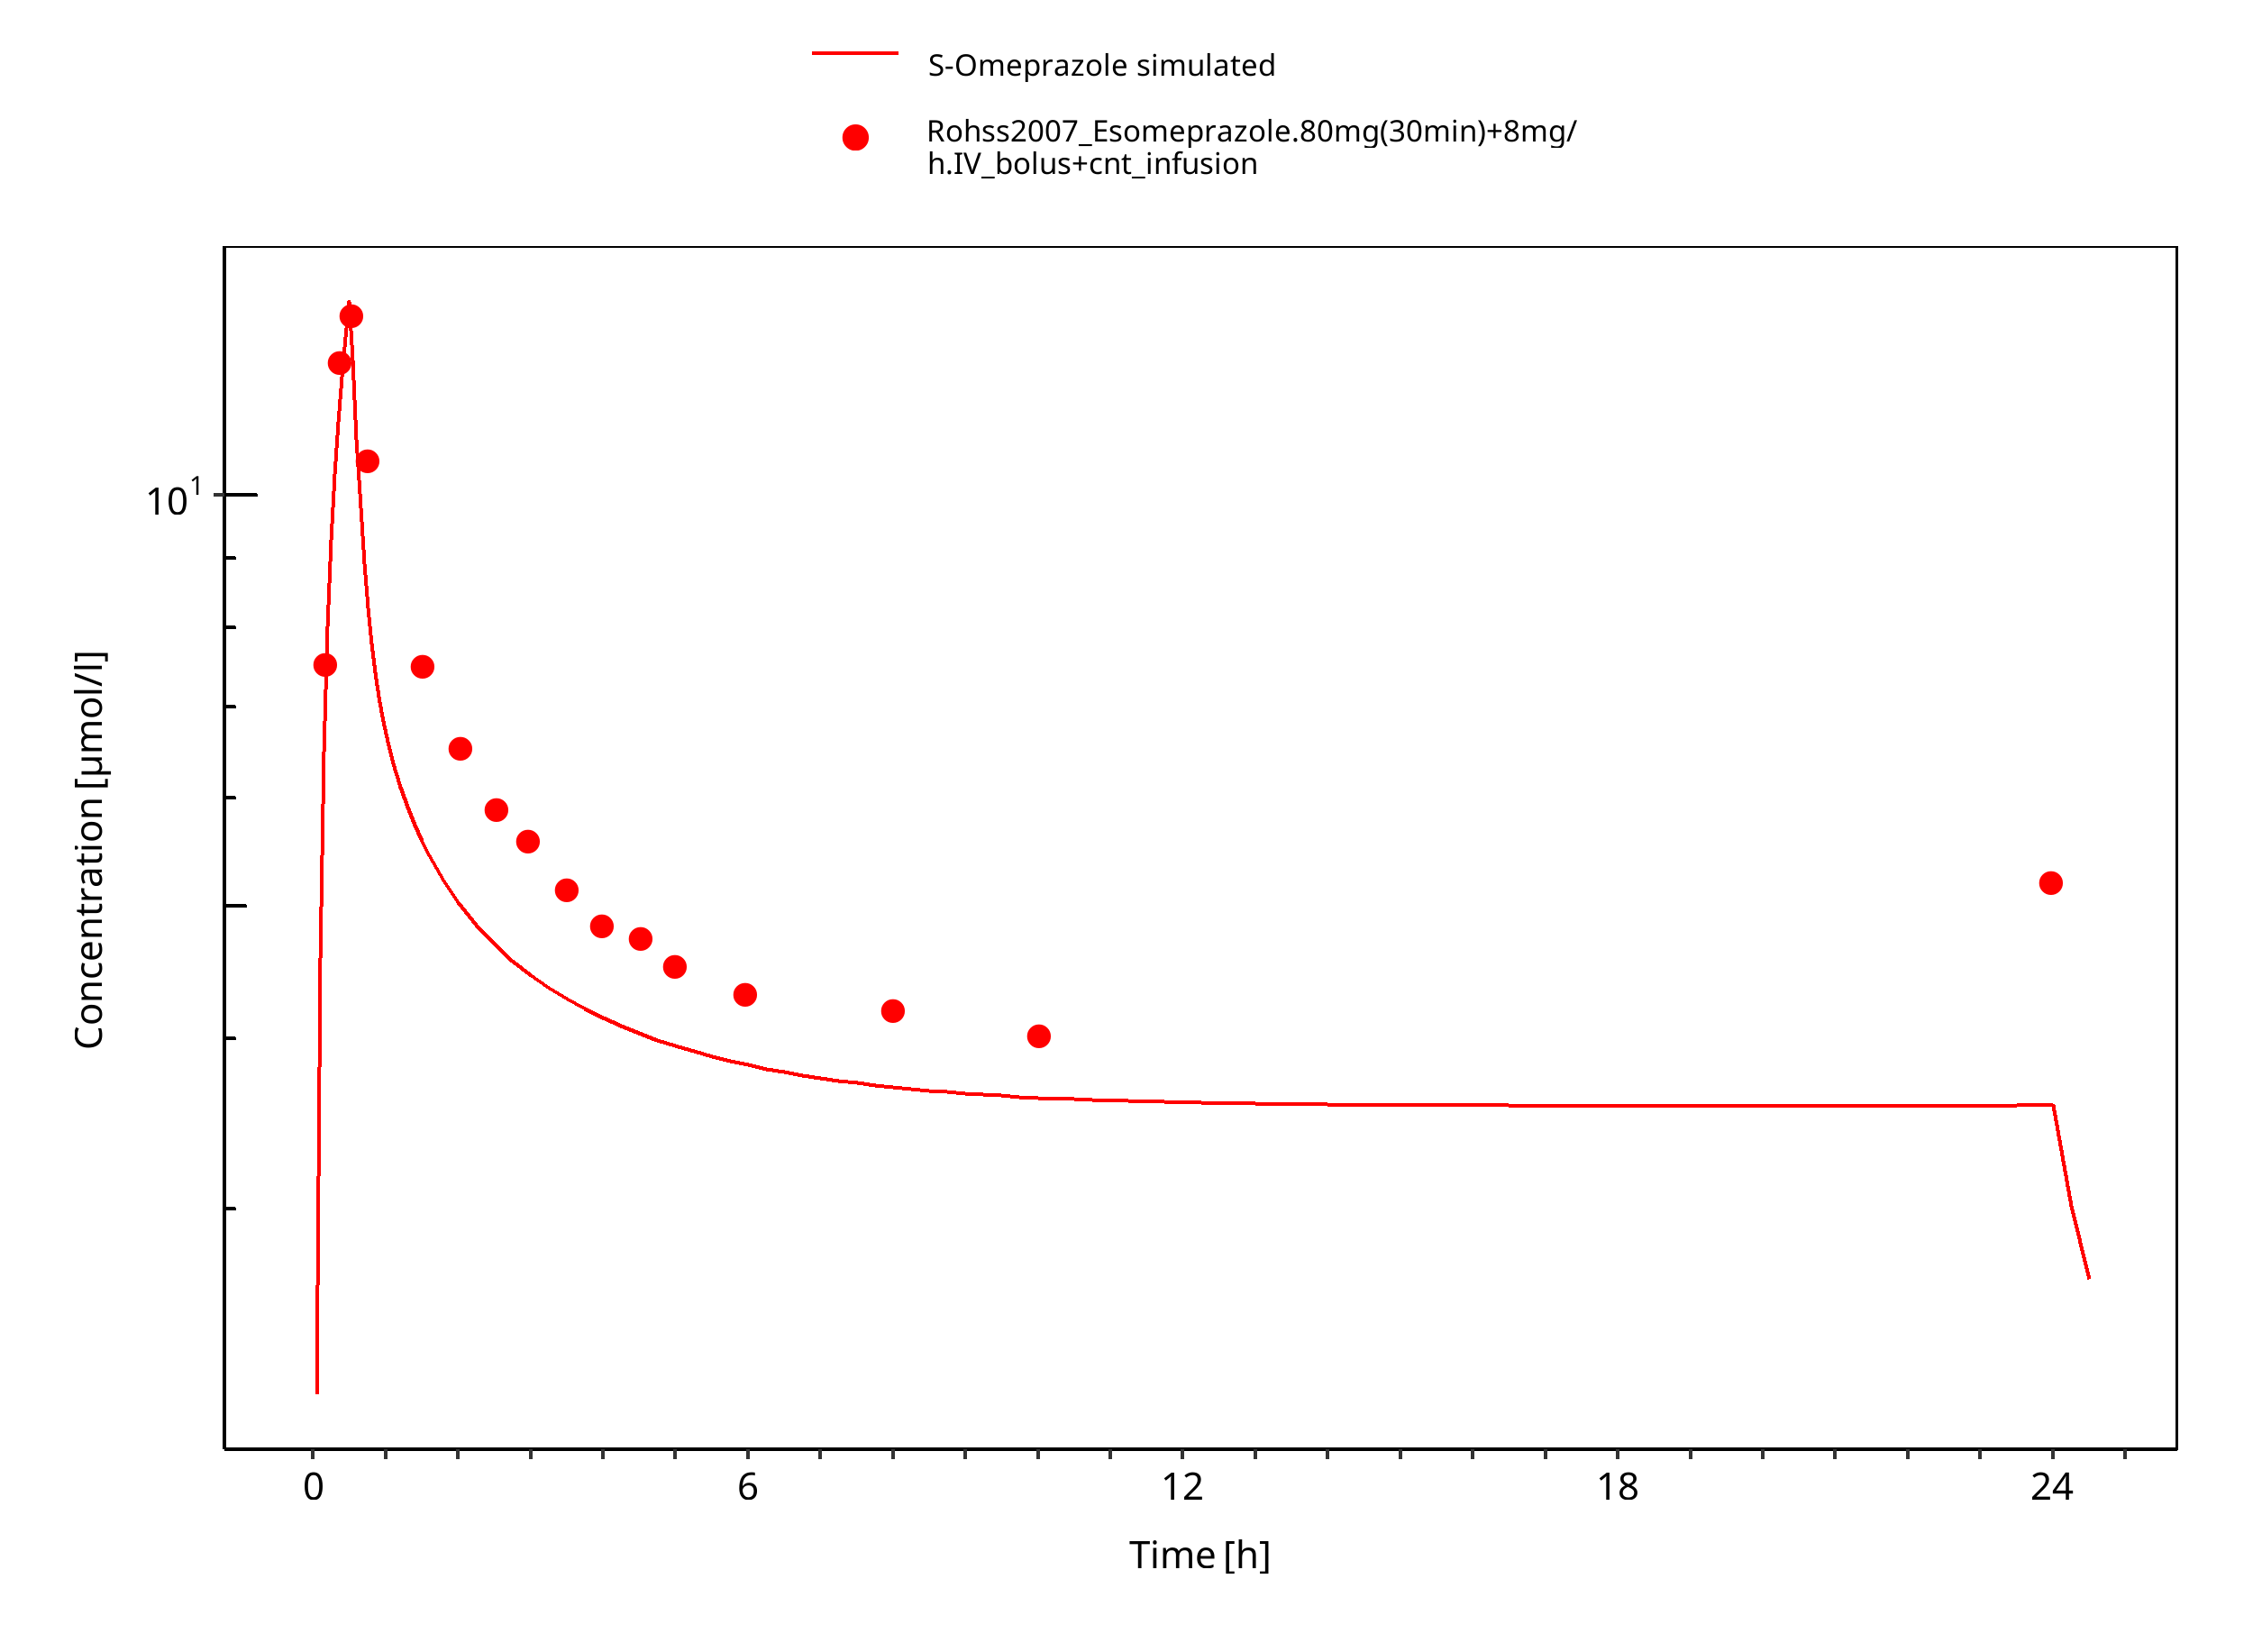
Figure 3-11: 80 mg 30 min + 8 mg/h iv S-omeprazole
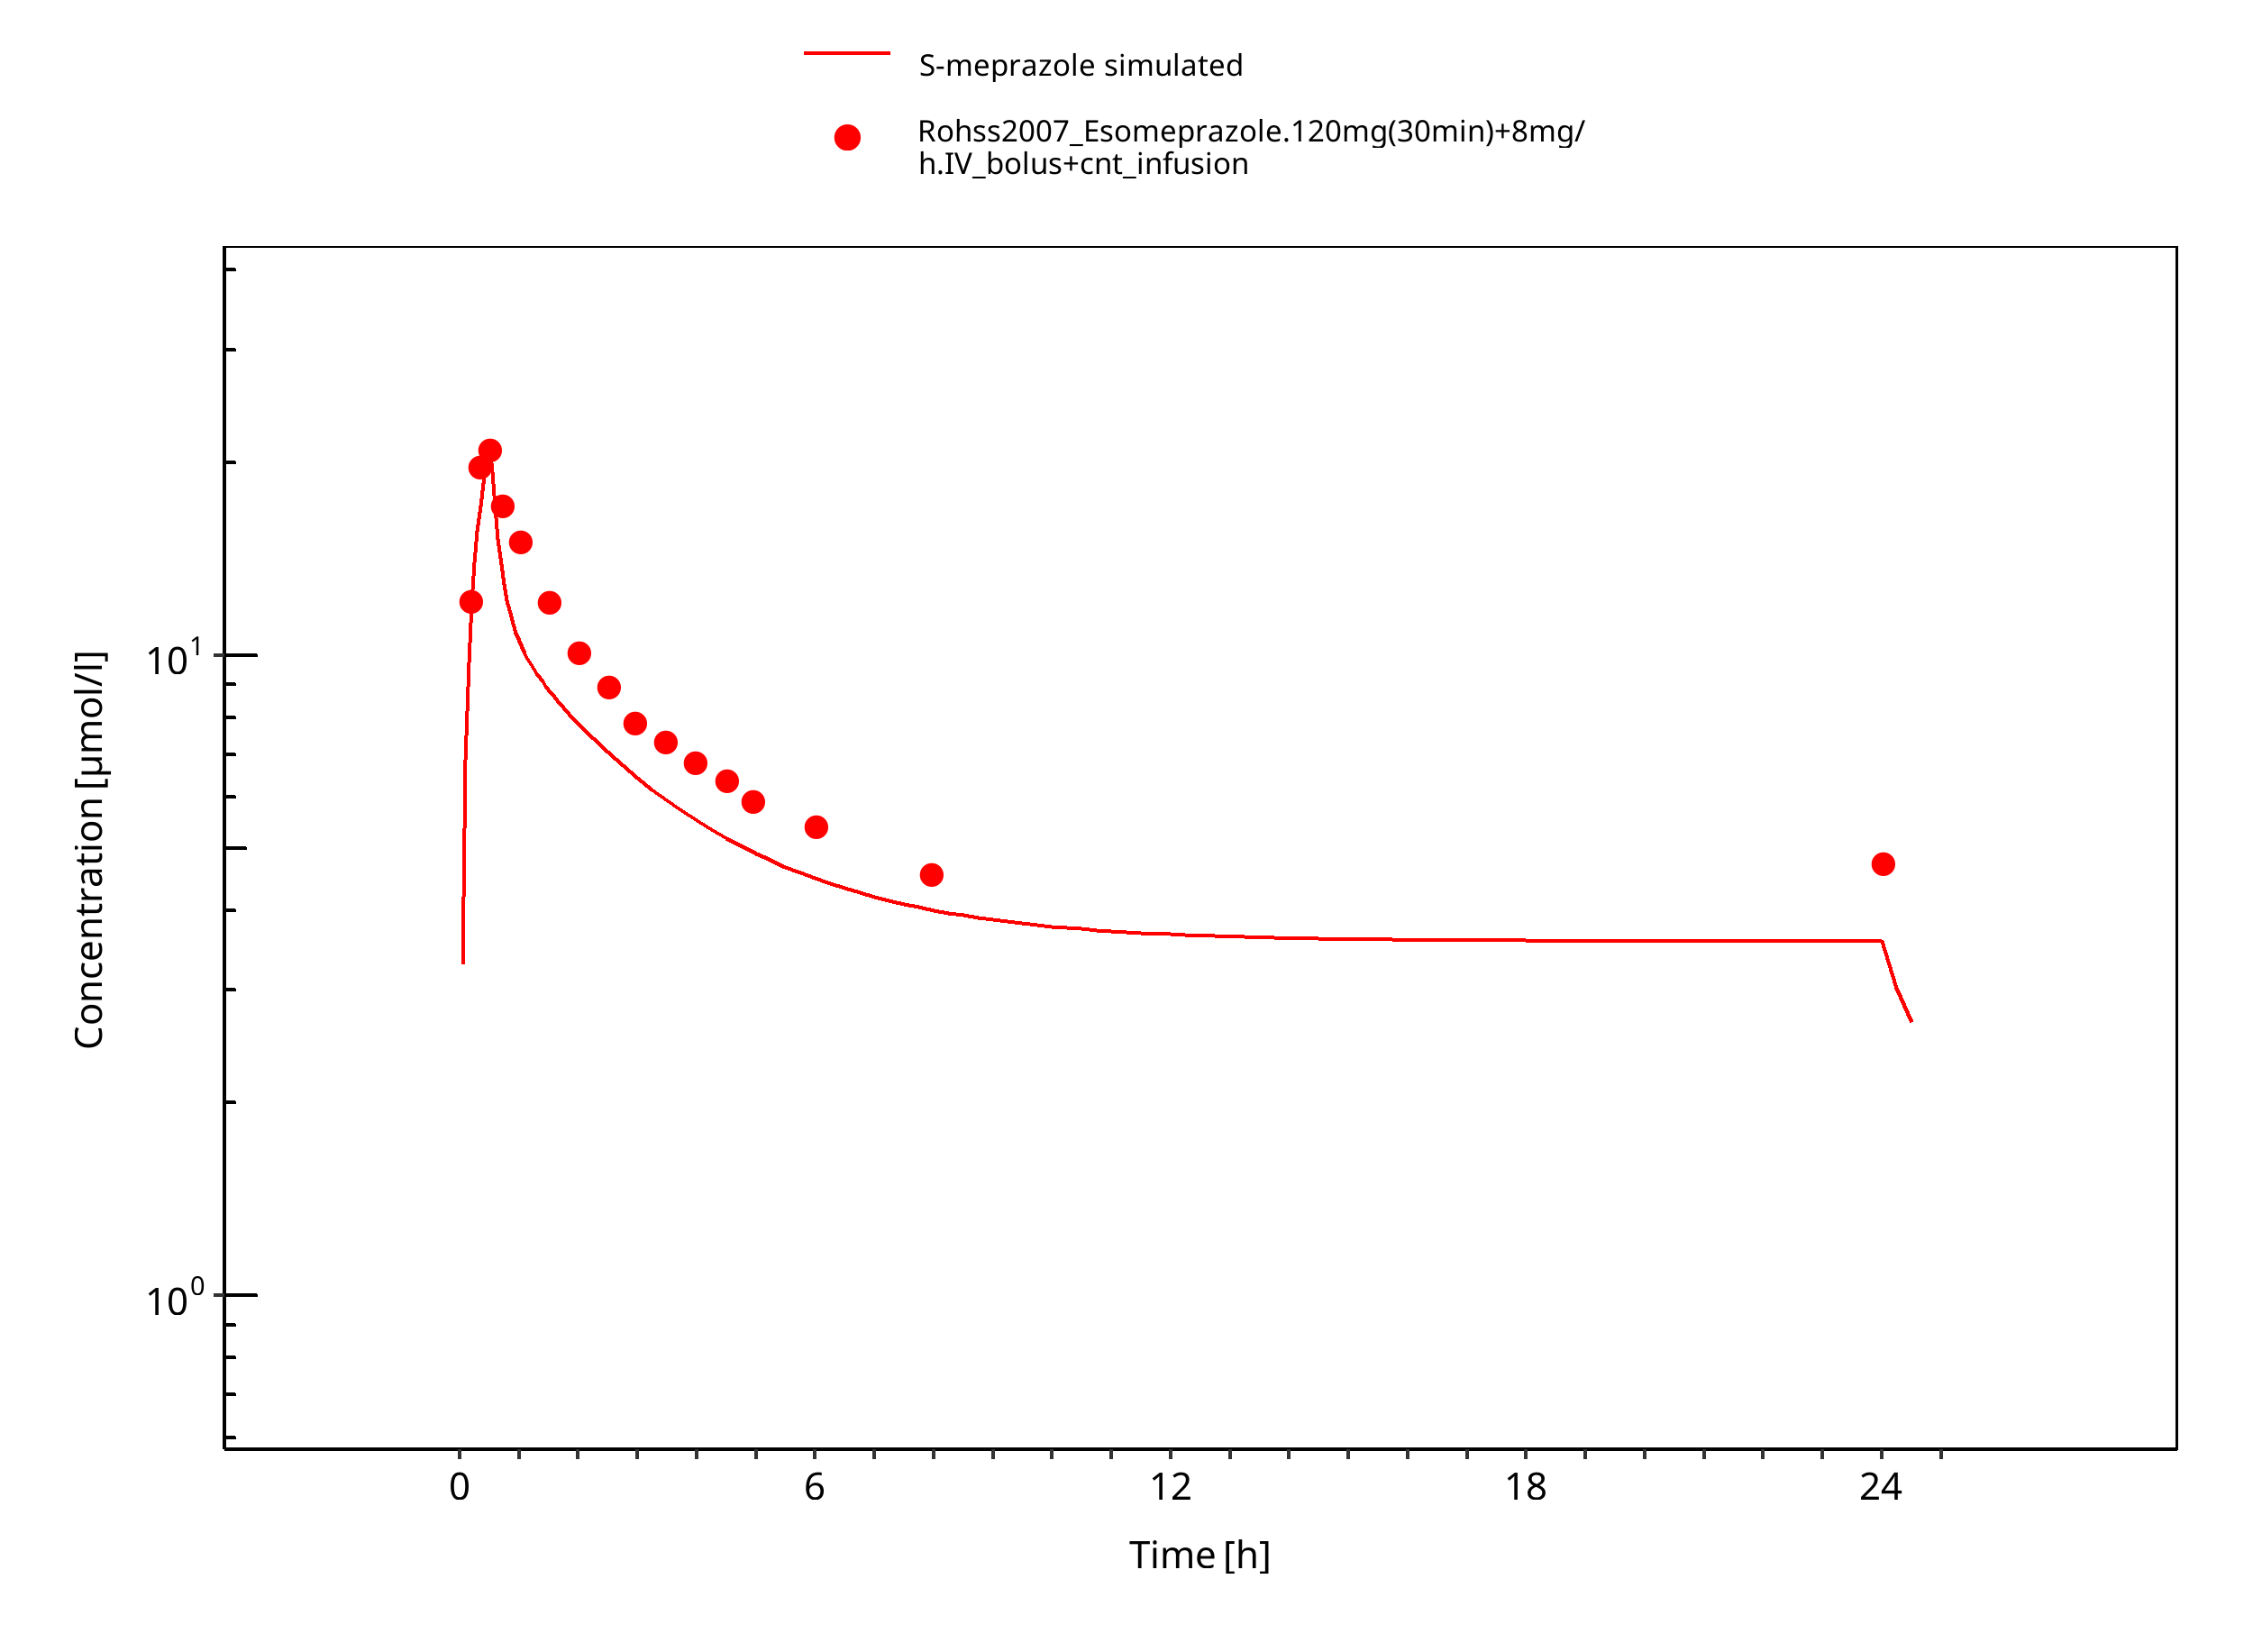
Figure 3-12: 120 mg 30 min + 8 mg/h iv S-omeprazole
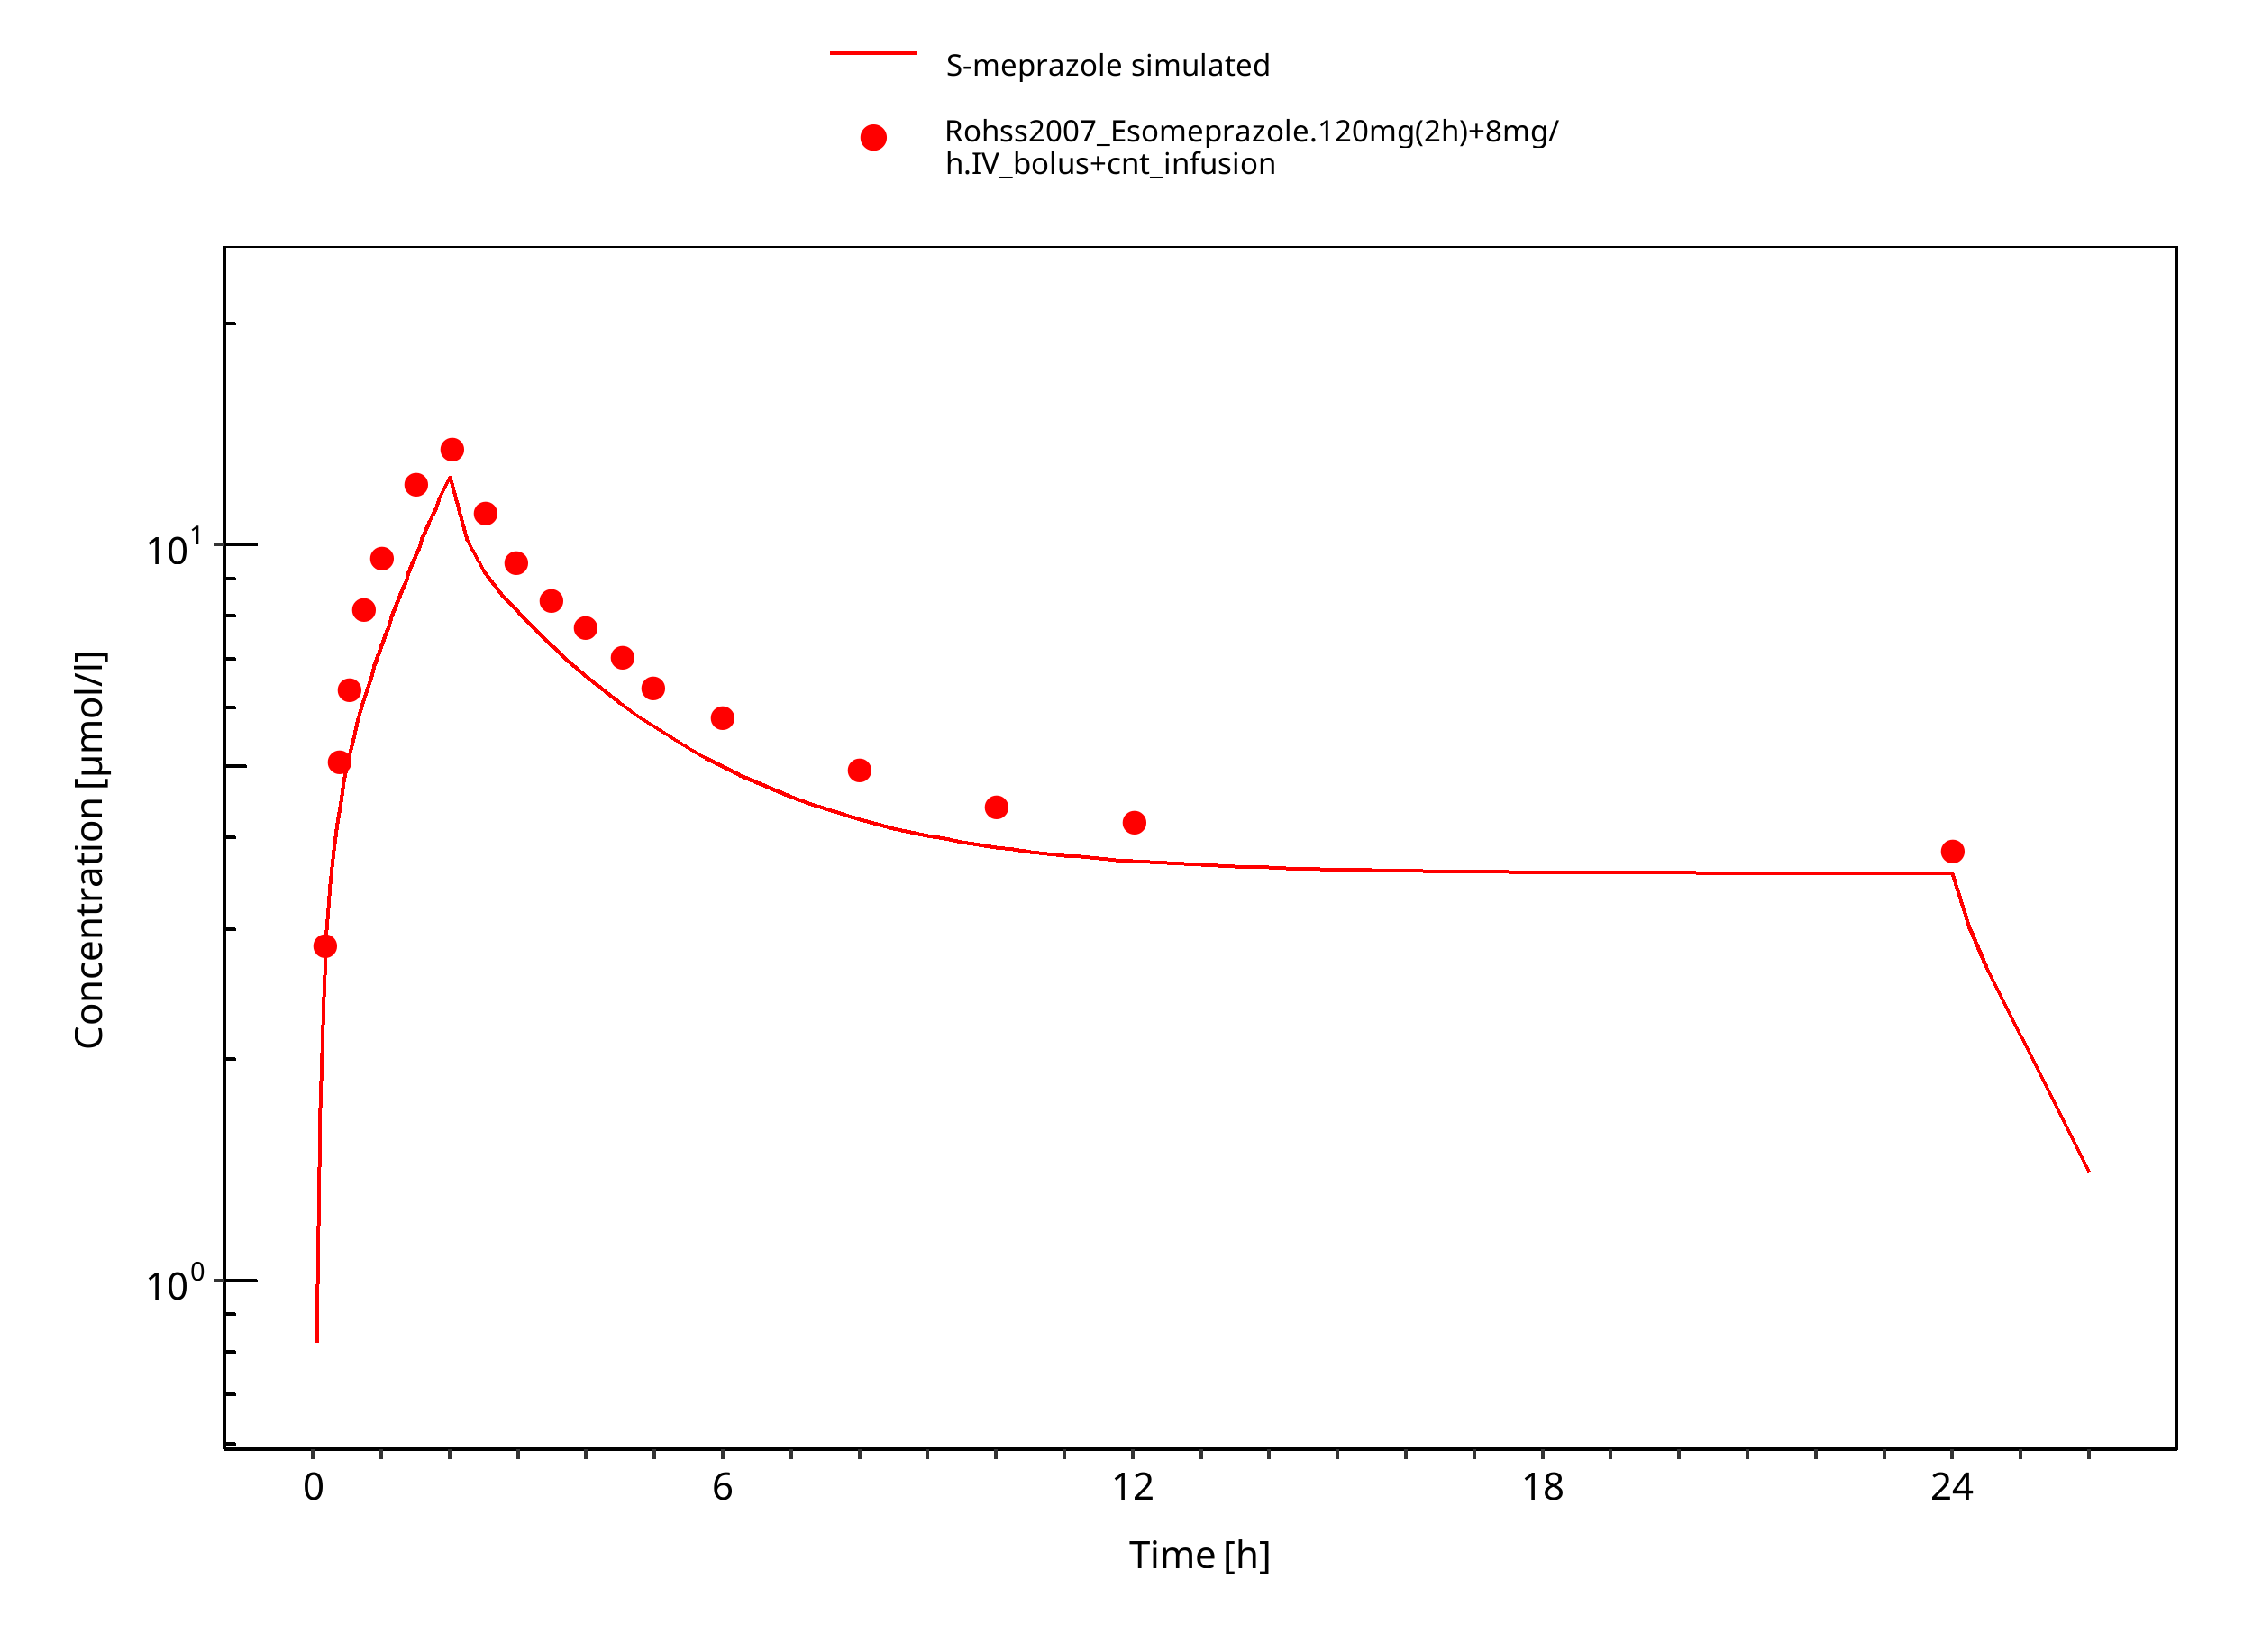
Figure 3-13: 120 mg 2h + 8 mg/h iv S-omeprazole
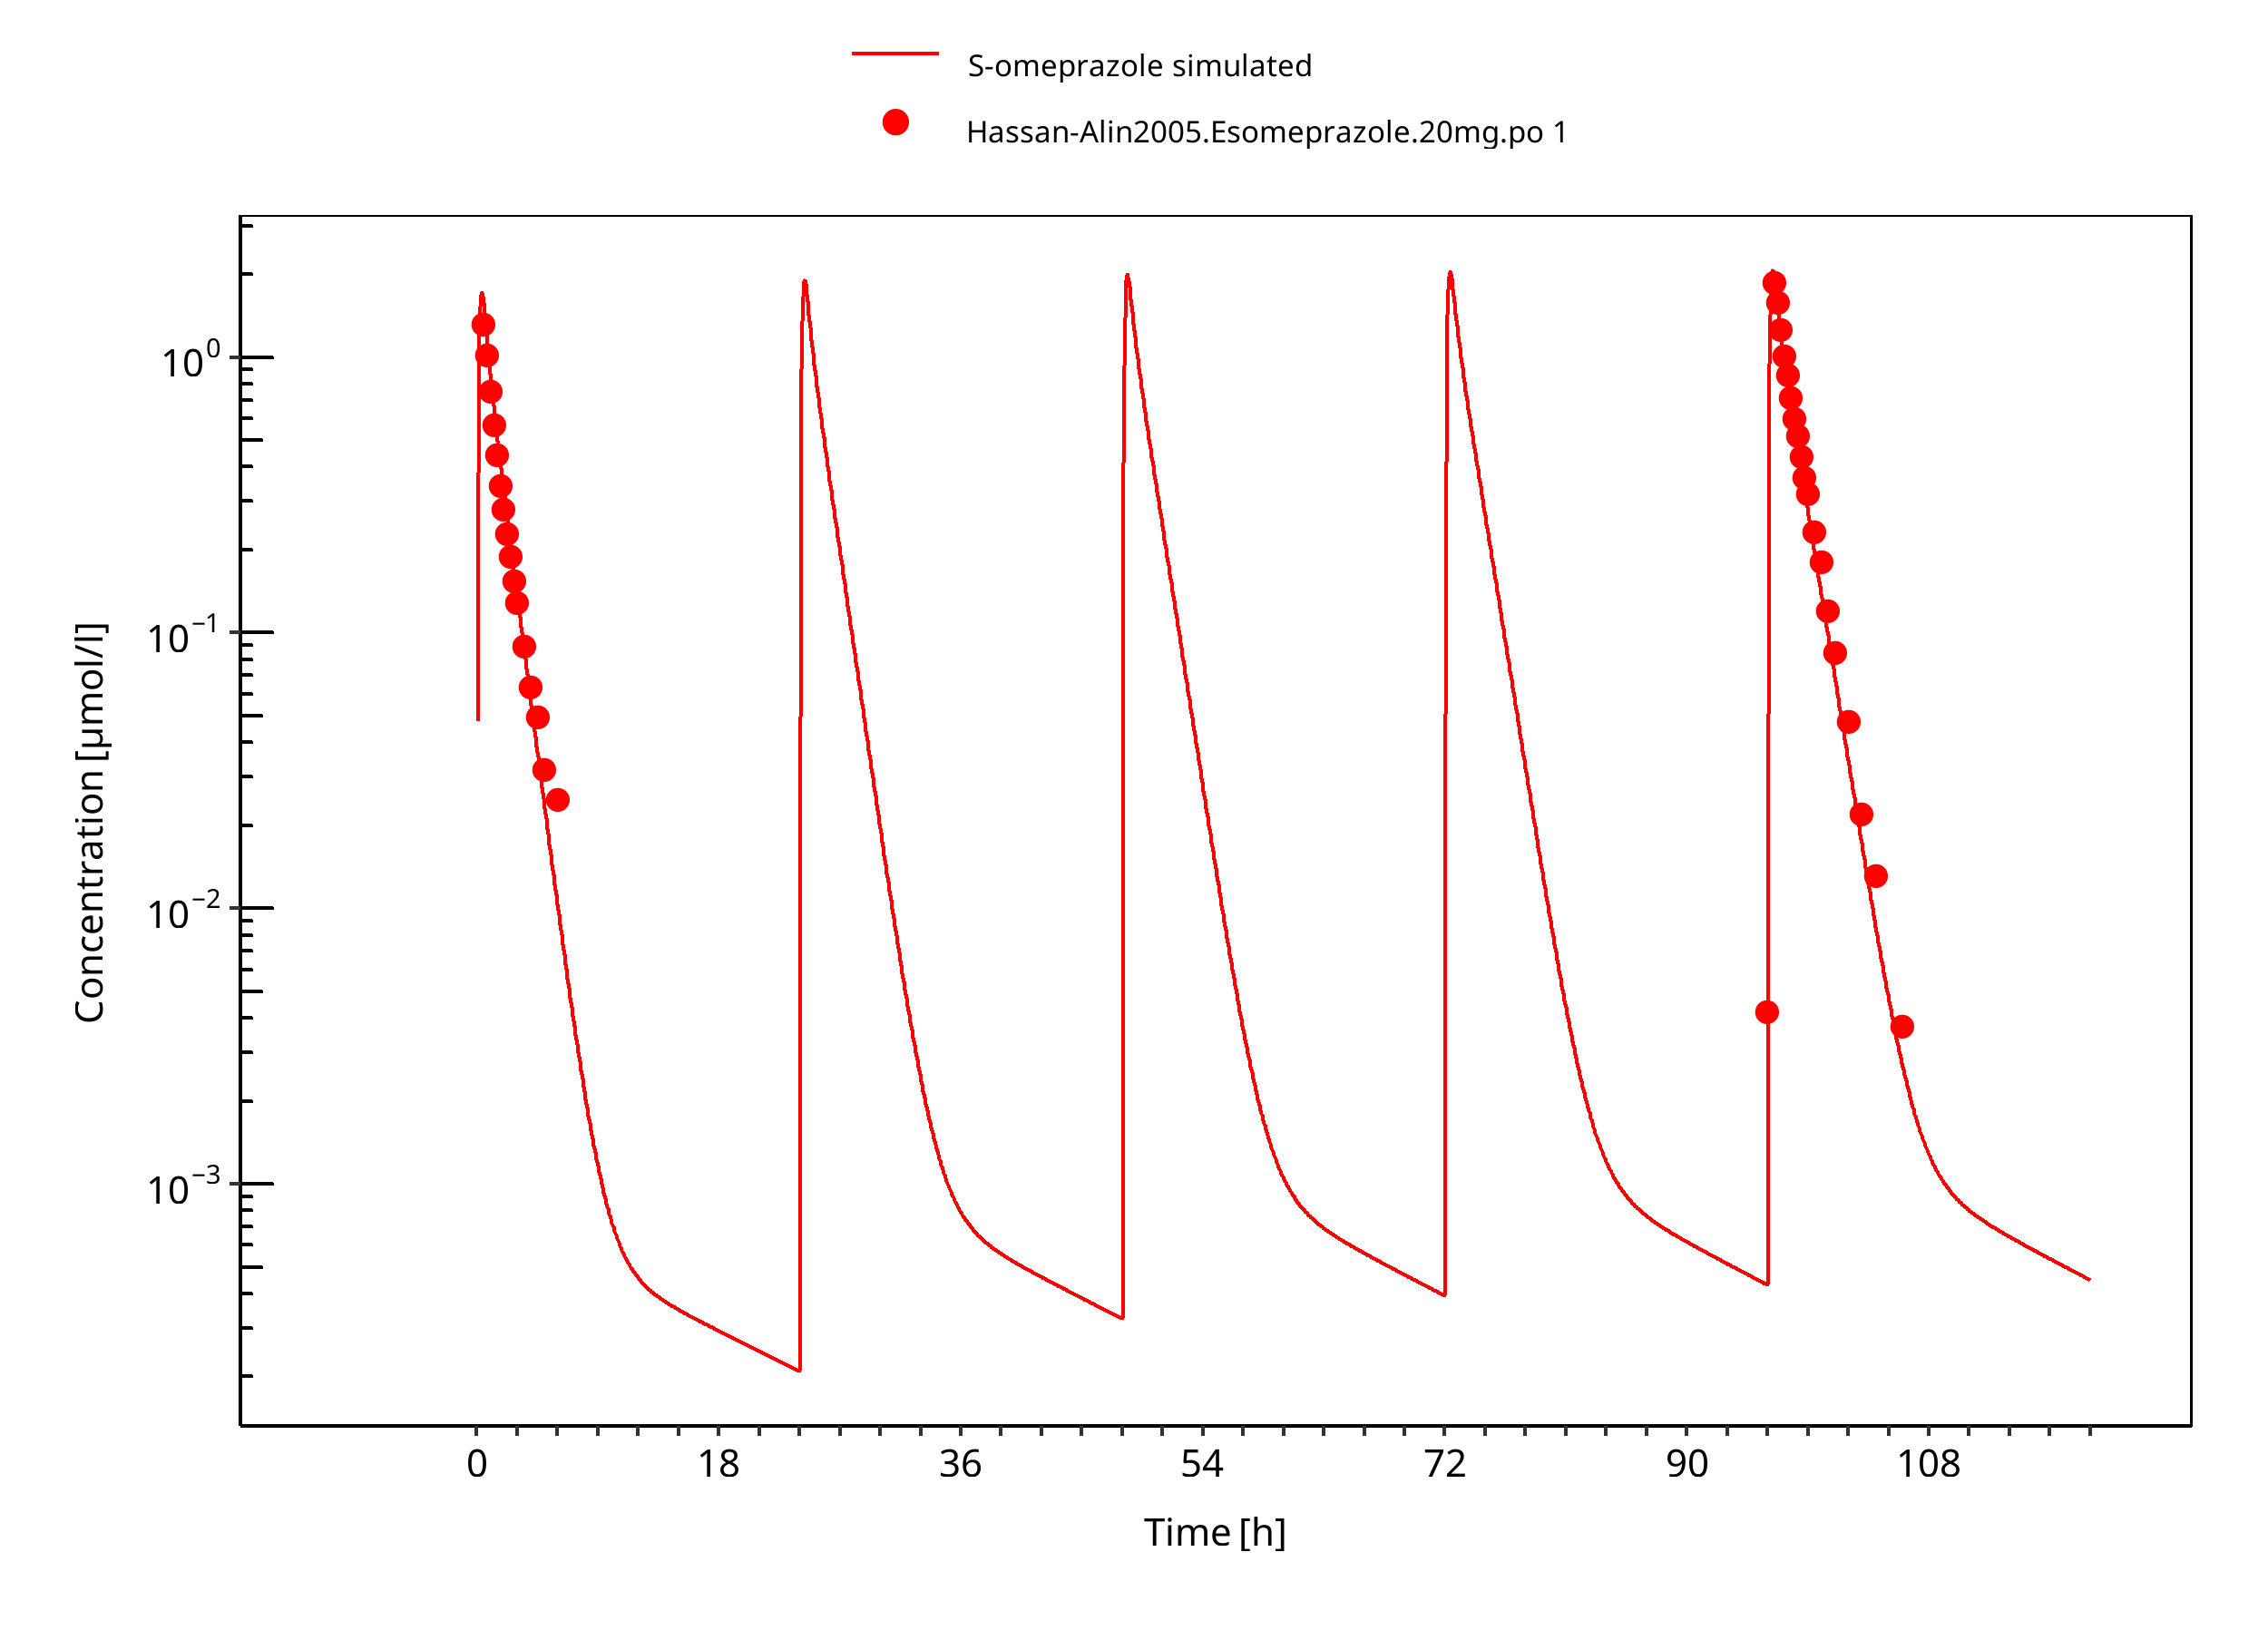
Figure 3-14: 20 mg S-omeprazole oral solution
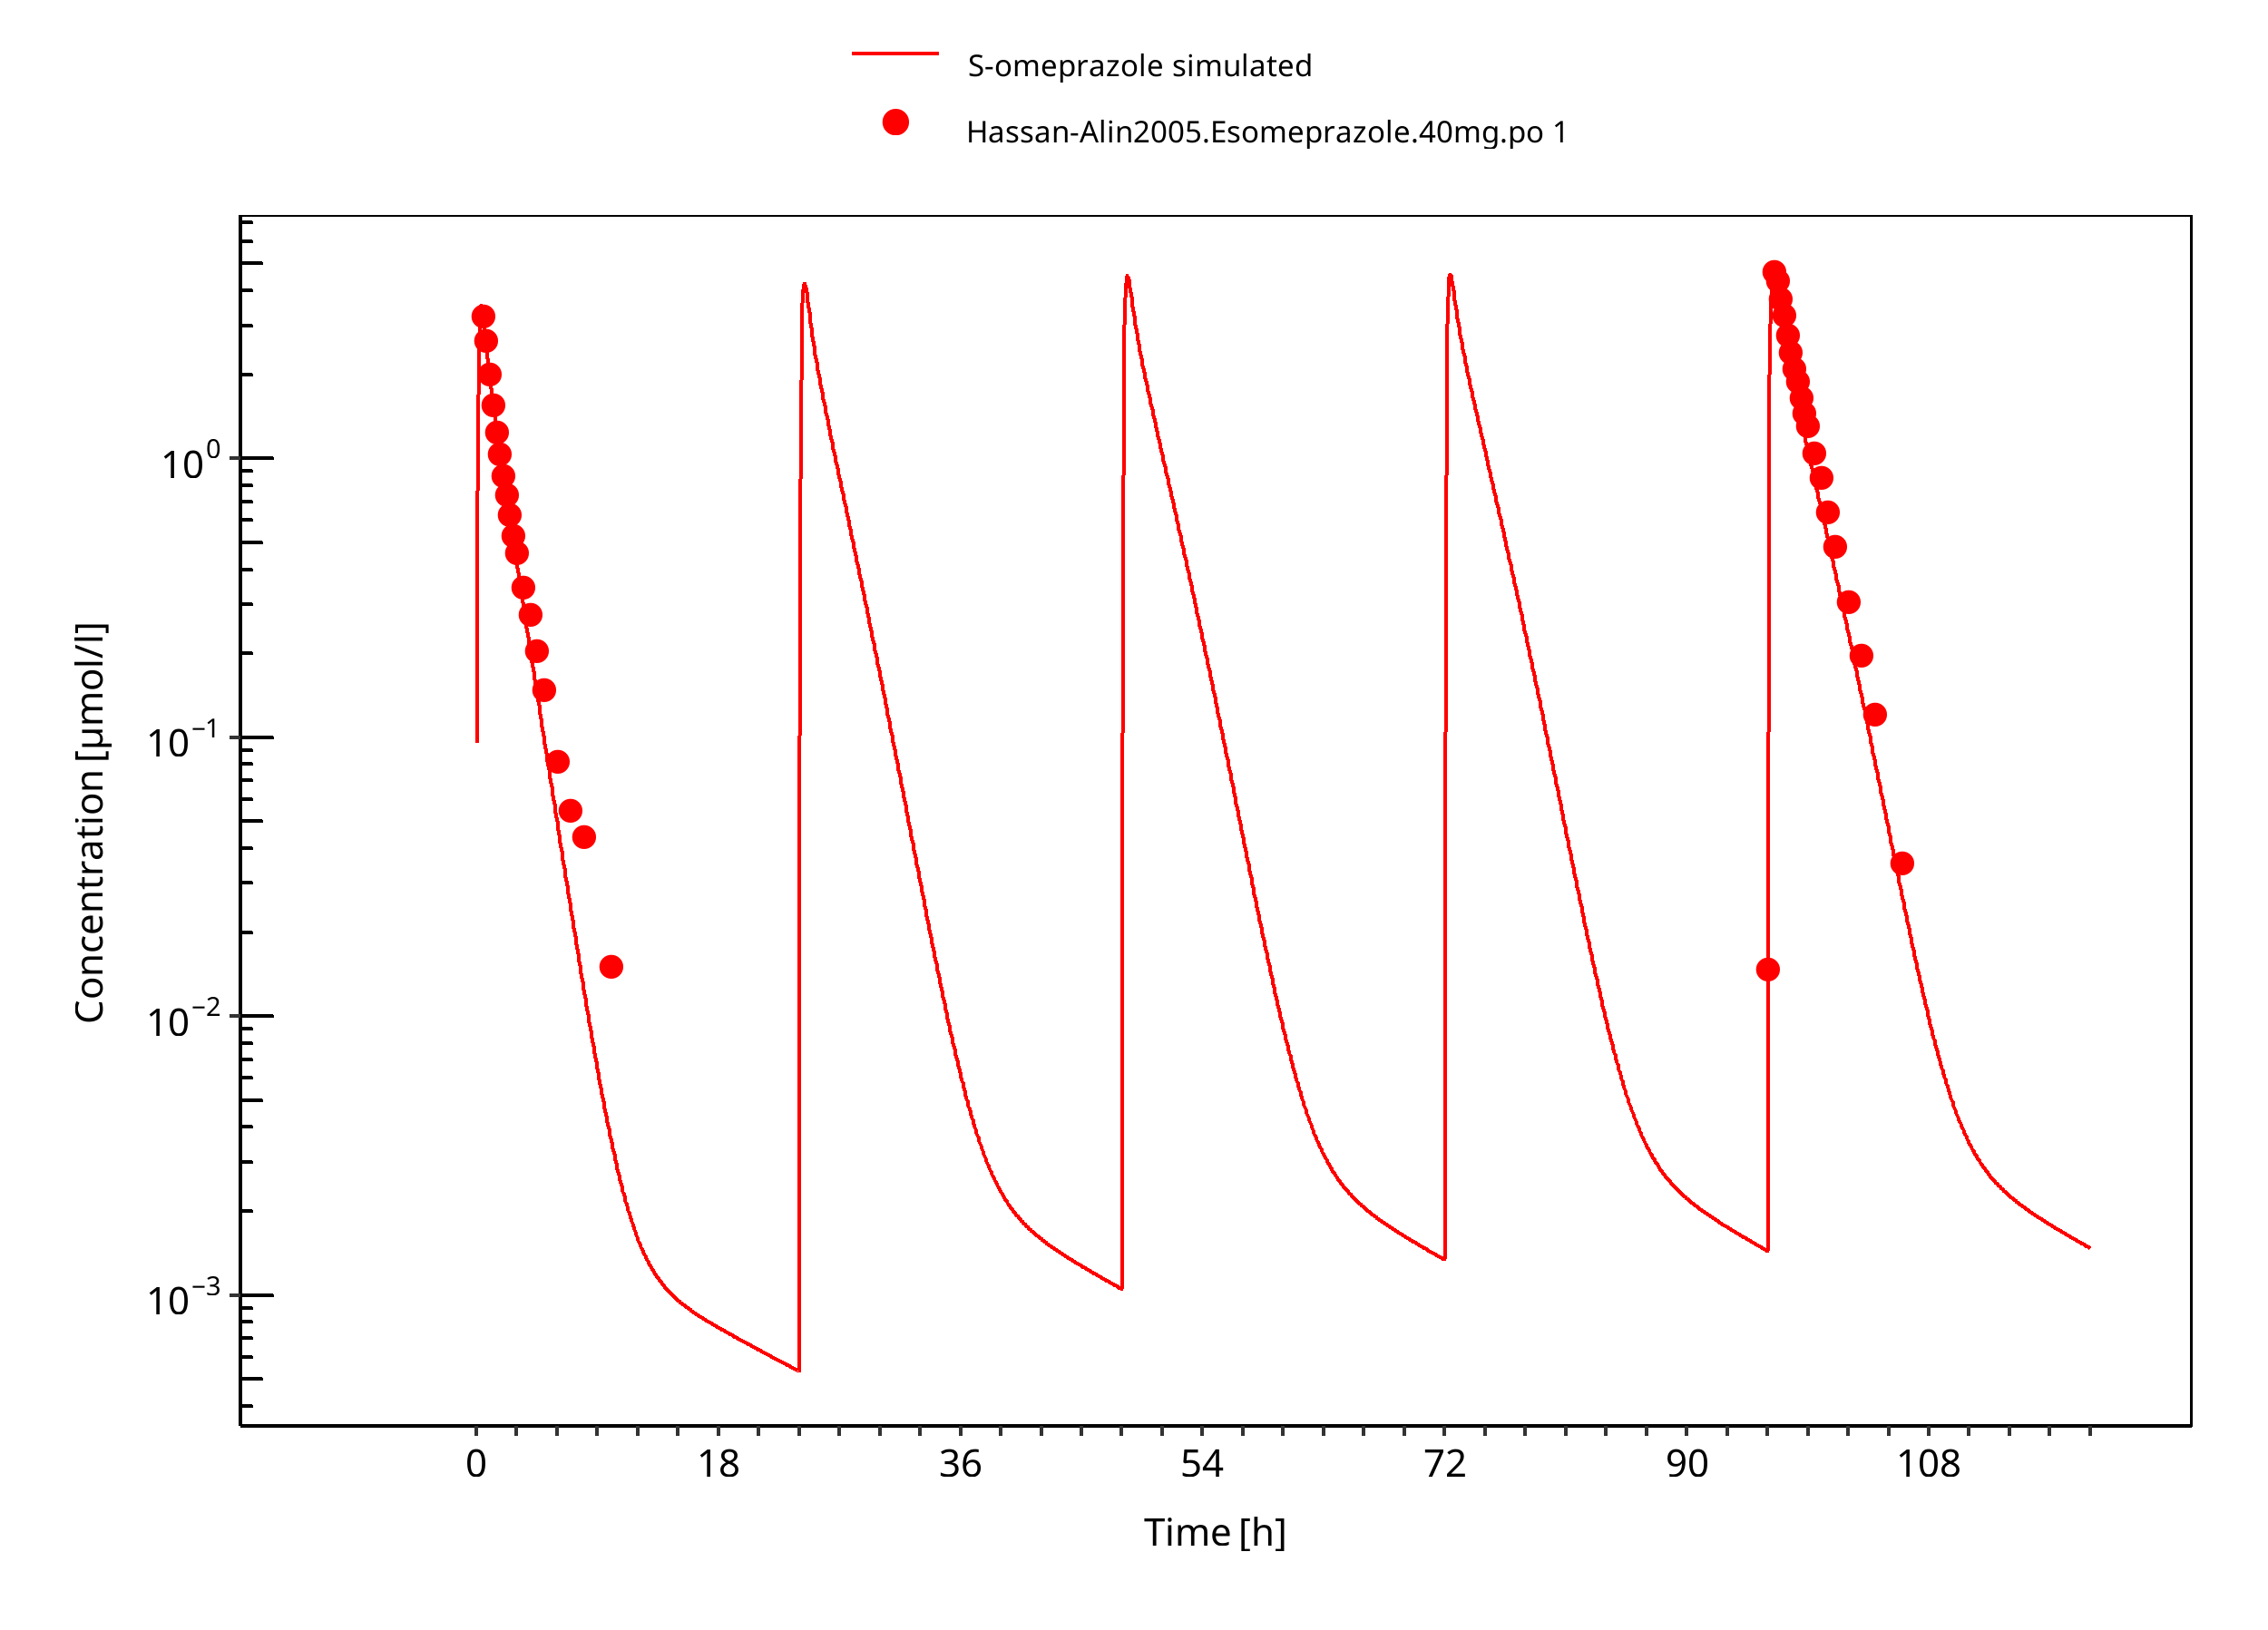
Figure 3-15: 40 mg S-omeprazole oral solution
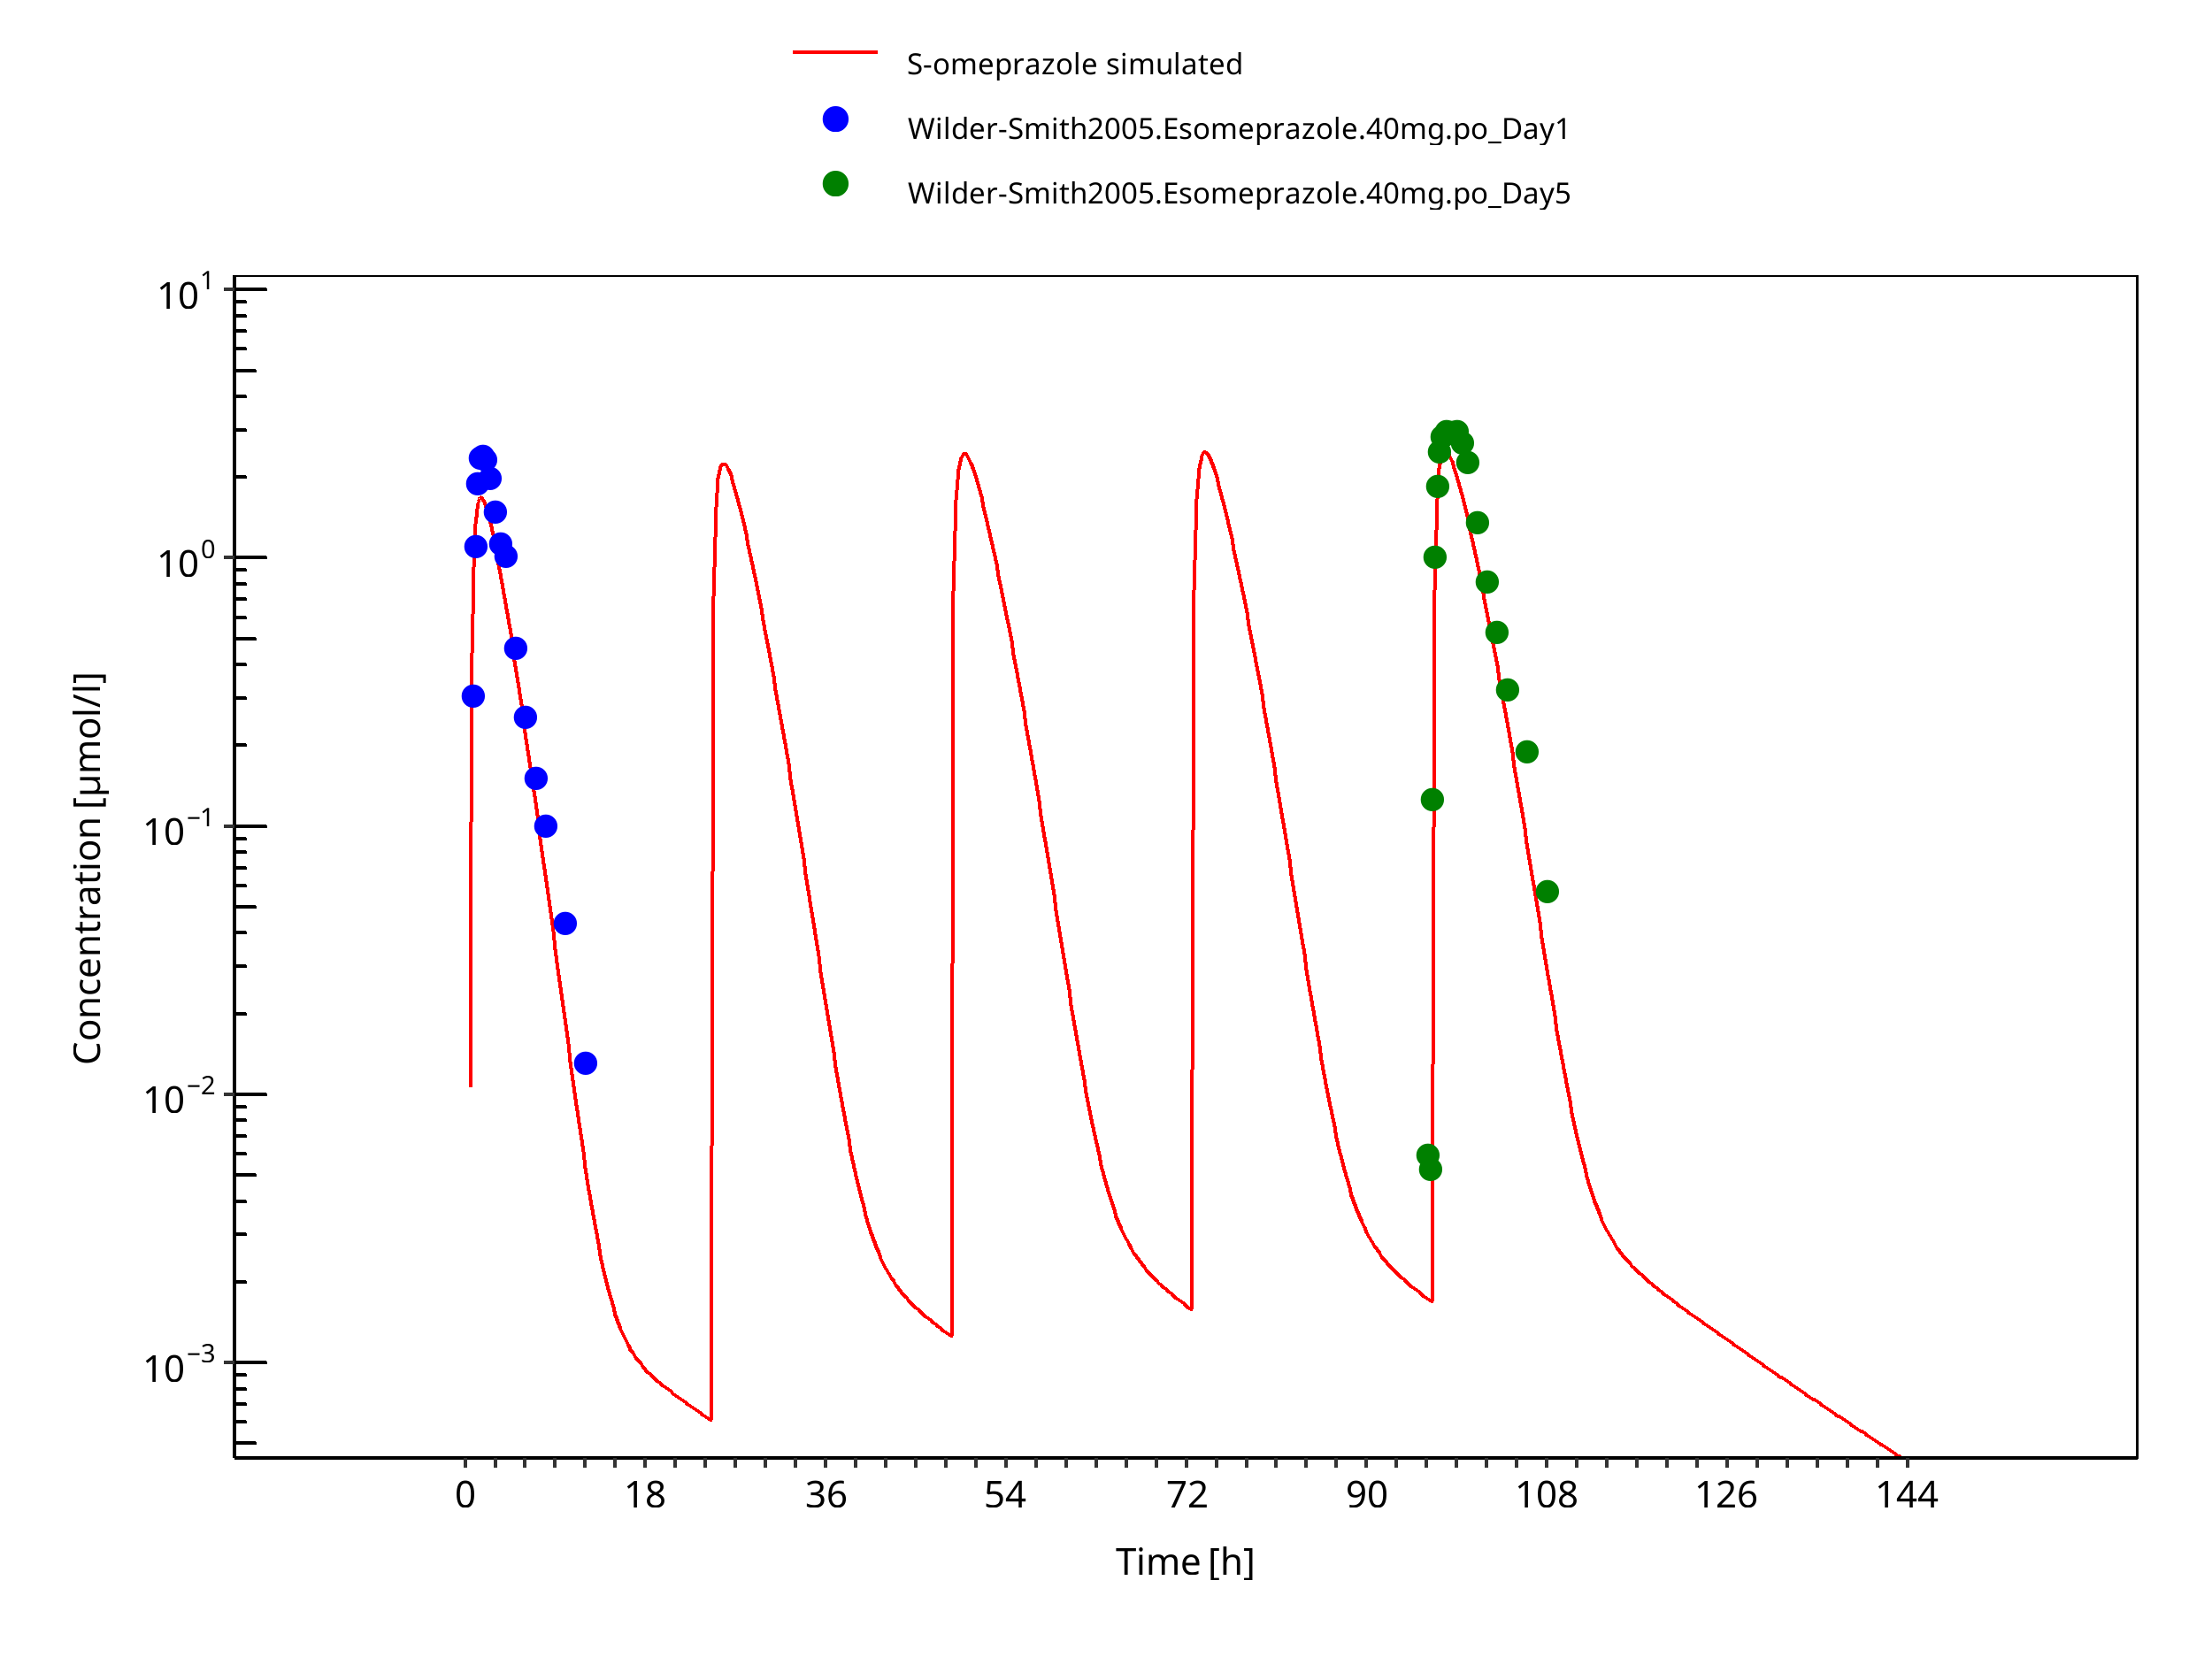
Figure 3-16: 40 mg S-omeprazole oral capsule
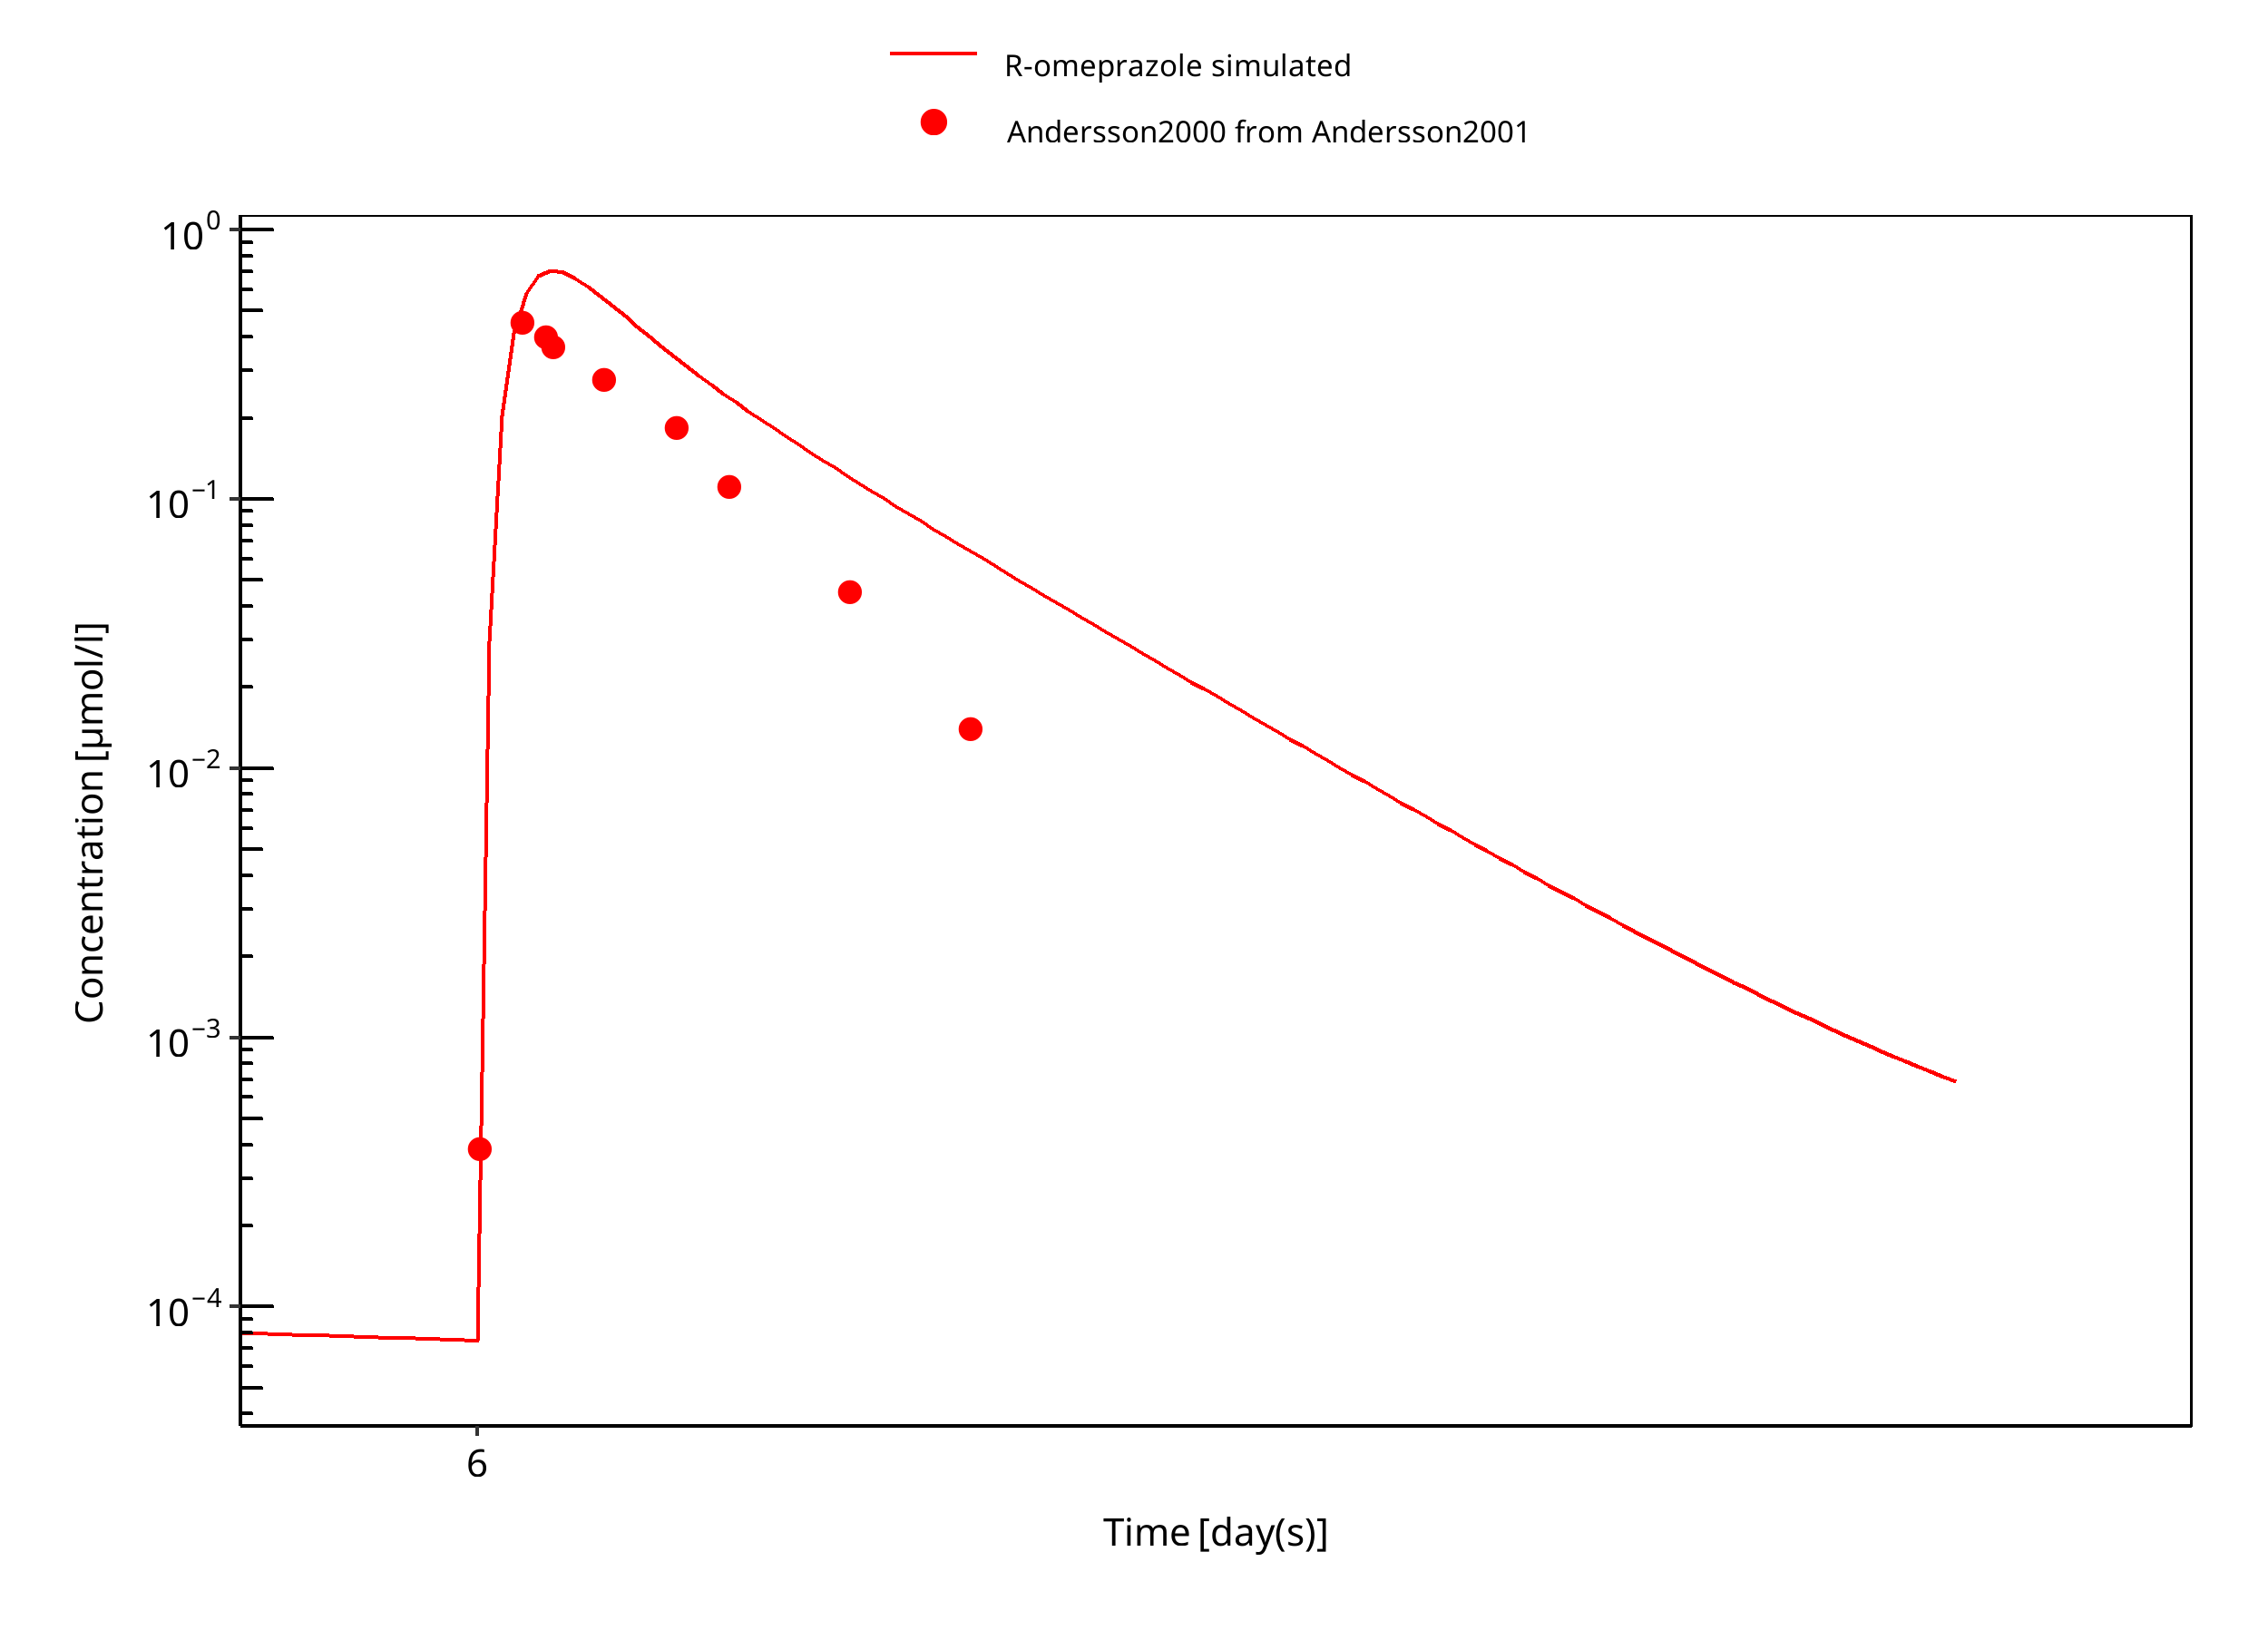
Figure 3-17: 15 mg R-omeprazole oral solution day 6
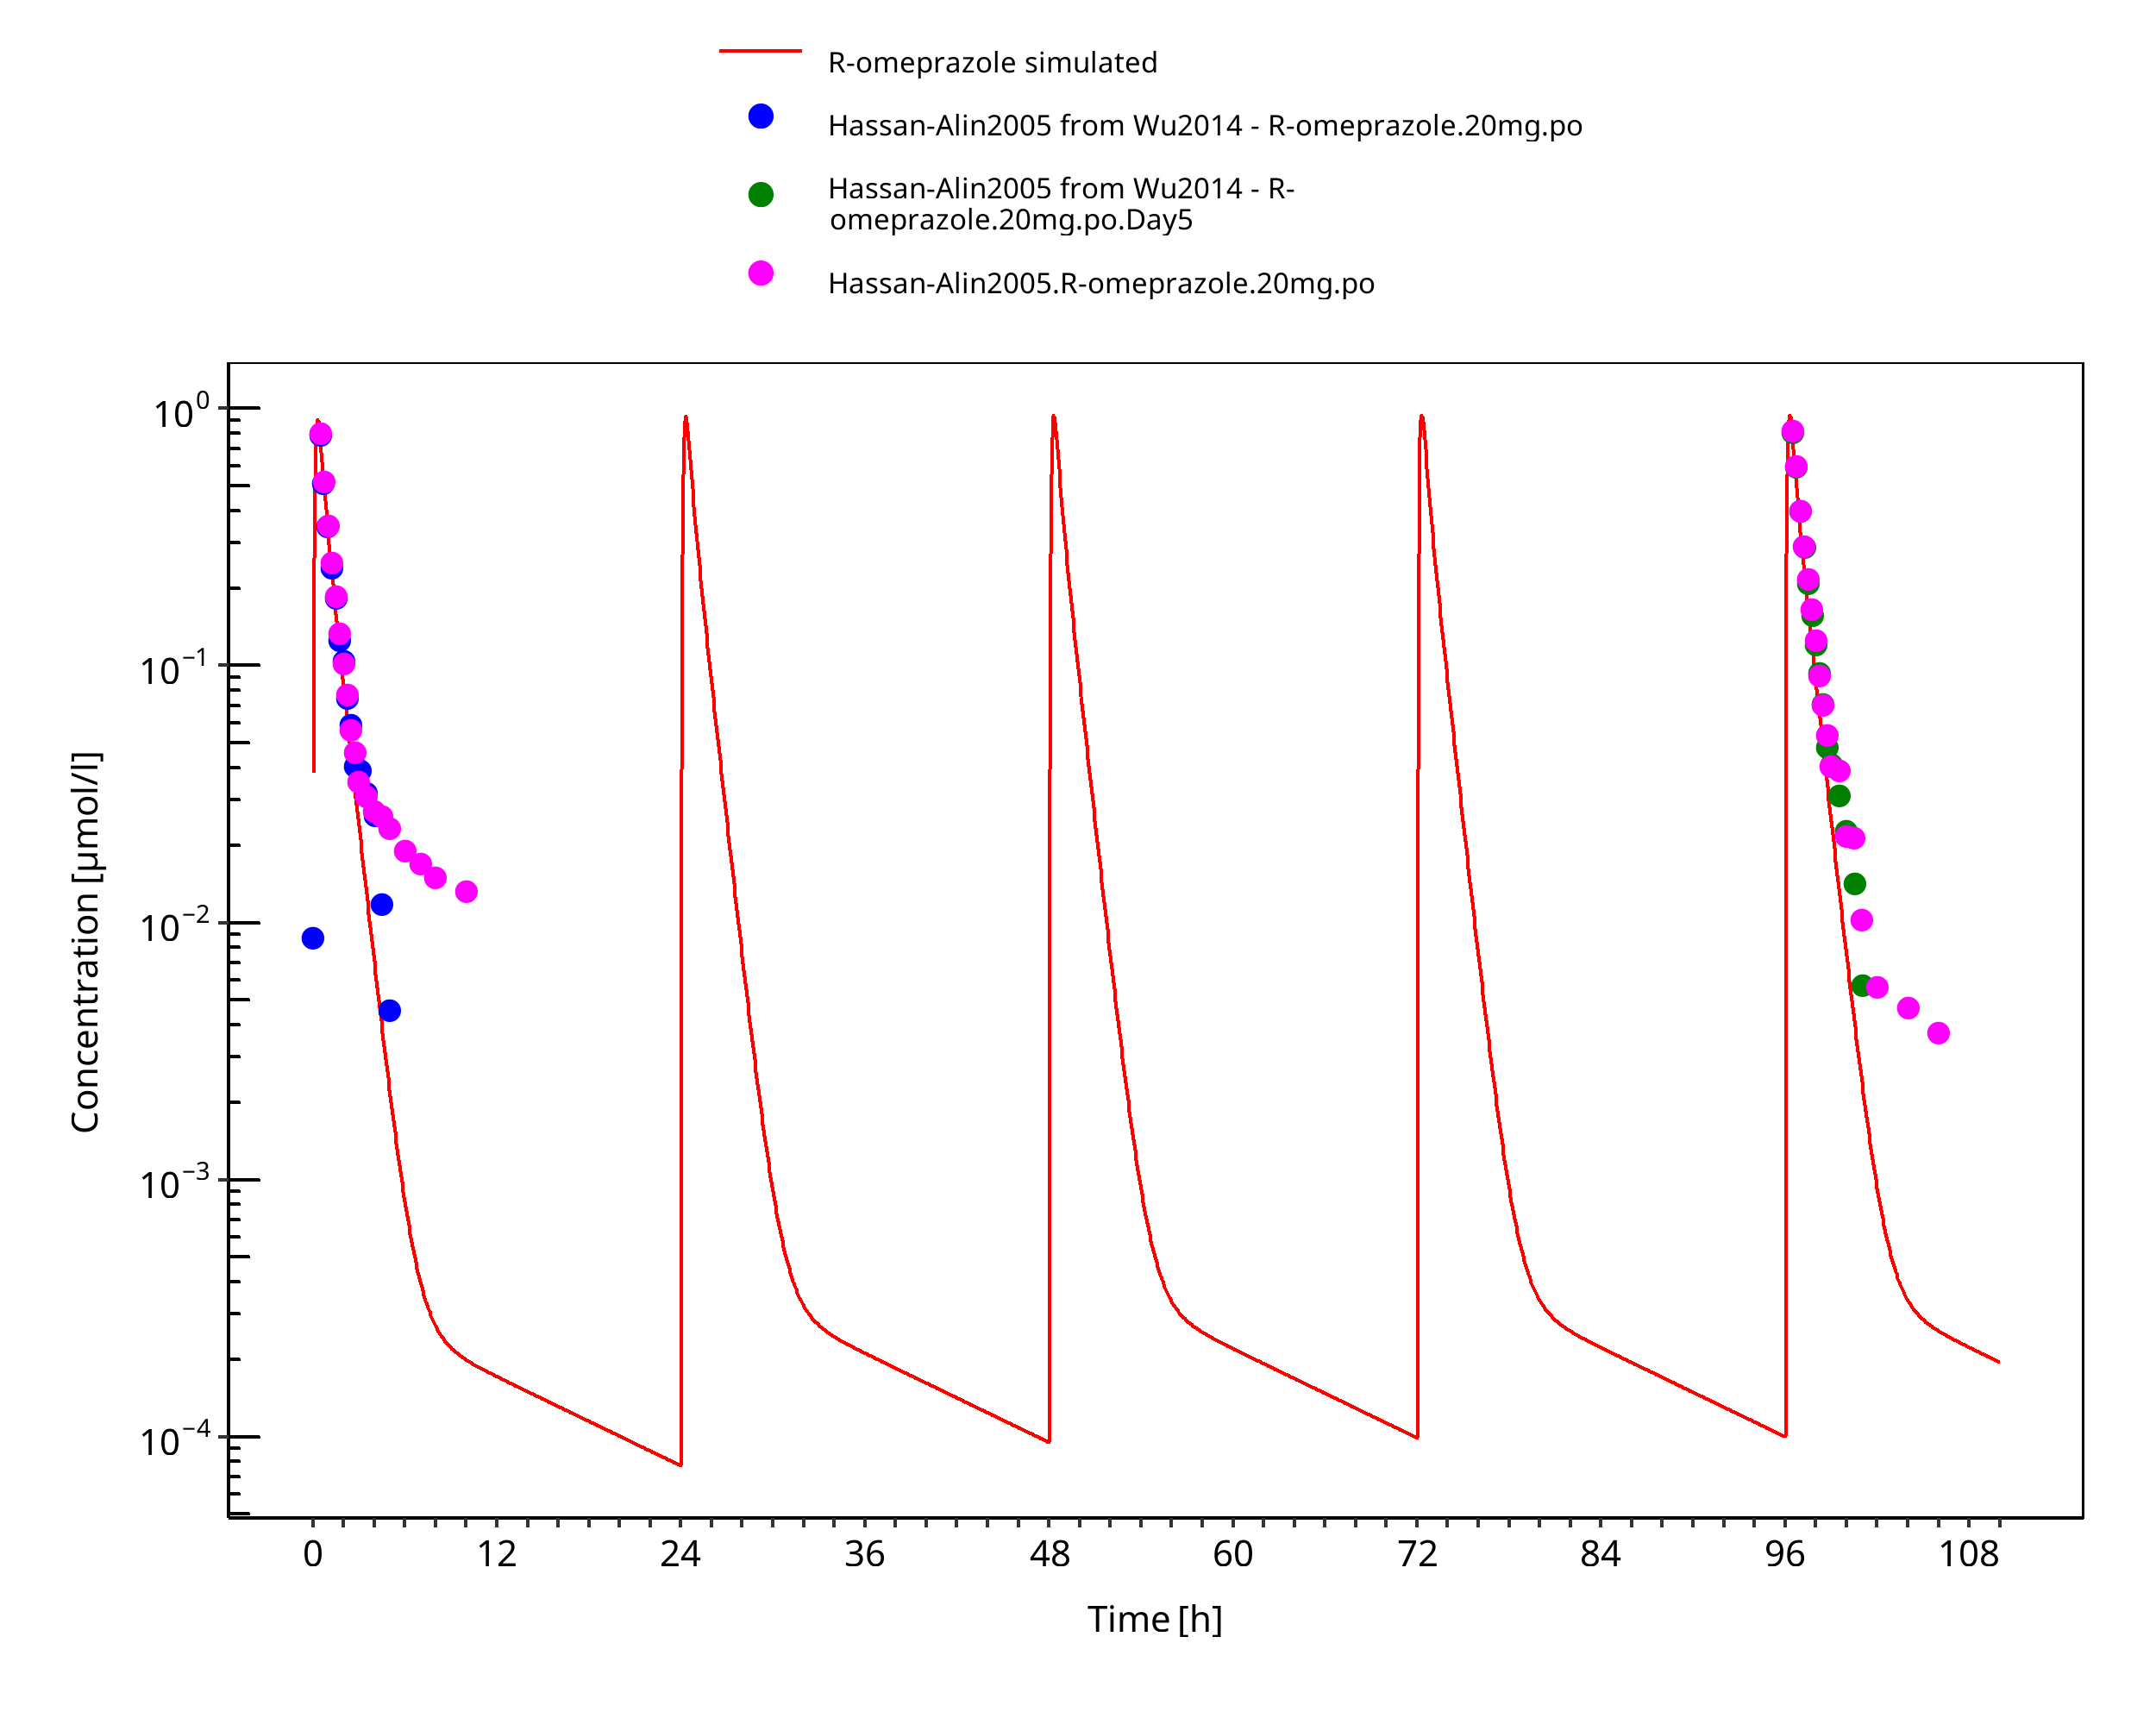
Figure 3-18: 20 mg R-omeprazole oral solution
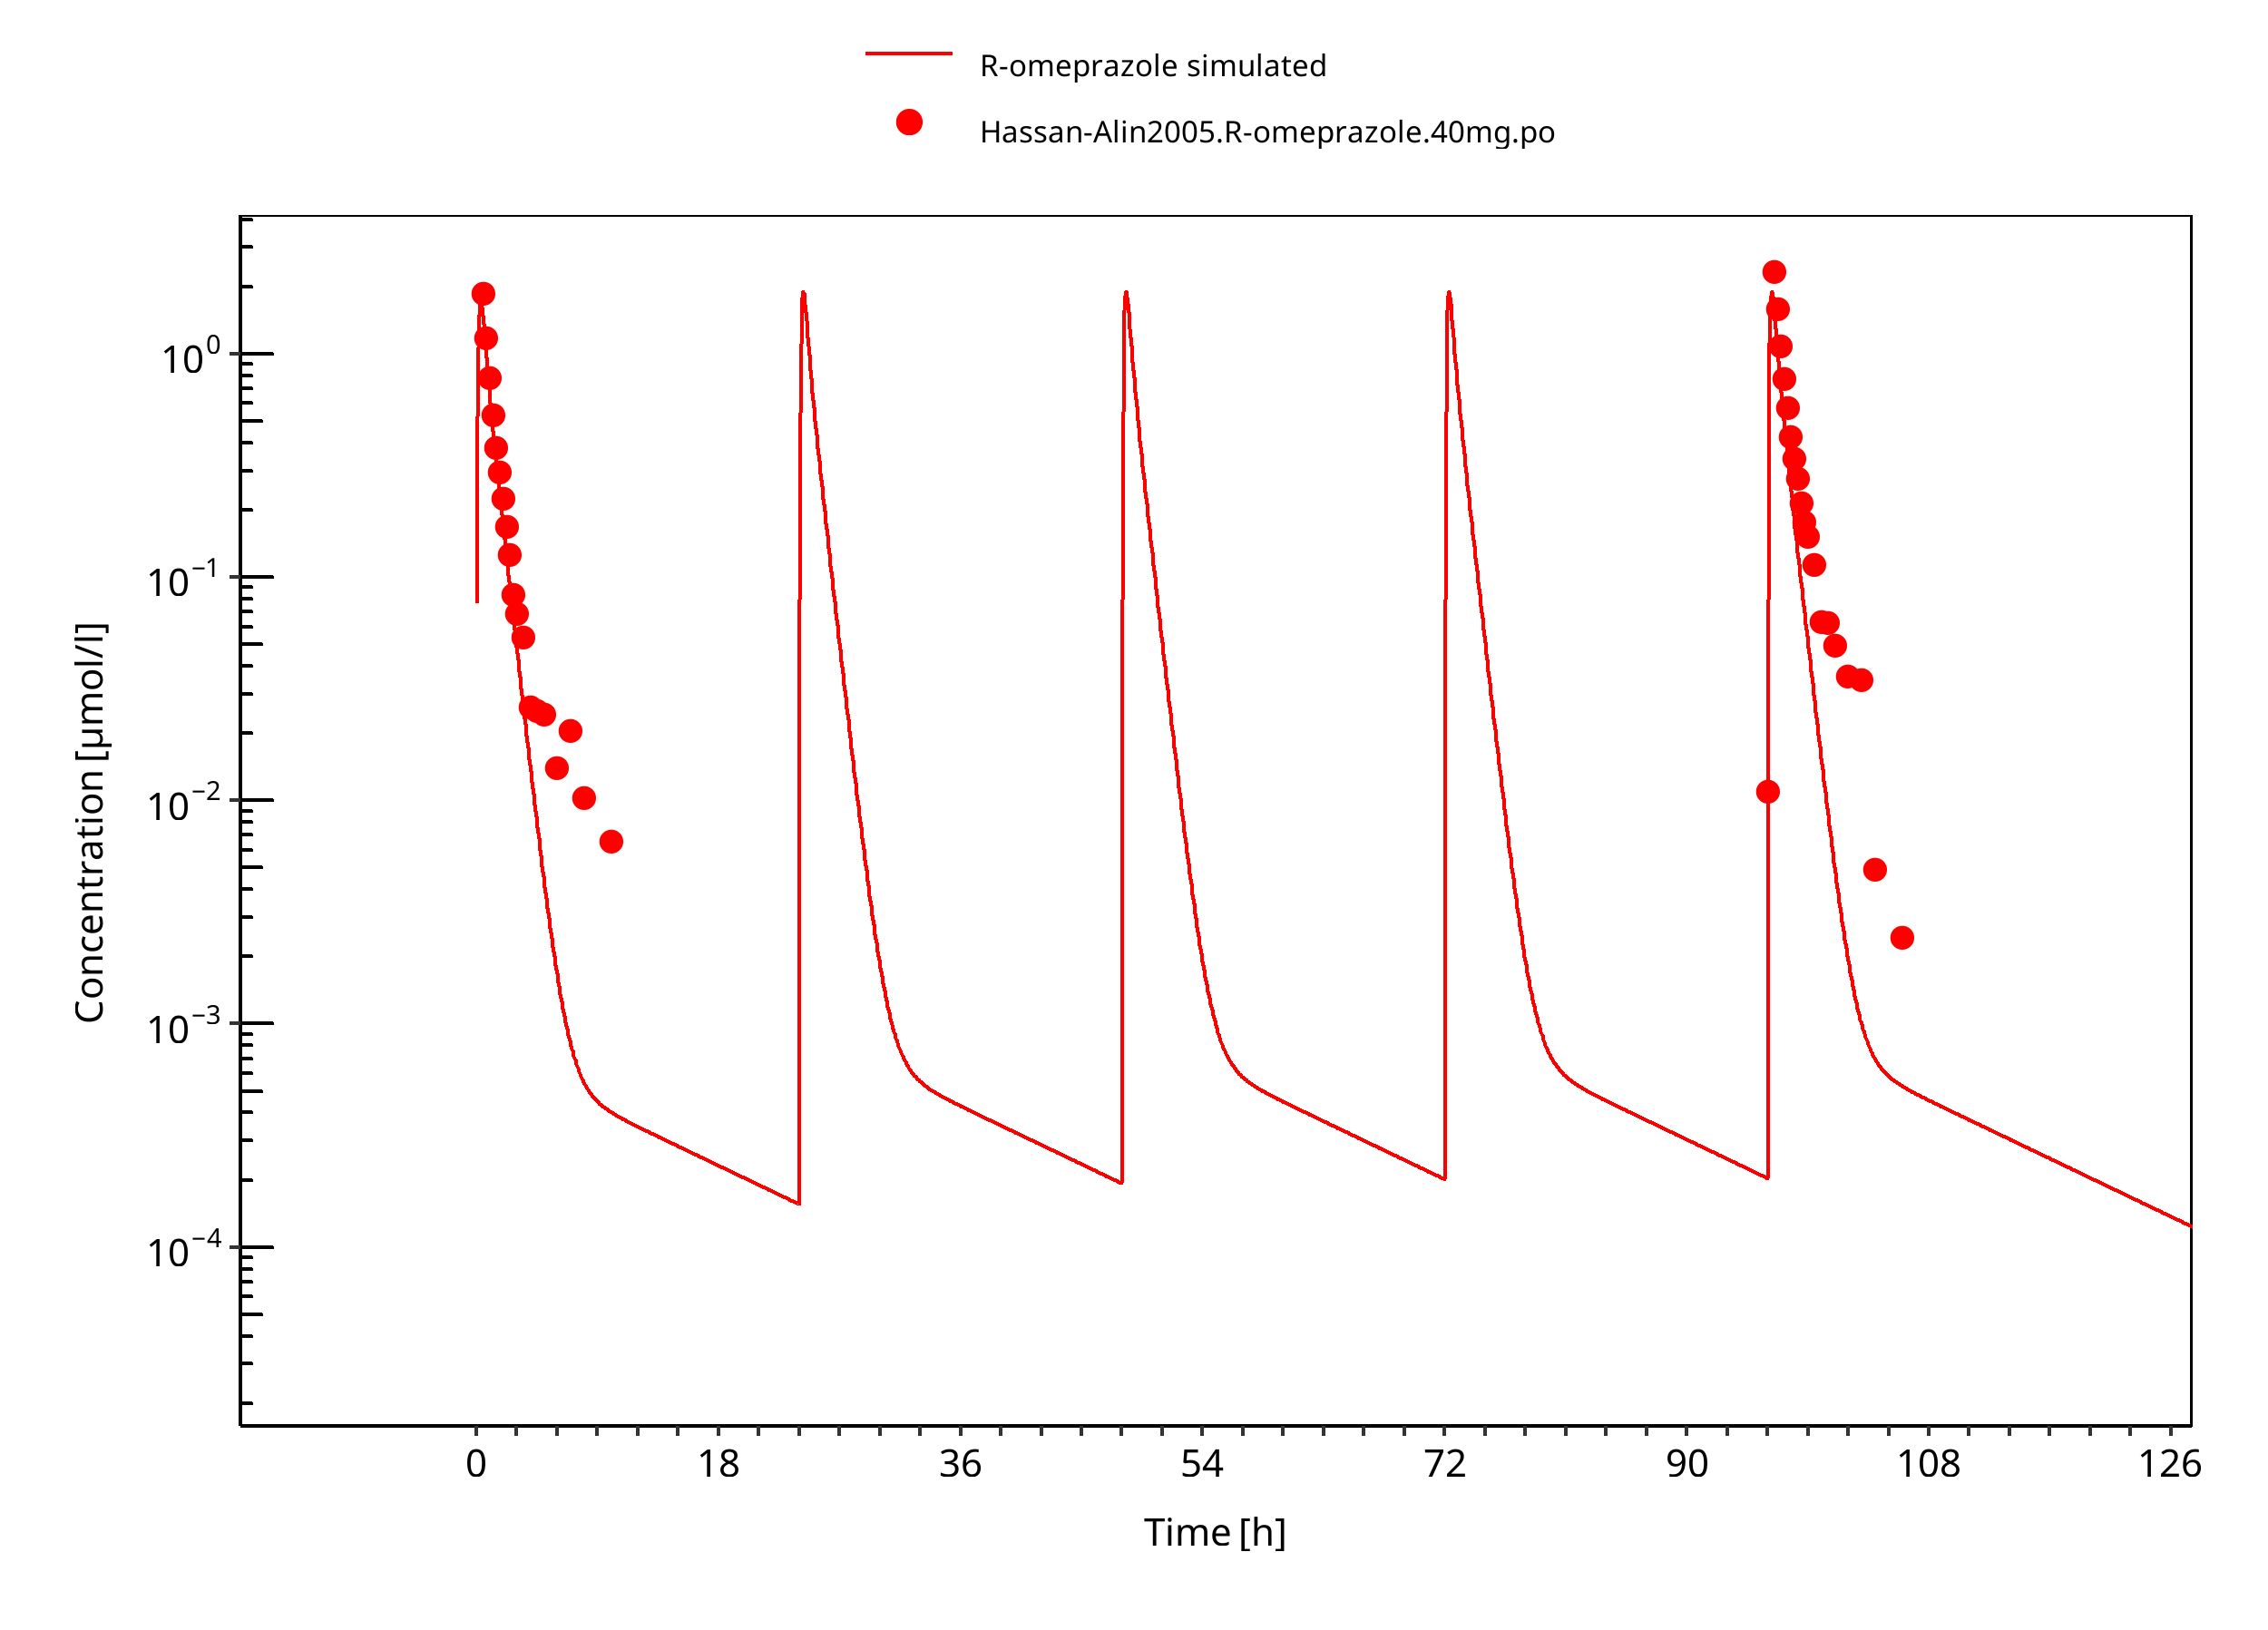
Figure 3-19: 40 mg R-omeprazole oral solution
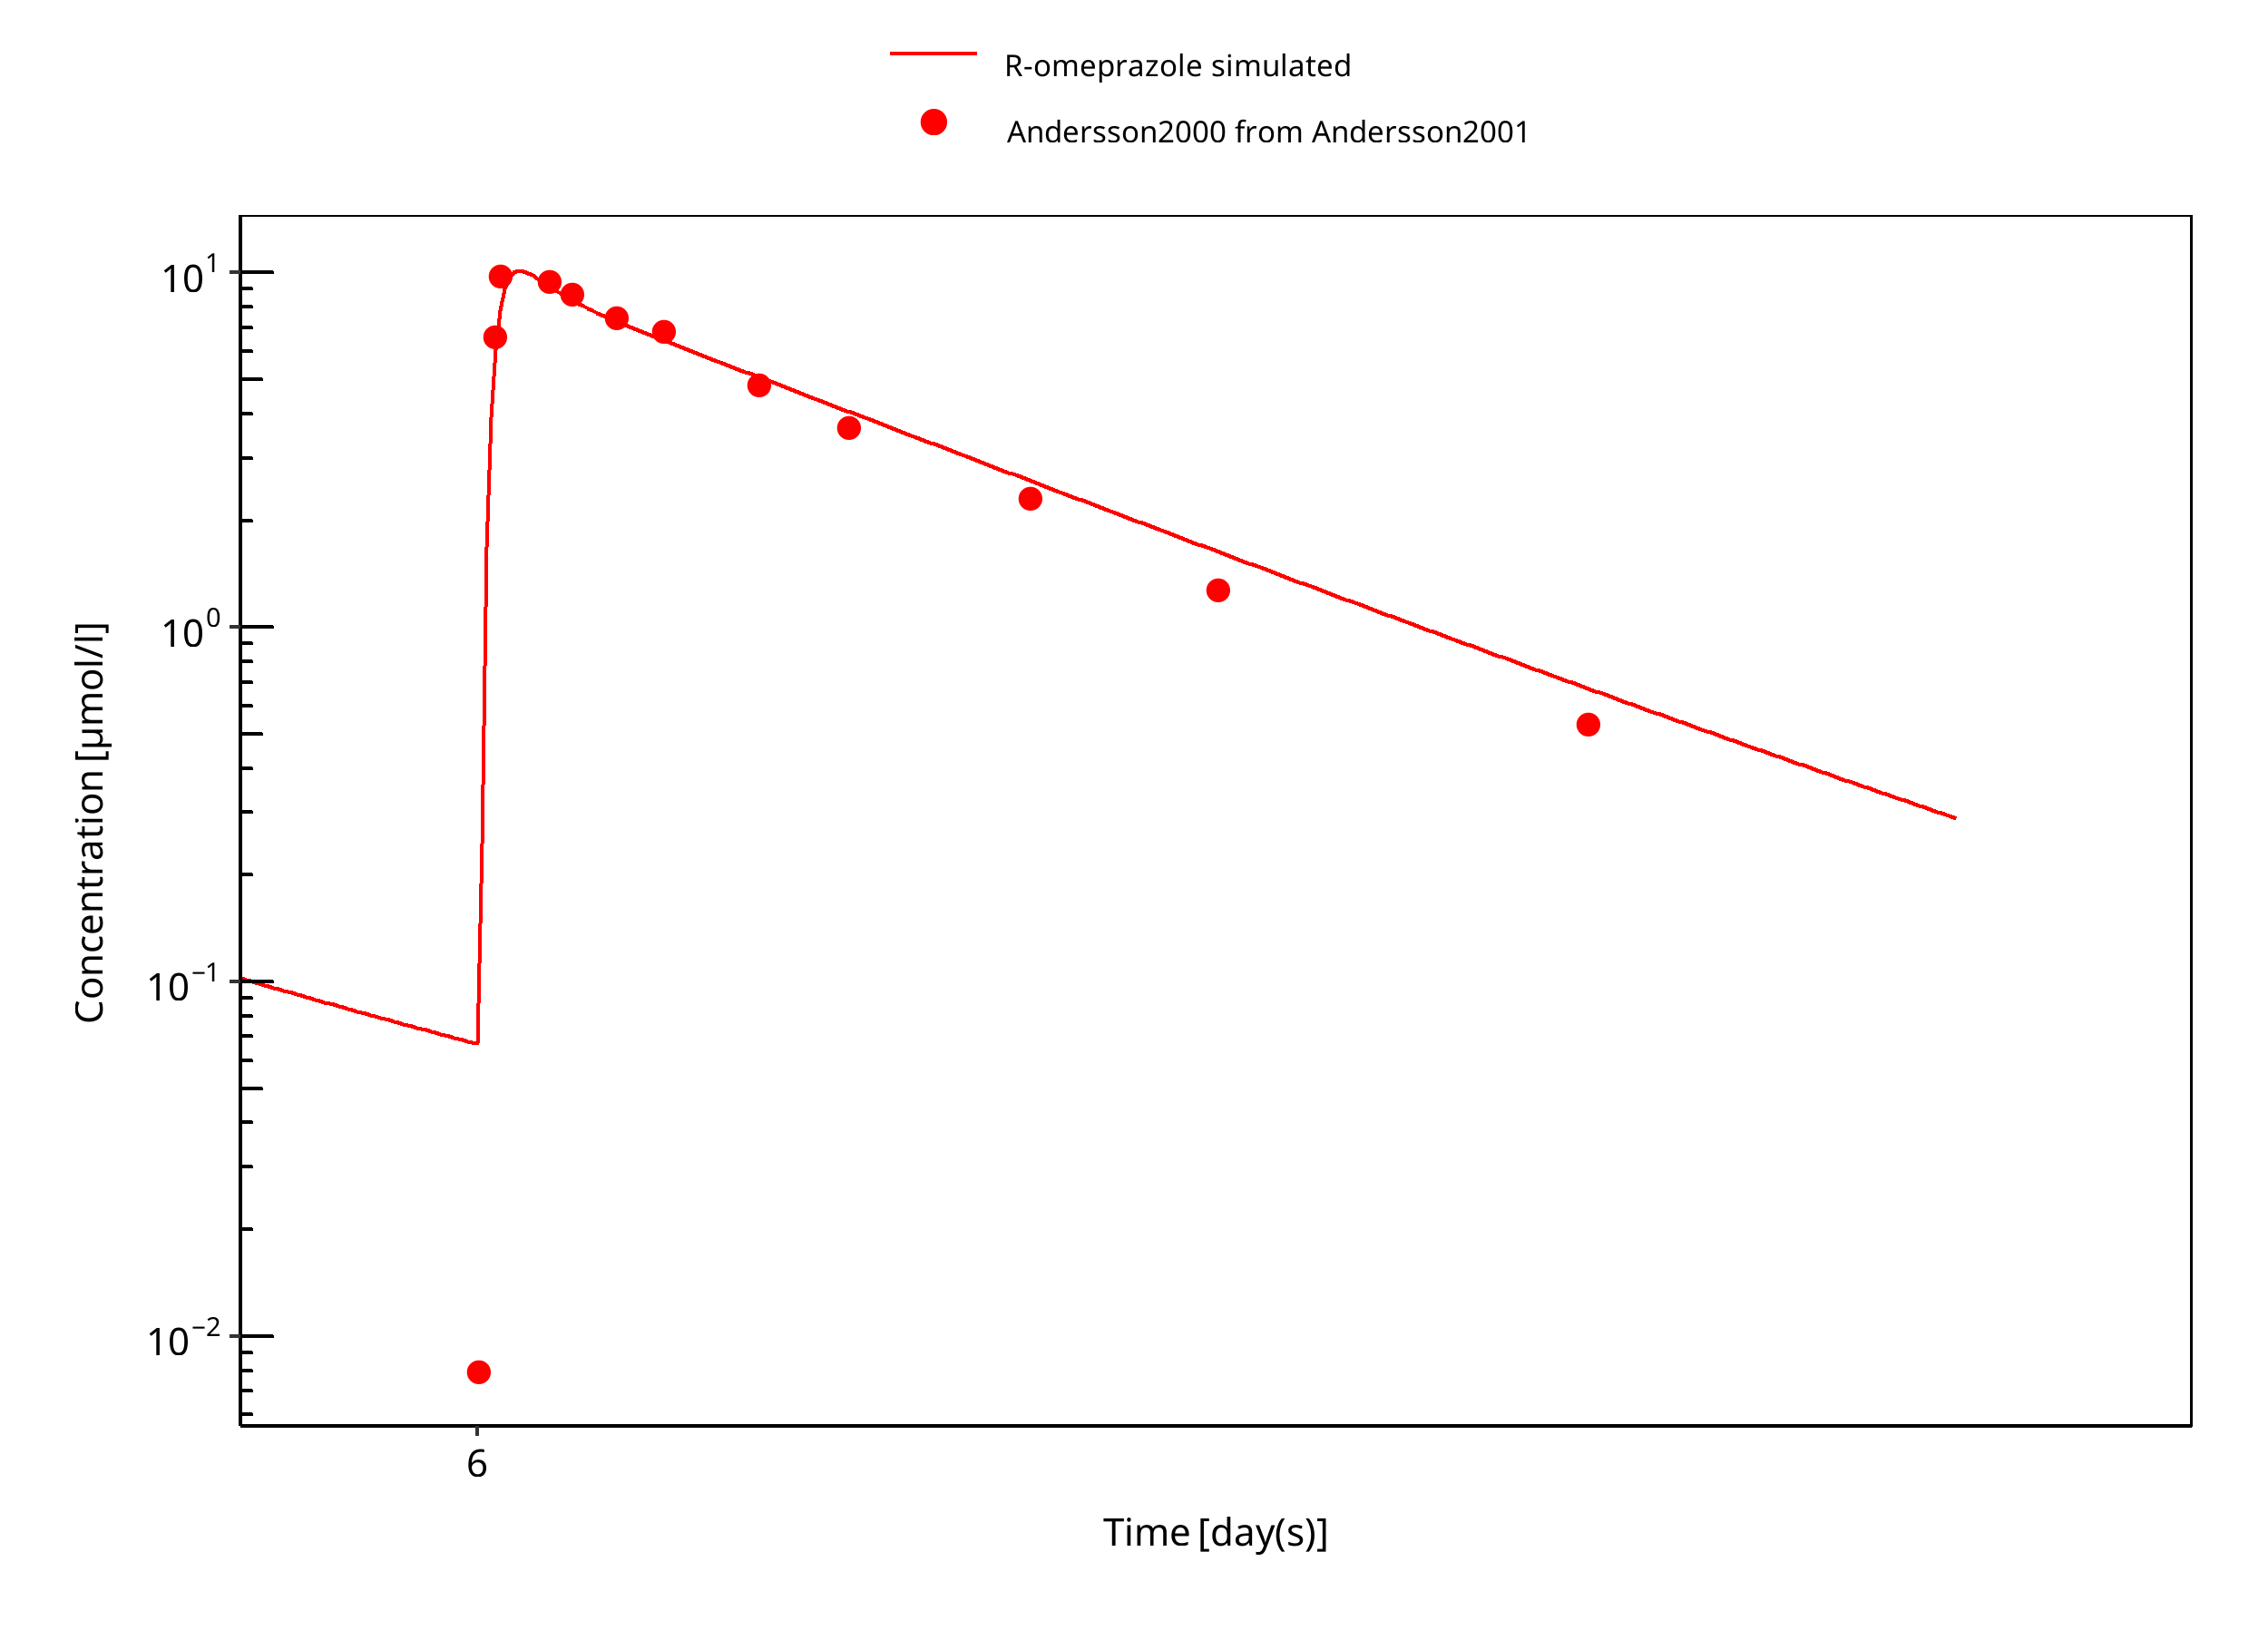
Figure 3-20: 60 mg R-omeprazole oral solution EM day 6
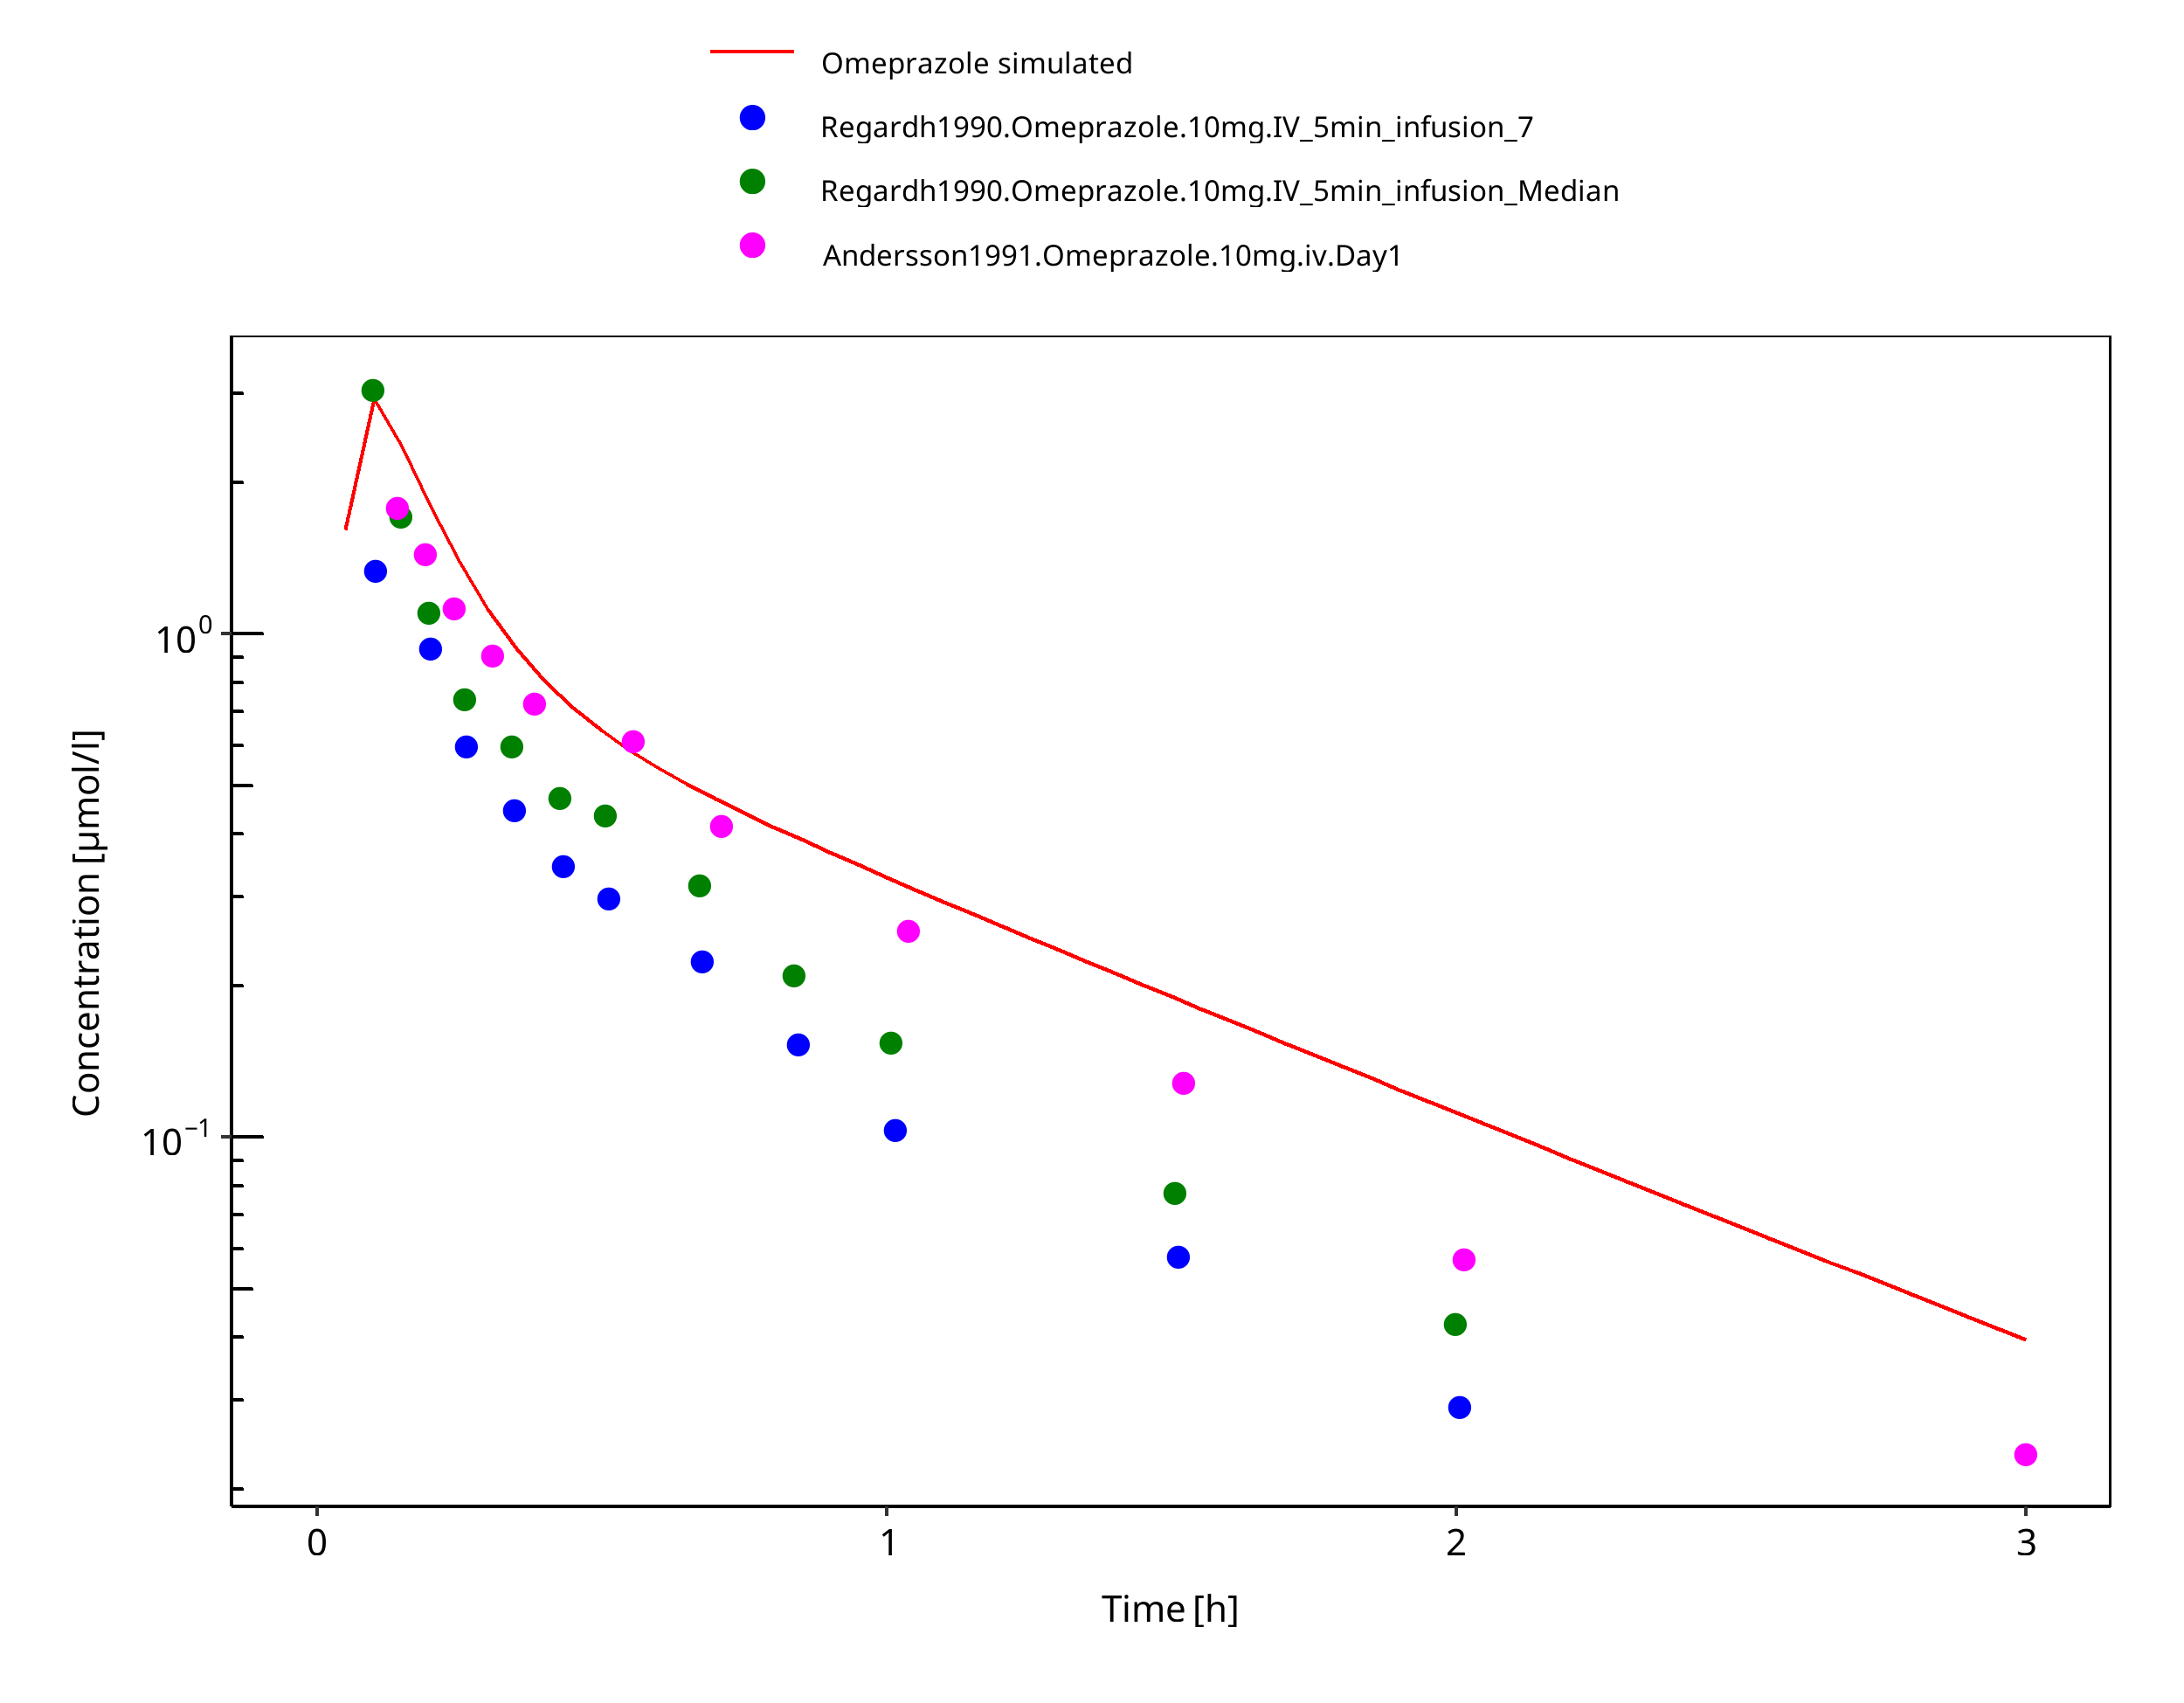
Figure 3-21: 10 mg omeprazole iv
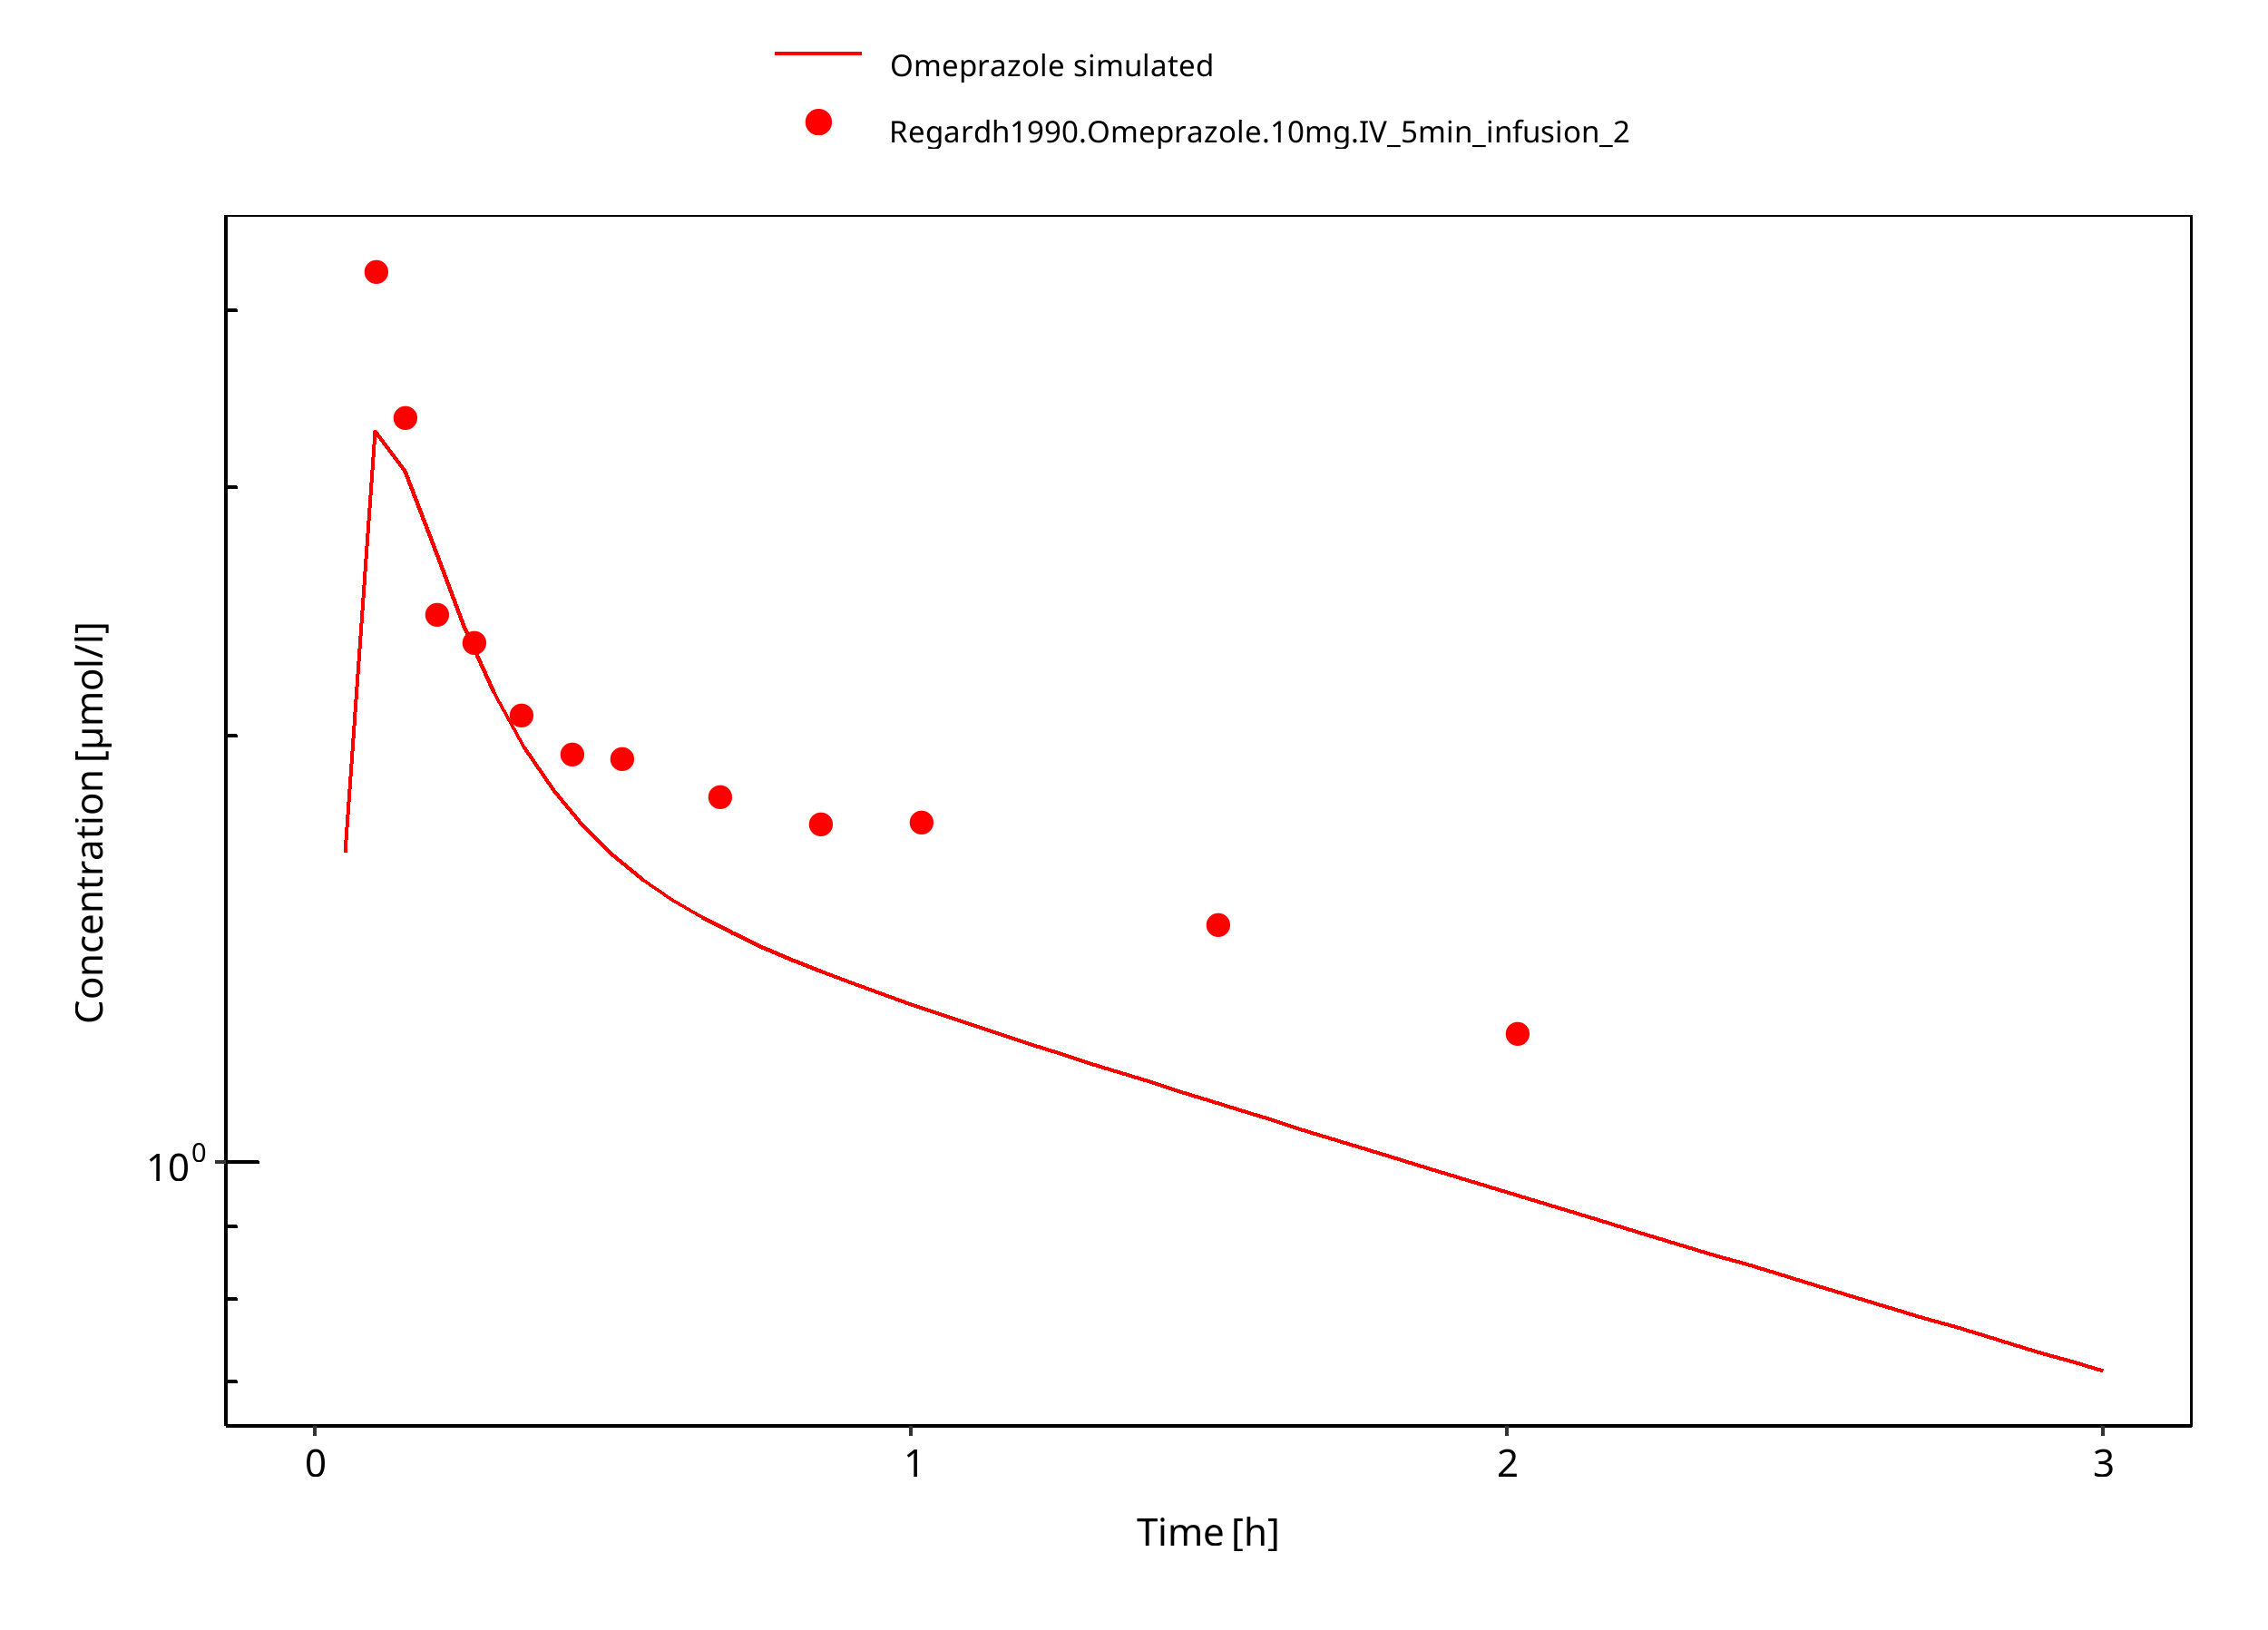
Figure 3-22: 10 mg omeprazole iv PM
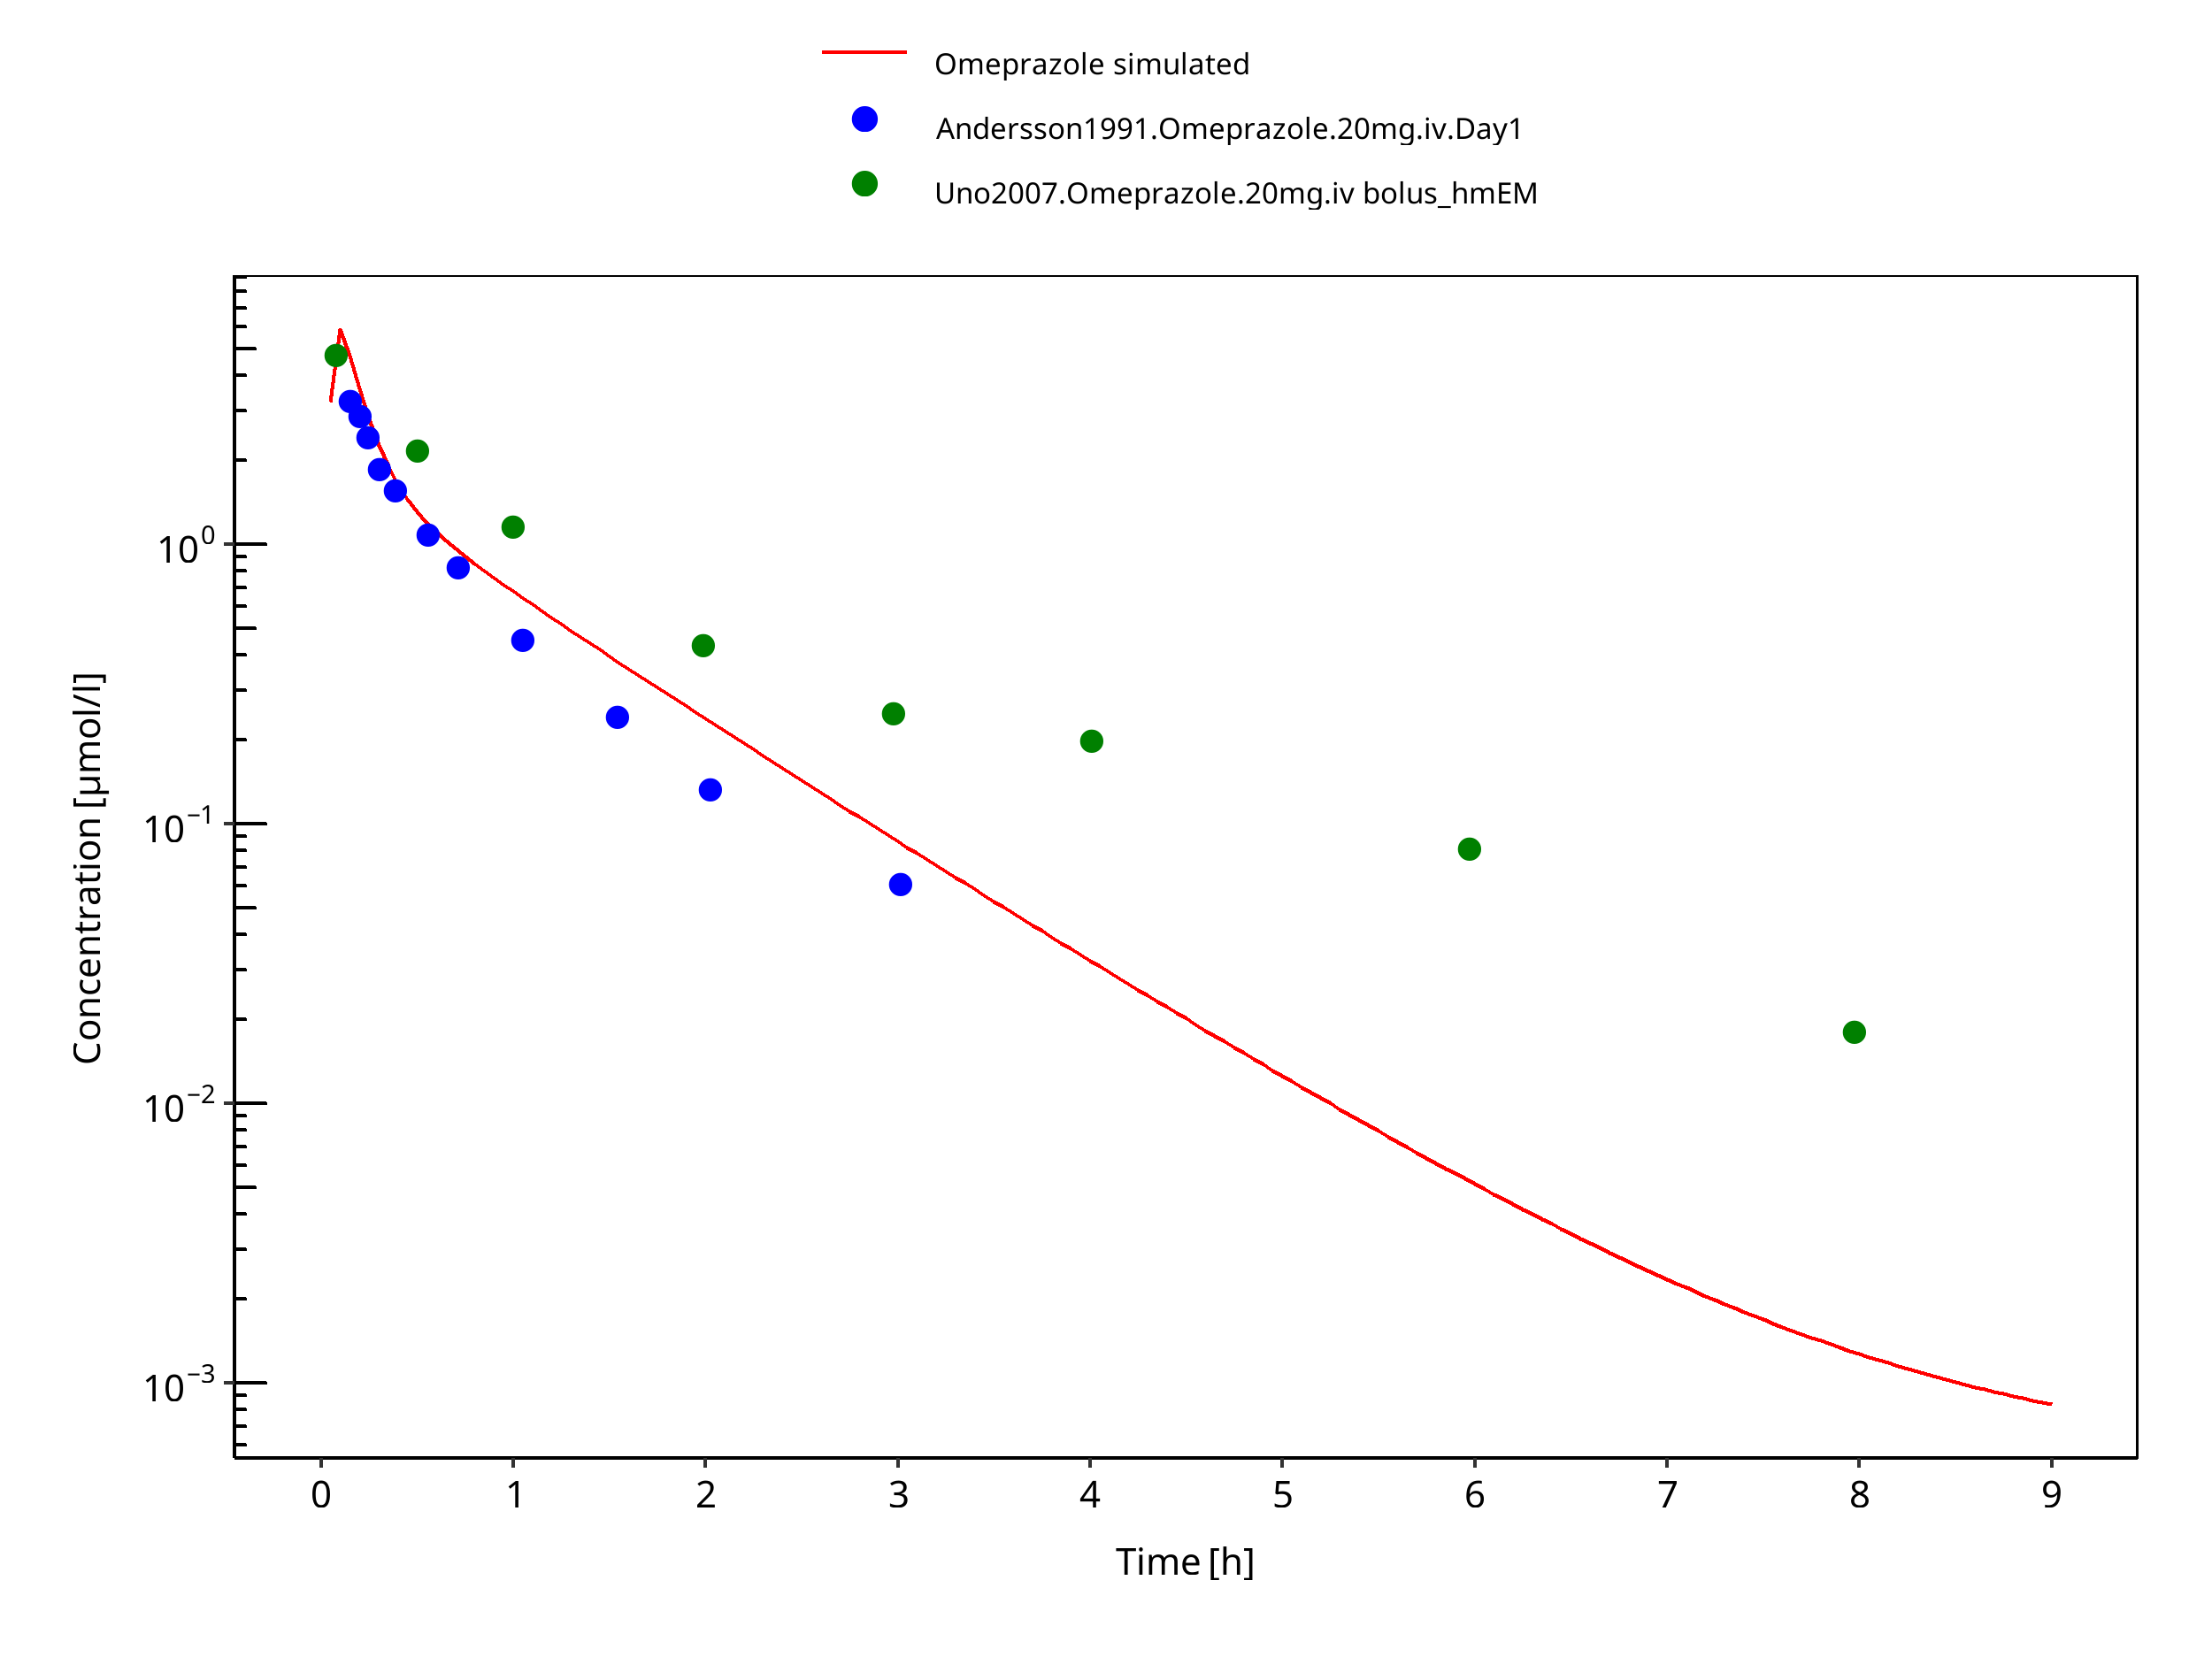
Figure 3-23: 20 mg omeprazole iv
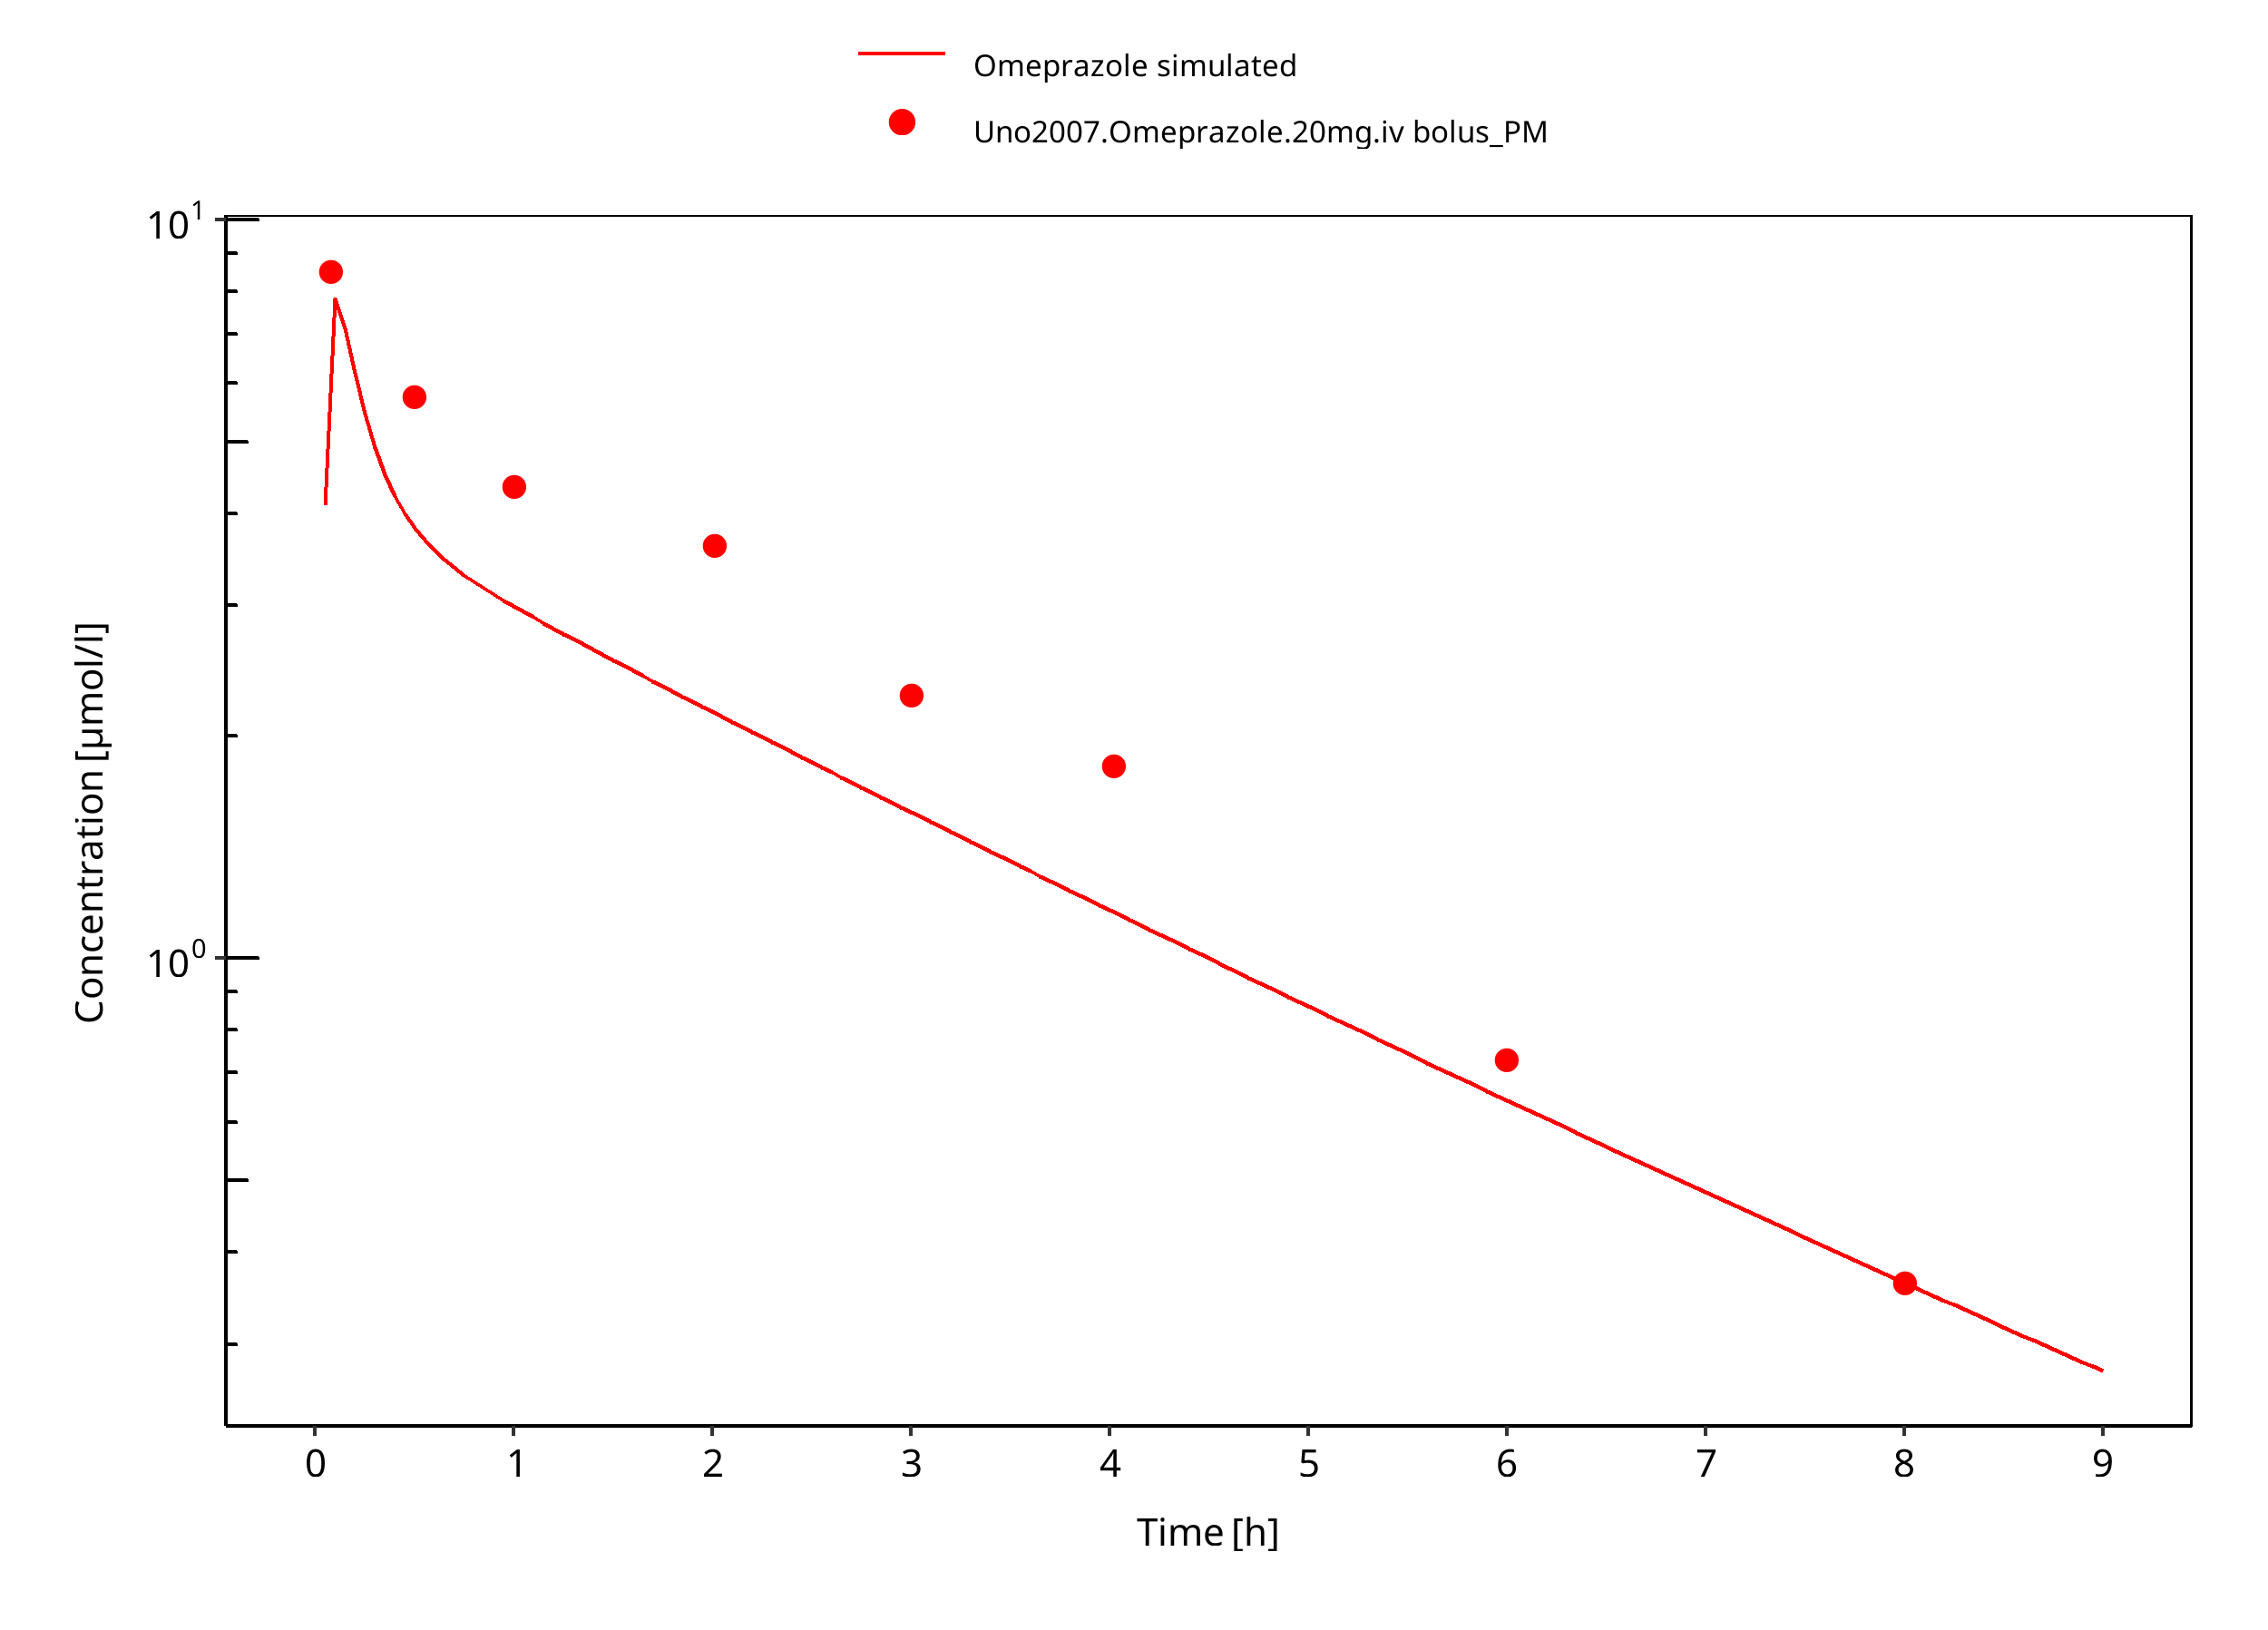
Figure 3-24: 20 mg omeprazole iv PM
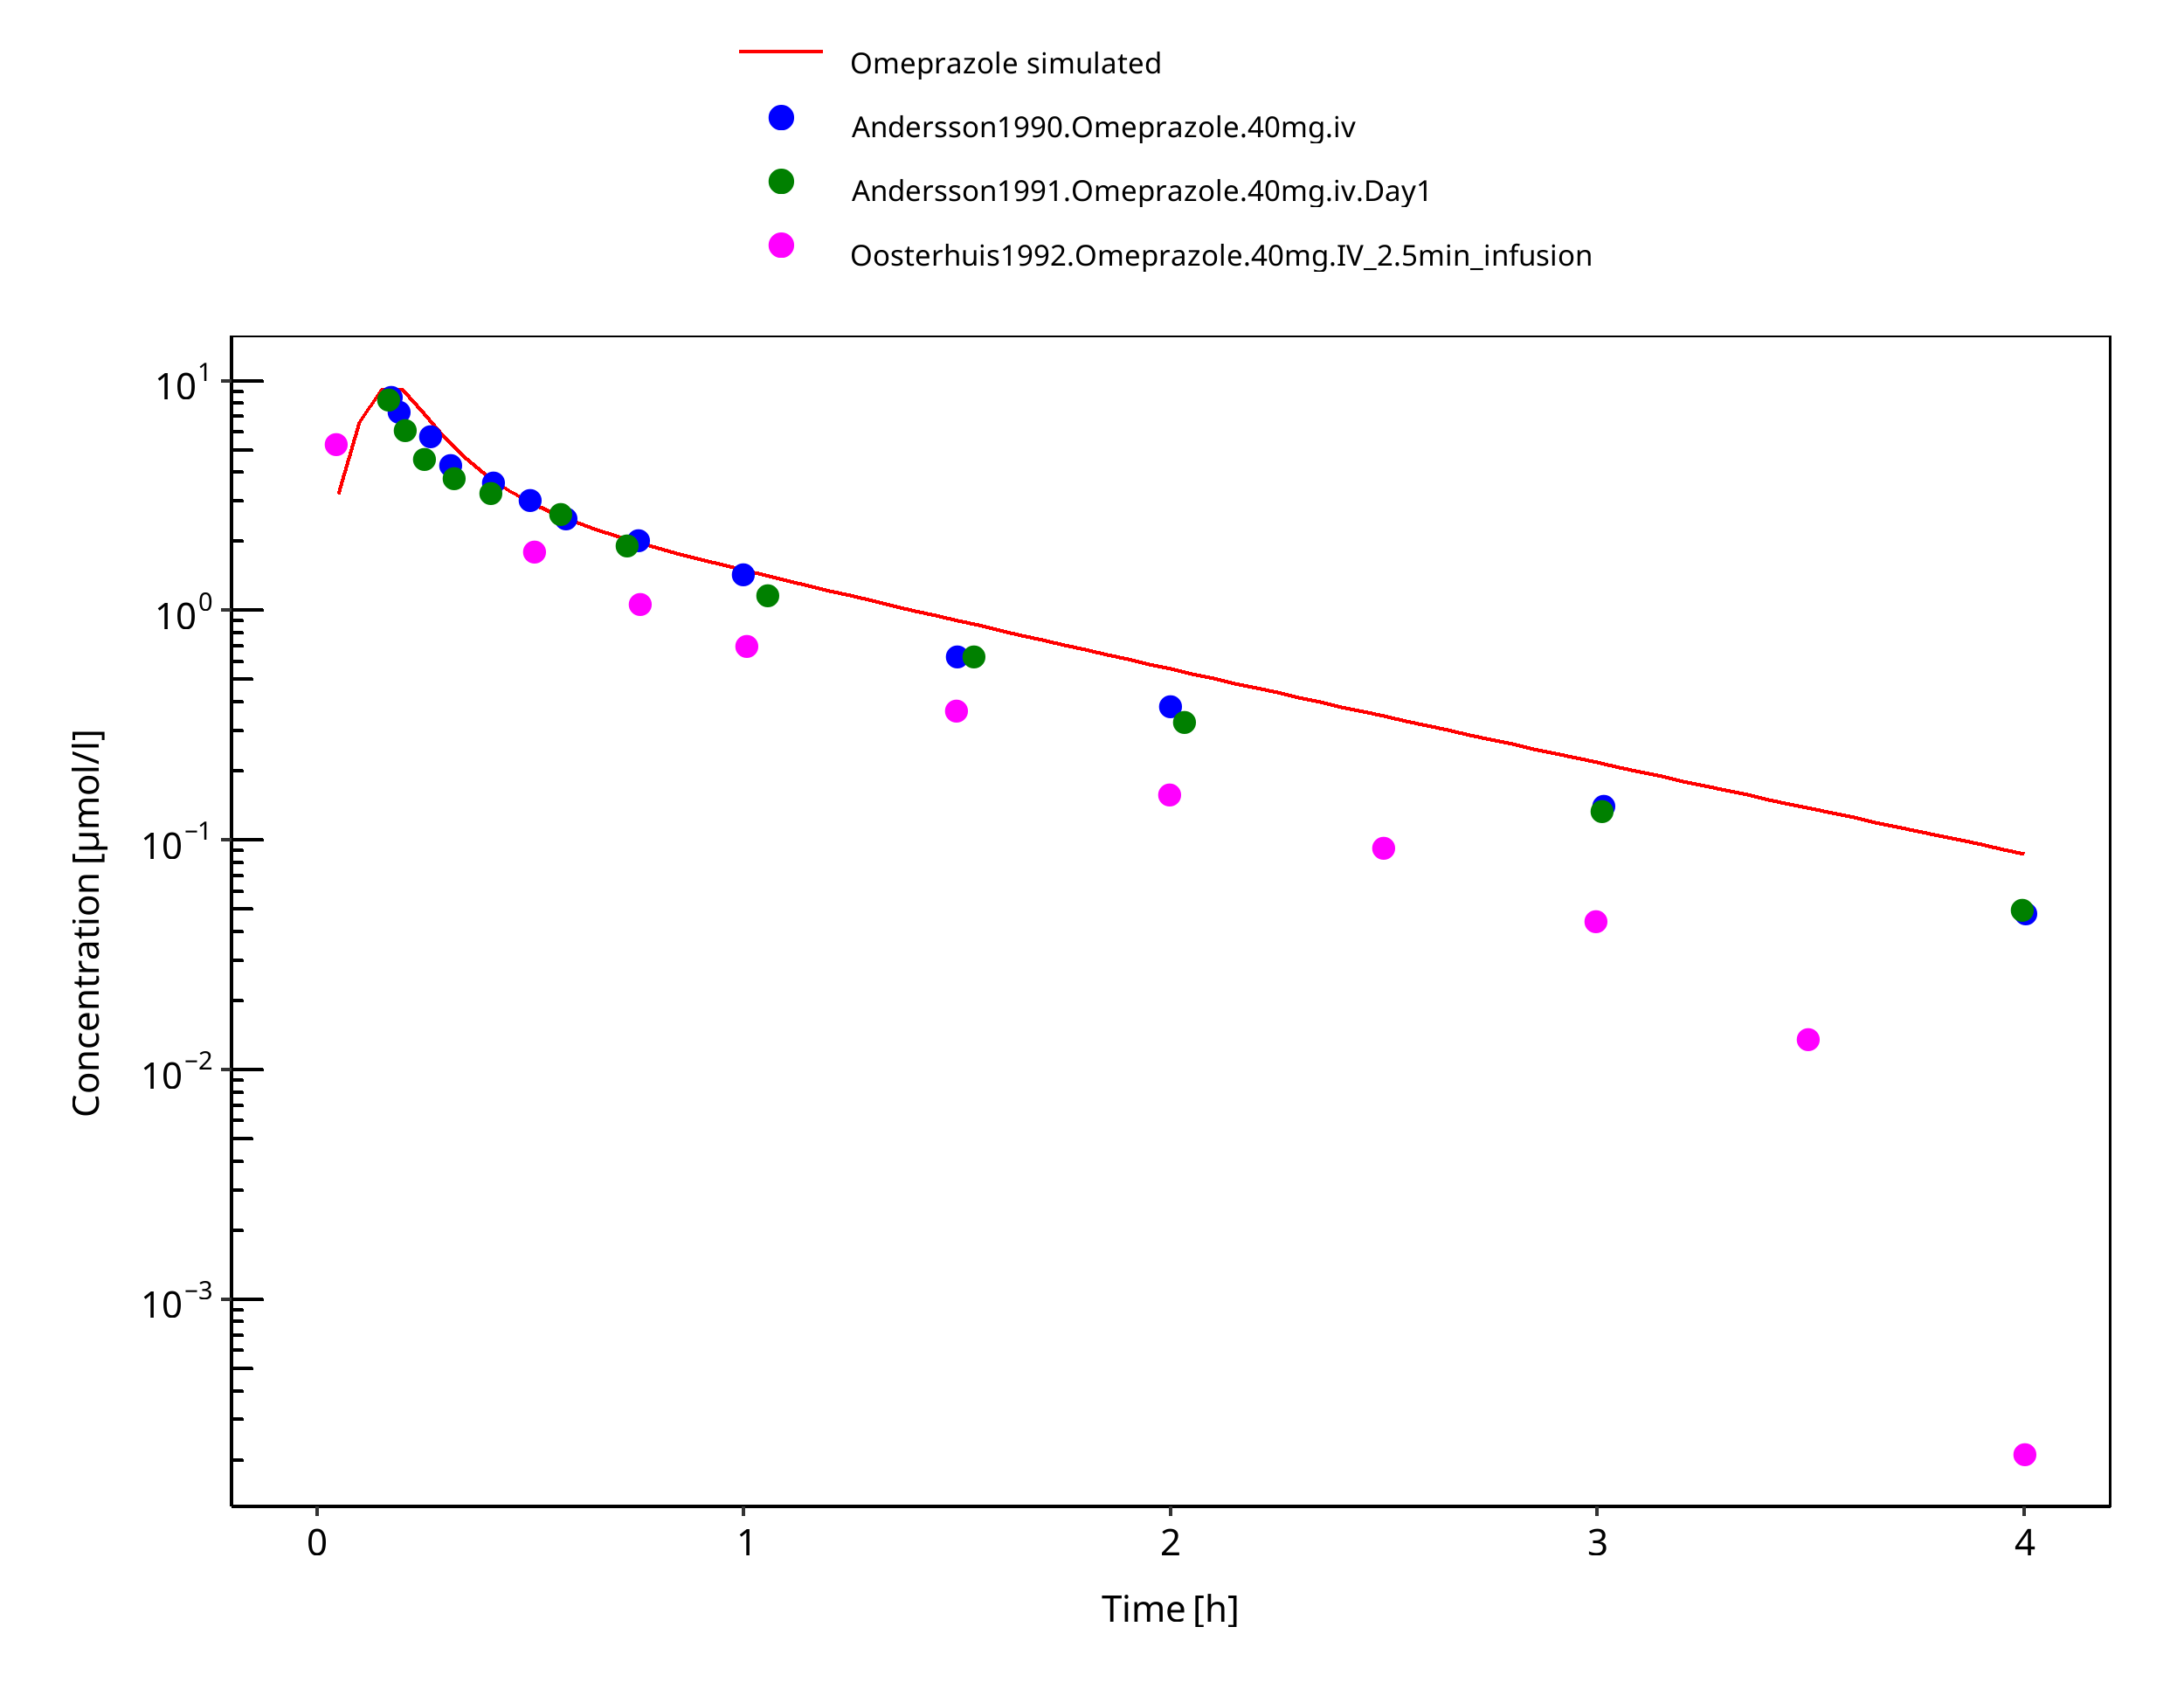
Figure 3-25: 40 mg omeprazole iv
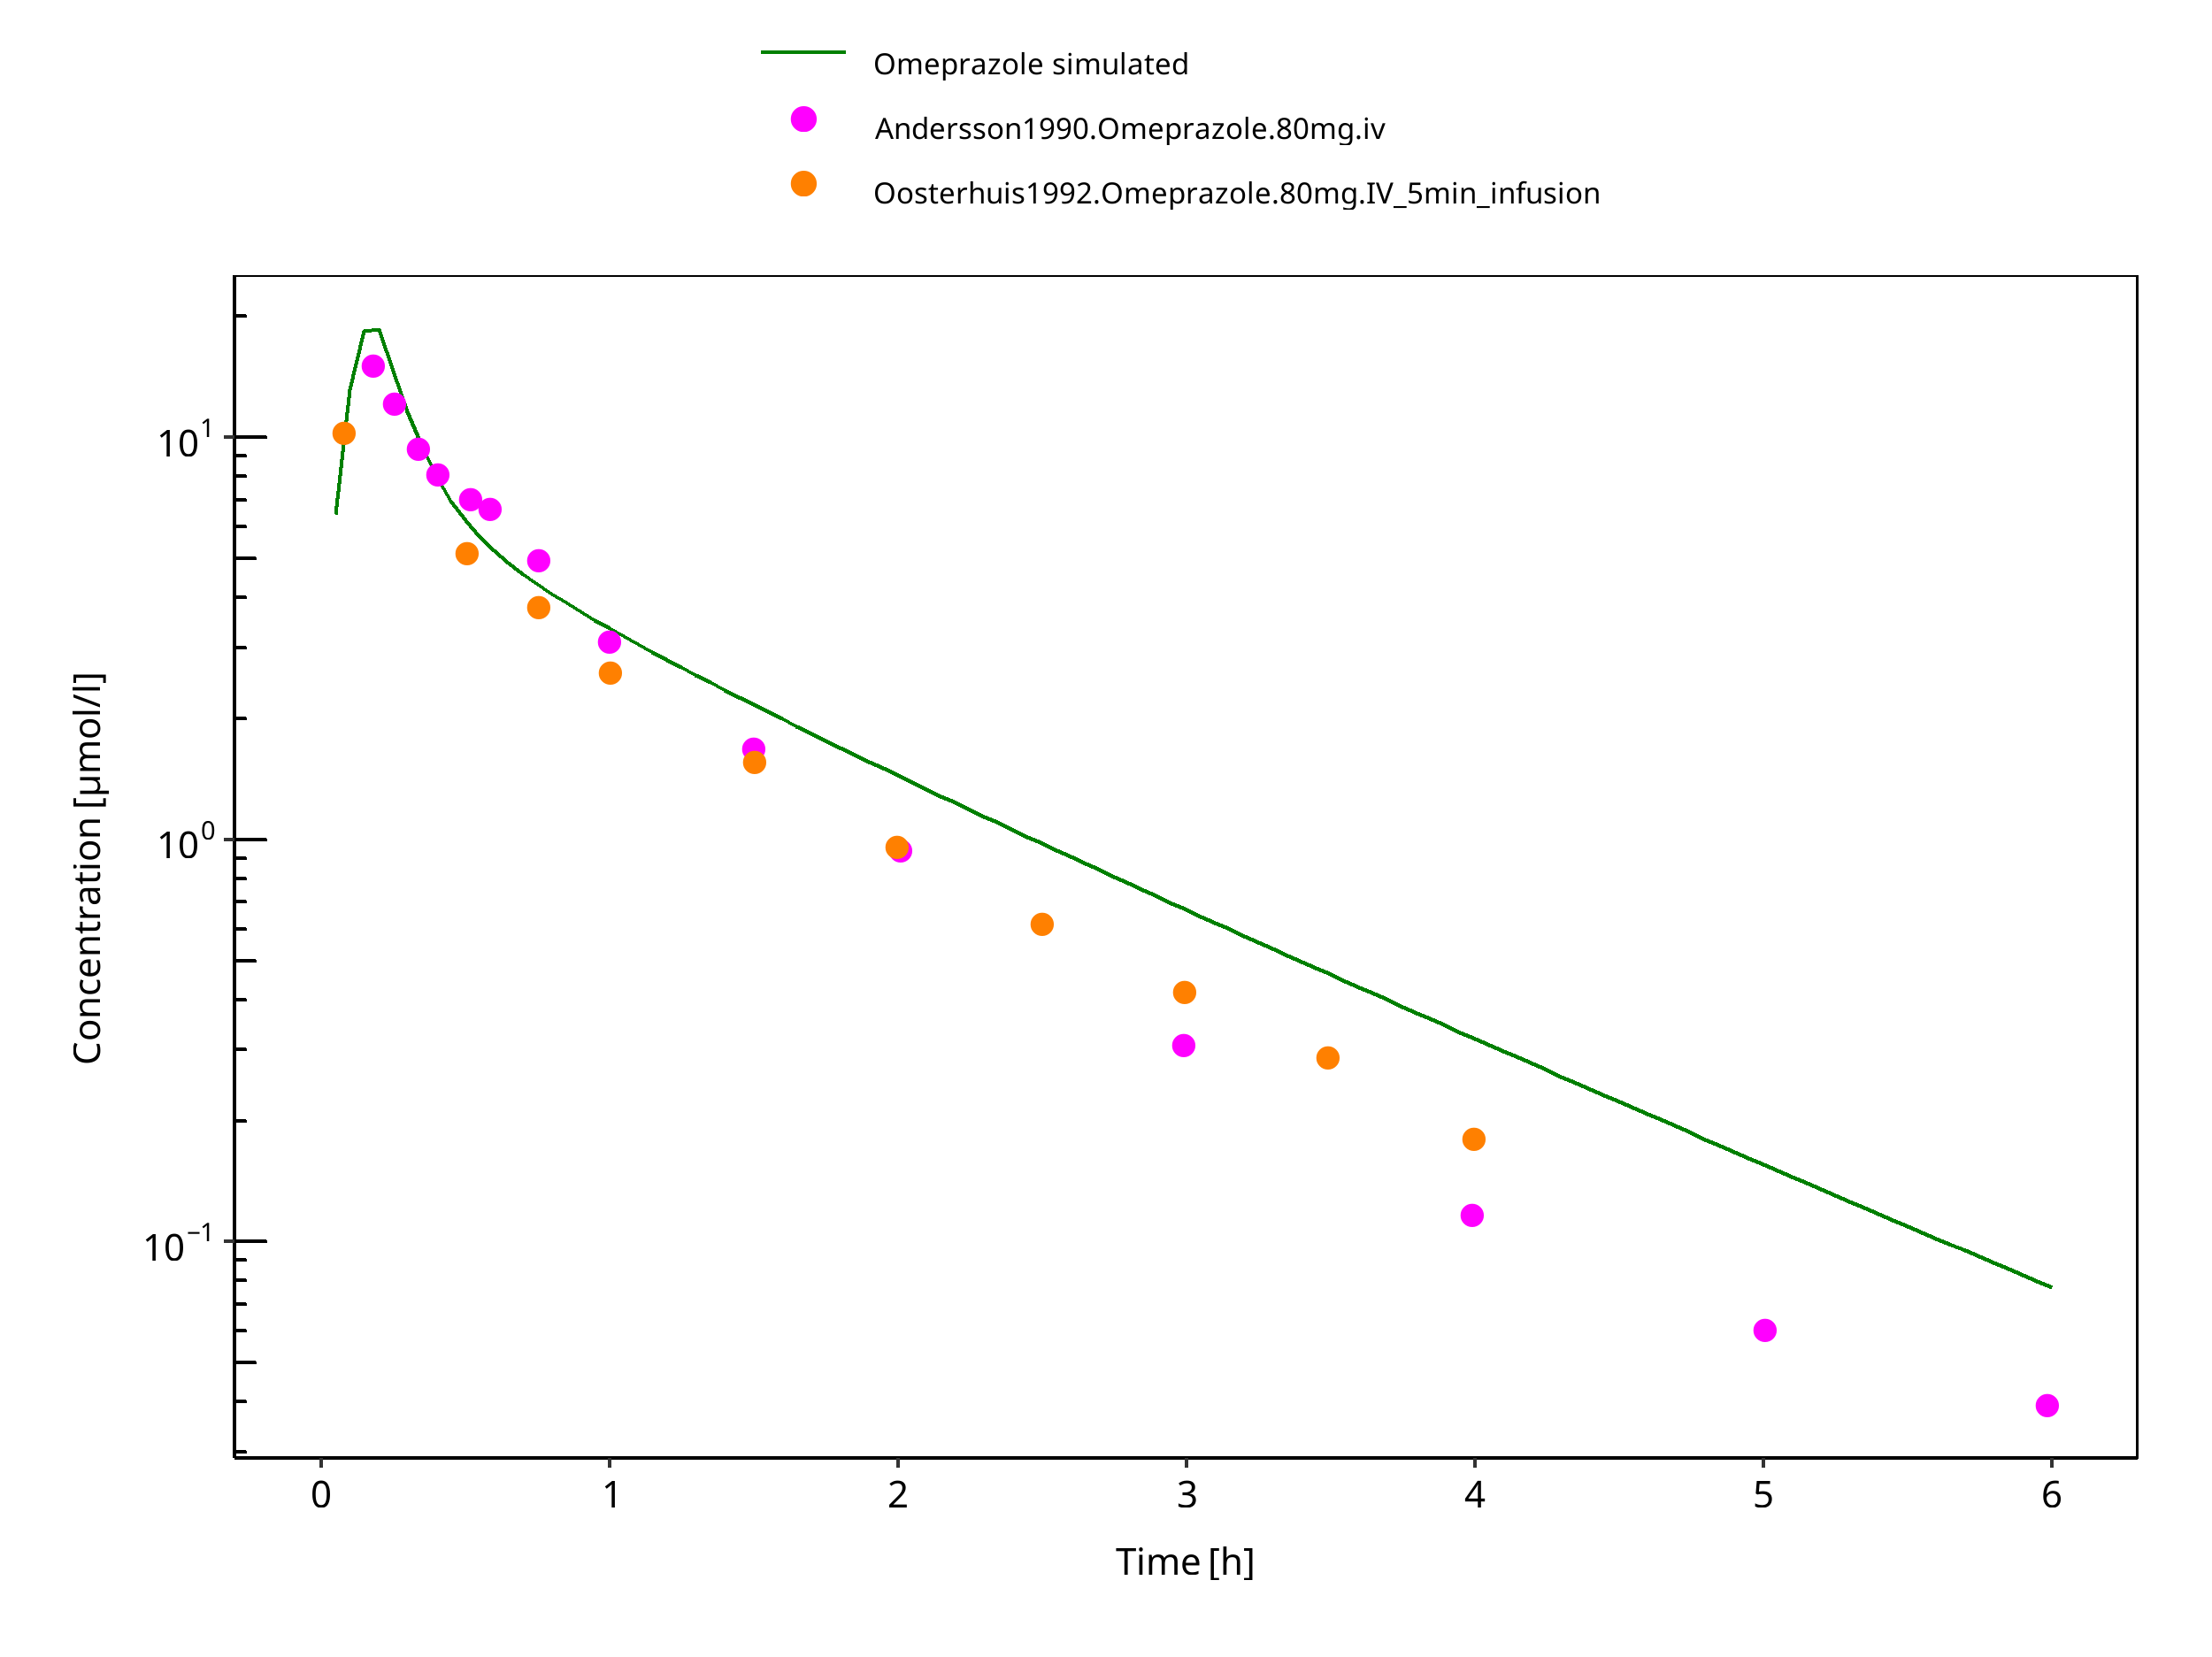
Figure 3-26: 80 mg omeprazole iv
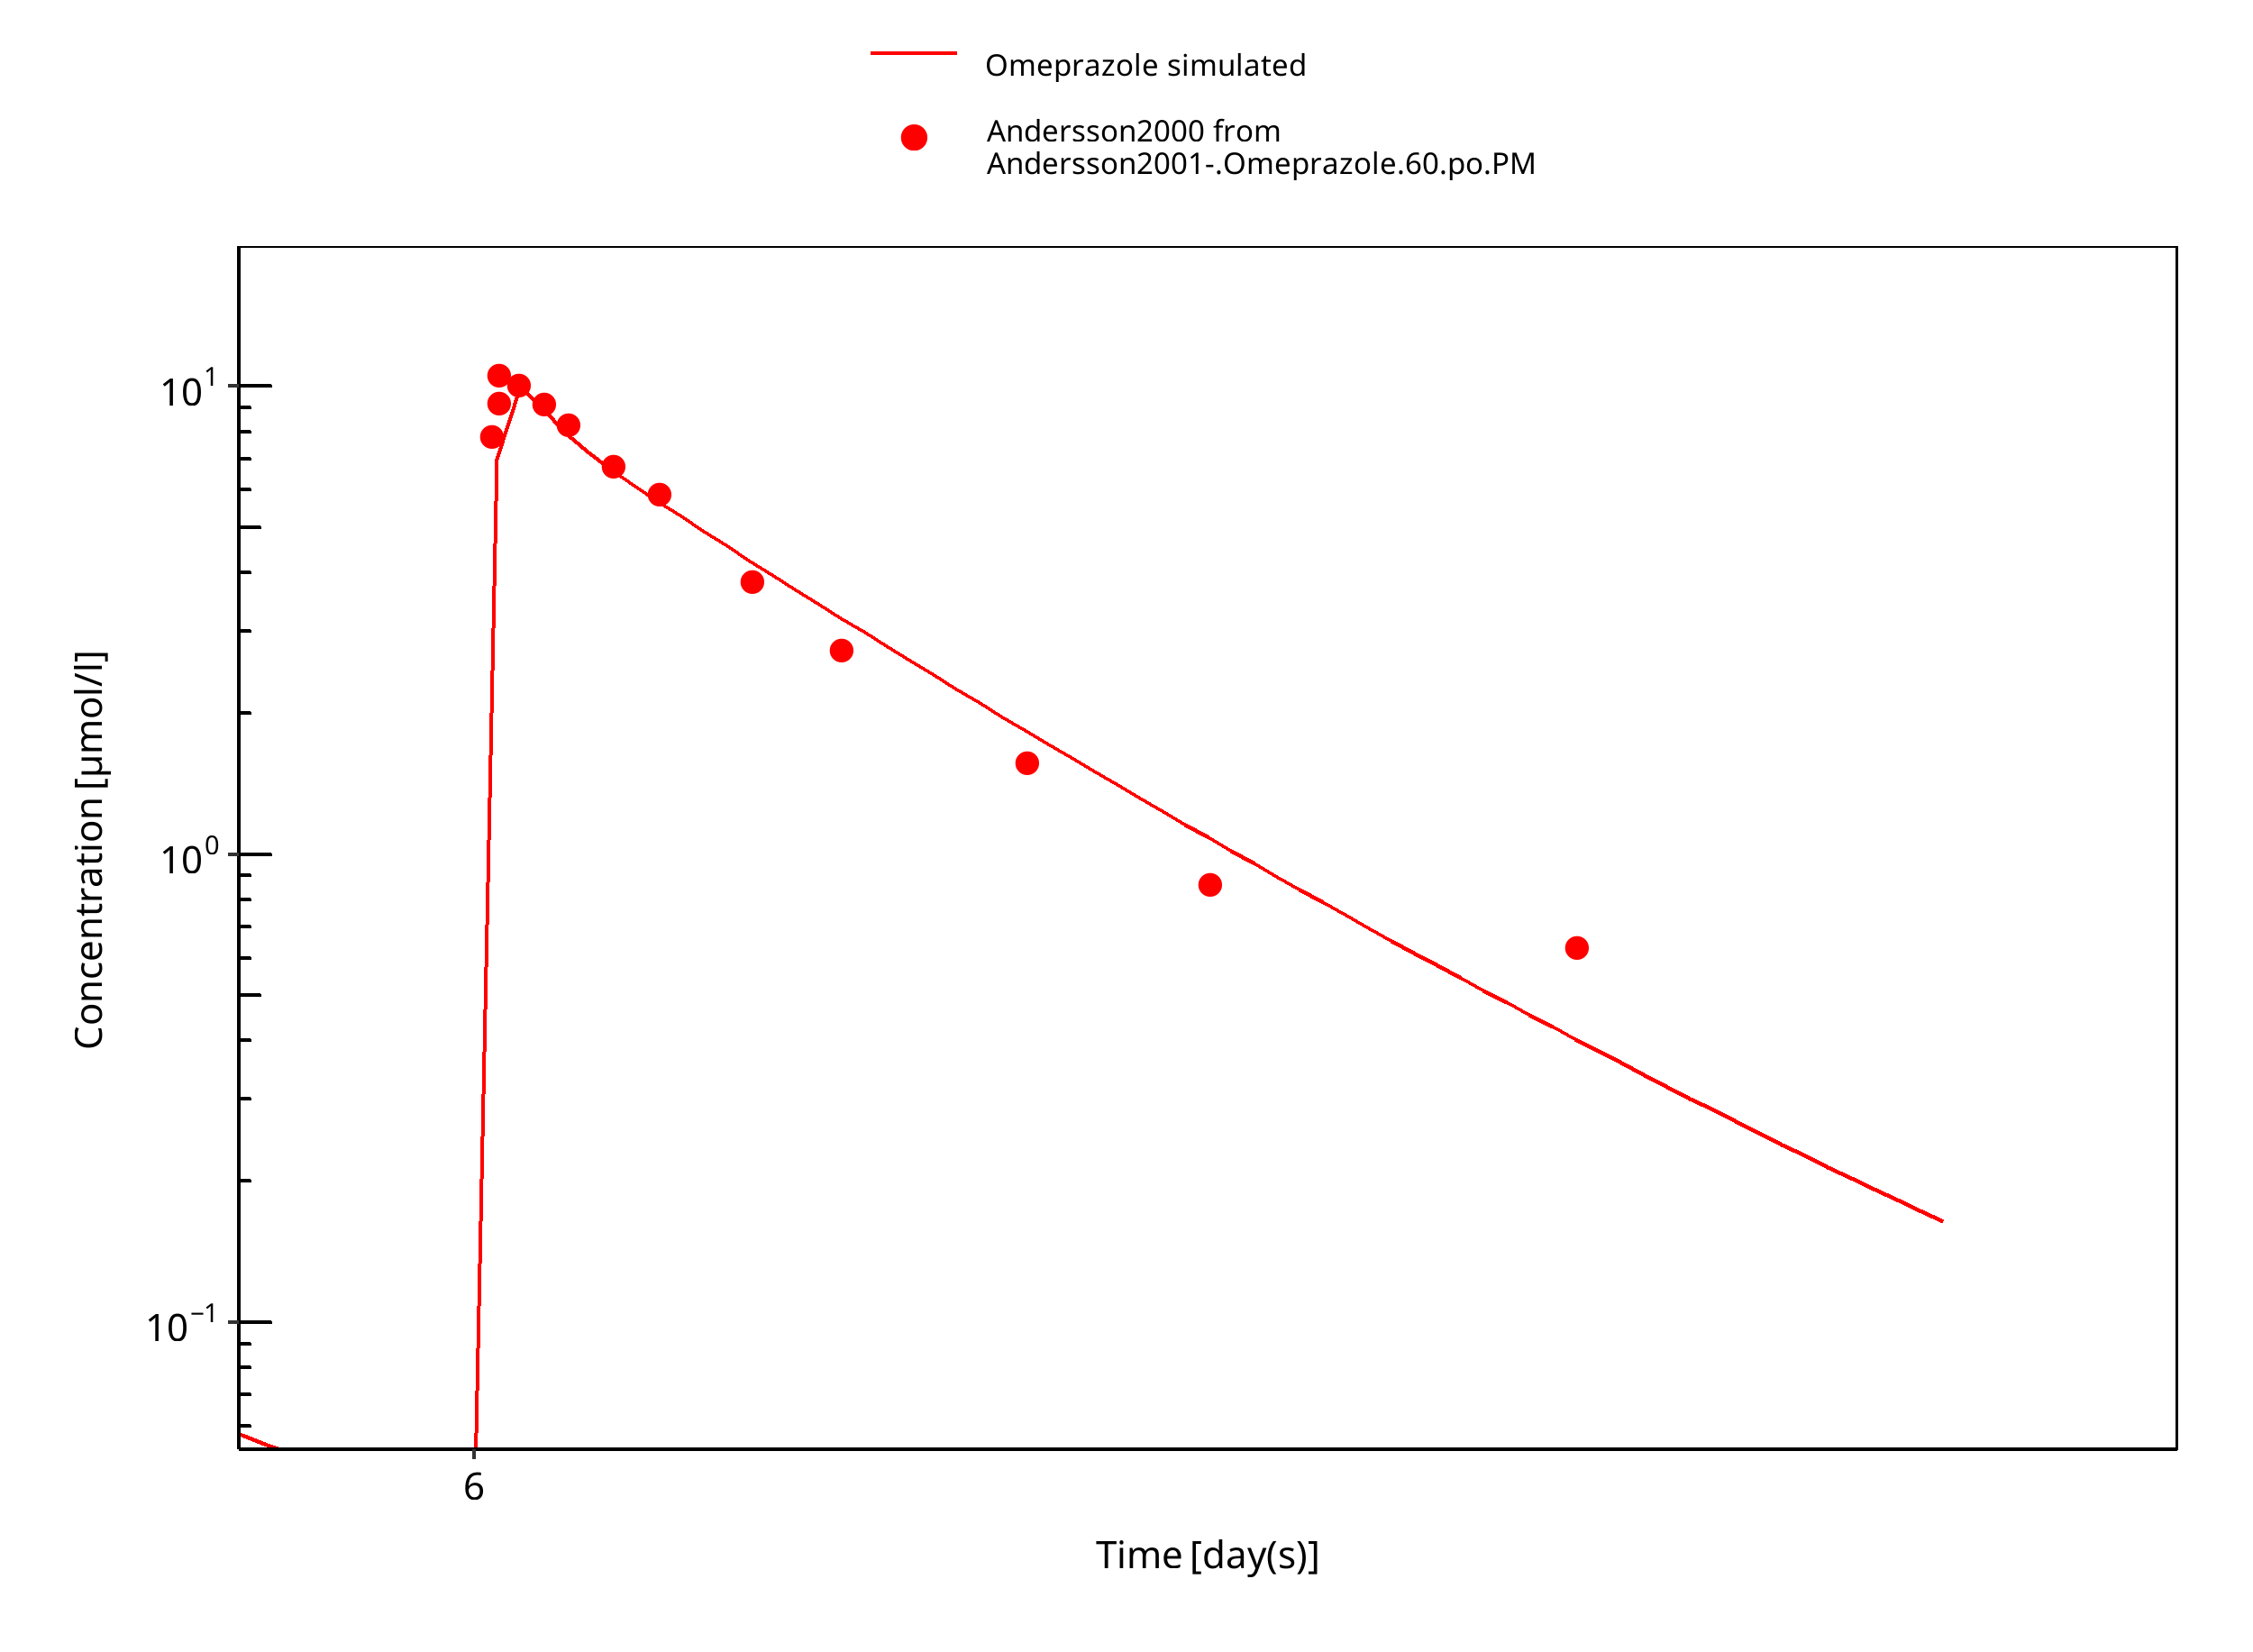
Figure 3-27: 60 mg omeprazole oral solution PM day 6
3.3.2 Model Verification
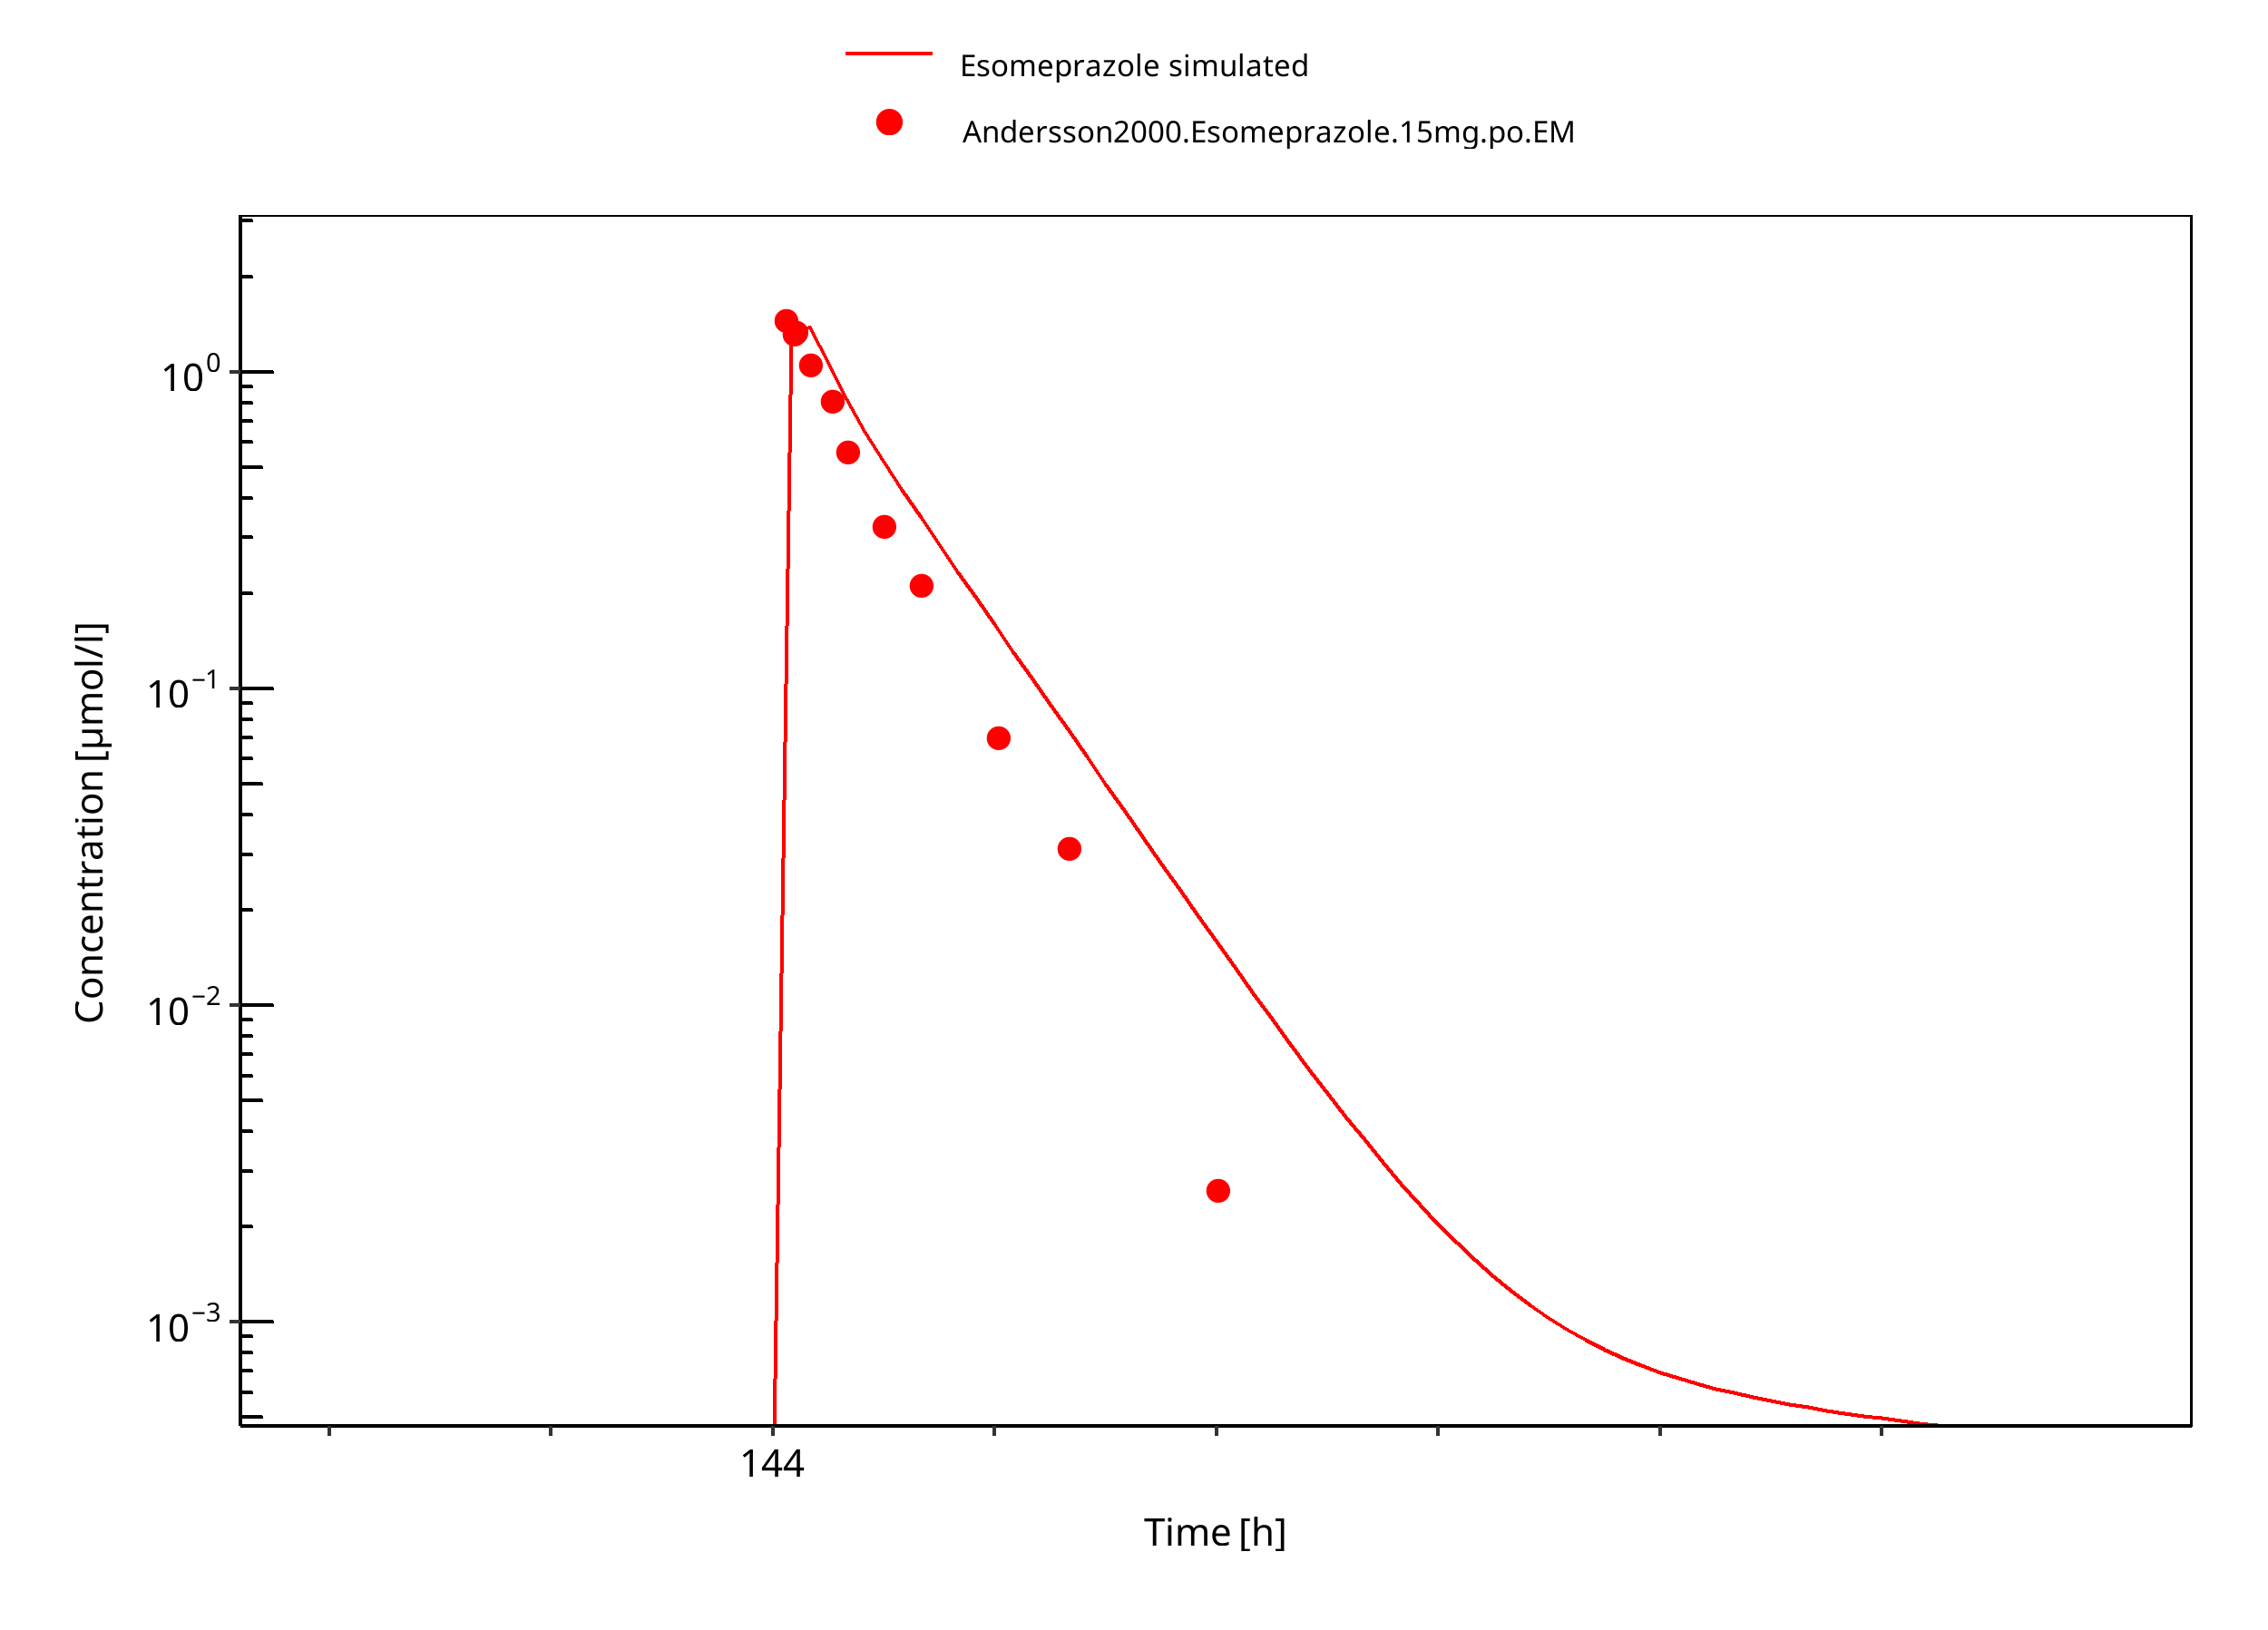
Figure 3-28: 15 mg S-omeprazole oral solution
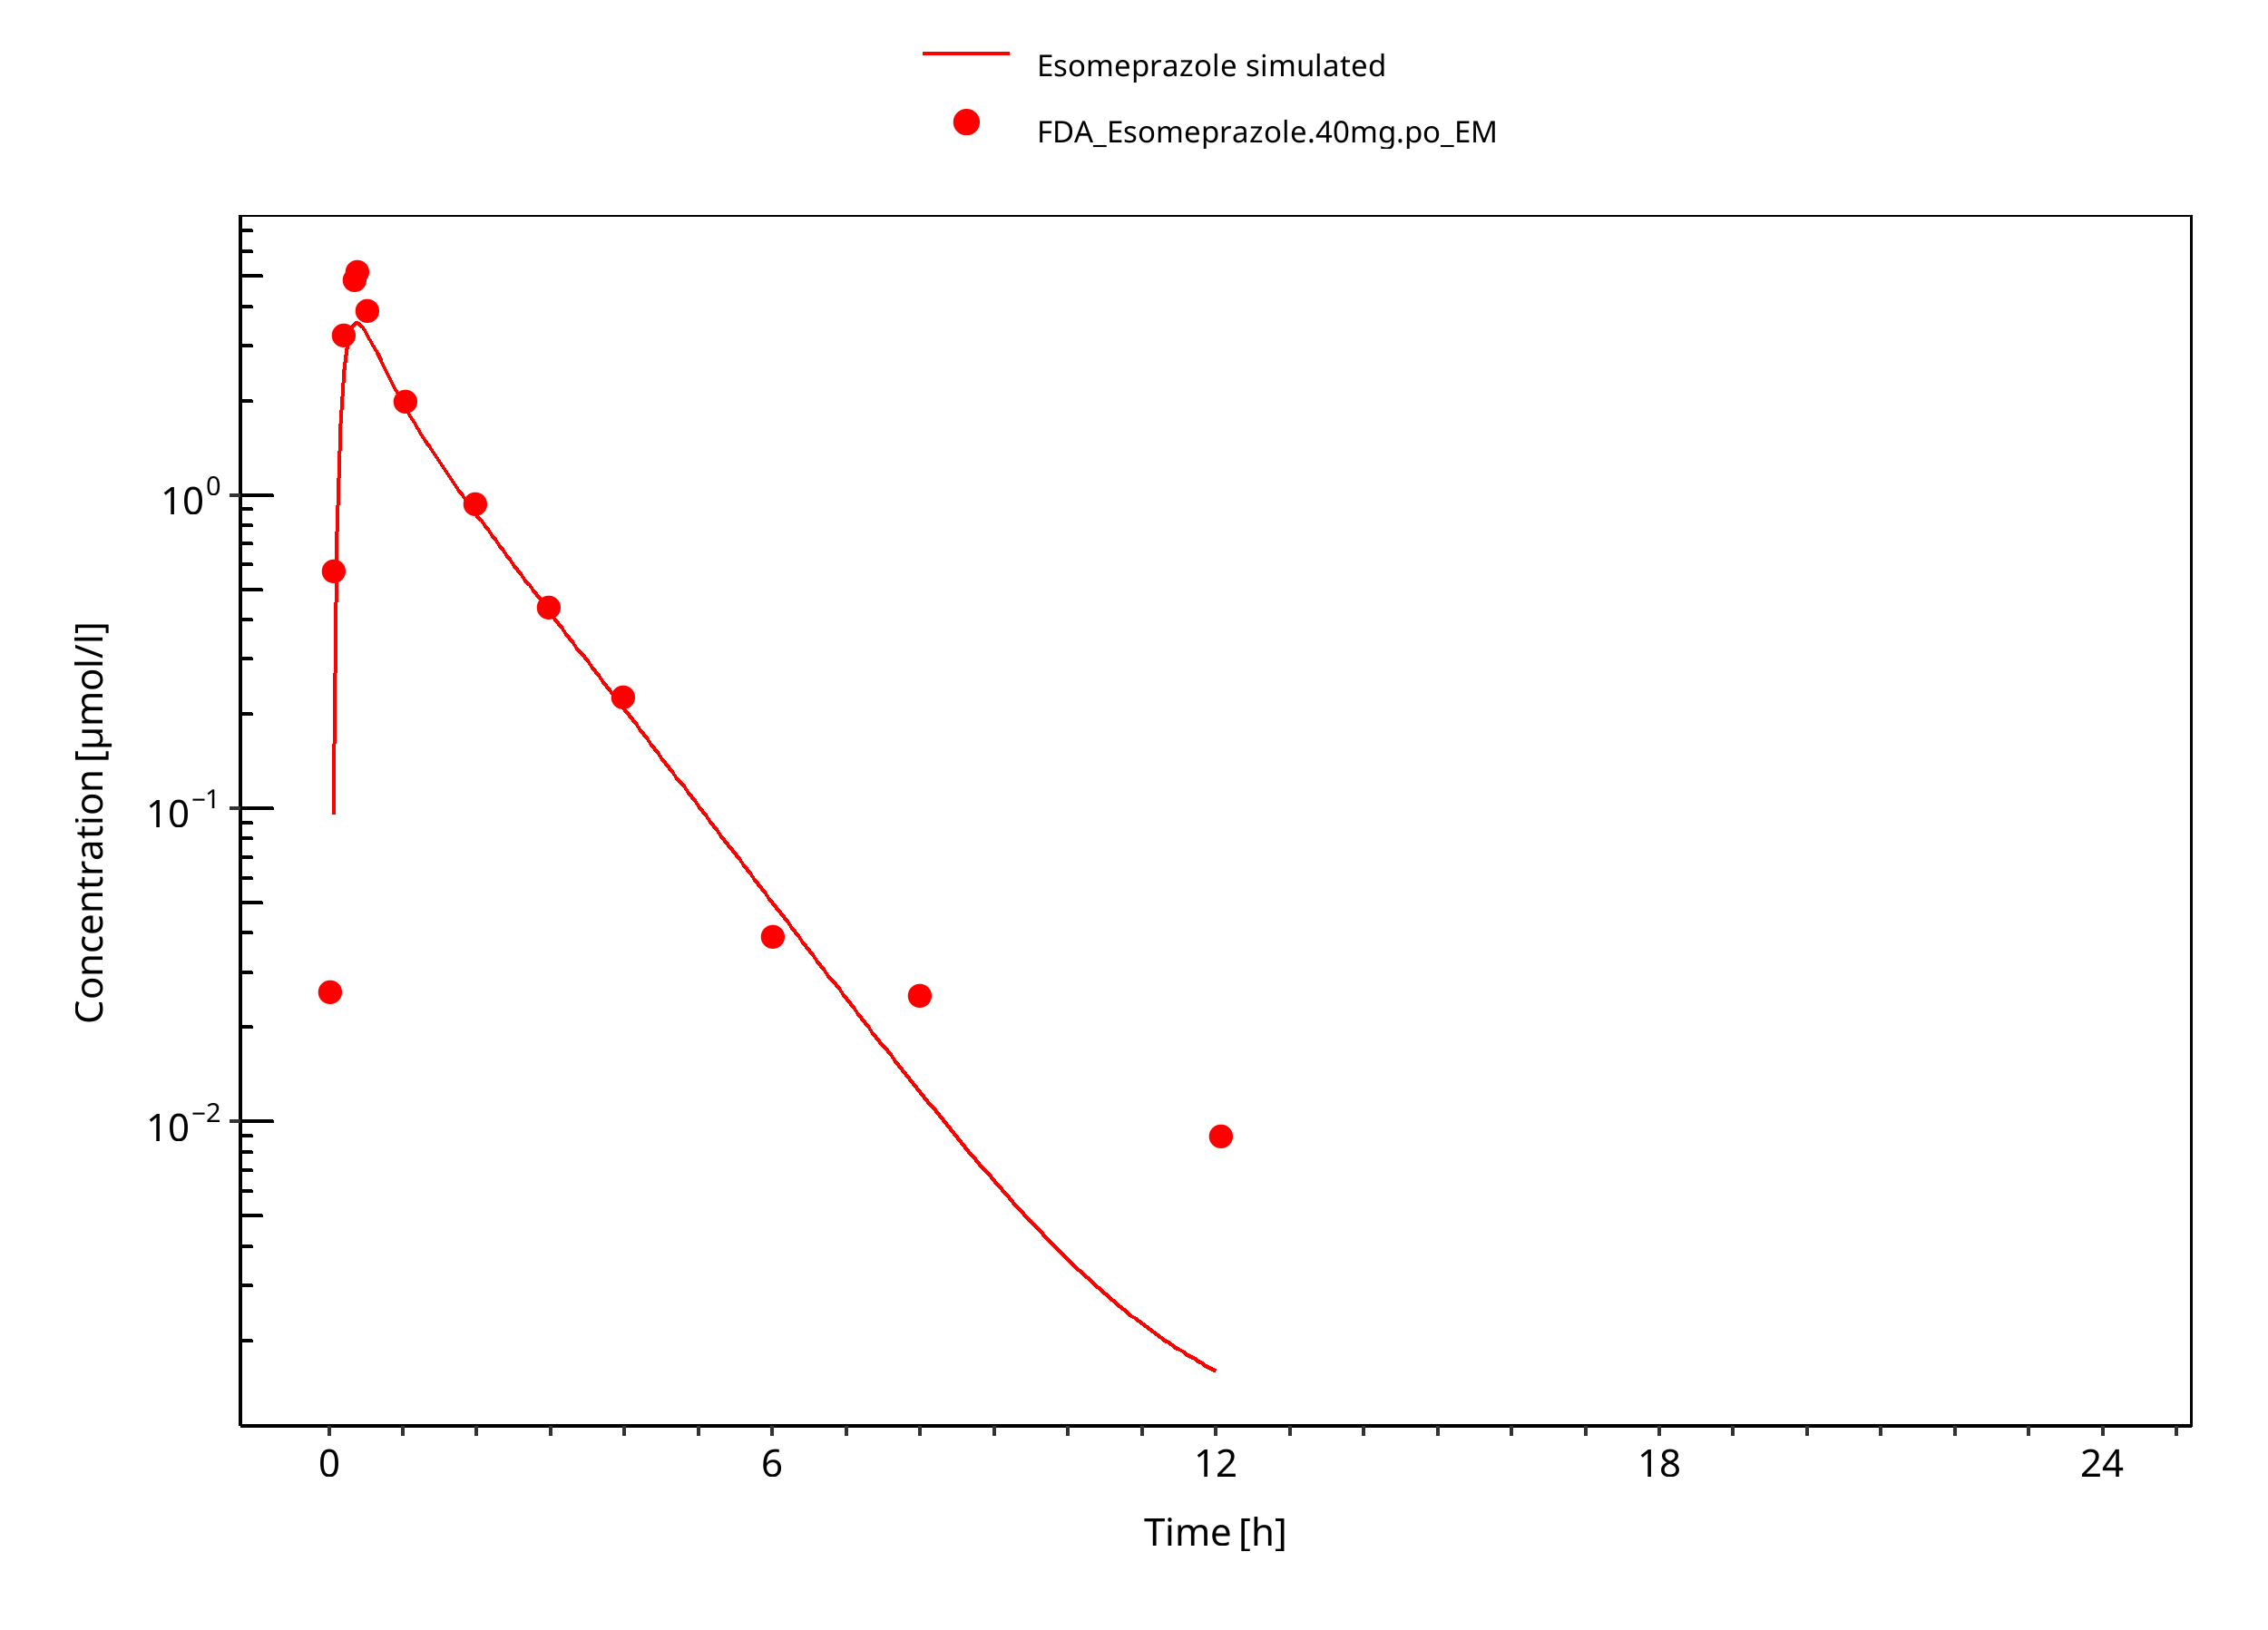
Figure 3-29: 40 mg S-omeprazole oral solution
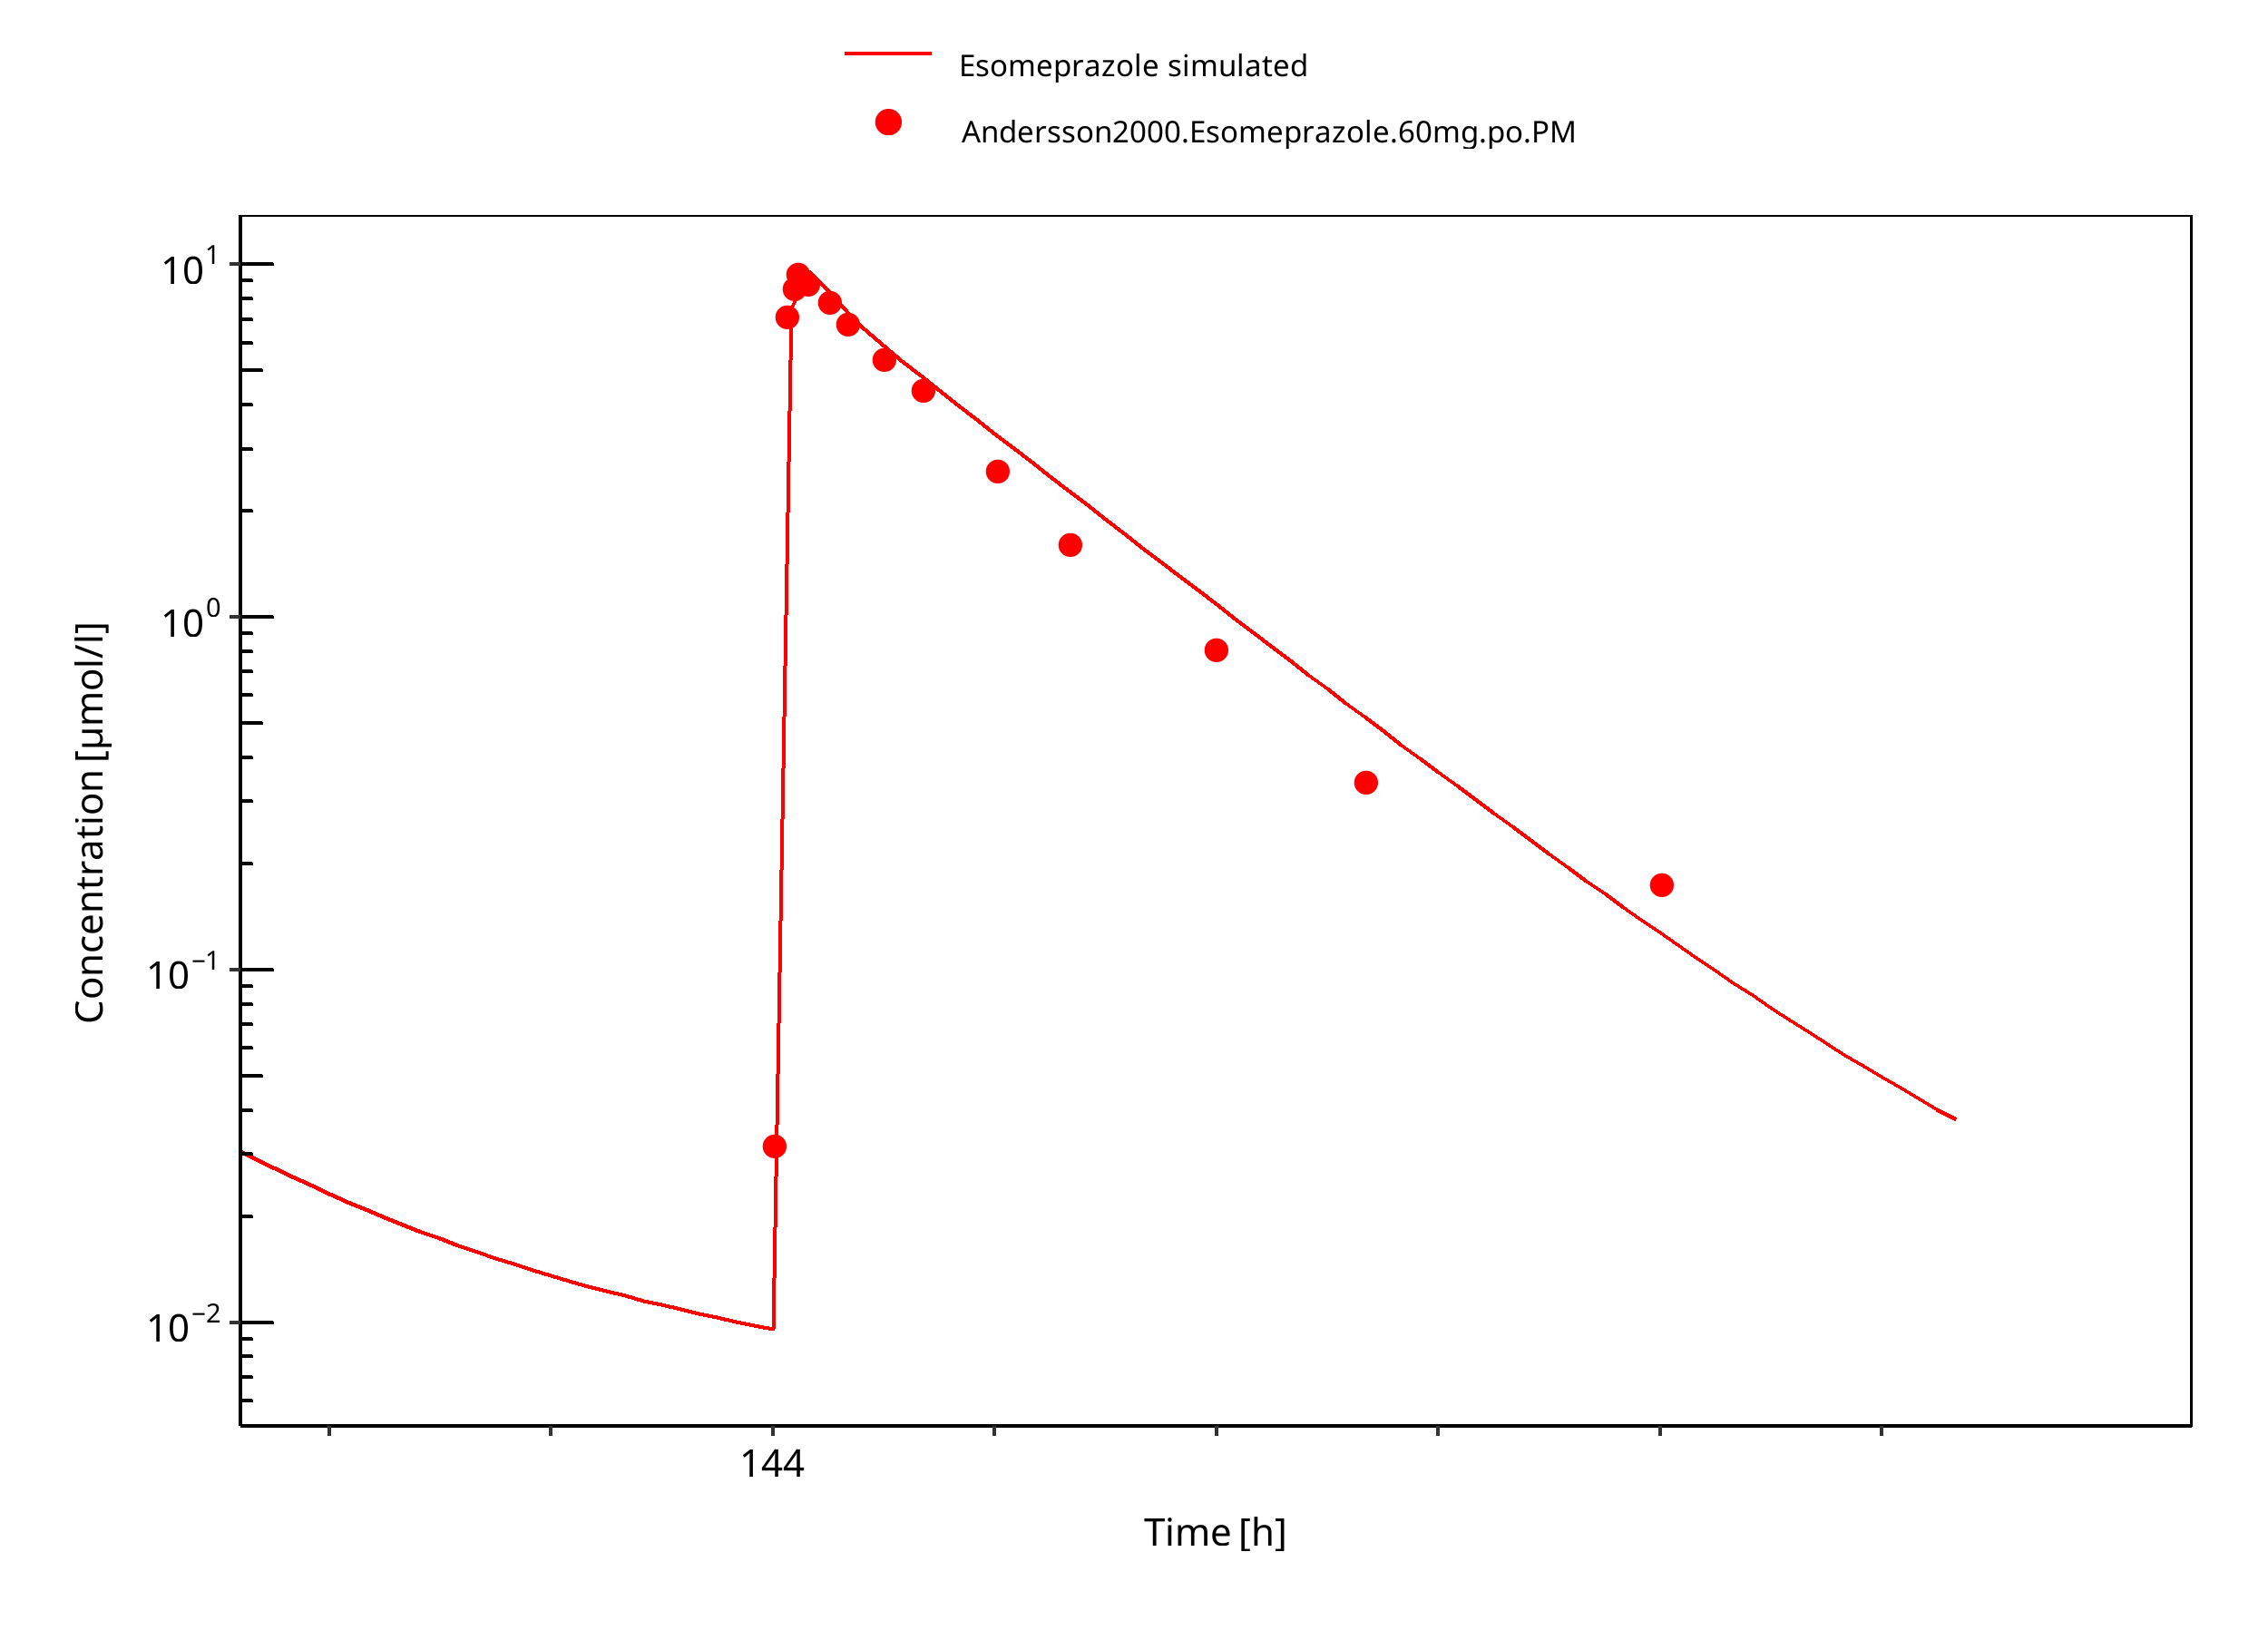
Figure 3-30: 60 mg S-omeprazole oral solution PM
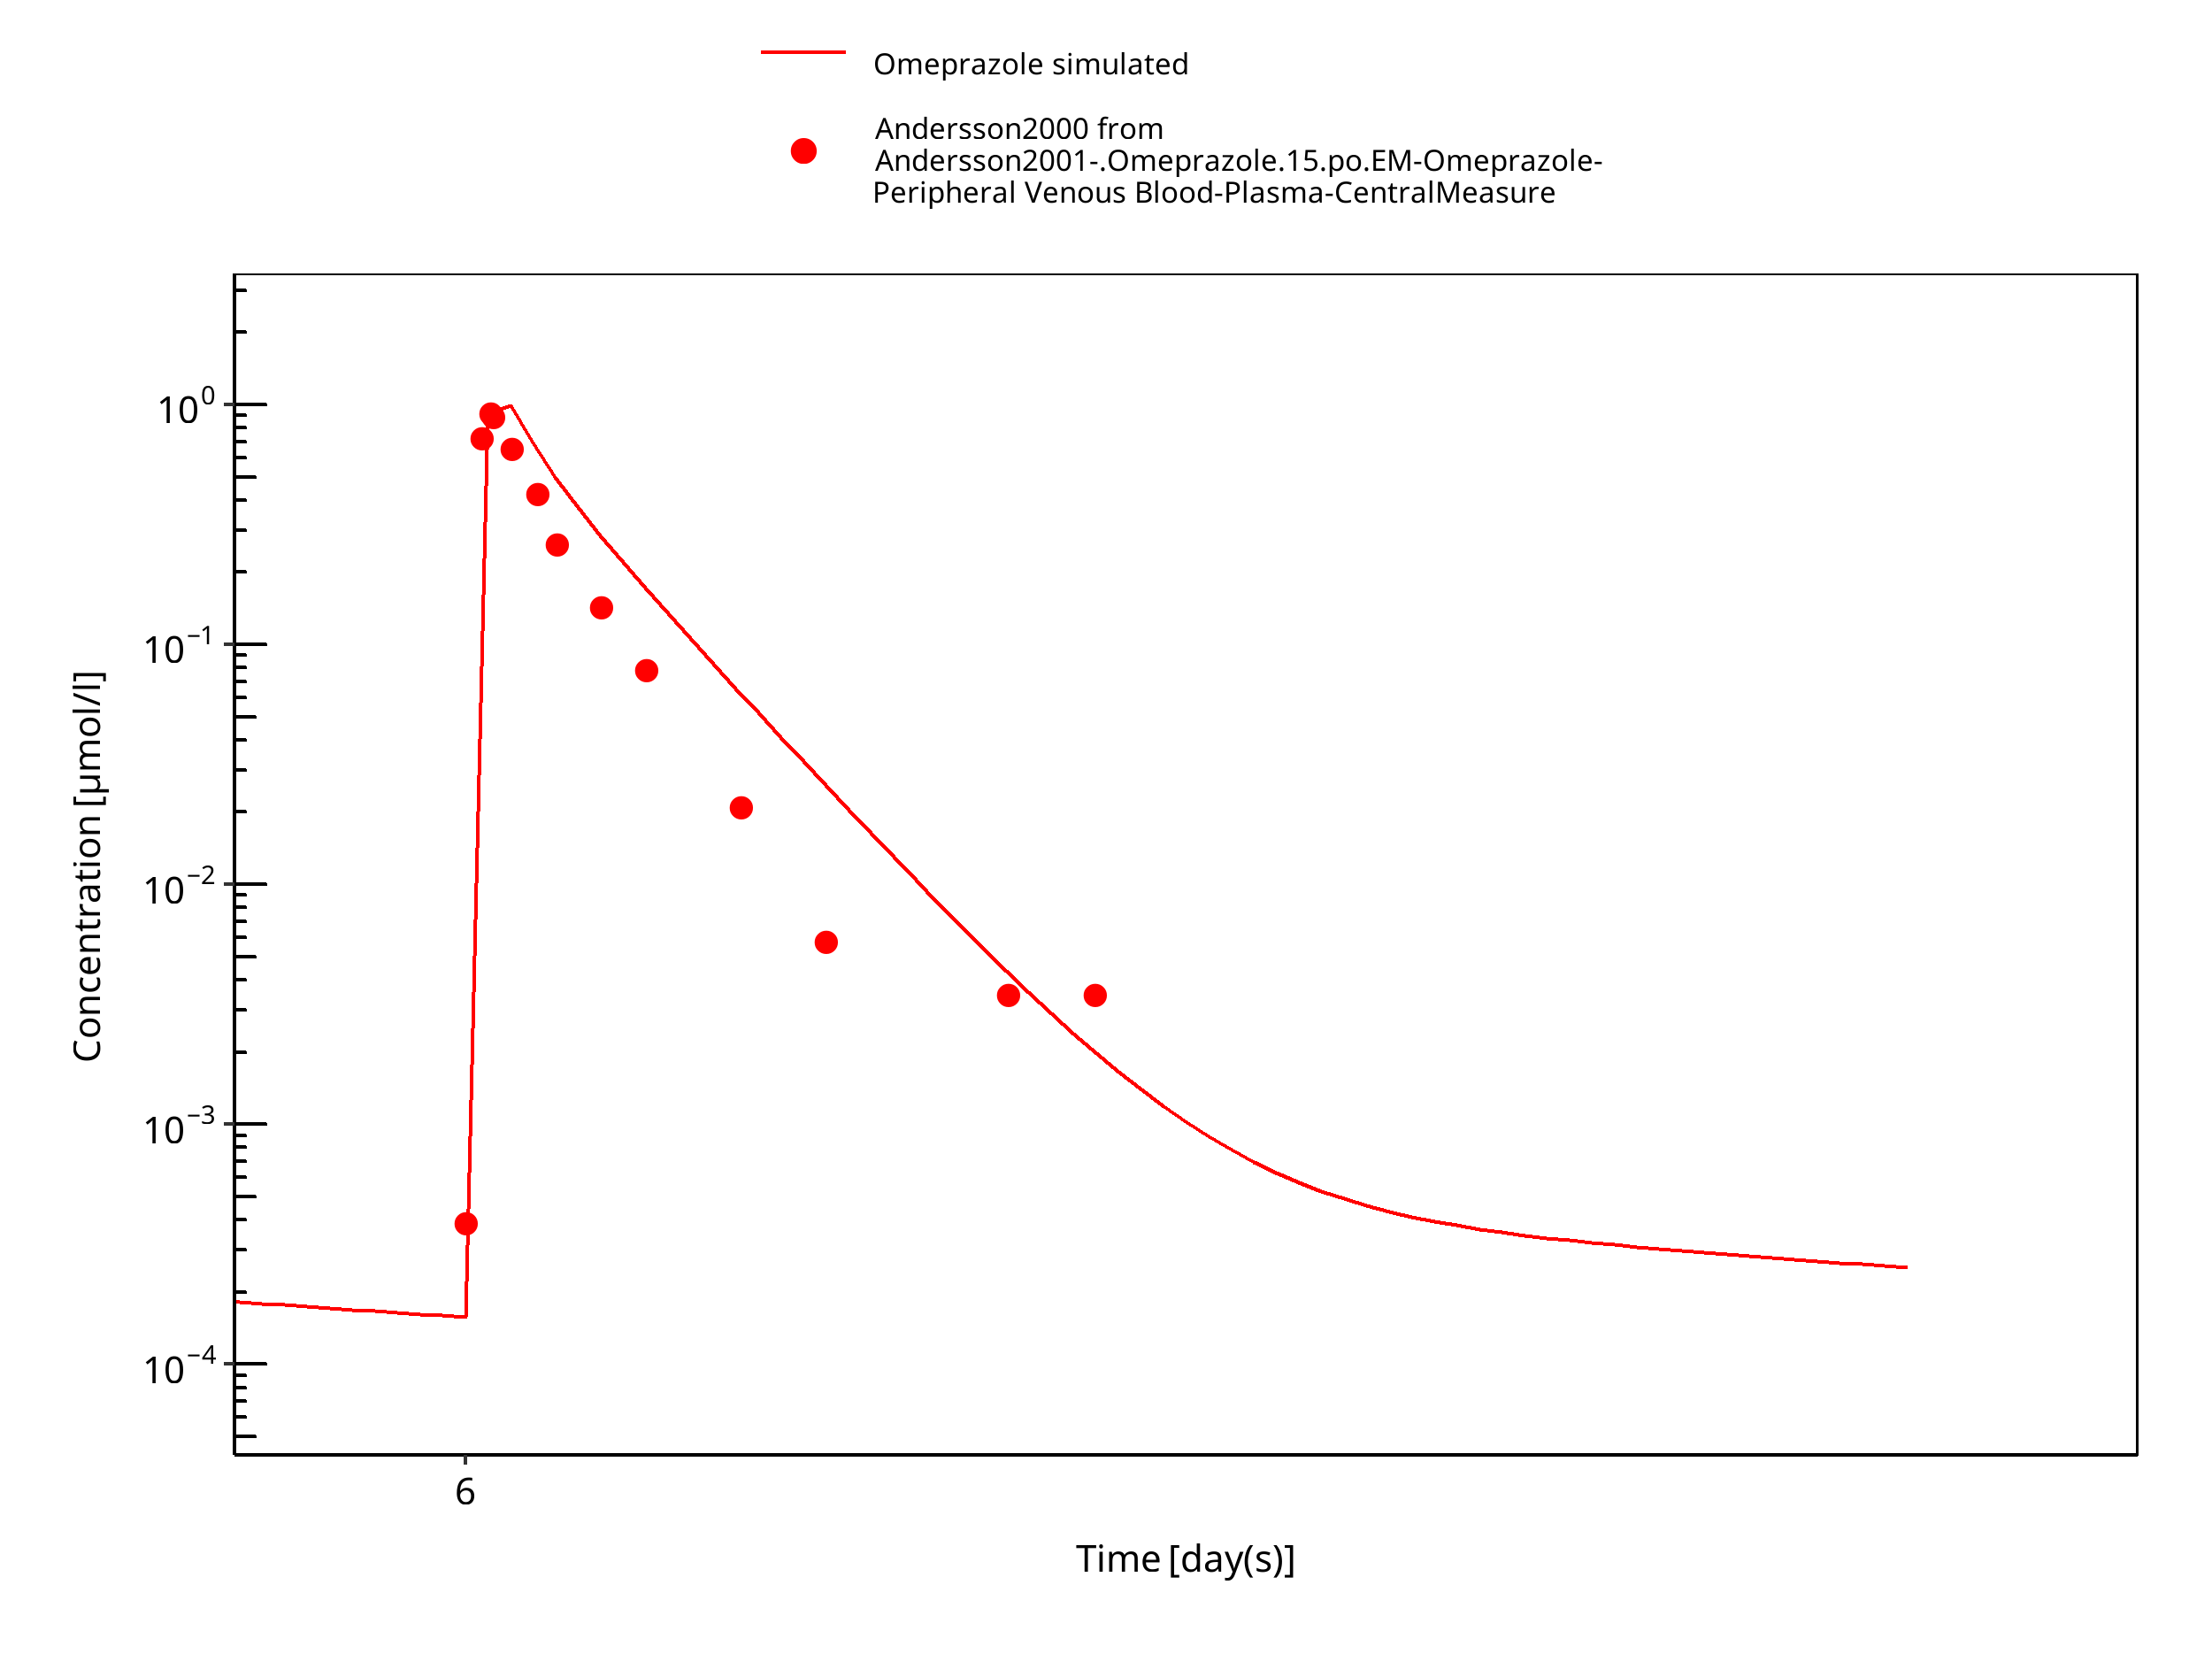
Figure 3-31: 15 mg omeprazole oral solution day 6
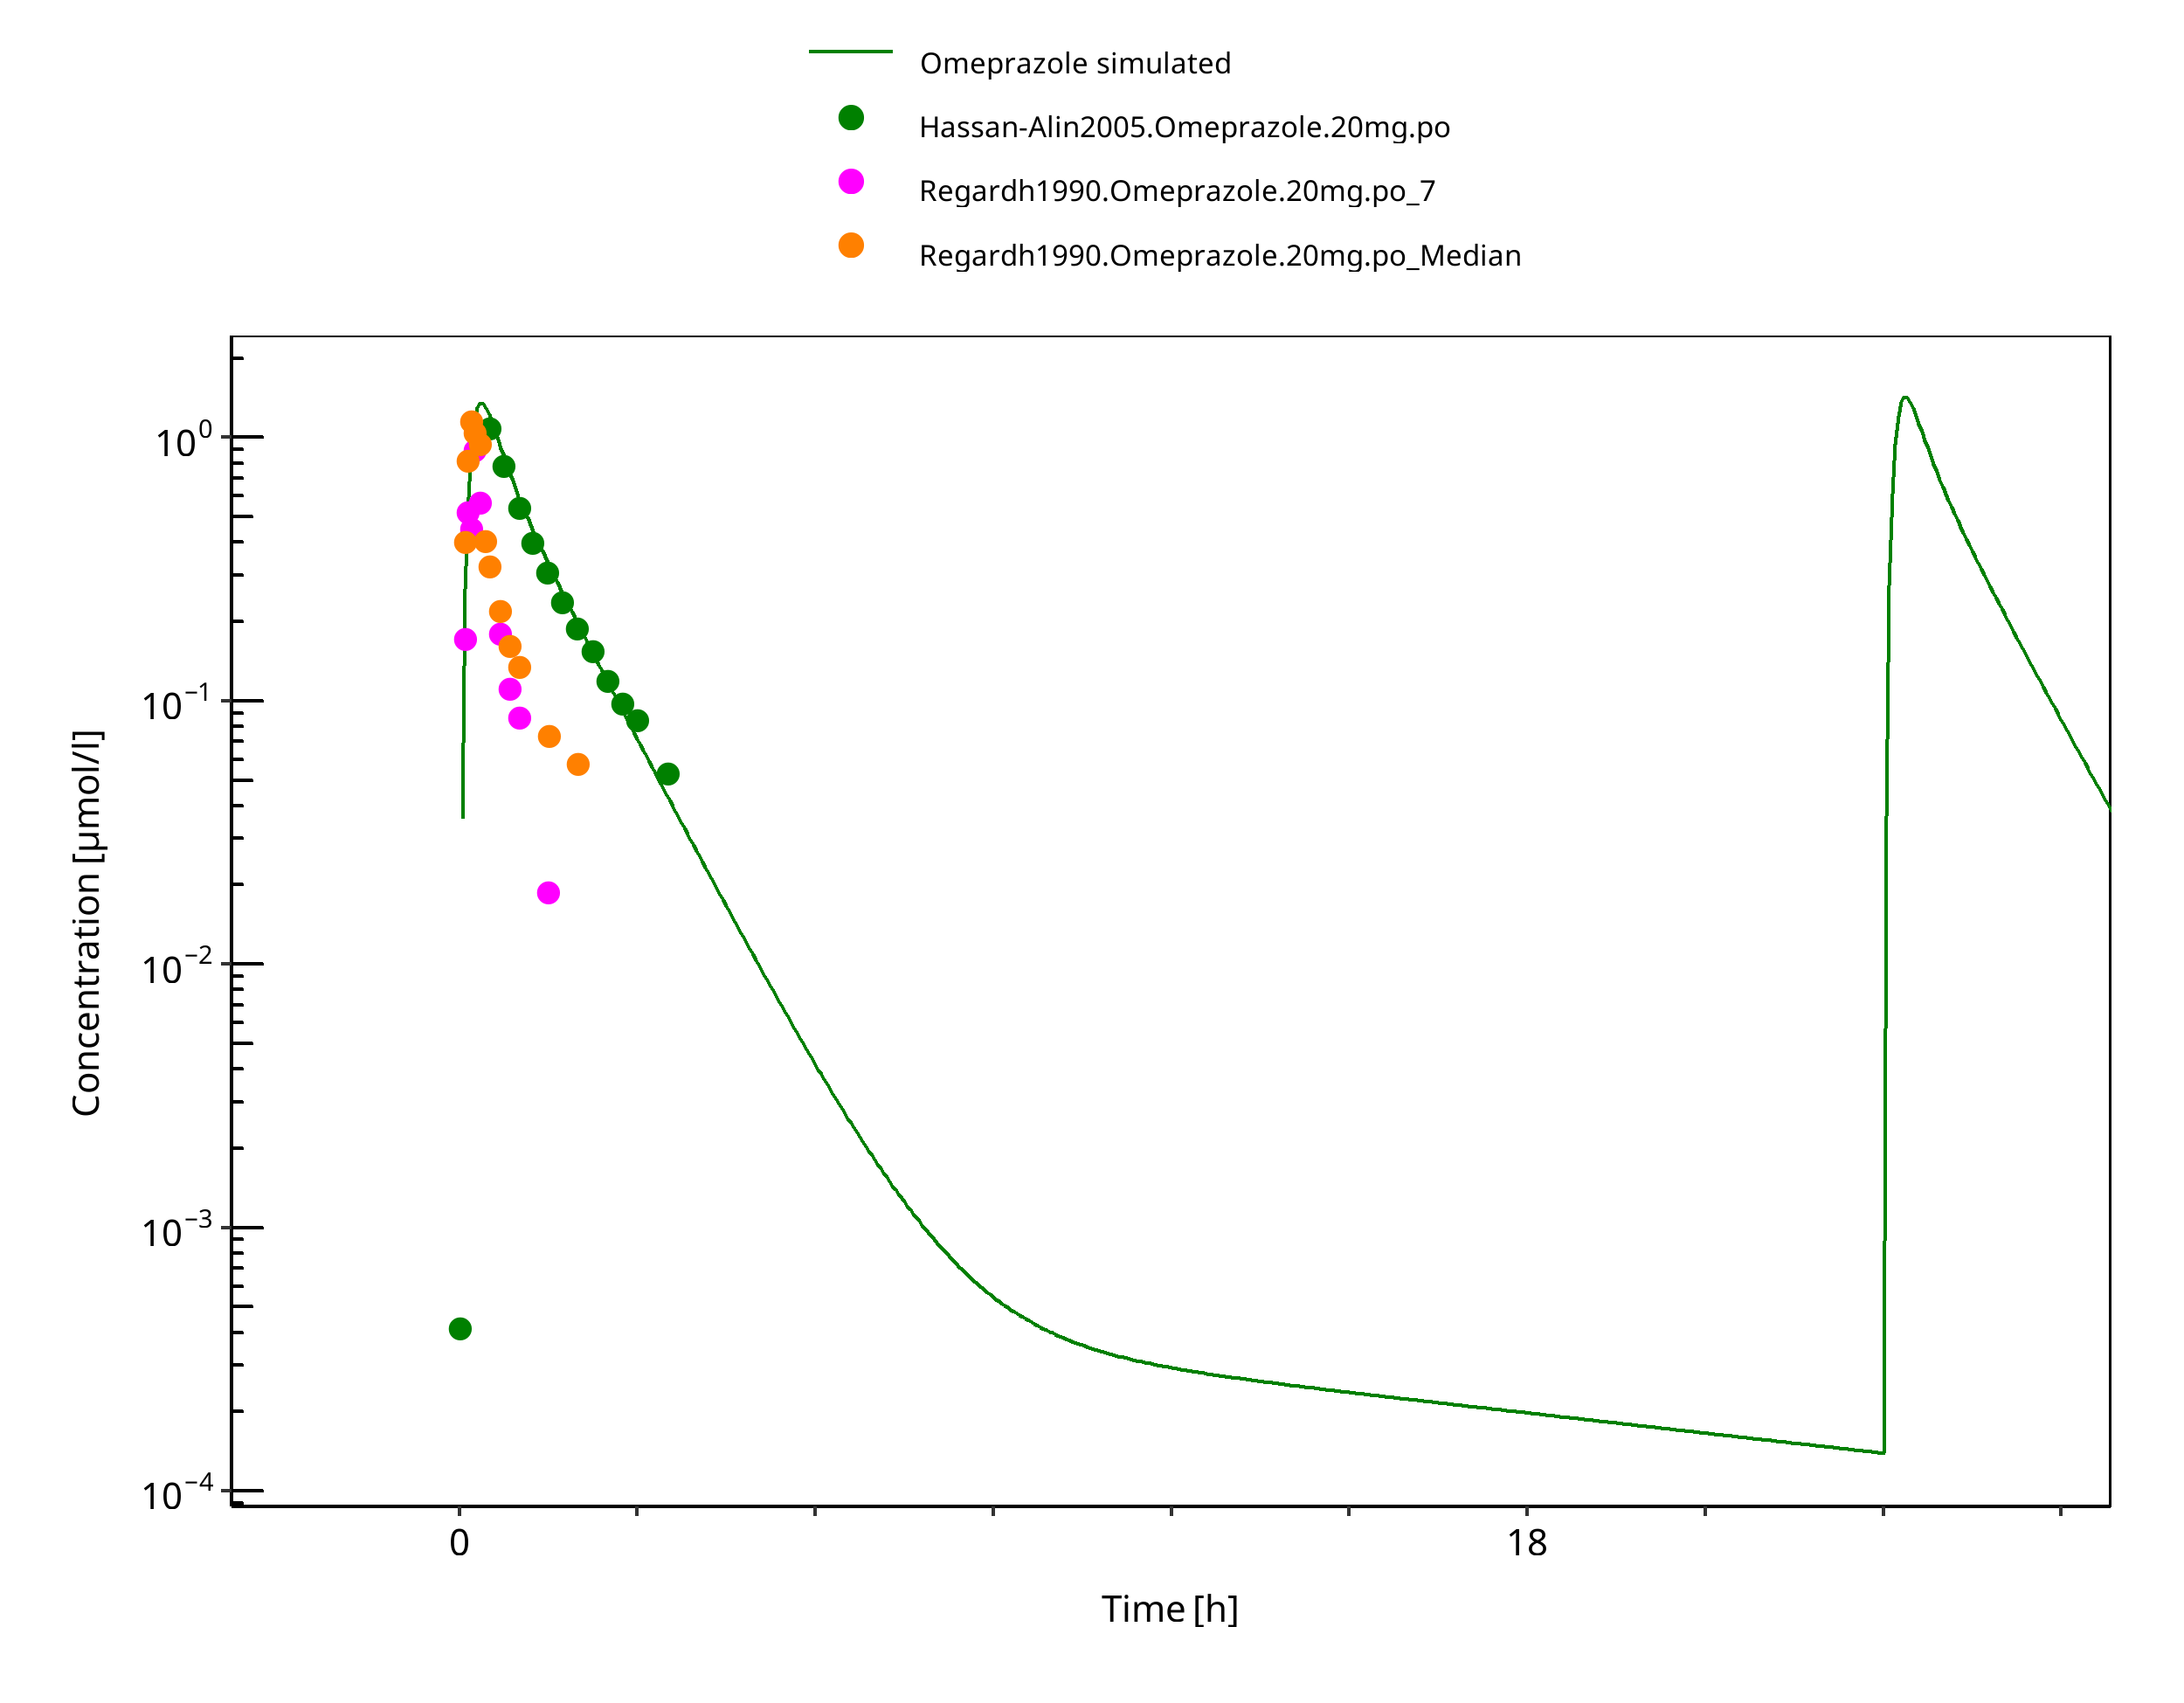
Figure 3-32: 20 mg po solution - day 1
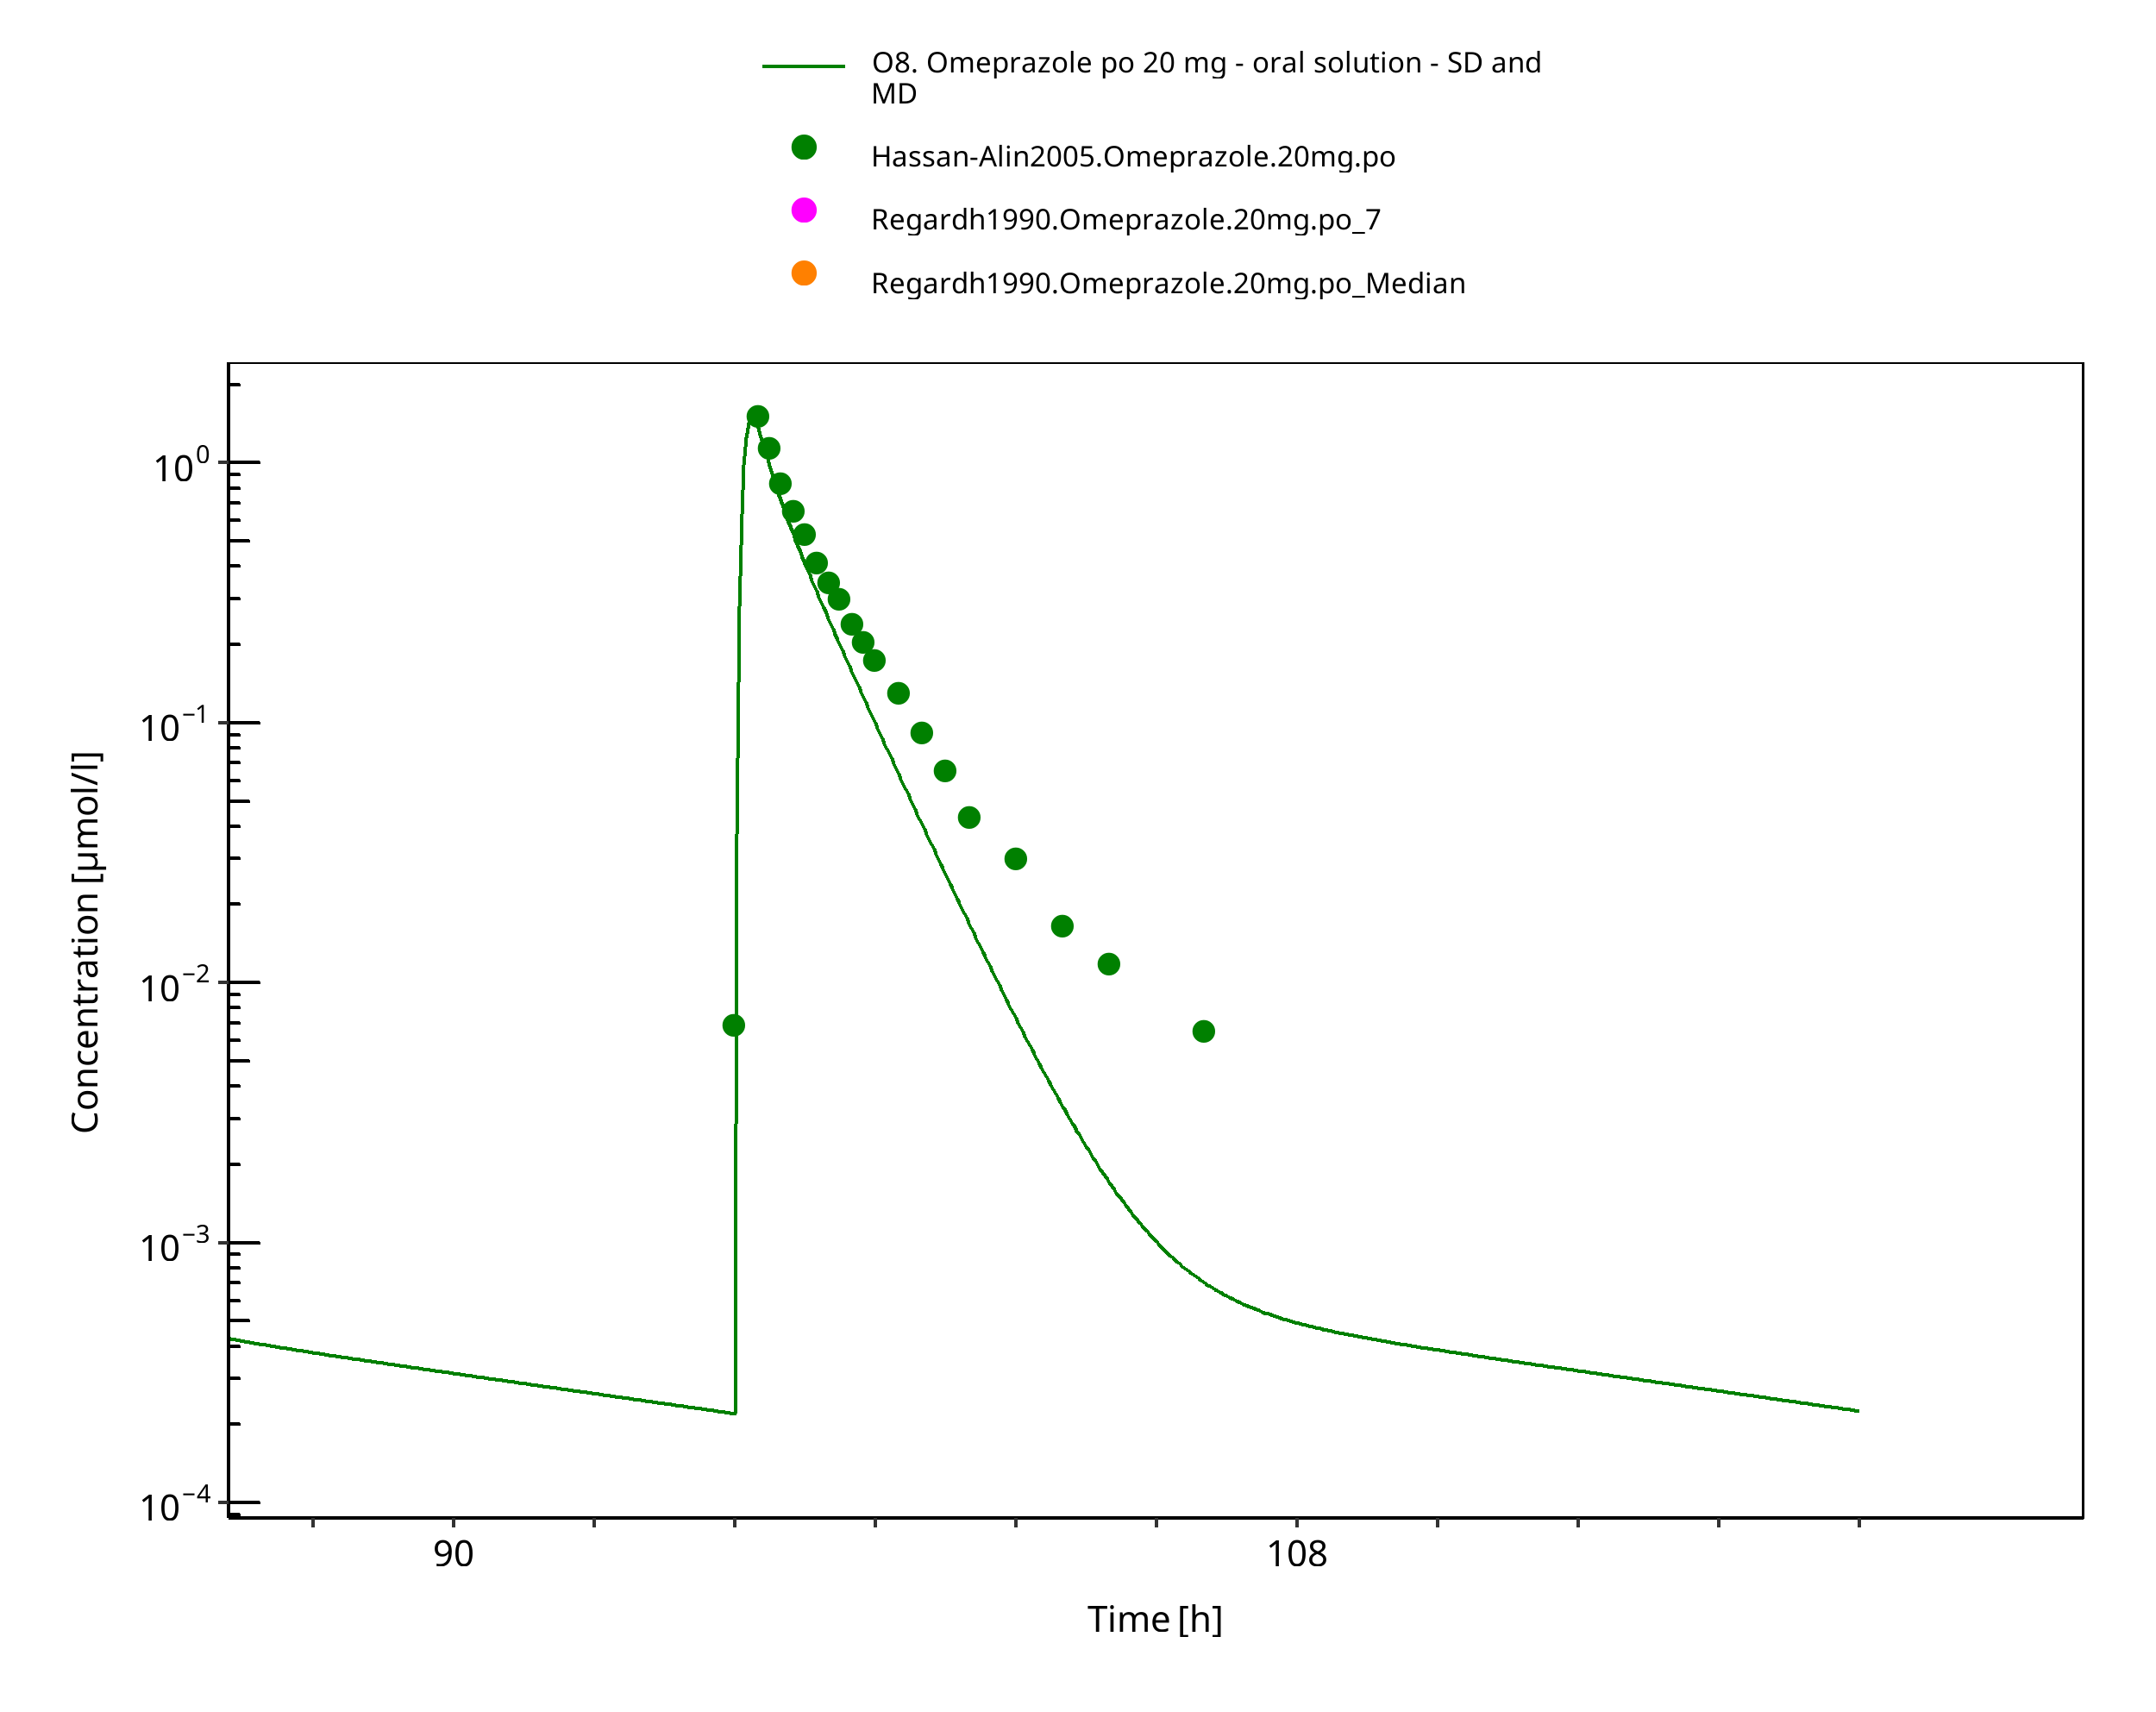
Figure 3-33: 20 mg omeprazole oral solution - day 4
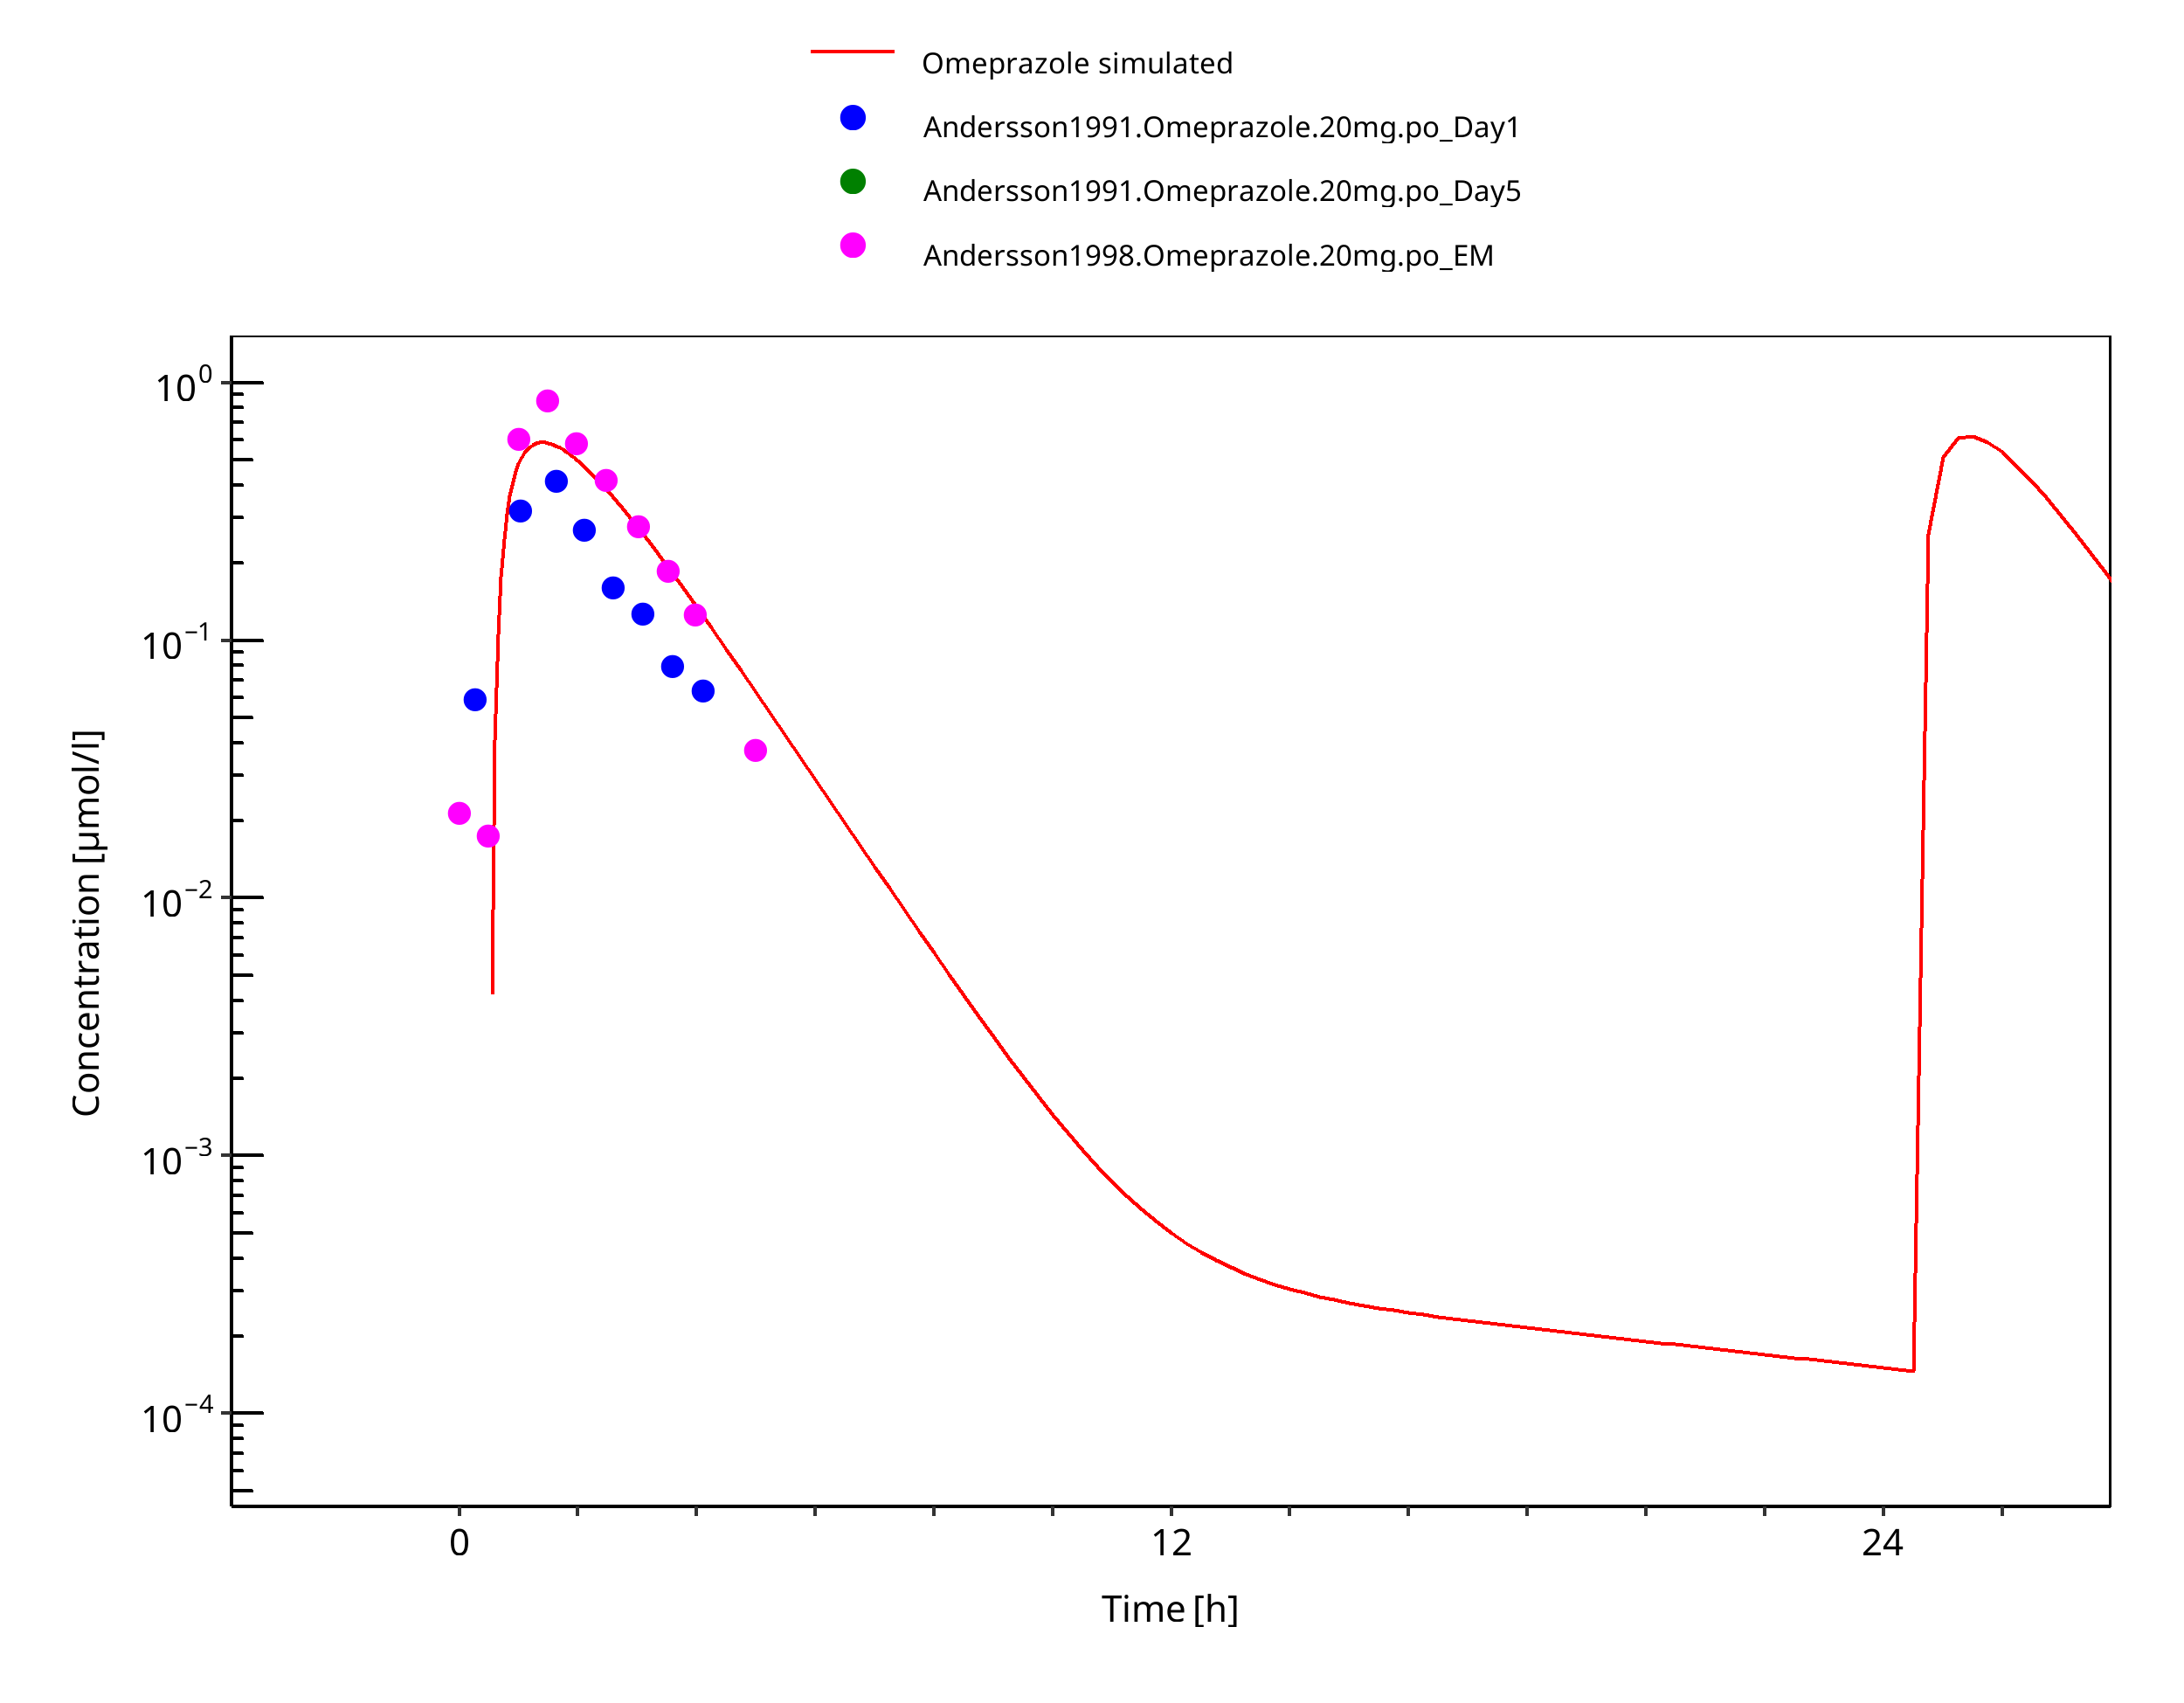
Figure 3-34: 20 mg po capsule - day 1
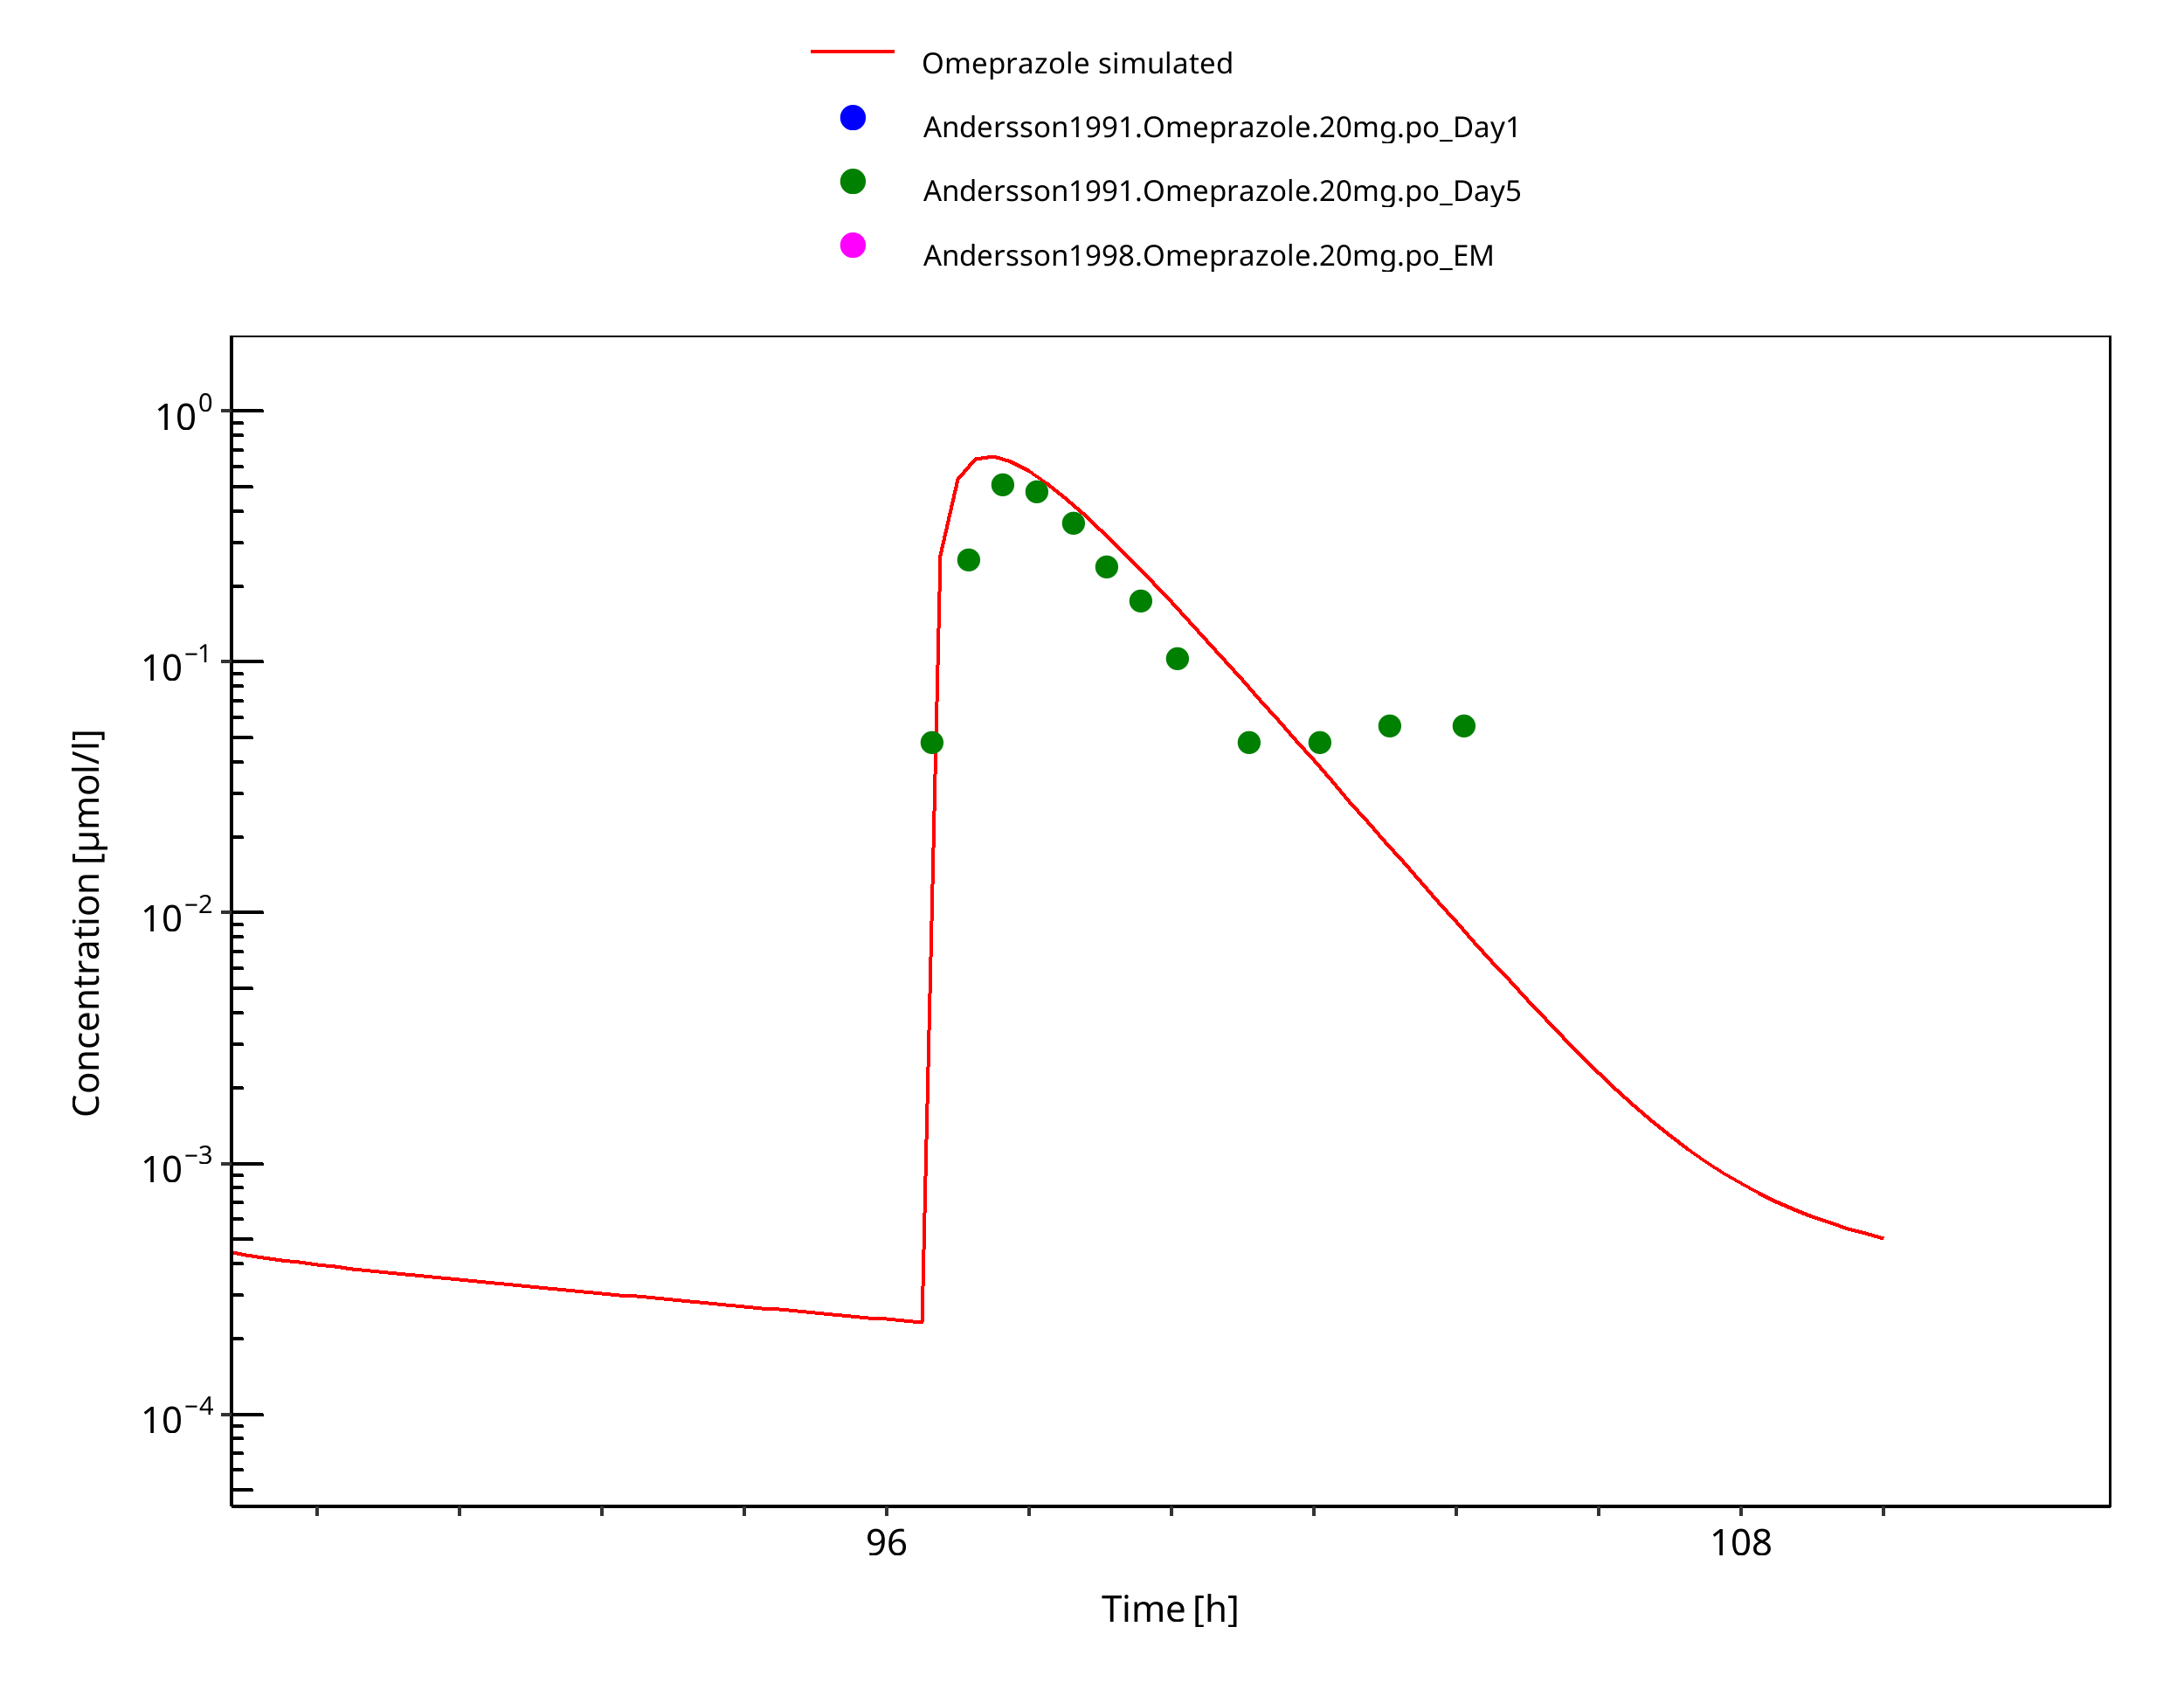
Figure 3-35: 20 mg po capsule - day 5
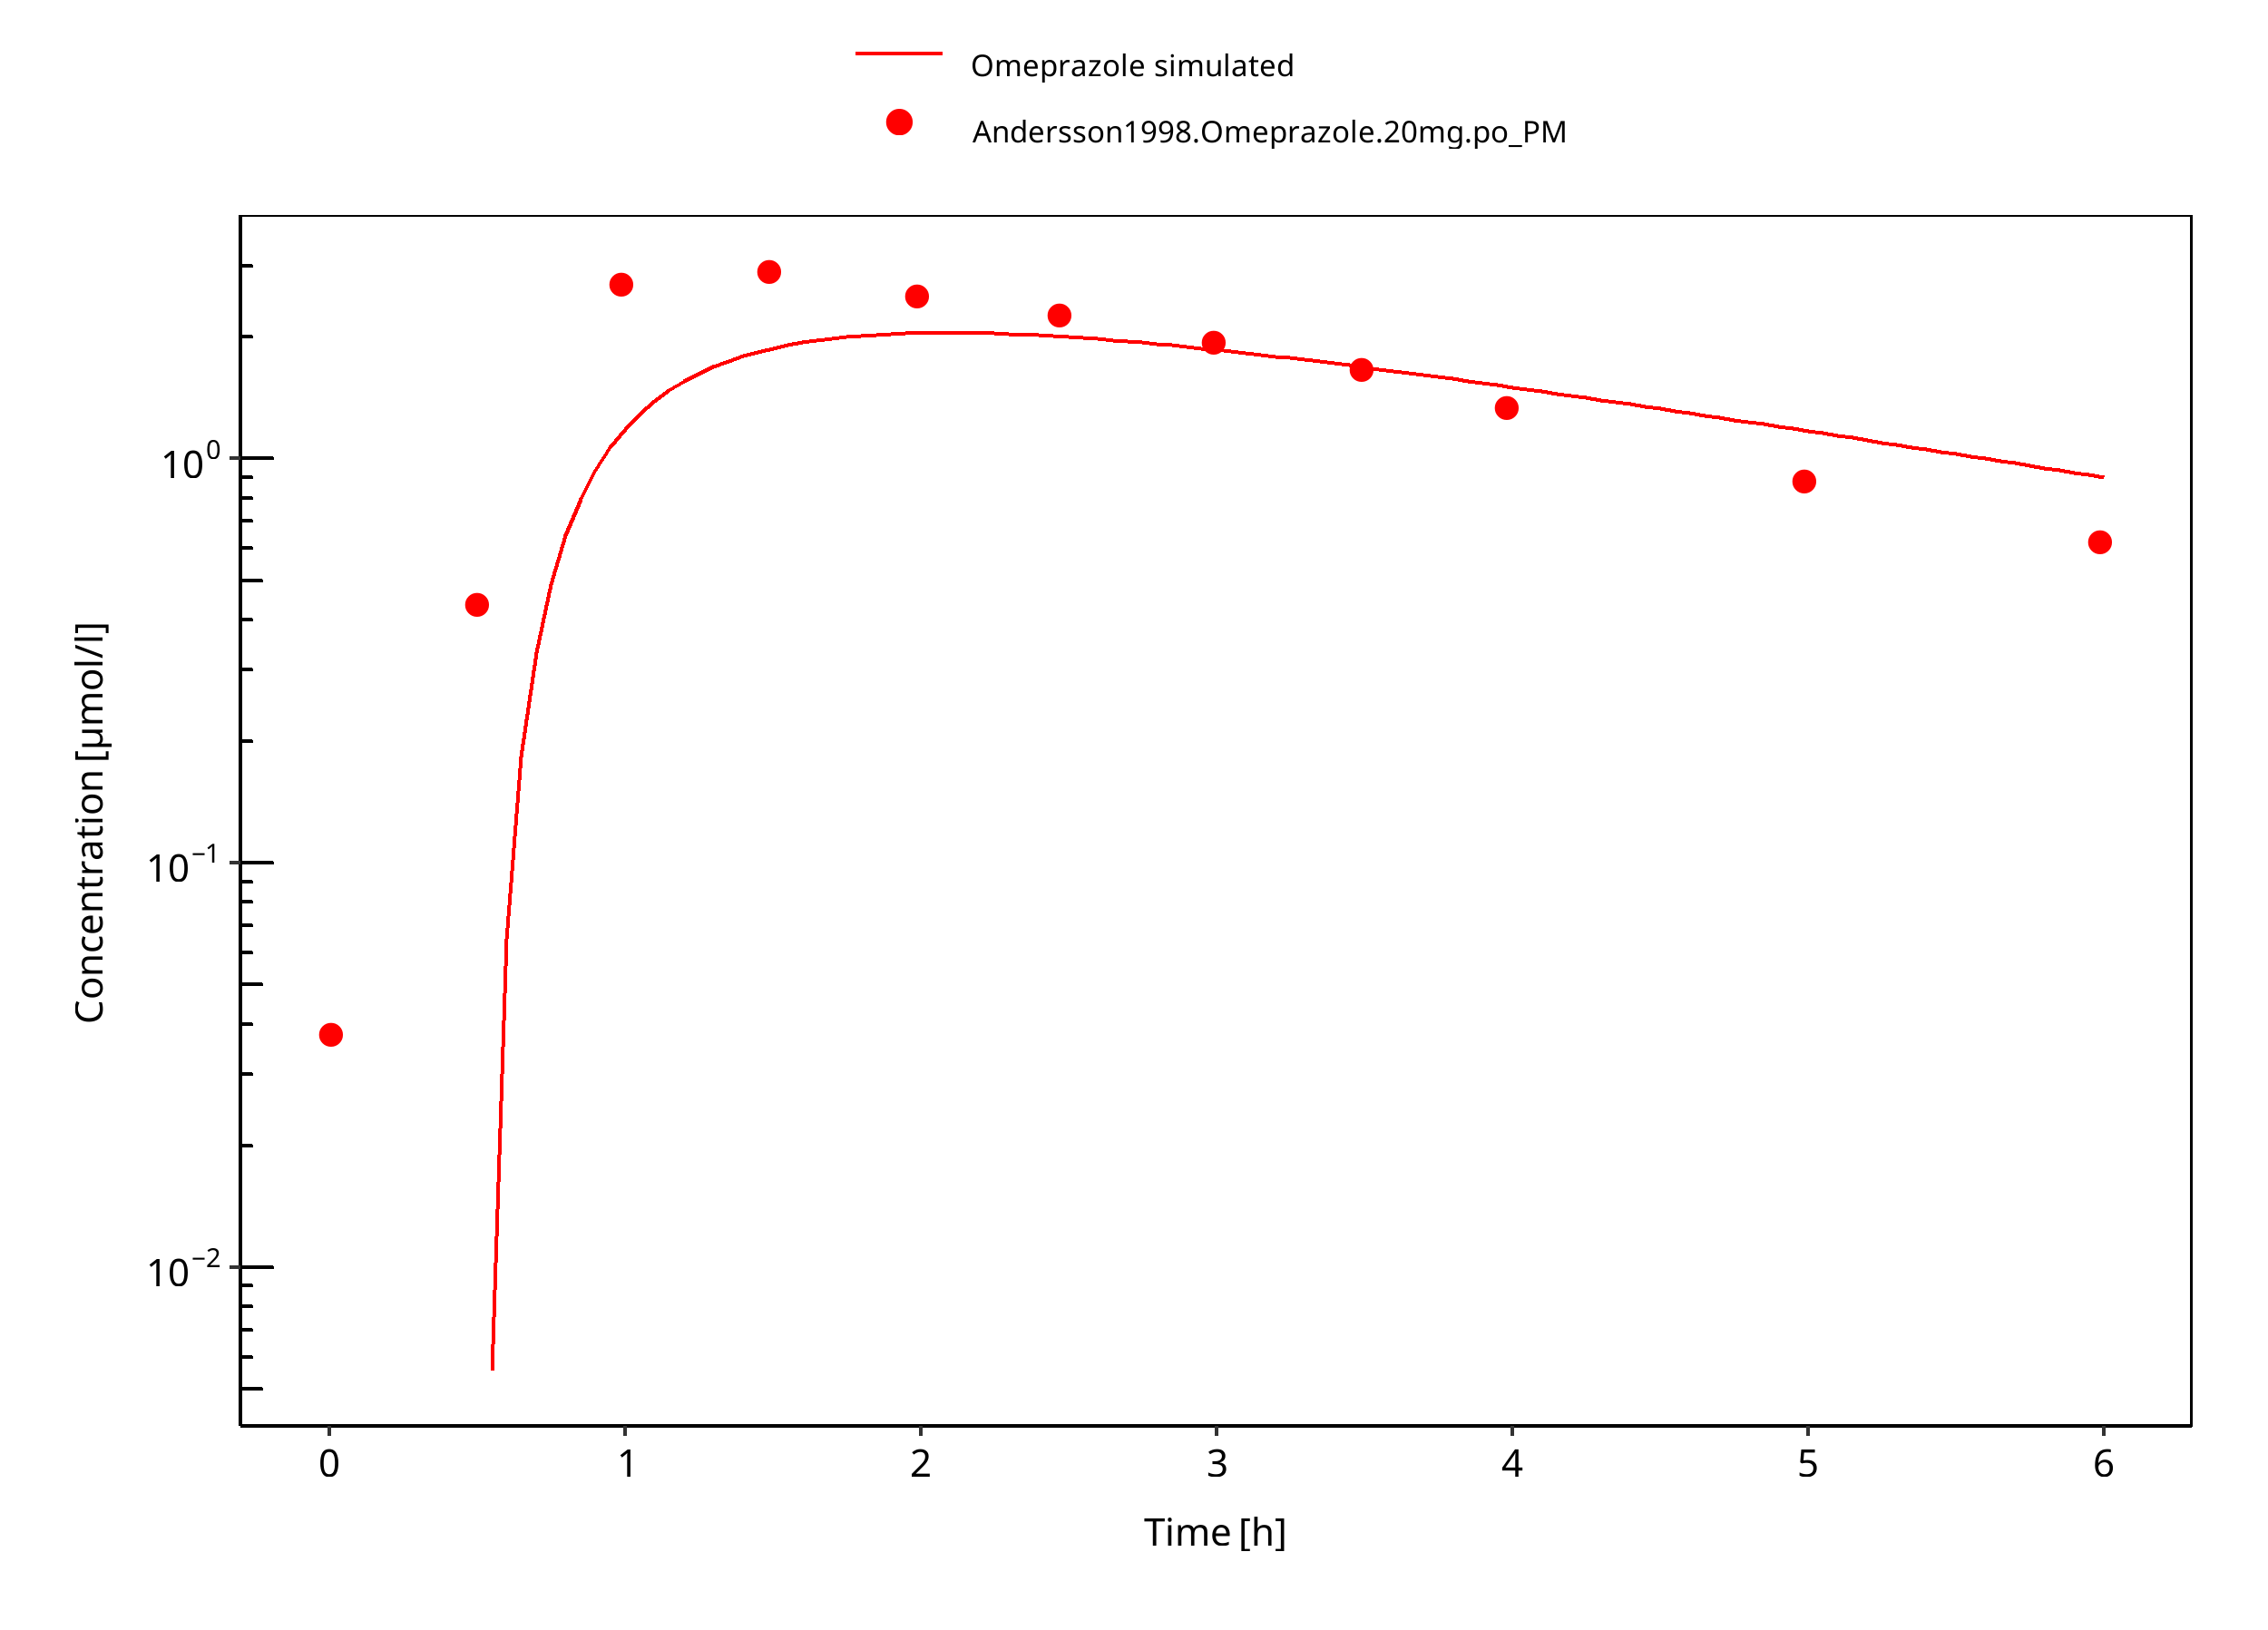
Figure 3-36: 20 mg omeprazole oral capsule PM
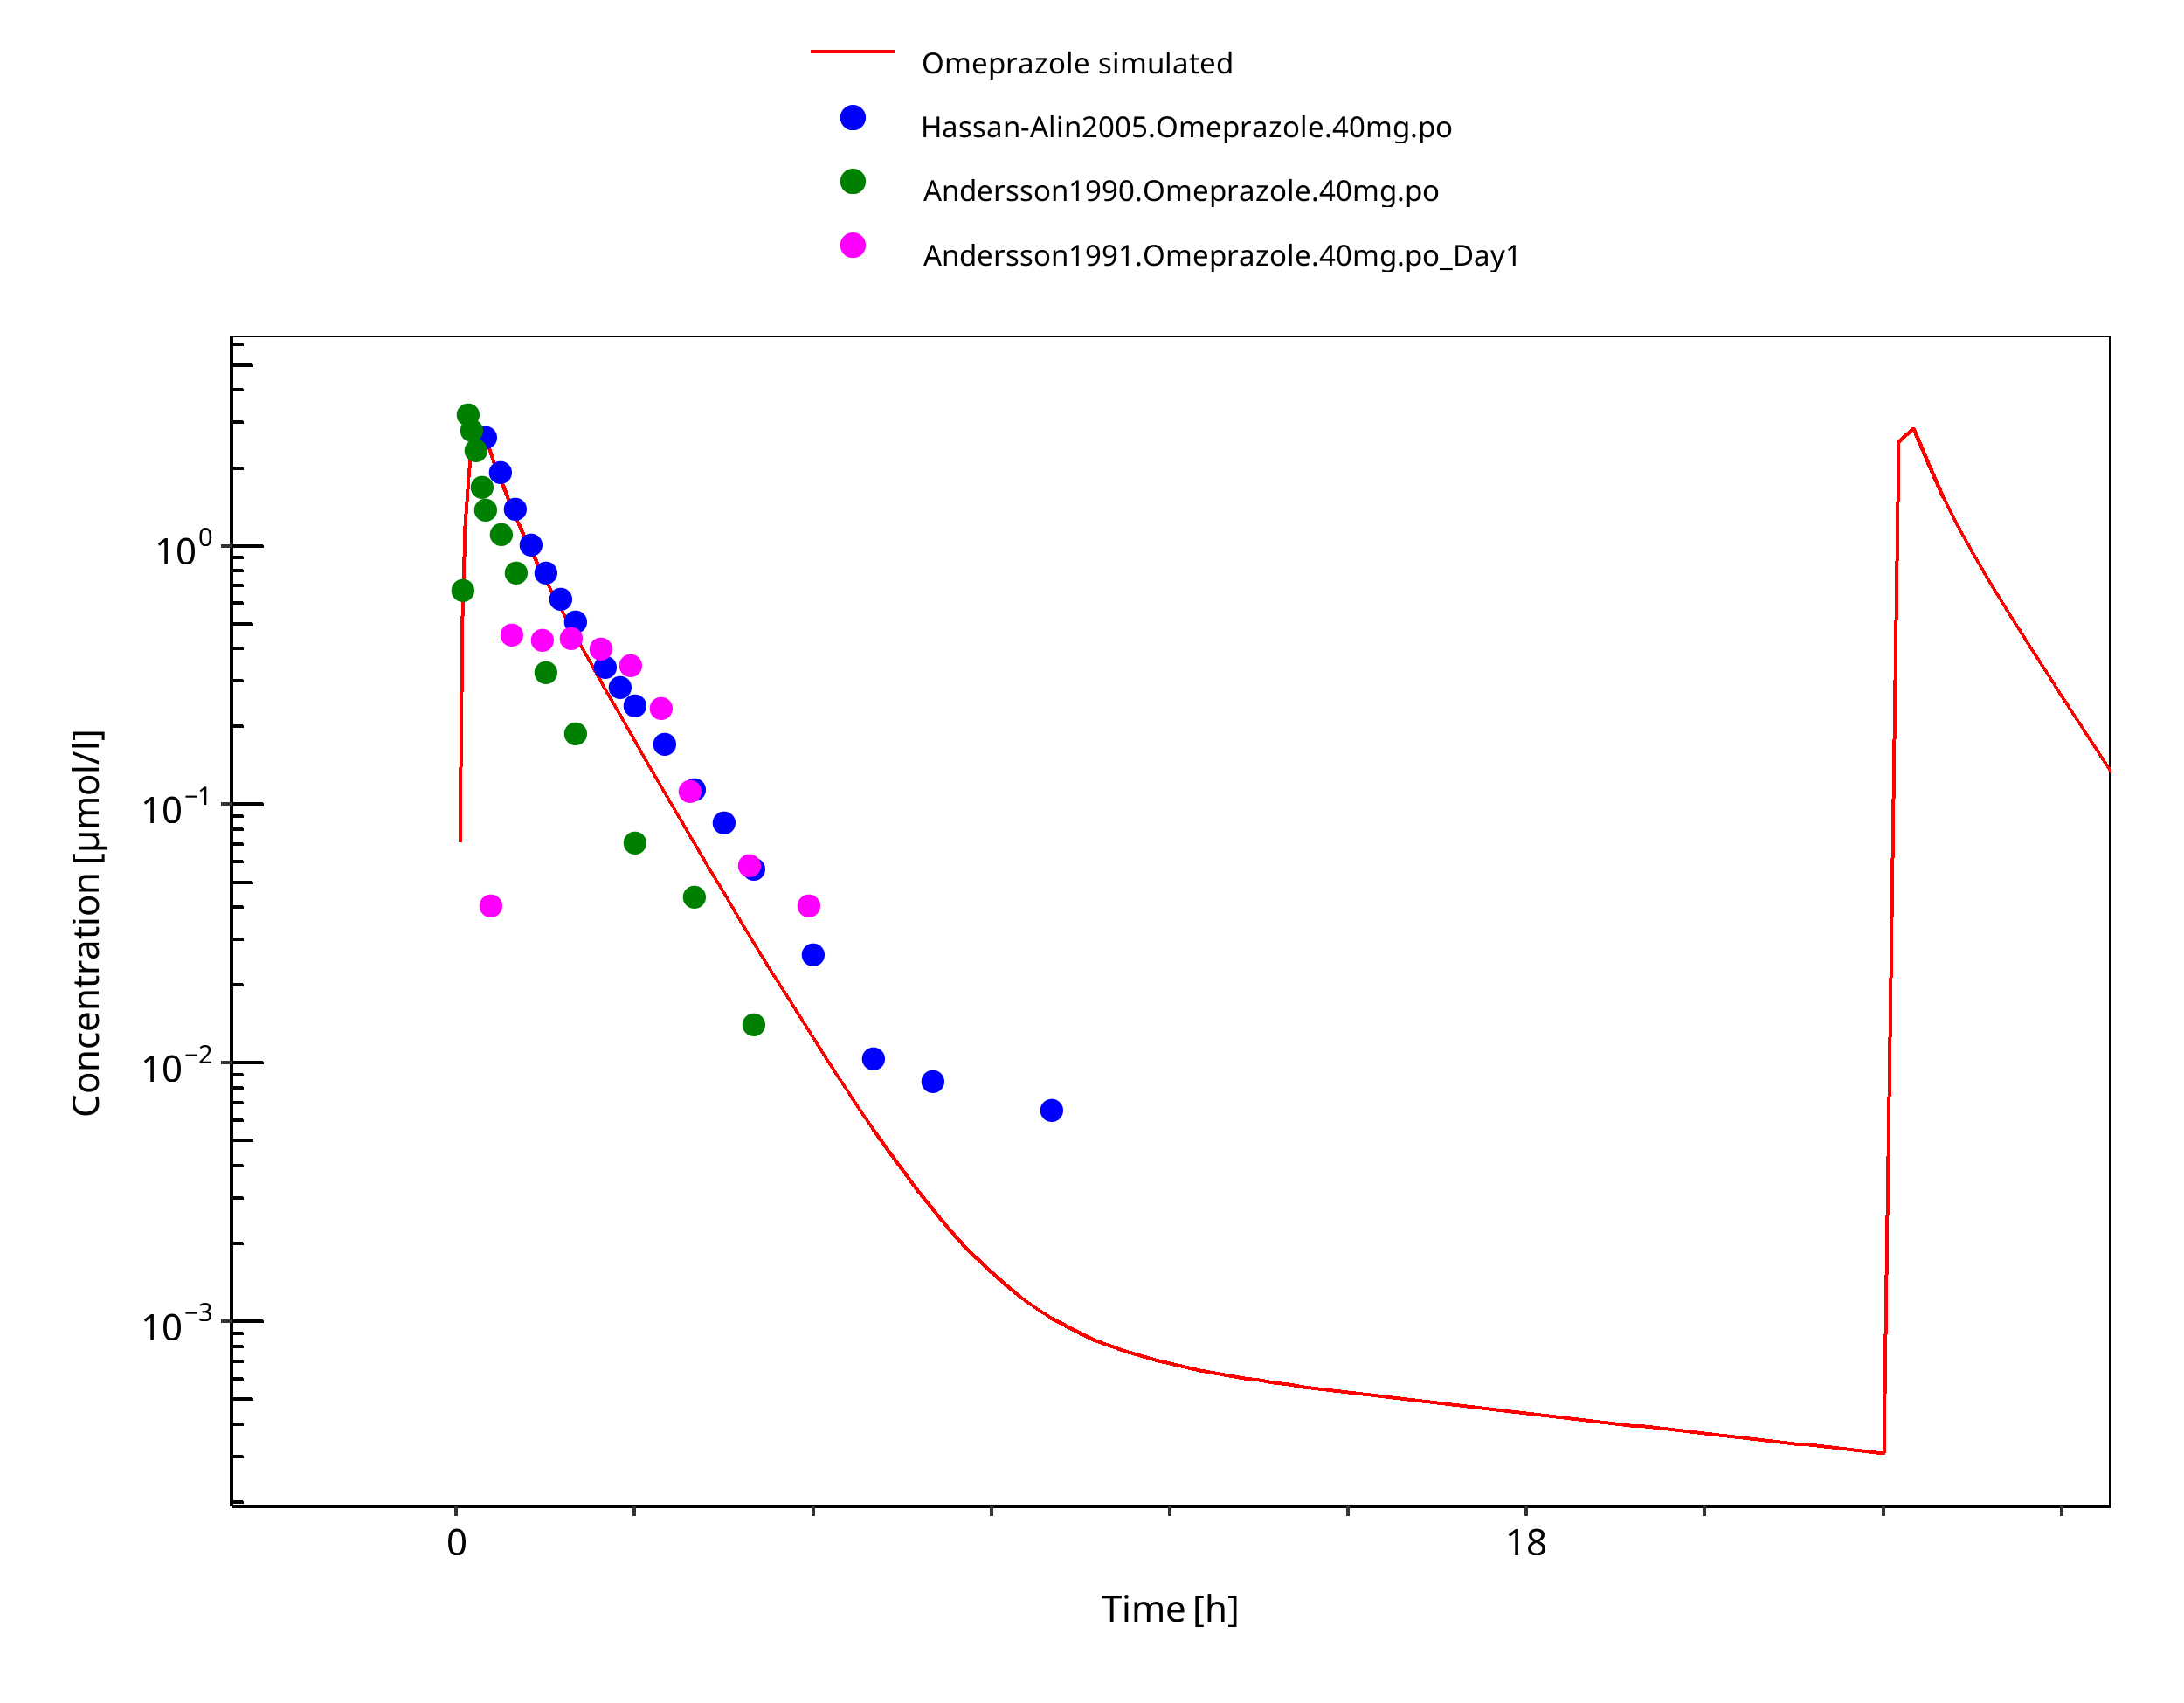
Figure 3-37: 40 mg omeprazole oral solution
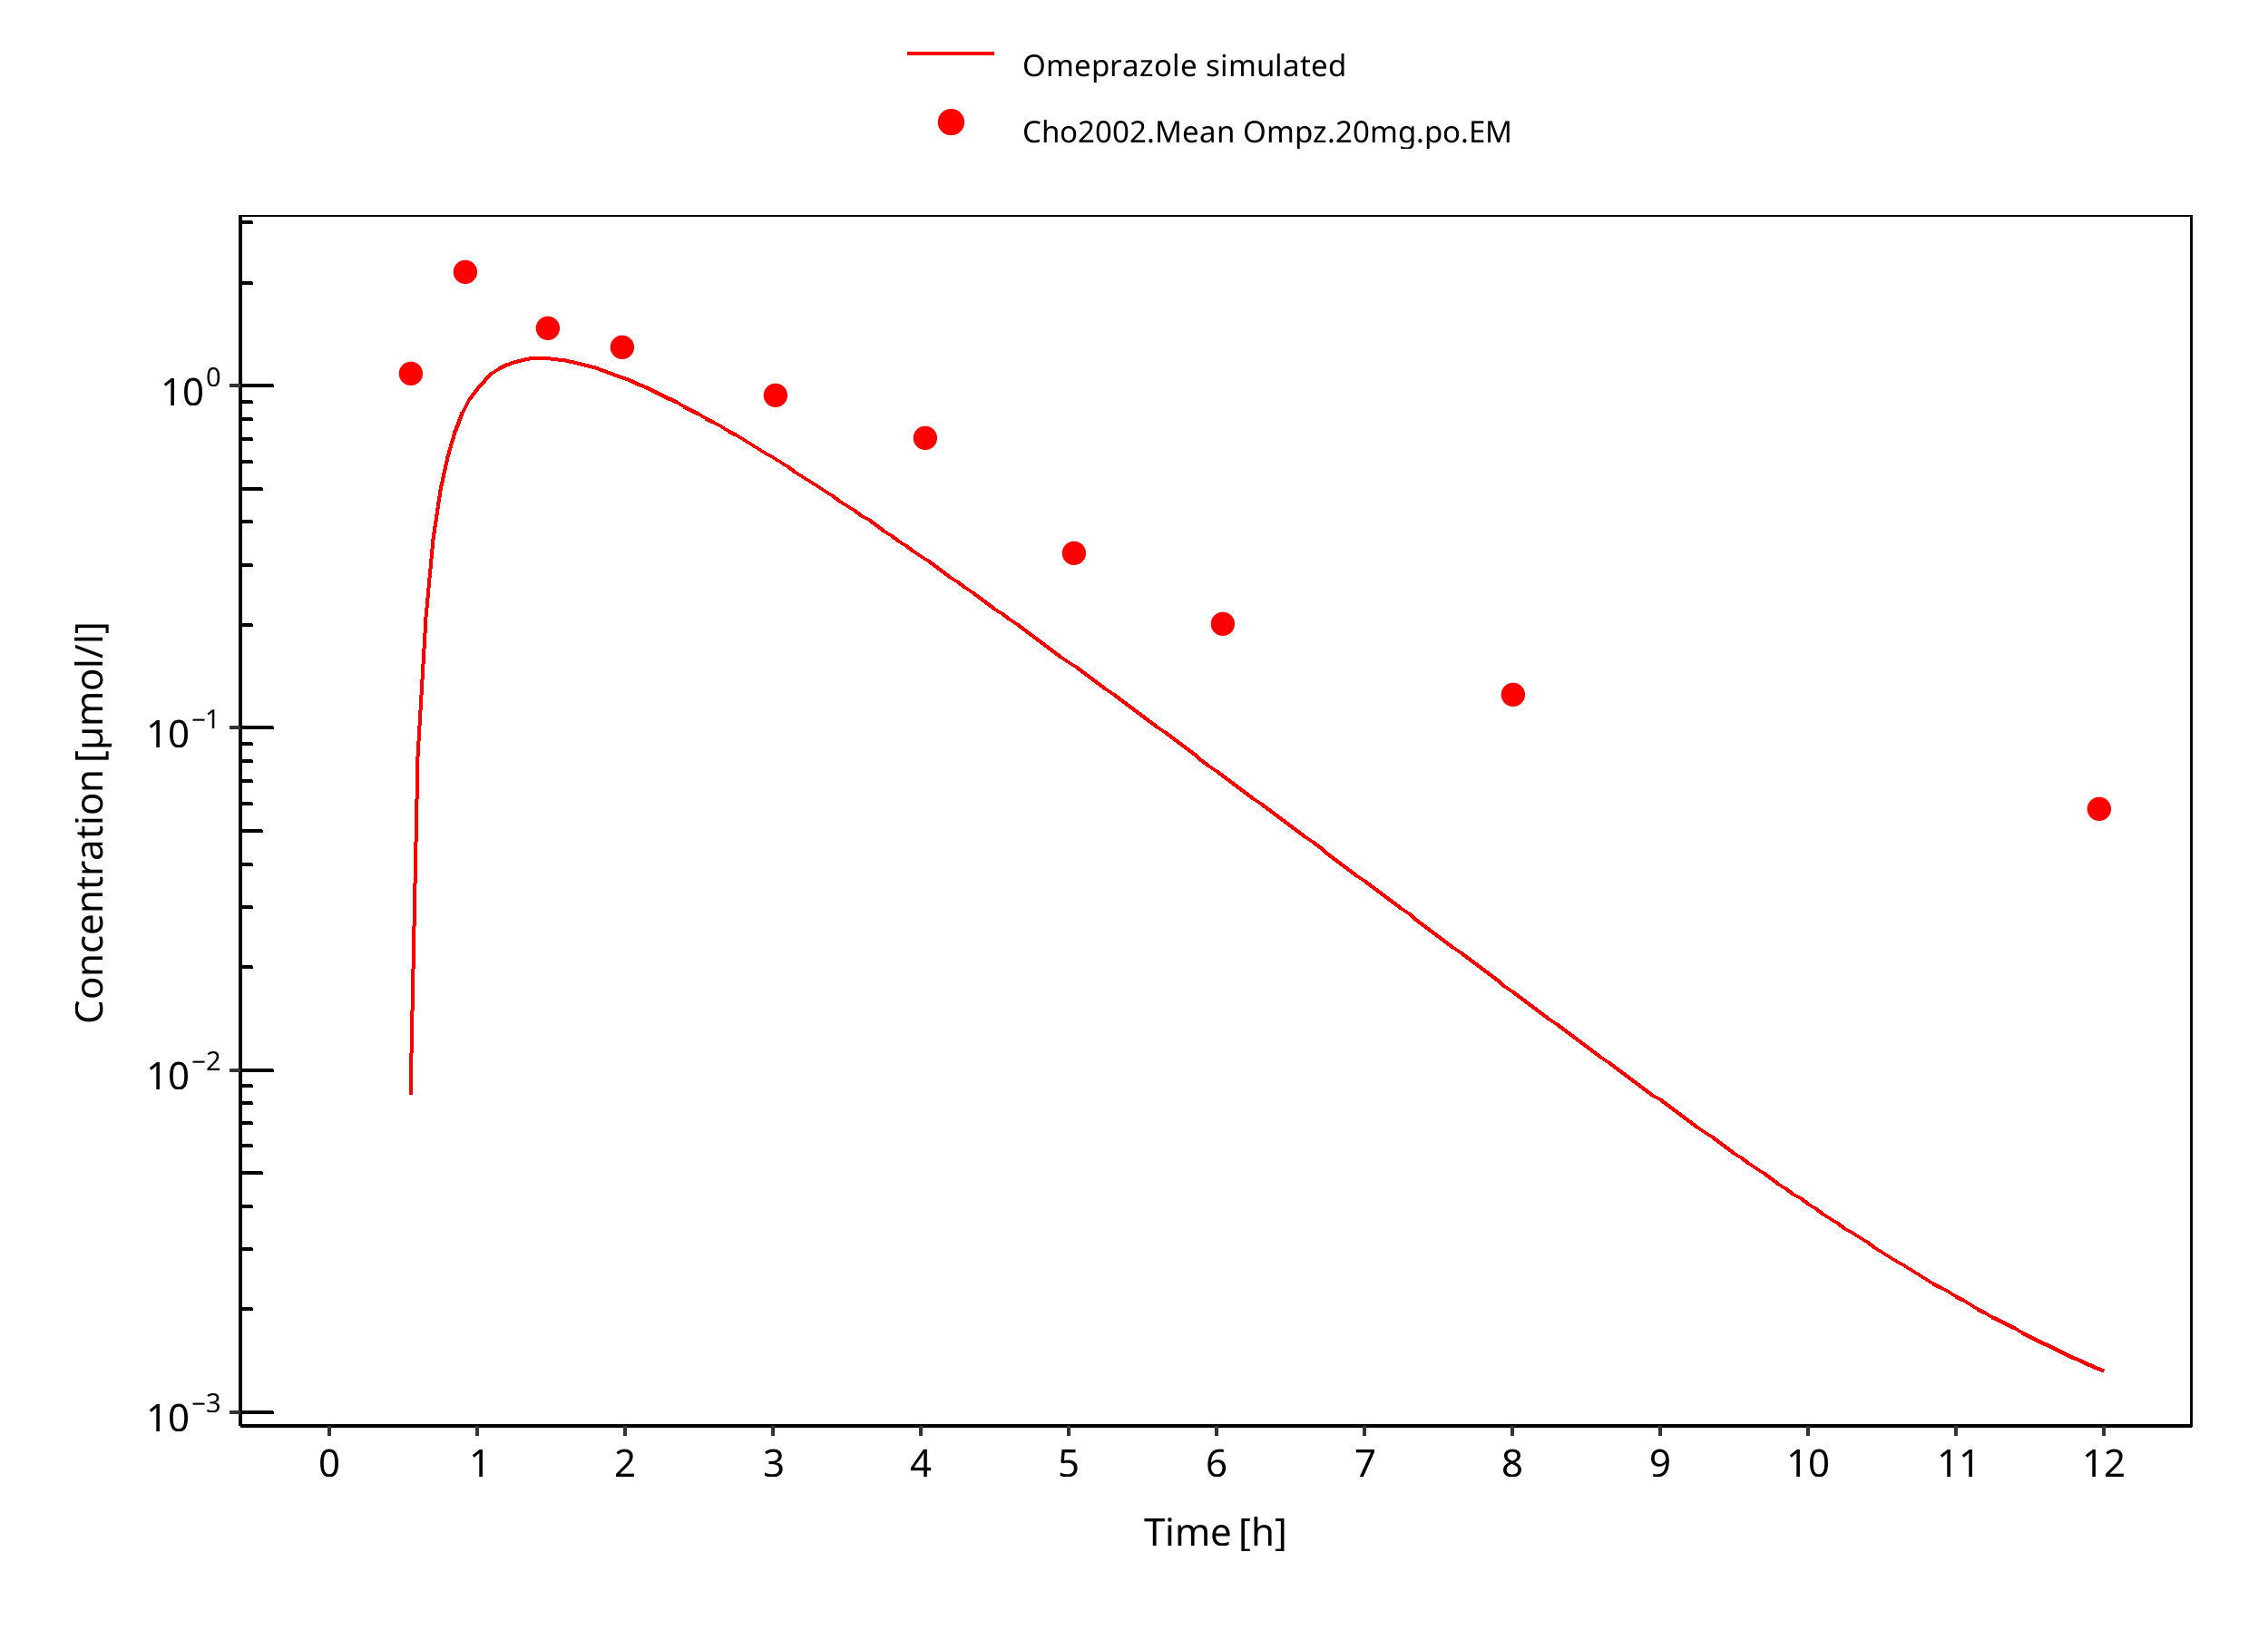
Figure 3-38: 40 mg omeprazole oral capsule
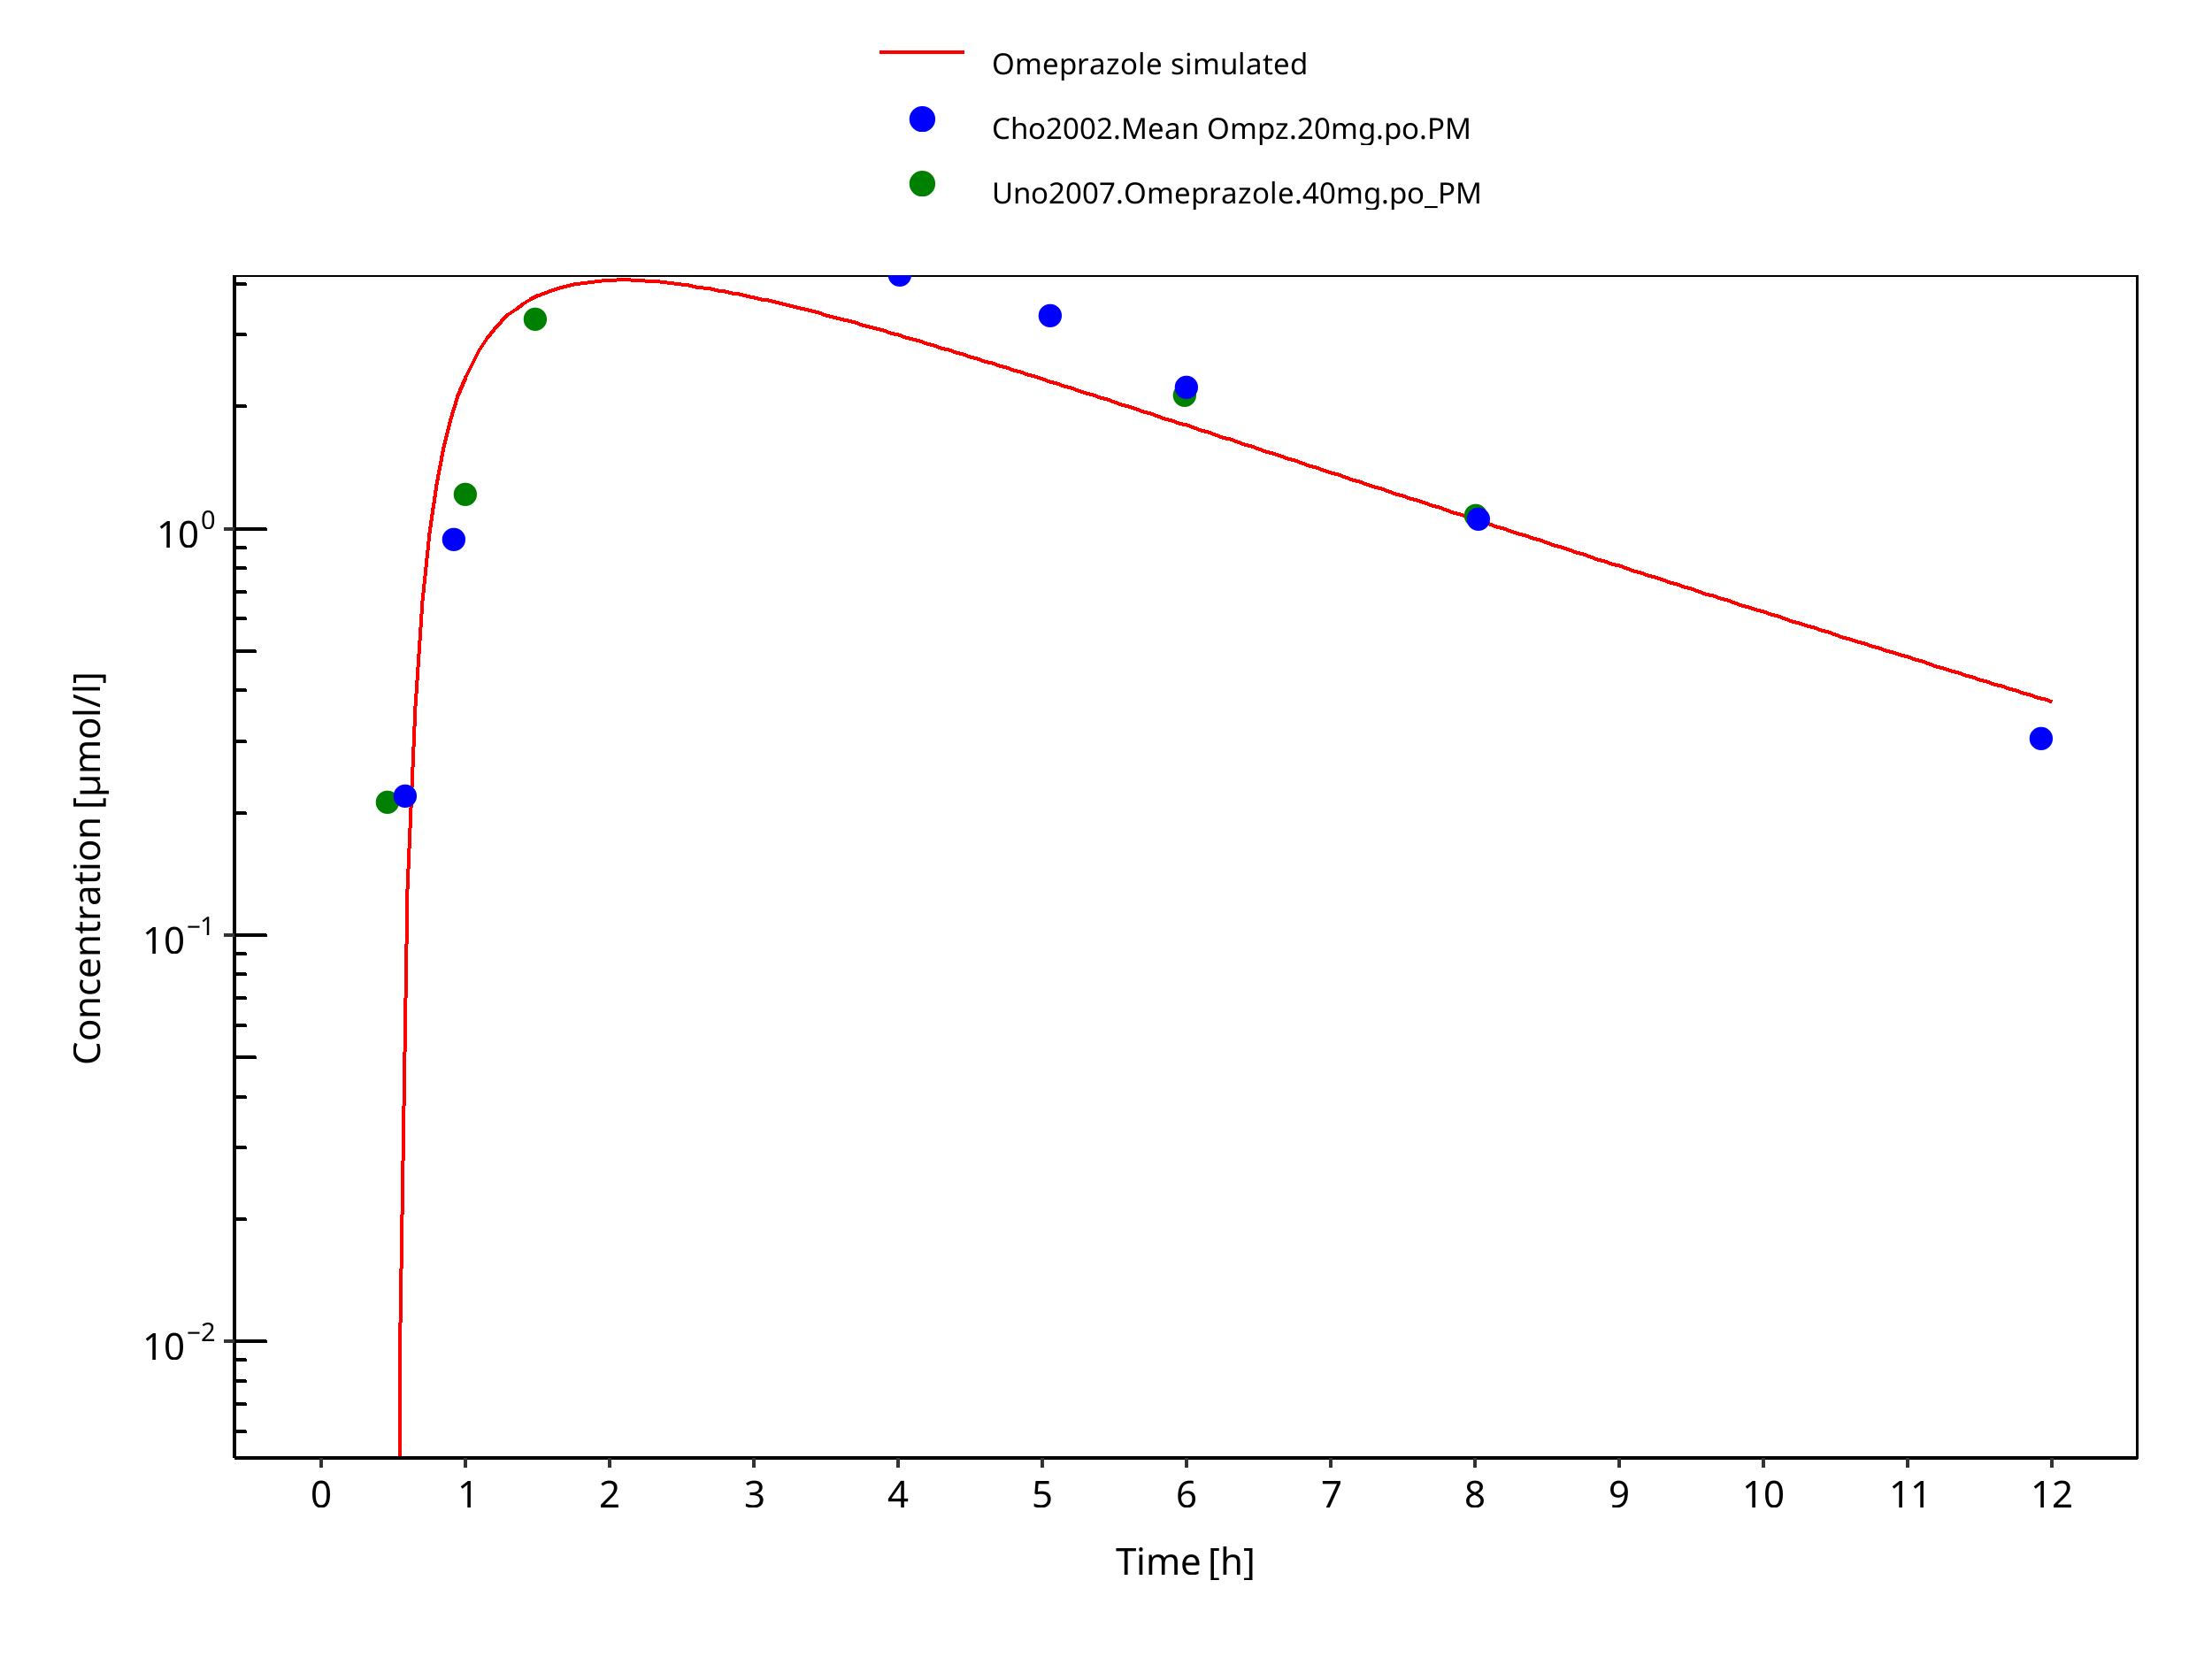
Figure 3-39: 40 mg omeprazole oral capsule PM
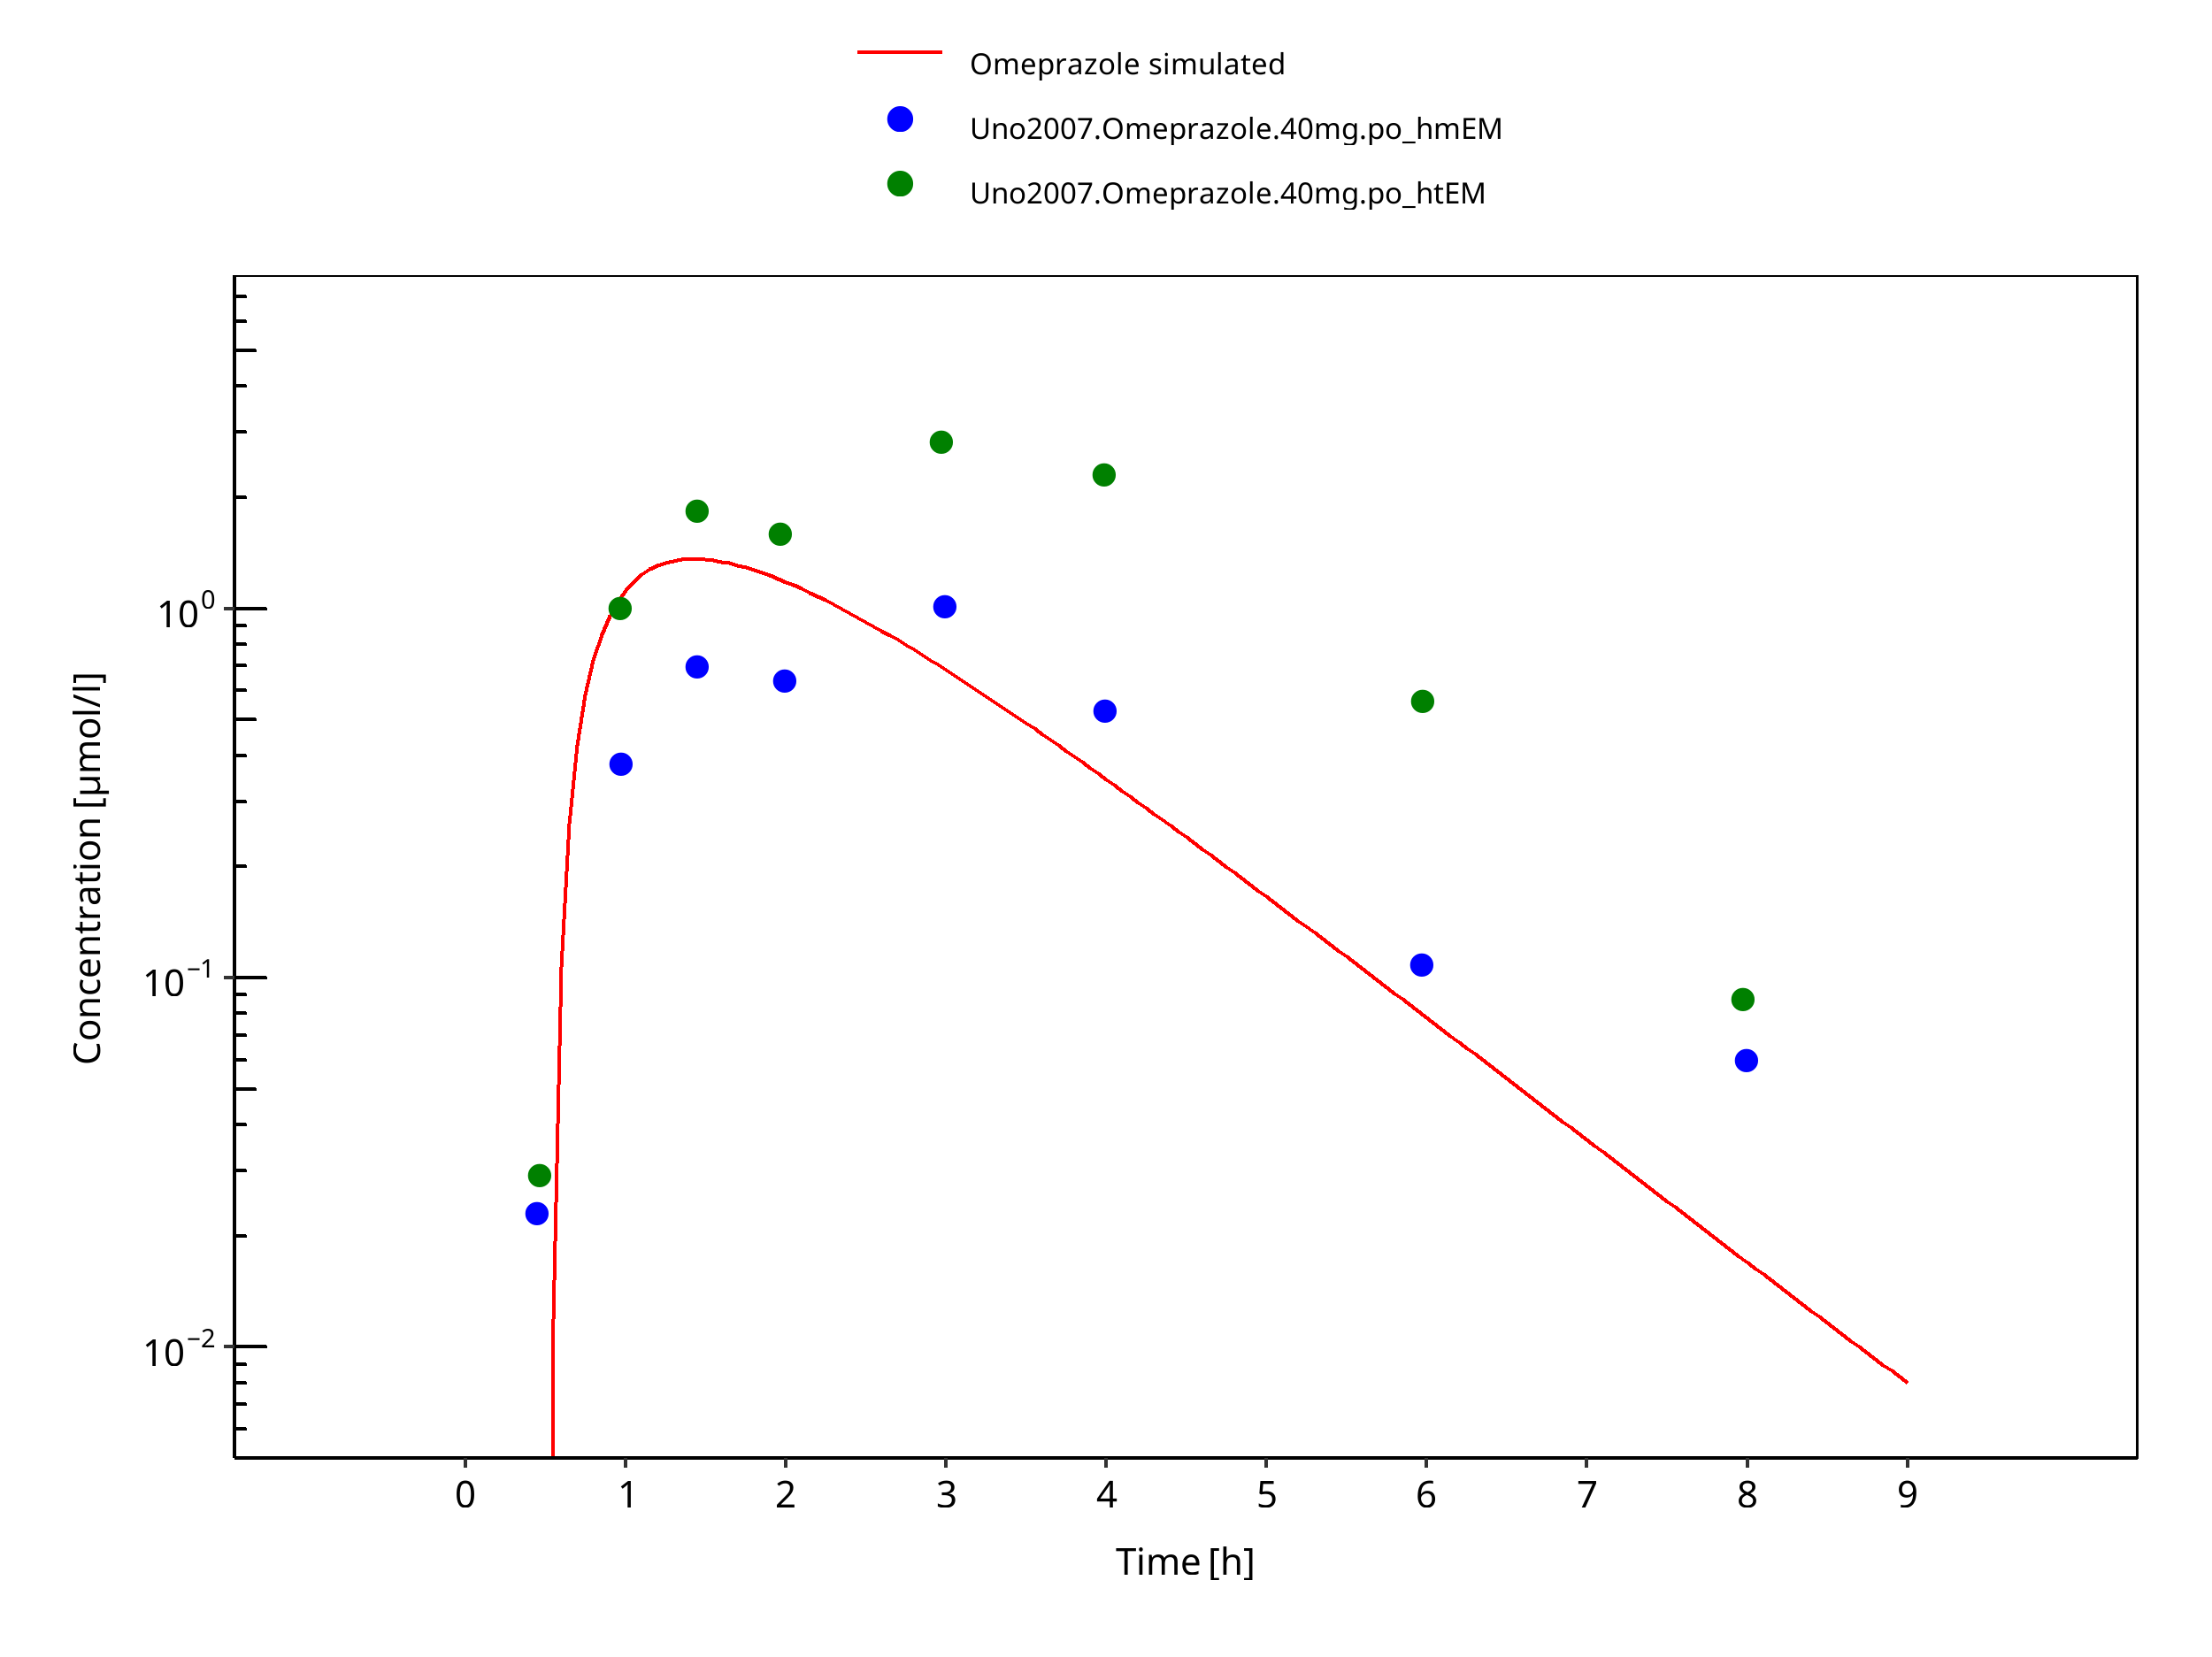
Figure 3-40: 40 mg omeprazole oral capsule Japanese
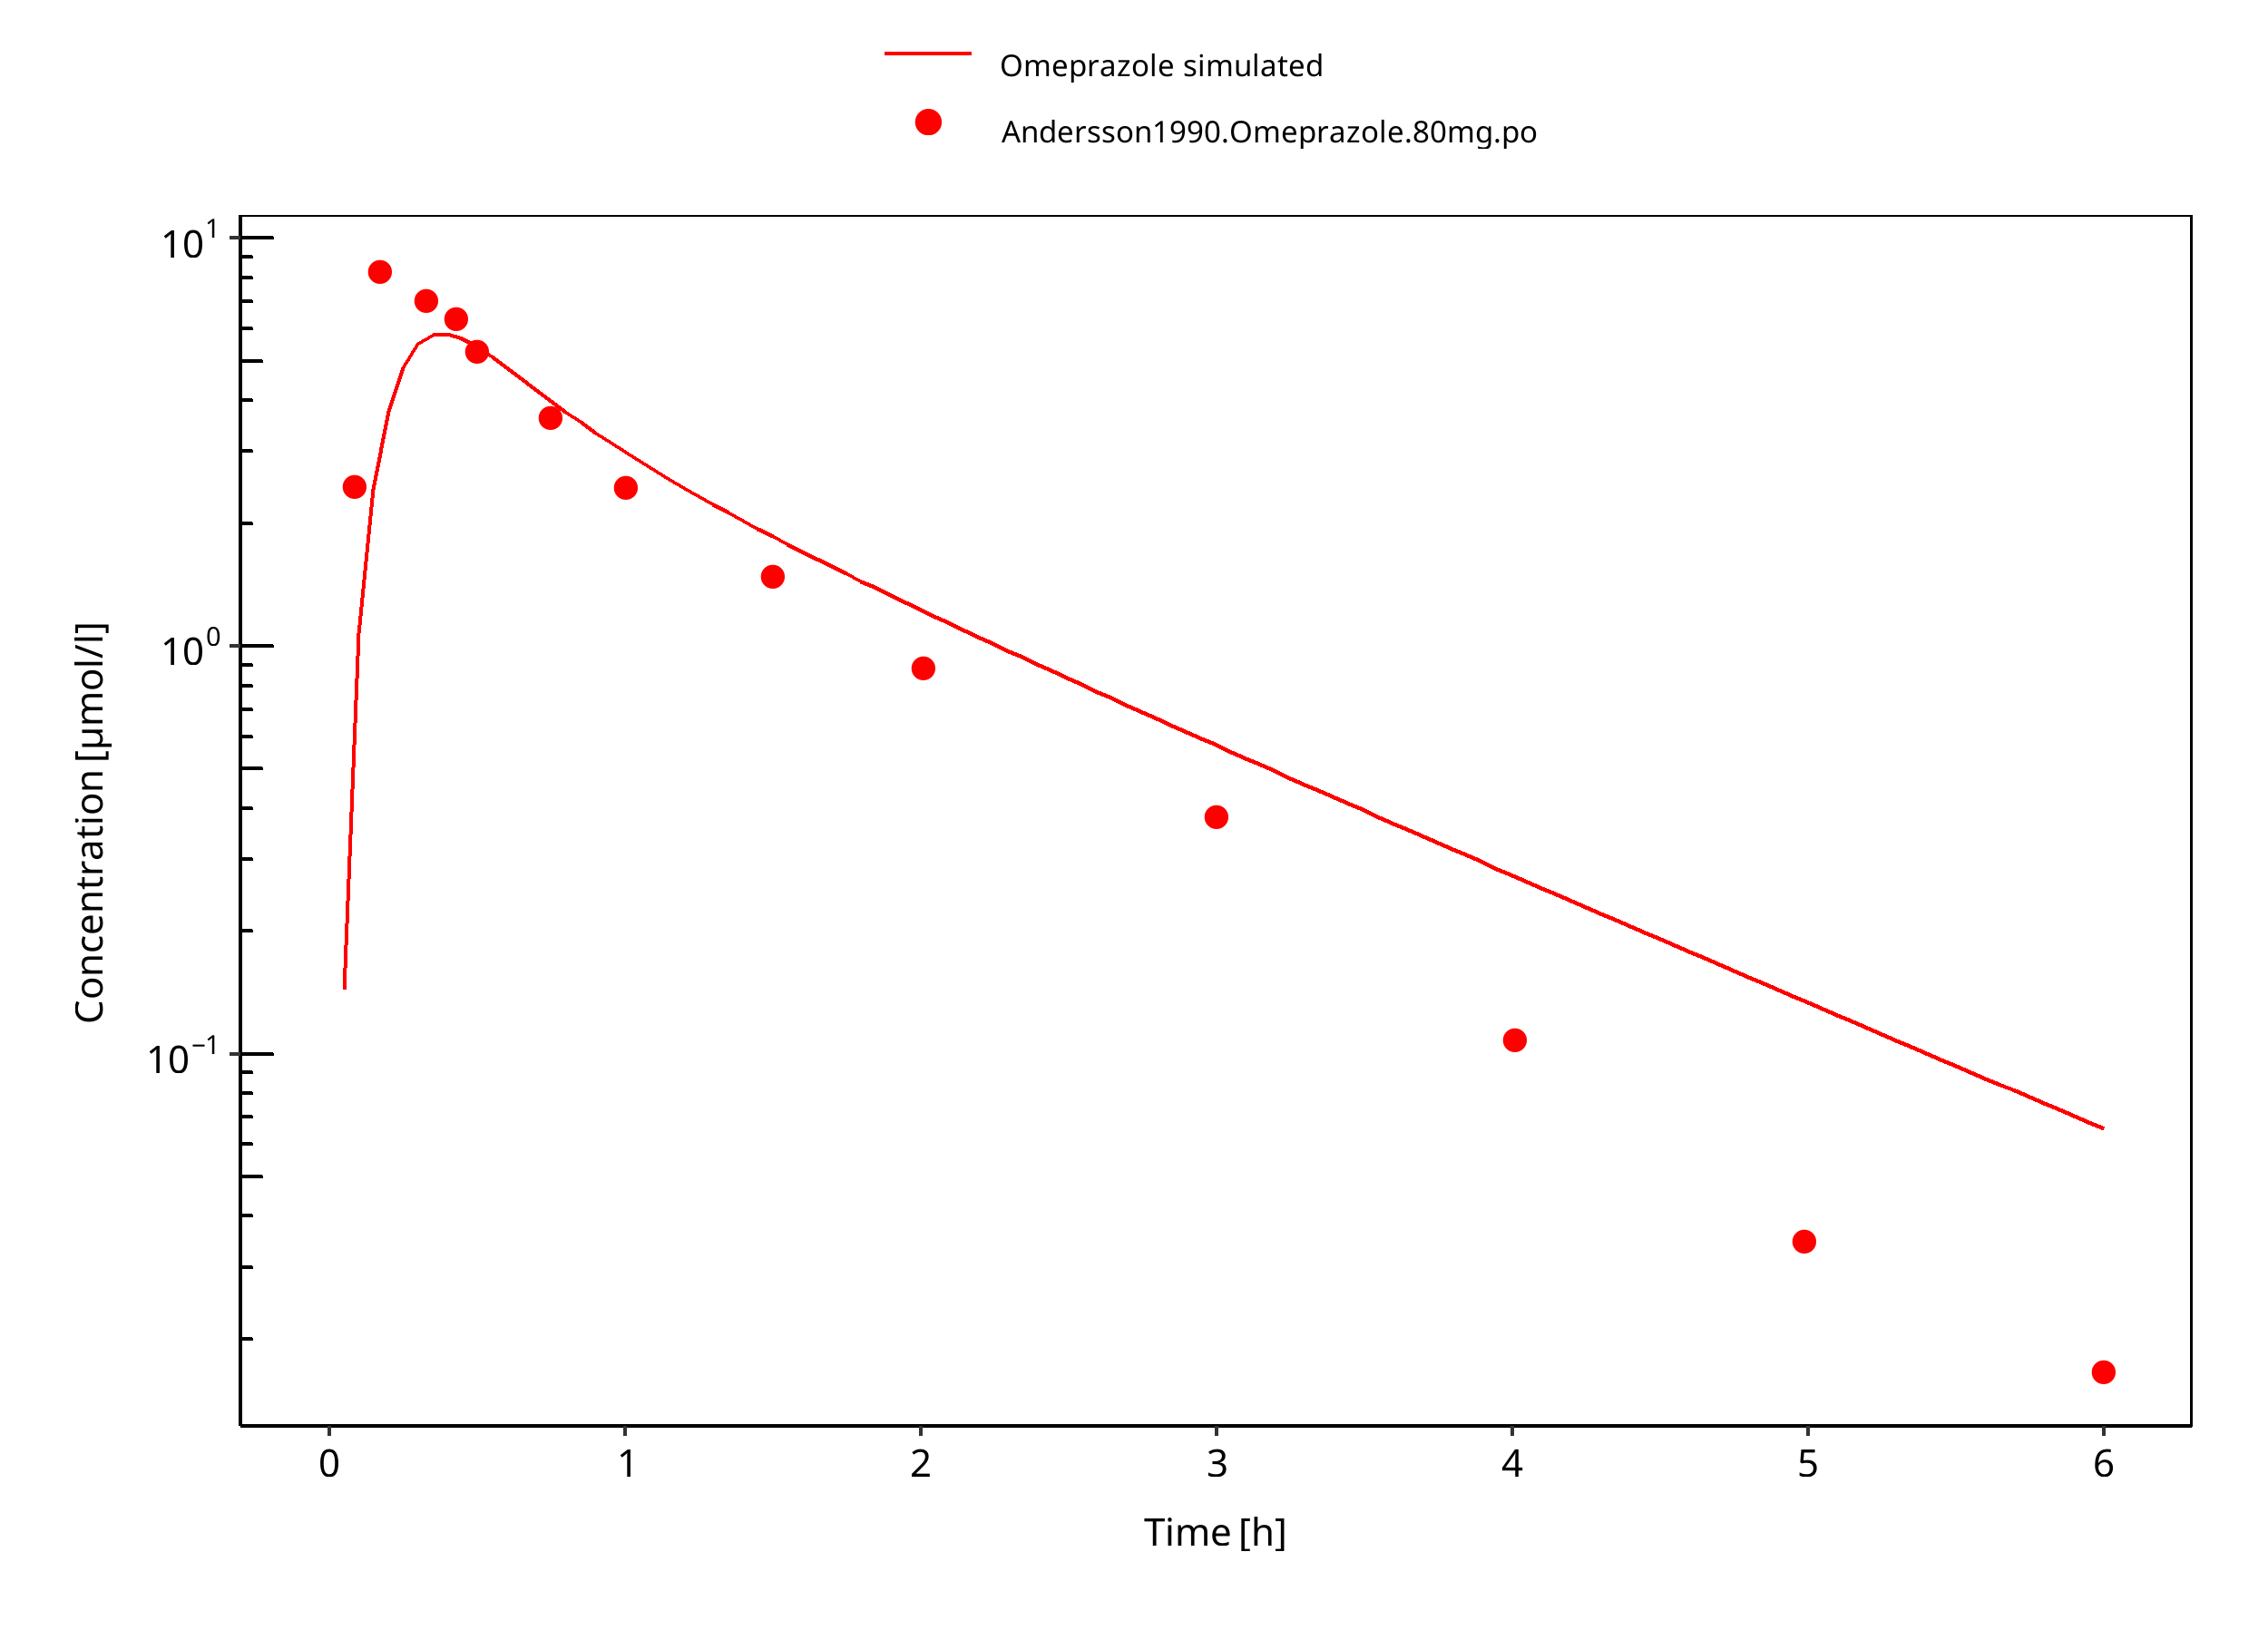
Figure 3-41: 80 mg omeprazole oral solution
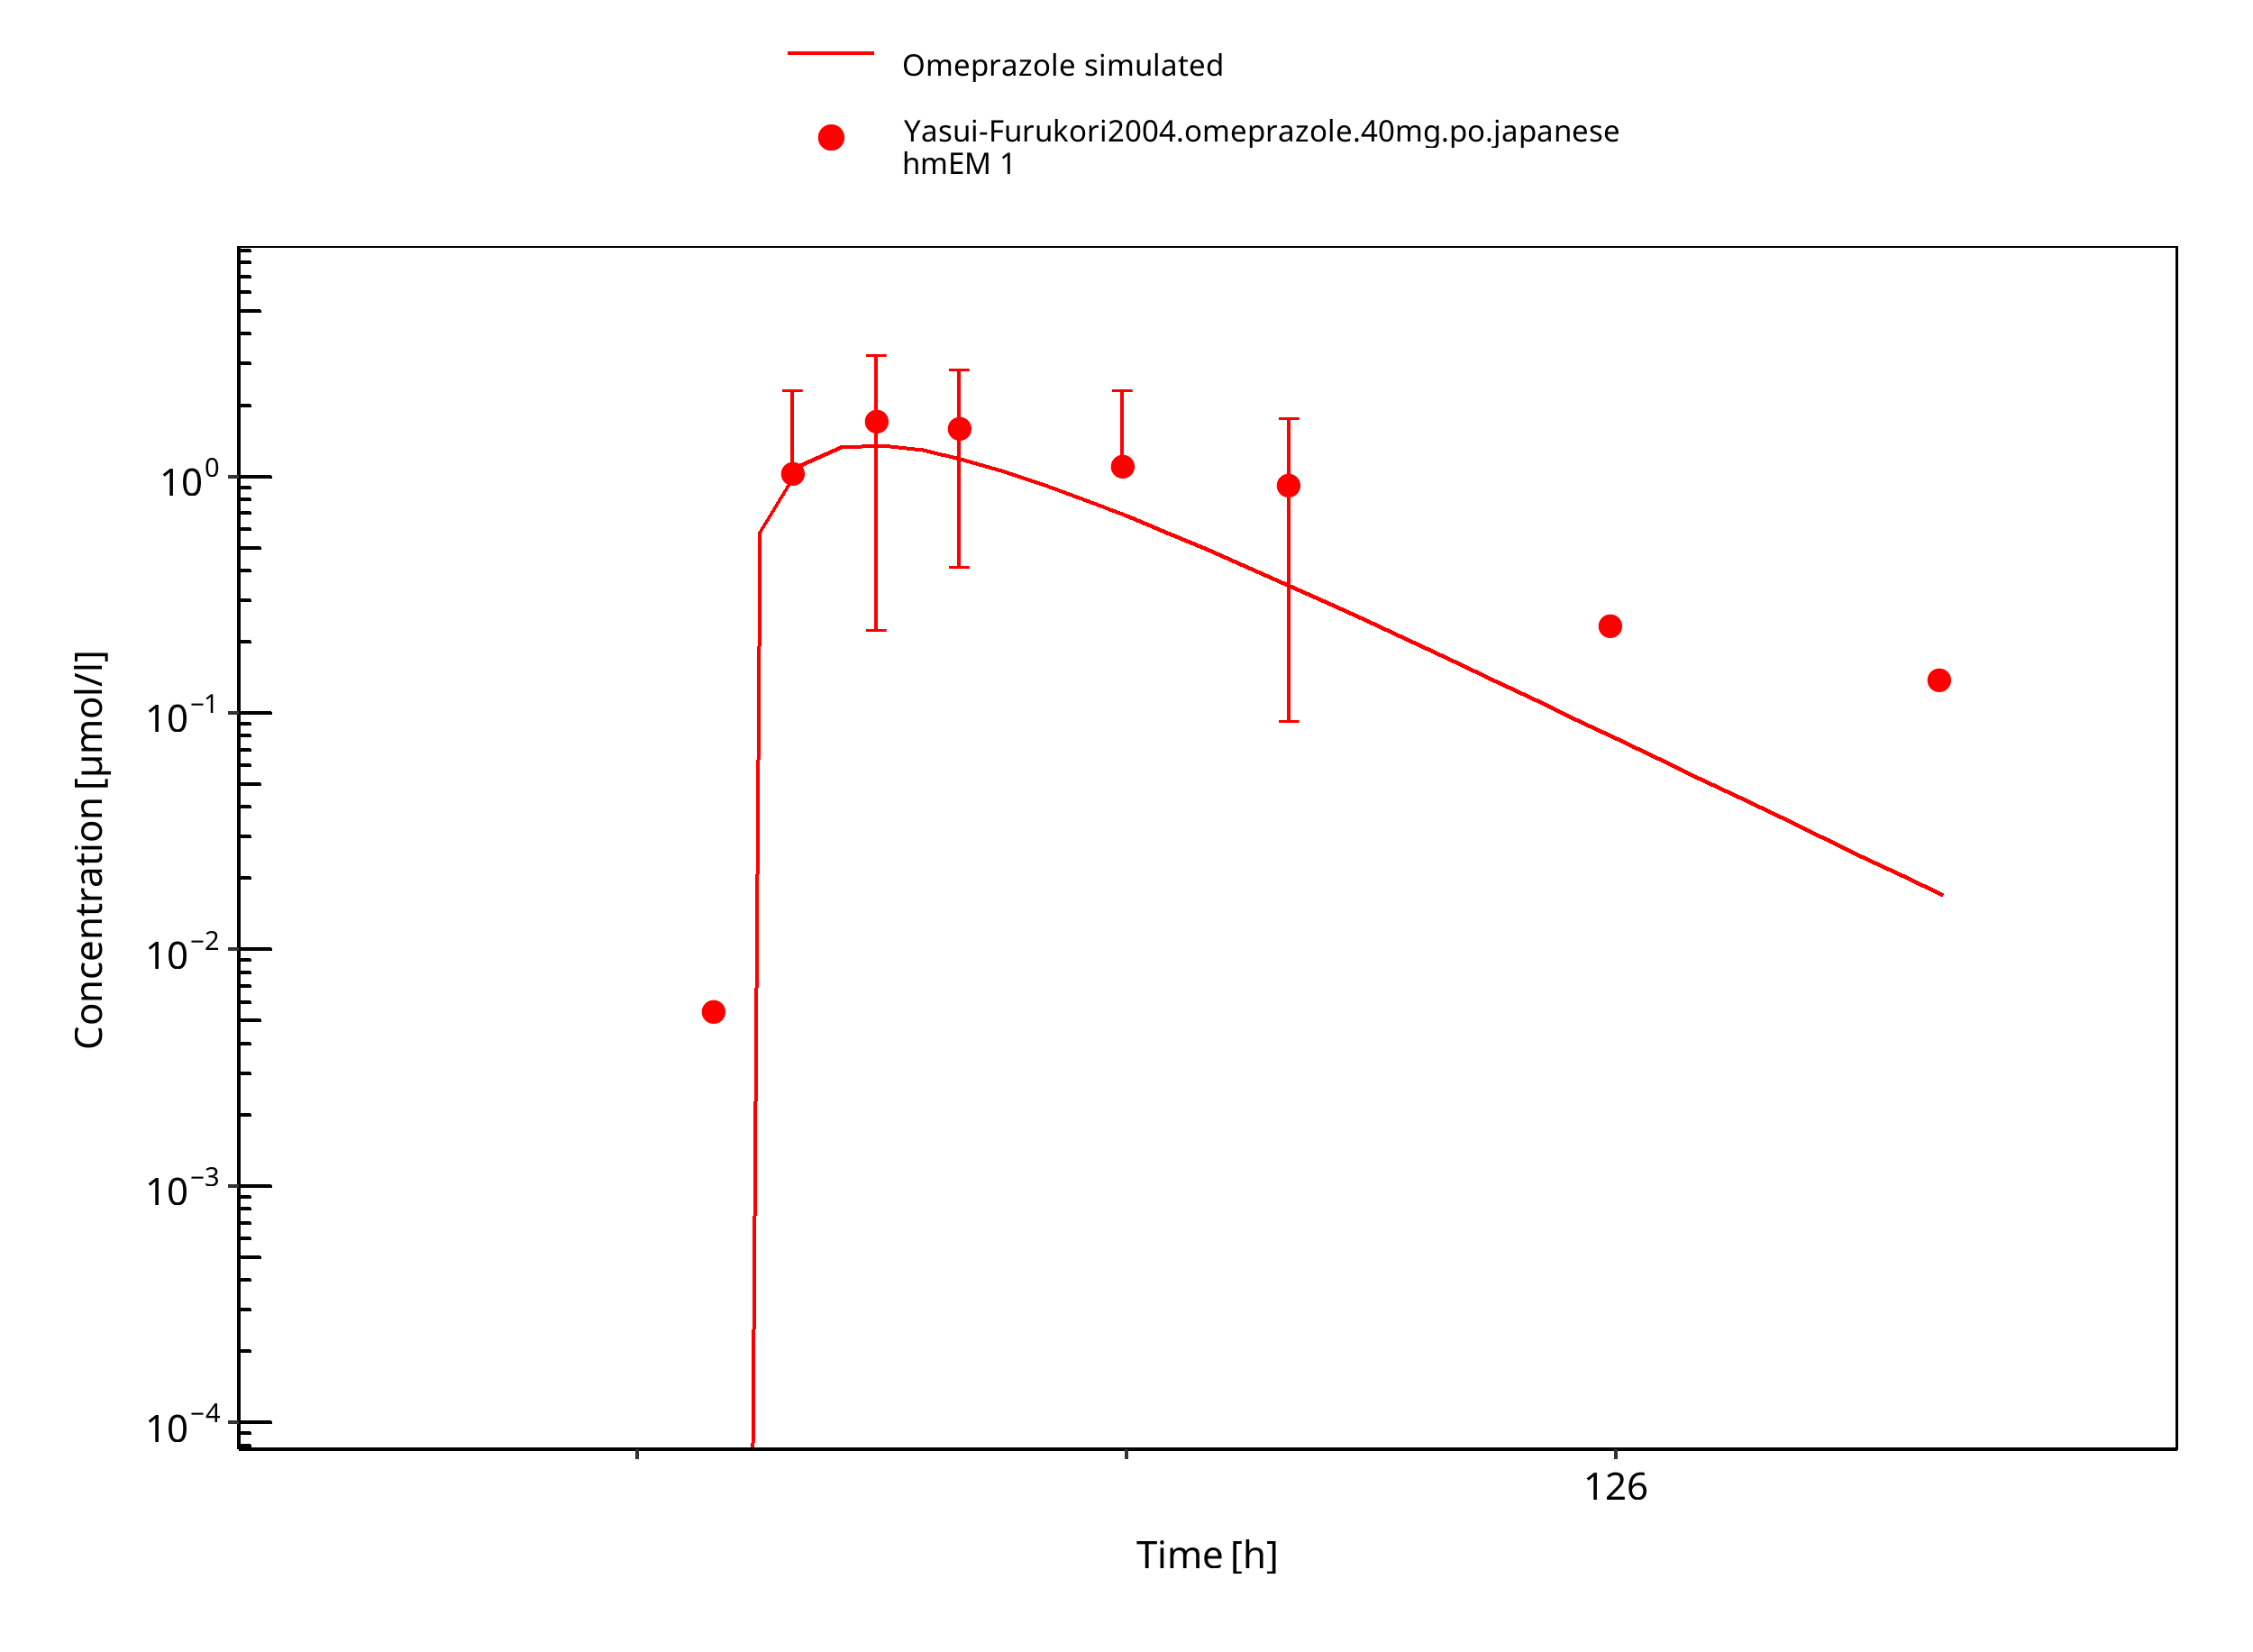
Figure 3-42: 40 mg omeprazole oral capsule
4 Conclusion
The developed PBPK model of omeprazole describes the PK data of S-, R-, and racemat omeprazole in CYP2C19 extensive and poor metabolizers after administrations of single as well as multiple p.o. doses very well.
The assumption for the same distribution model and lipophilicity for R-/S-omeprazole is reasonable, as no i.v. data were available for R-omeprazole.
CYP2C19 expression in gut was reduced according to Olivares-Morales 2016 to better describe R-omeprazole. As CYP2C19 CL and expression are obviously inter-dependent, caution should be used when extrapolating such findings to other CYP2C19 substrates. The impact of the reduced expression of CYP2C19 in gut was therefore investigated for its impact on omeprazole levels.
Comparison of population simulation results with observed data show that the observations were generally within the simulated ranges, both after i.v. and p.o. dosing and for either CYP2C19 EM and PM.
5 References
Andersson 1990 Andersson T, Regårdh CG. Pharmacokinetics of Omeprazole and Metabolites Following Single Intravenous and Oral Doses of 40 and 80mg. Drug Investig. 1990;2(4):255-263.
Andersson 1991 Andersson T, Cederberg C, Heggelund A, Lundborg P. The Pharmacokinetics of Single and Repeated Once-Daily Doses of 10, 20 and 40mg Omeprazole as Enteric-Coated Granules. Drug Investig. 1991;3(1):45-52.
Andersson 1998 Andersson T, Holmberg J, Röhss K, Walan A. Pharmacokinetics and effect on caffeine metabolism of the proton pump inhibitors, omeprazole, lansoprazole, and pantoprazole. Br J Clin Pharmacol. 1998;45(4):369-375.
Andersson 2000 Andersson T, Rohss K, Hassan-Alin M, et al. Pharmacokinetics (PK) and effect on pentagastrin stimulated peak acid output (PAO) of omeprazole (O) and its 2 optical isomers, S-omeprazole/esomeprazole (E) and R-omeprazole (R-O). Gastroenterology. 118(4):A1210
Äbelö 2000 Äbelö A, Andersson TB, Antonsson M, Naudot AK, Skanberg I, Weidolf L. Stereoselective metabolism of omeprazole by human cytochrome P450 enzymes. Drug Metab Dispos. 2000;28(8):966-972.
NCT01983566 Investigation of the effect of food and of increased gastric pH on the relative bioavailability of deleobuvir following single oral administration in healthy Caucasian and Japanese subjects (an open label, randomised, four-way crossover study)
Cho 2002 Cho JY, Yu KS, Jang IJ, Yang BH, Shin SG, Yim DS. Omeprazole hydroxylation is inhibited by a single dose of moclobemide in homozygotic em genotype for CYP2C19. Br J Clin Pharmacol. 2002;53(4):393-397.
DrugBank DB00176 (https://www.drugbank.ca/drugs/DB00176)
FDA Nexium Review FDA – Clinical Pharmacology and Biopharmaceutics Review – Nexium delayed-Release Capsules – Esomeprazole sodium – Application number 21-153/21-154
FDA SPC FDA_ClinPharmReview LuvoxCR, NDA 22-033, FDADrug_42.pdf, website: https://www.accessdata.fda.gov/drugsatfda_docs/nda/2008/022033s000_ClinPharmR.pdf
Galetin and Houston 2006 Galetin A, Houston JB. Intestinal and hepatic metabolic activity of five cytochrome P450 enzymes: impact on prediction of first-pass metabolism. J Pharmacol Exp Ther. 2006;318(3):1220-1229.
Hassan-Alin 2000 Hassan-Alin M, Andersson T, Bredberg E, Rohss K. Pharmacokinetics of esomeprazole after oral and intravenous administration of single and repeated doses to healthy subjects. Eur J Clin Pharmacol. 2000;56(9-10):665-670.
Hassan-Alin 2005 Hassan-Alin M, Andersson T, Niazi M, Röhss K. A pharmacokinetic study comparing single and repeated oral doses of 20 mg and 40 mg omeprazole and its two optical isomers, S-omeprazole (esomeprazole) and R-omeprazole, in healthy subjects. Eur J Clin Pharmacol. 2005;60(11):779-784
Nexium prescribing information Website: https://www.accessdata.fda.gov/drugsatfda_docs/label/2014/022101s014021957s017021153s050lbl.pdf
Kuepfer 2016 Kuepfer L, Niederalt C, Wendl T, Schlender JF, Willmann S, Lippert J, Block M, Eissing T, Teutonico D. Applied Concepts in PBPK Modeling: How to Build a PBPK/PD Model.CPT Pharmacometrics Syst Pharmacol. 2016 Oct;5(10):516-531.
Liu 2005 Liu KH, Kim MJ, Shon JH, et al. Stereoselective inhibition of cytochrome P450 forms by lansoprazole and omeprazole in vitro. Xenobiotica. 2005;35(1):27-38
Ogilvie 2011 Ogilvie BW, Yerino P, Kazmi F, Buckley DB, Rostami-Hodjegan A, Paris BL, et al. The proton pump inhibitor, omeprazole, but not lansoprazole or pantoprazole, is a metabolism-dependent inhibitor of CYP2C19: implications for coadministration with clopidogrel. Drug Metab Dispos. 2011;39(11):2020–33.
Olivares-Morales 2016 Olivares-Morales A, Ghosh A, Aarons L, Rostami-Hodjegan A. Development of a Novel Simplified PBPK Absorption Model to Explain the Higher Relative Bioavailability of the OROS(R) Formulation of Oxybutynin. AAPS J. 2016;18(6):1532-1549.
Oosterhuis 1992 Oosterhuis B, Jonkman JHG, Andersson T, Zuiderwijk PBM. No influence of single intravenous doses of omeprazole on theophylline elimination kinetics. J Clin Pharmacol. 1992;32(5):470-475.
PK-Sim Ontogeny Database Version 7.3 (https://github.com/Open-Systems-Pharmacology/OSPSuite.Documentation/blob/38cf71b384cfc25cfa0ce4d2f3addfd32757e13b/PK-Sim%20Ontogeny%20Database%20Version%207.3.pdf)
Regårdh 1990 Regårdh CG, Andersson T, Lagerstrom PO, Lundborg P, Skanberg I. The pharmacokinetics of omeprazole in humans--a study of single intravenous and oral doses. Ther Drug Monit. 1990;12(2):163-172.
Röhss 2007 Röhss, K., Wilder-Smith, C., Kilhamn, J., Fjellman, M. & Lind, T. Suppression of gastric acid with intravenous esomeprazole and omeprazole: results of 3 studies in healthy subjects. CP 45, 345–354 (2007).
Uno 2007 Uno T, Niioka T, Hayakari M, Yasui-Furukori N, Sugawara K, Tateishi T. Absolute bioavailability and metabolism of omeprazole in relation to CYP2C19 genotypes following single intravenous and oral administrations. Eur J Clin Pharmacol. 2007;63(2):143-149.
Wilder-Smith 2005 Wilder-Smith CH, Bondarov P, Lundgren M, et al. Intravenous esomeprazole (40 mg and 20 mg) inhibits gastric acid secretion as effectively as oral esomeprazole: Results of two randomized clinical studies. Eur J Gastroenterol Hepatol. 2005;17(2):191-197
Willmann 2007 Willmann S, Höhn K, Edginton A, Sevestre M, Solodenko J, Weiss W, Lippert J, Schmitt W. Development of a physiology-based whole-body population model for assessing the influence of individual variability on the pharmacokinetics of drugs. J Pharmacokinet Pharmacodyn 2007, 34(3): 401-431.
Wu 2014 Wu F, Gaohua L, Zhao P, Jamei M, Huang S-M, Bashaw ED, et al. Predicting Nonlinear Pharmacokinetics of Omeprazole Enantiomers and Racemic Drug Using Physiologically Based Pharmacokinetic Modeling and Simulation: Application to Predict Drug/Genetic Interactions. Pharmaceutical Research. 2014 Aug;31(8):1919–29.
Wu 2016 Wu, J., Gießmann, T., Lang, B., Elgadi, M. & Huang, F. Investigation of the effect of food and omeprazole on the relative bioavailability of a single oral dose of 240 mg faldaprevir, a selective inhibitor of HCV NS3/4 protease, in an open-label, randomized, three-way cross-over trial in healthy participants. J Pharm Pharmacol 68, 459–466 (2016).
Yasui-Furukori 2004 Yasui-Furukori N, Takahata T, Nakagami T, et al. Different inhibitory effect of fluvoxamine on omeprazole metabolism between CYP2C19 genotypes. Br J Clin Pharmacol. 2004;57(4):487-494.
6 Glossary
| ADME | Absorption, Distribution, Metabolism, Excretion |
|---|---|
| AUC | Area under the plasma concentration versus time curve |
| AUCinf | AUC until infinity |
| AUClast | AUC until last measurable sample |
| AUCR | Area under the plasma concentration versus time curve Ratio |
| b.i.d. | Twice daily (bis in diem) |
| CL | Clearance |
| Clint | Intrinsic liver clearance |
| Cmax | Maximum concentration |
| CmaxR | Maximum concentration Ratio |
| CYP | Cytochrome P450 oxidase |
| CYP1A2 | Cytochrome P450 1A2 oxidase |
| CYP2C19 | Cytochrome P450 2C19 oxidase |
| CYP3A4 | Cytochrome P450 3A4 oxidase |
| DDI | Drug-drug interaction |
| e.c. | Enteric coated |
| EE | Ethinylestradiol |
| EM | Extensive metabolizers |
| fm | Fraction metabolized |
| FMO | Flavin-containing monooxygenase |
| fu | Fraction unbound |
| FDA | Food and Drug administration |
| GFR | Glomerular filtration rate |
| HLM | Human liver microsomes |
| hm | homozygous |
| ht | heterozygous |
| IM | Intermediate metabolizers |
| i.v. | Intravenous |
| IVIVE | In Vitro to In Vivo Extrapolation |
| Ka | Absorption rate constant |
| kcat | Catalyst rate constant |
| Ki | Inhibitor constant |
| Kinact | Rate of enzyme inactivation |
| Km | Michaelis Menten constant |
| m.d. | Multiple dose |
| OSP | Open Systems Pharmacology |
| PBPK | Physiologically-based pharmacokinetics |
| PK | Pharmacokinetics |
| PI | Parameter identification |
| PM | Poor metabolizers |
| RT-PCR | Reverse transcription polymerase chain reaction |
| p.o. | Per os |
| q.d. | Once daily (quaque diem) |
| SD | Single Dose |
| SE | Standard error |
| s.d.SPC | Single dose Summary of Product Characteristics |
| SD | Standard deviation |
| TDI | Time dependent inhibition |
| t.i.d | Three times a day (ter in die) |
| UGT | Uridine 5'-diphospho-glucuronosyltransferase |
| UM | Ultra-rapid metabolizers |