Building and evaluation of a PBPK model for clarithromycin in healthy adults
| Version | 2.0-OSP12.3 |
|---|---|
| based on Model Snapshot and Evaluation Plan | https://github.com/Open-Systems-Pharmacology/Clarithromycin-Model/releases/tag/v2.0 |
| OSP Version | 12.3 |
| Qualification Framework Version | 3.7 |
This evaluation report and the corresponding PK-Sim project file are filed at:
https://github.com/Open-Systems-Pharmacology/OSP-PBPK-Model-Library/
Table of Contents
- 1 Introduction
- 2 Methods
- 2.1 Modeling Strategy
- 2.2 Data
- 2.3 Model Parameters and Assumptions
- 3 Results and Discussion
- 3.1 Final input parameters
- 3.2 Diagnostics Plots
- 3.3 Concentration-Time Profiles
- 4 Conclusion
- 5 References
1 Introduction
Clarithromycin is a widely prescribed macrolide antibiotic and a substrate and mechanism-based inactivator of CYP3A4. Furthermore, clarithromycin is a substrate and inhibitor of P-gp and an inhibitor of OATP1B1 and OATP1B3 (Eberl 2007, Seithel 2007). Clarithromycin has been proposed as one of the best alternative CYP3A4 inhibitors for clinical DDI studies to avoid further use of ketoconazole.
Objectives were to develop a fully mechanistic PBPK model for clarithromycin, describing its metabolism by CYP3A4 and its mechanism-based inactivation of the respective enzyme as well as its inhibition of P-gp.
The presented clarithromycin model was developed by Moj et al. (Moj 2017) and revised by Hanke et al. (Hanke 2018).
2 Methods
2.1 Modeling Strategy
The general workflow for building an adult PBPK model has been described by Kuepfer et al. (Kuepfer 2016). Relevant information on the anthropometry (height, weight) was gathered from the respective clinical study, if reported. Information on physiological parameters (e.g. blood flows, organ volumes, hematocrit) in adults was gathered from the literature and has been incorporated in PK-Sim® as described previously (Willmann 2007). The applied activity and variability of plasma proteins and active processes that are integrated into PK-Sim® are described in the publicly available 'PK-Sim® Ontogeny Database Version 7.3' (PK-Sim Ontogeny Database Version 7.3).
A typical European individual was used for the development of the clarithromycin model. The relative tissue-specific expression of CYP3A4 was implemented in accordance with literature information using the PK-Sim expression database RT-PCR profile. Enterohepatic recirculation was enabled as it is active under physiological conditions.
Unknown parameters (see Section 2.3.4) were identified using the Parameter Identification module provided in PK-Sim®.
The model was then verified by simulating the PK of additional clinical studies including a dose range of 100 to 1200 mg administered as single dose or as multiple doses.
Details about input data (physicochemical, in vitro and clinical) can be found in Section 2.2.
Details about the structural model and its parameters can be found in Section 2.3.
2.2 Data
2.2.1 In vitro / physicochemical Data
A literature search was performed to collect available information on physiochemical properties of clarithromycin. The obtained information from literature is summarized in the table below.
| Parameter | Unit | Value | Source | Description |
|---|---|---|---|---|
| MW | g/mol | 747.95 | drugbank.ca | Molecular weight |
| pKa (base) | 8.99 | McFarland 1997 | Acid dissociation constant | |
| Solubility (pH) | mg/L | 12170 (2.4) | Salem 2003 | Solubility |
| logP | 2.3 | Lappin 2011 | Partition coefficient between octanol and water | |
| fu | % | 28.0 | Davey 1991 | Fraction unbound in plasma |
| % | 30.0 | Chu 1993b | Fraction unbound in plasma | |
| % | 40.0 | Noreddin 2002 | Fraction unbound in plasma | |
| CYP3A4 Km | µmol/L | 48.7 | Rodrigues 1997 | Michaelis-Menten constant for CYP3A4 metabolism |
| CLren | L/h | 6.66 - 12.8a | Rodvold 1999 | Renal clearance |
| CYP3A4 KI | µmol/L | 2.25 | Polasek 2006 | Conc. for half-maximal inactivation measured in recombinant CYP3A4 |
| µmol/L | 29.5 | Polasek 2006 | Conc. for half-maximal inactivation measured in human liver microsomes | |
| µmol/L | 41.4 | Ito 2003 | Conc. for half-maximal inactivation measured in human liver microsomes for α-hydroxylation of midazolam | |
| µmol/L | 37.0 | Ito 2003 | Conc. for half-maximal inactivation measured in human liver microsomes for 4-hydroxylation of midazolam | |
| µmol/L | 5.49 | Mayhew 2000 | Conc. for half-maximal inactivation measured in human liver microsomes | |
| CYP3A4 kinact | 1/min | 0.04 | Polasek 2006 | Maximum inactivation rate measured in recombinant CYP3A4 |
| 1/min | 0.05 | Polasek 2006 | Maximum inactivation rate measured in human liver microsomes | |
| 1/min | 0.0423 | Ito 2003 | Maximum inactivation rate measured in human liver microsomes for α-hydroxylation of midazolam | |
| 1/min | 0.0459 | Ito 2003 | Maximum inactivation rate measured in human liver microsomes for 4-hydroxylation of midazolam | |
| 1/min | 0.072 | Mayhew 2000 | Maximum inactivation rate measured in human liver microsomes | |
| P-gp Ki | µmol/L | 4.1 | Eberl 2007 | Conc. for half-maximal inhibition |
| OATP1B1 IC50 | µmol/L | 5.3 ± 1.3b | Vermeer 2016 | Half-maximal inhibitory concentration |
| OATP1B3 IC50 | µmol/L | 14 ± 2b | Vermeer 2016 | Half-maximal inhibitory concentration |
a denotes range of reported values
b denotes mean ± standard error of the mean of the measurements (two assays, each performed in triplicate)
2.2.2 Clinical Data
A literature search was performed to collect available clinical data on clarithromycin in healthy adults. The clarithromycin model was developed using 17 clinical studies covering a dosing range from 100 to 1200 mg.
2.2.2.1 Model Building
The following studies were used for model building (training data):
| Publication | Arm / Treatment / Information used for model building |
|---|---|
| Chu 1992b | Healthy subjects with intravenous infusion of 250 mg over 45 min |
| Chu 1993a | Healthy subjects with oral administration of 250 or 500 mg as single dose or twice daily for 5 days |
2.2.2.2 Model Verification
The following studies were used for model verification (test data):
| Publication | Arm / Treatment / Information used for model building |
|---|---|
| Chu 1992a | Healthy Subjects with oral administration of single doses ranging from 100 to 1200 mg |
| Kees 1995 | Healthy subjects with oral administration of 250 or 500 mg as single or multiple dose |
| Rengelshausen 2003 | Oral administration of 250 mg twice a day for 1.5 days |
| Abduljalil 2009 | Oral administration of 500 mg twice a day for 3.5 days |
2.3 Model Parameters and Assumptions
2.3.1 Absorption
The specific intestinal permeability was optimized during parameter identification to accurately describe the absorption of clarithromycin after oral administration.
2.3.2 Distribution
Values for lipophilicity and fraction unbound in plasma were fixed to literature values (namely to 2.3 (Lappin 2011) and 0.30 (Chu 1993b) for lipophilicity and fraction unbound, respectively).
It was not possible to adequately describe the observed plasma concentration-time profile after intravenous administration using standard input parameters (e.g. lipophilicity) and calculation methods. Simulated concentration-time profiles overestimated Cmax and underestimated the observed data for time to Cmax (Tmax). According to literature data, clarithromycin accumulates in mononuclear and polymorphonuclear leukocytes, probably via active transport (Ishiguro 1989). Implementing this process in the model improved the model fit significantly. Due to limited knowledge on this active transport, this process was technically implemented in the model by adjusting the permeability of clarithromycin across the membrane of the red blood cells (P (blood cells->plasma) and P (plasma->blood cells)).
After testing the available organ-plasma partition coefficient and cell permeability calculation methods built in PK-Sim, observed clinical data was best described by choosing the partition coefficient calculation by Rodgers and Rowland and cellular permeability calculation by PK-Sim Standard.
2.3.3 Metabolism and Elimination
Metabolism was described using Michaelis-Menten kinetics, while the Michaelis-Menten constant Km was taken from in-vitro experiments from literature and the turnover rate kcat was optimized during parameter identification.
KI and kinact to describe the mechanism-based inhibition of CYP3A4 were optimized during parameter identification.
A kidney plasma clearance was implemented to describe the renal elimination of clarithromycin. The specific renal clearance was optimized during parameter identification.
2.3.4 Automated Parameter Identification
This is the result of the final parameter identification.
| Model Parameter | Optimized Value | Unit |
|---|---|---|
kcat (CYP3A4) |
76.5 | 1/min |
Specific clearance in process renal clearance |
0.87 | 1/min |
Specific intestinal permeability |
1.23 E-6 | dm/min |
P (plasma->blood cells) |
3.62 E-5 | dm/min |
P (blood cells->plasma) |
1.04 E-6 | dm/min |
K_kinact_half (KI) |
6.04 | µmol/L |
kinact (kinact) |
0.04 | 1/min |
3 Results and Discussion
The PBPK model for clarithromycin was developed and verified with clinical pharmacokinetic data.
The model was evaluated covering data from studies including in particular
- intravenous and oral administrations
- a dose range of 100 mg to 1200 mg
- single and multiple doses
The model quantifies metabolism via CYP3A4, including also the mechanism-based inhibition of the respective enzyme, as well as elimination via kidney. The model also includes inhibition of P-gp.
The next sections show:
- the final model parameters for the building blocks: Section 3.1.
- the overall goodness of fit: Section 3.2.
- simulated vs. observed concentration-time profiles for the clinical studies used for model building and for model verification: Section 3.3.
3.1 Final input parameters
The compound parameter values of the final PBPK model are illustrated below.
Compound: Clarithromycin
Parameters
| Name | Value | Value Origin | Alternative | Default |
|---|---|---|---|---|
| Solubility at reference pH | 12.17 mg/ml | Publication-Salem 2003 | Measurement | True |
| Reference pH | 2.4 | Publication-Salem 2003 | Measurement | True |
| Lipophilicity | 2.3 Log Units | Publication-Lappin 2011 | Measurement | True |
| Fraction unbound (plasma, reference value) | 0.3 | Publication-Chu 1993 | Measurement | True |
| Specific intestinal permeability (transcellular) | 1.23E-06 dm/min | Parameter Identification-optimized | fit | True |
| Is small molecule | Yes | |||
| Molecular weight | 747.9534 g/mol | |||
| Plasma protein binding partner | Albumin |
Calculation methods
| Name | Value |
|---|---|
| Partition coefficients | Rodgers and Rowland |
| Cellular permeabilities | PK-Sim Standard |
Processes
Metabolizing Enzyme: CYP3A4-fit
Molecule: CYP3A4
Parameters
| Name | Value | Value Origin |
|---|---|---|
| In vitro Vmax for liver microsomes | 0 pmol/min/mg mic. protein | |
| Km | 48.7 µmol/l | Publication-Rodrigues 1997 |
| kcat | 76.5 1/min | Parameter Identification |
Systemic Process: Renal Clearances-fitted
Species: Human
Parameters
| Name | Value | Value Origin |
|---|---|---|
| Body weight | 71.5 kg | Unknown |
| Blood flow rate (kidney) | 1.31 l/min | Unknown |
| Fraction unbound (experiment) | 0.4 | |
| Plasma clearance | 1.75 ml/min/kg |
Inhibition: P-gp-Eberl (2007)
Molecule: P-gp
Parameters
| Name | Value | Value Origin |
|---|---|---|
| Ki | 4.1 µmol/l | Publication-Eberl 2007 |
Inhibition: CYP3A4-fitted
Molecule: CYP3A4
Parameters
| Name | Value | Value Origin |
|---|---|---|
| kinact | 0.04 1/min | |
| K_kinact_half | 6.04 µmol/l |
Inhibition: OATP1B1-Vermeer 2016
Molecule: OATP1B1
Parameters
| Name | Value | Value Origin |
|---|---|---|
| Ki | 5.3 µmol/l | Publication-Vermeer 2016 |
Inhibition: OATP1B3-Vermeer 2016
Molecule: OATP1B3
Parameters
| Name | Value | Value Origin |
|---|---|---|
| Ki | 14 µmol/l | Publication-Vermeer 2016 |
Formulation: Tablet Clarithromycin
Type: Weibull
Parameters
| Name | Value | Value Origin |
|---|---|---|
| Dissolution time (50% dissolved) | 5 min | |
| Lag time | 0 min | |
| Dissolution shape | 2.9 | |
| Use as suspension | No |
3.2 Diagnostics Plots
Below you find the goodness-of-fit visual diagnostic plots for the PBPK model performance of all data used presented in Section 2.2.2.
The first plot shows simulated versus observed plasma concentrations, the second weighted residuals versus time.
Table 3-1: GMFE for Goodness of fit plot for concentration in plasma
| Group | GMFE |
|---|---|
| model building | 1.21 |
| model evaluation | 1.62 |
| All | 1.58 |
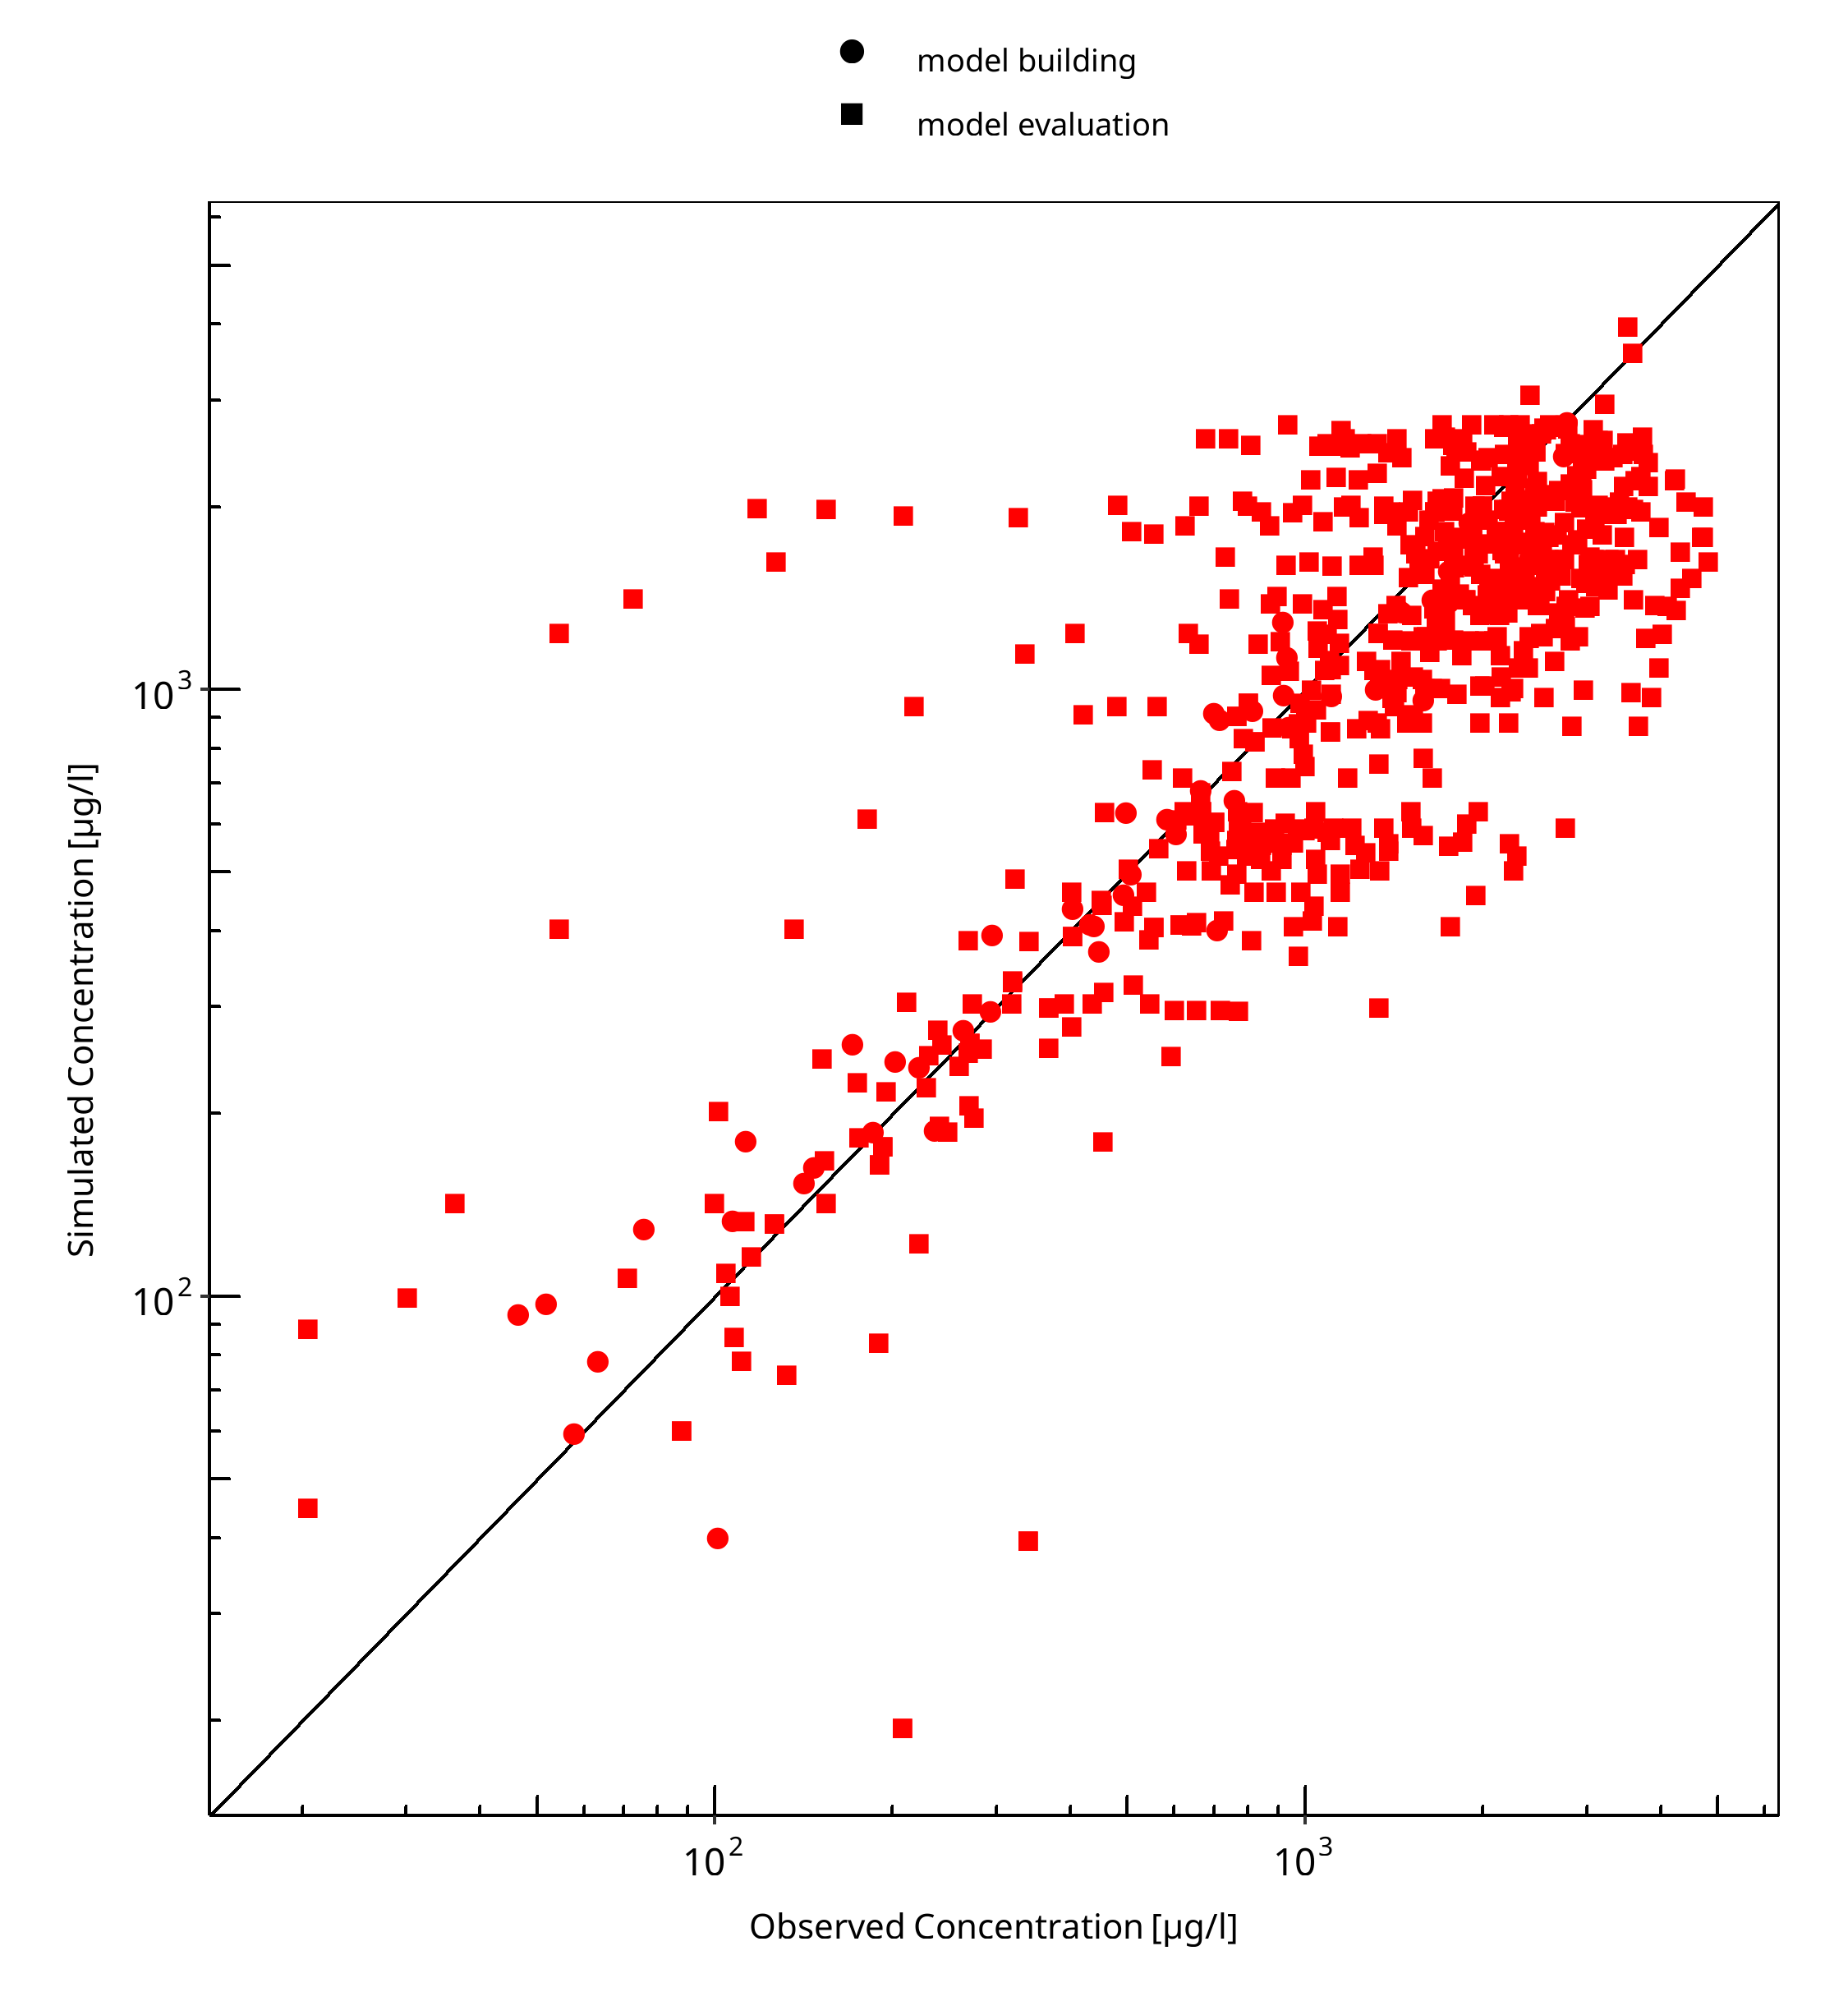
Figure 3-1: Goodness of fit plot for concentration in plasma
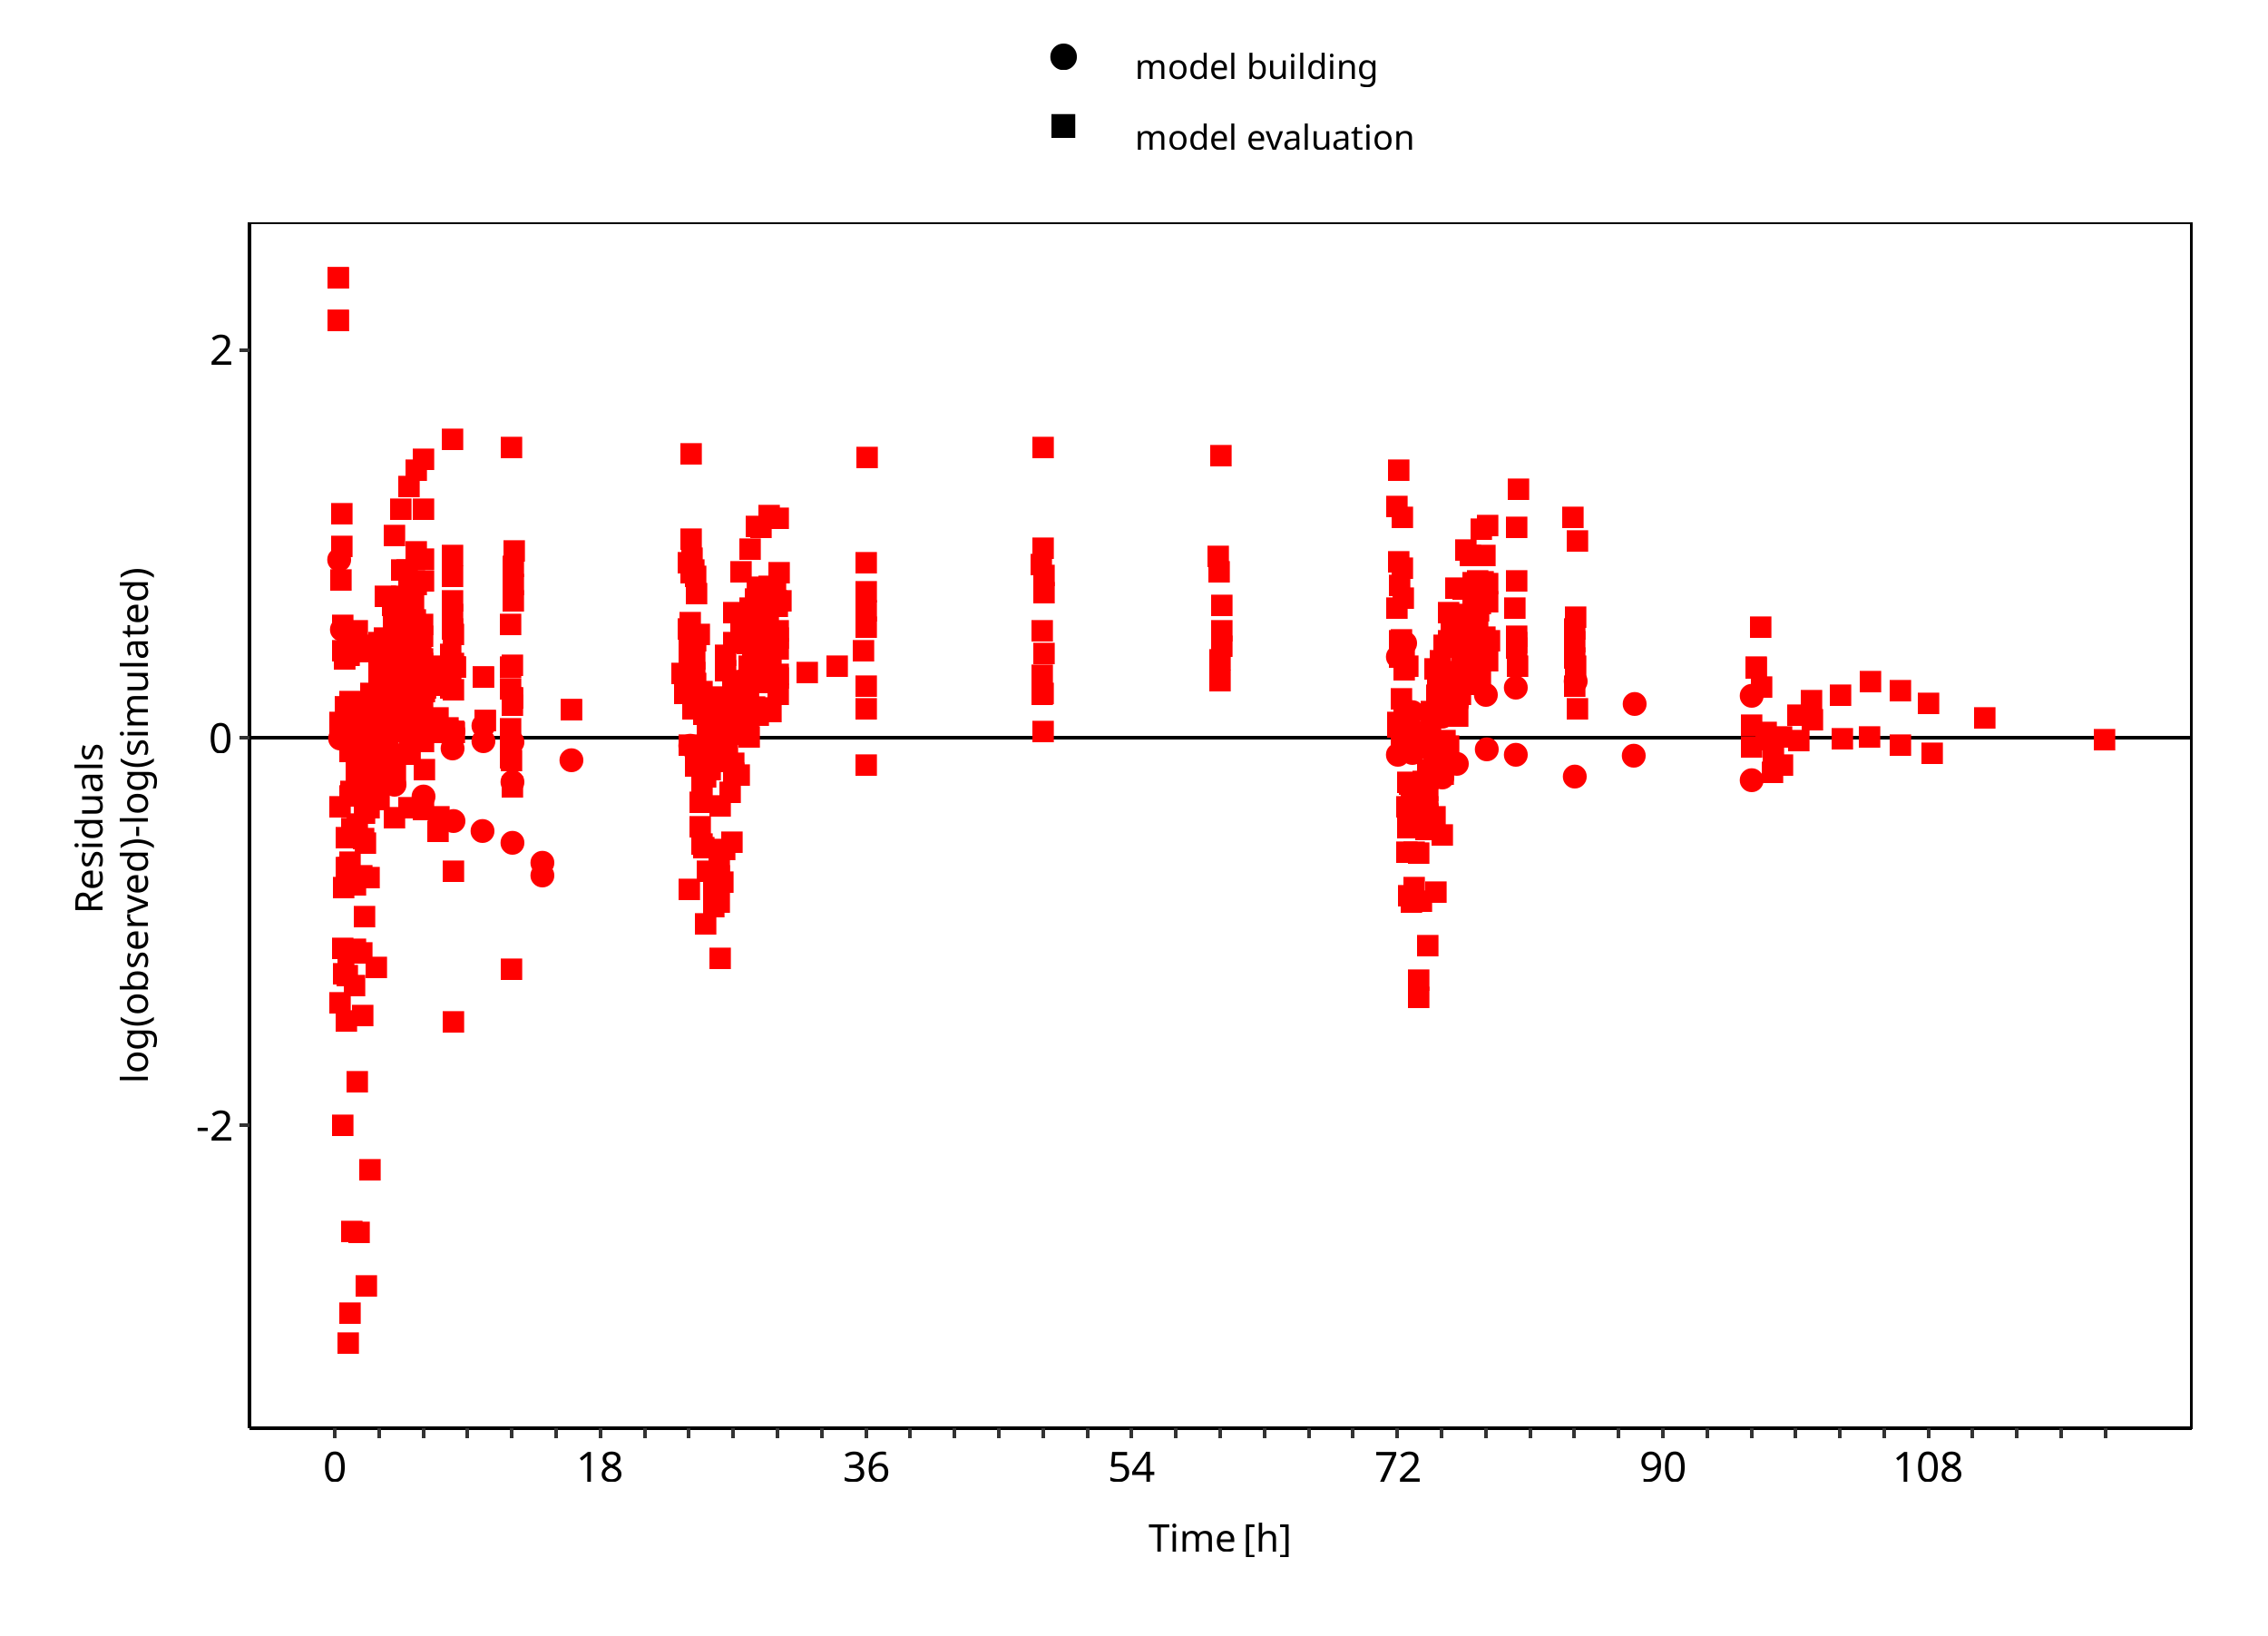
Figure 3-2: Goodness of fit plot for concentration in plasma
3.3 Concentration-Time Profiles
Simulated versus observed concentration-time profiles of all data listed in Section 2.2.2 are presented below.
3.3.1 Model Building
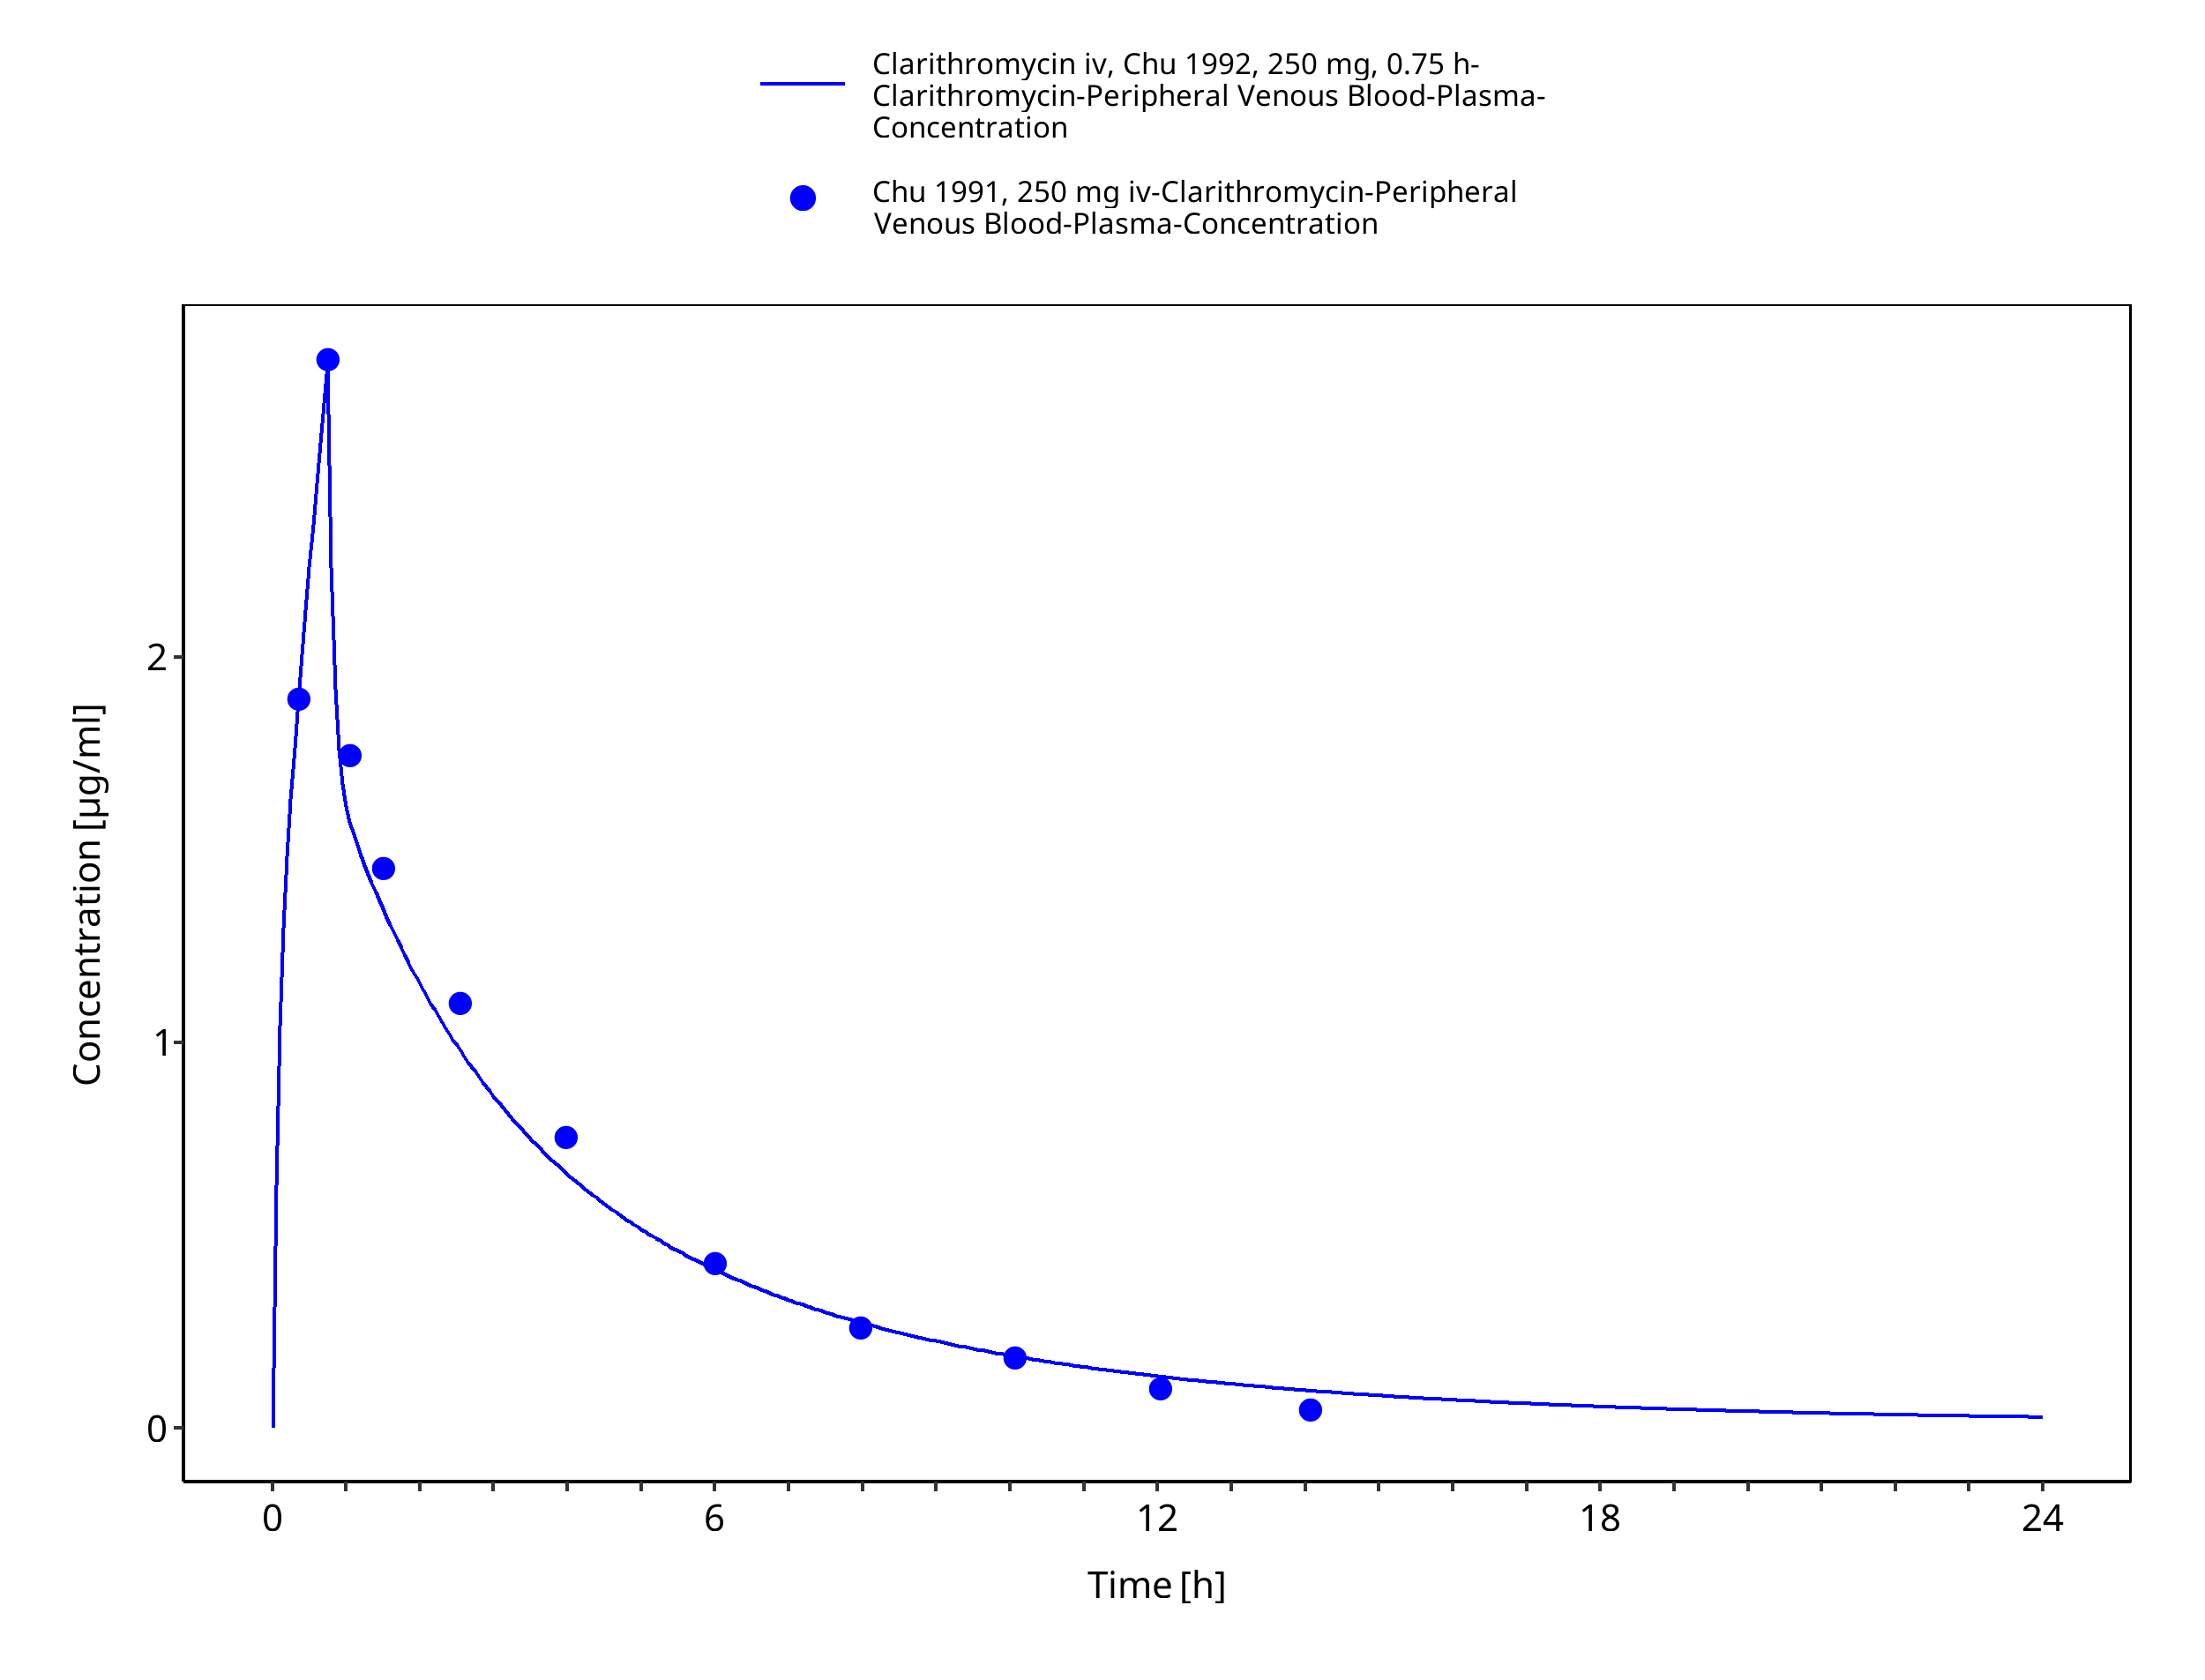
Figure 3-3: Time Profile Analysis
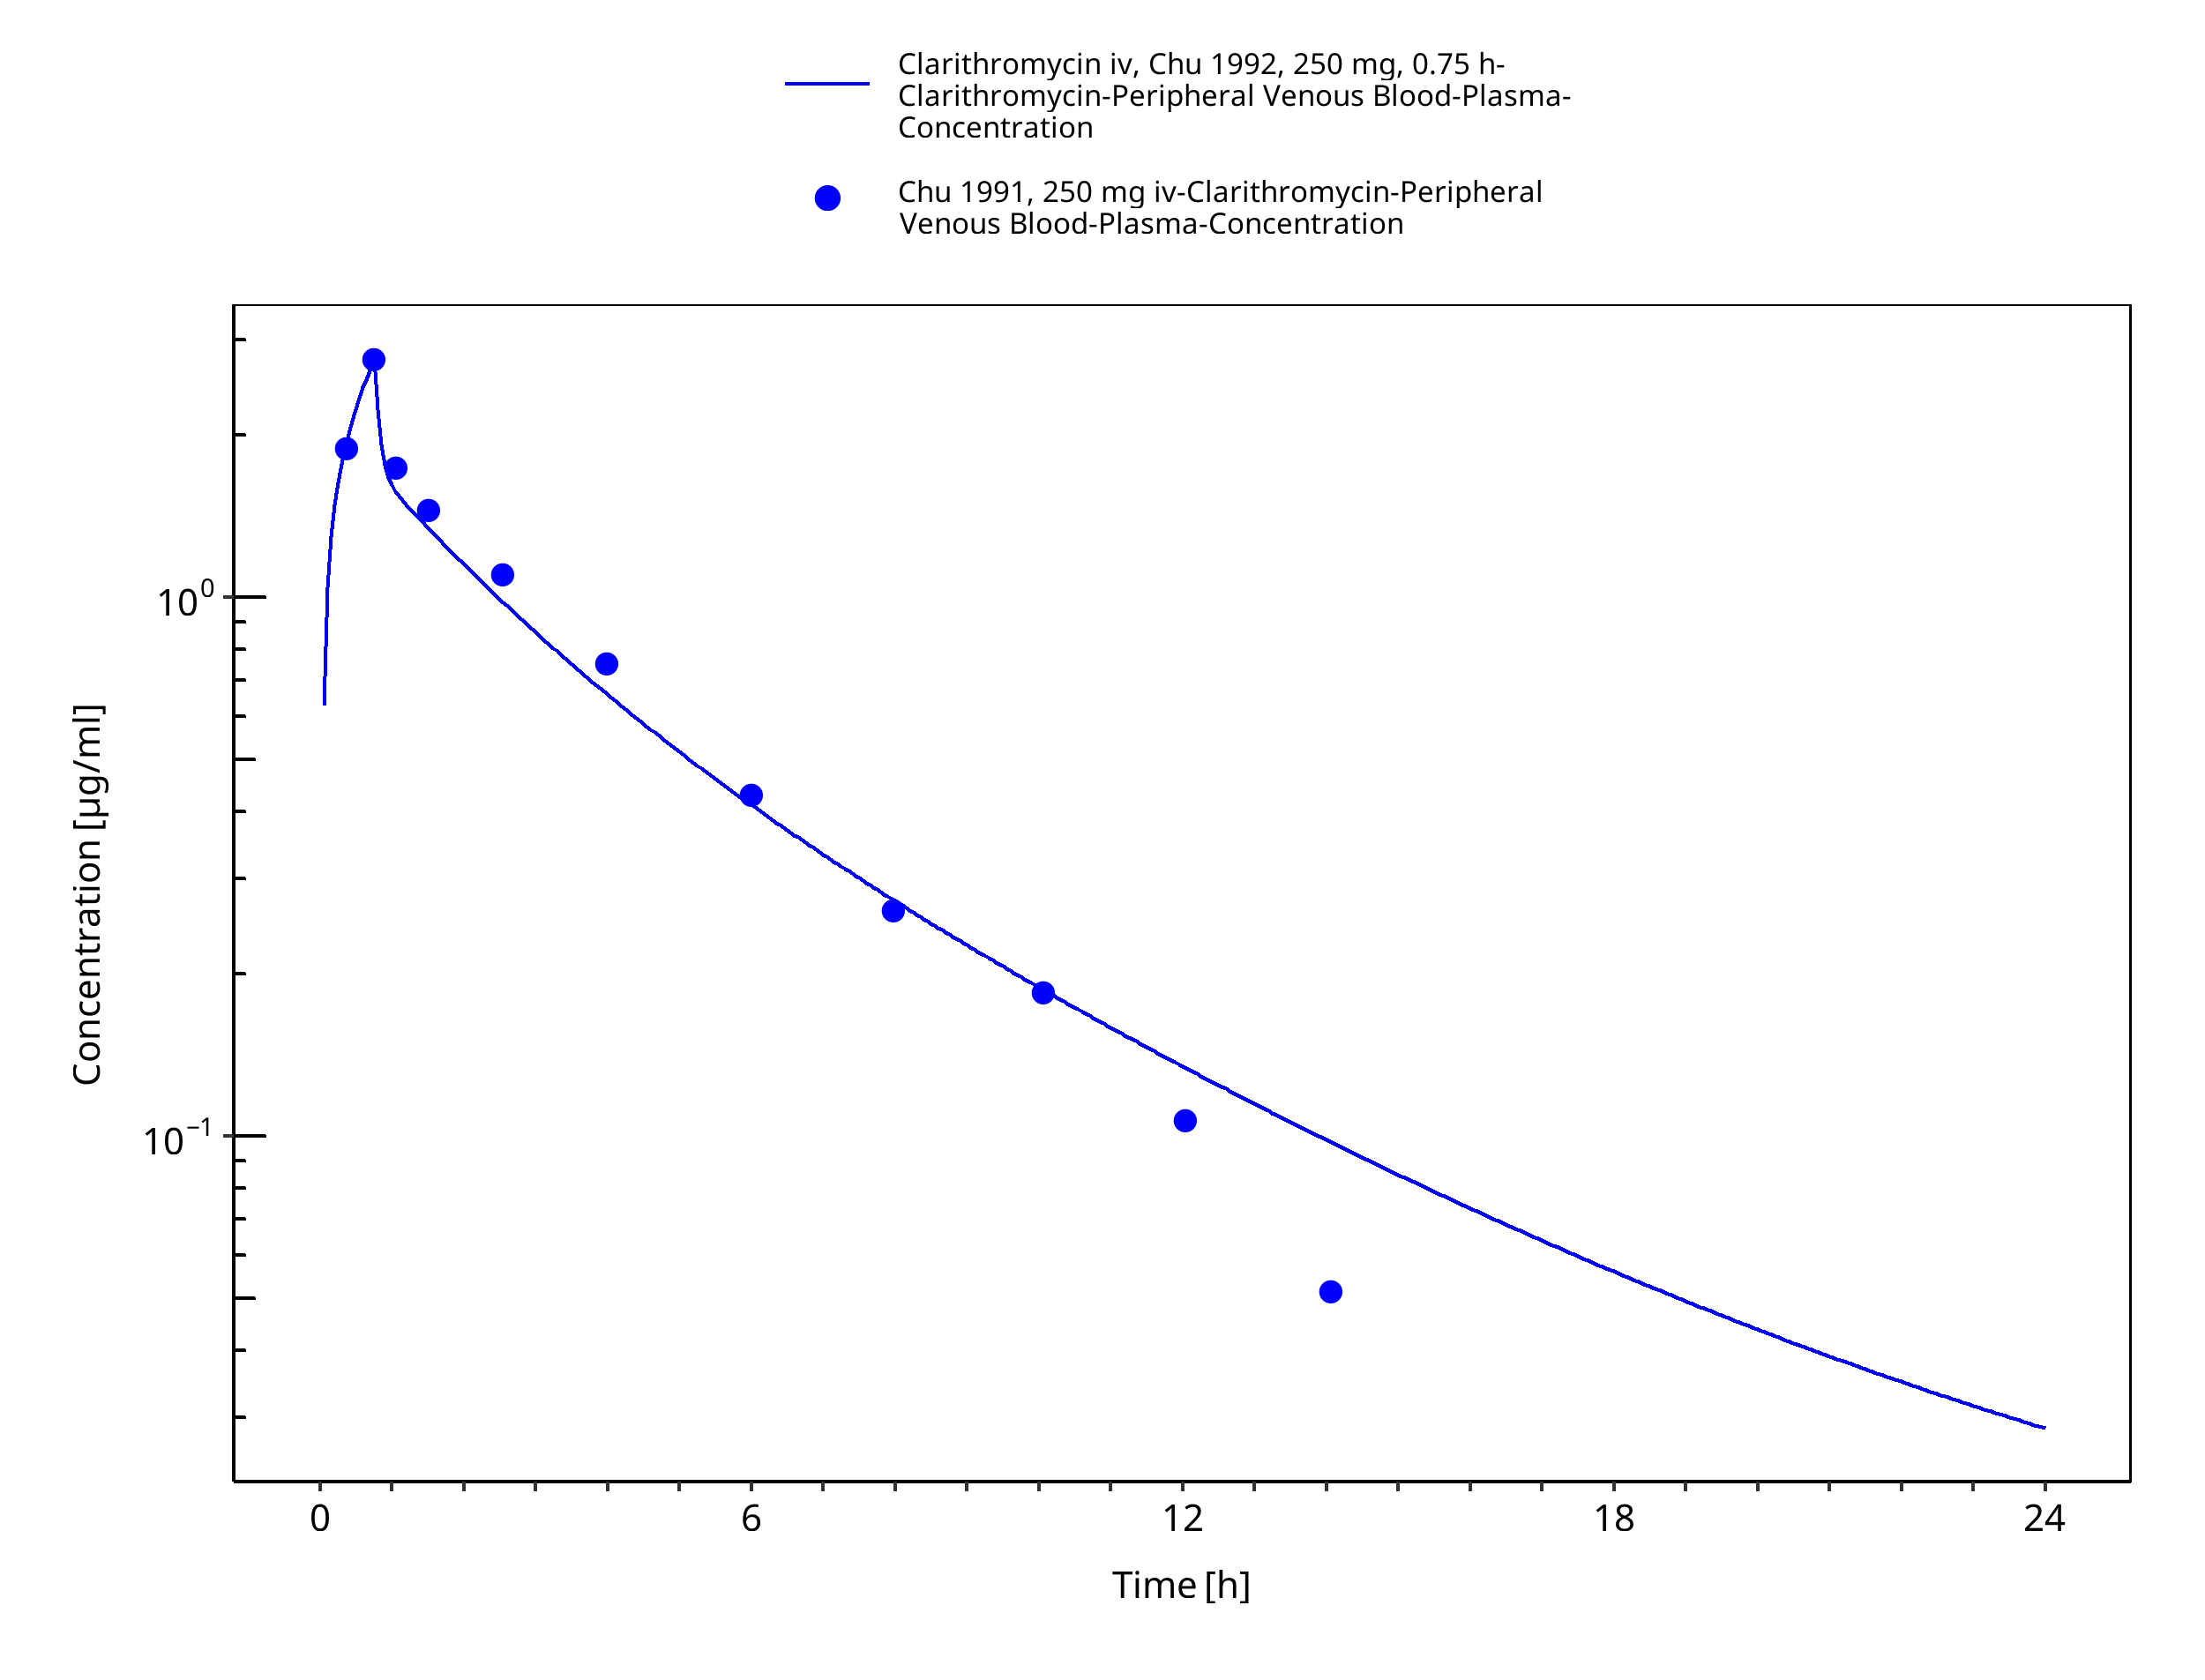
Figure 3-4: Time Profile Analysis 1
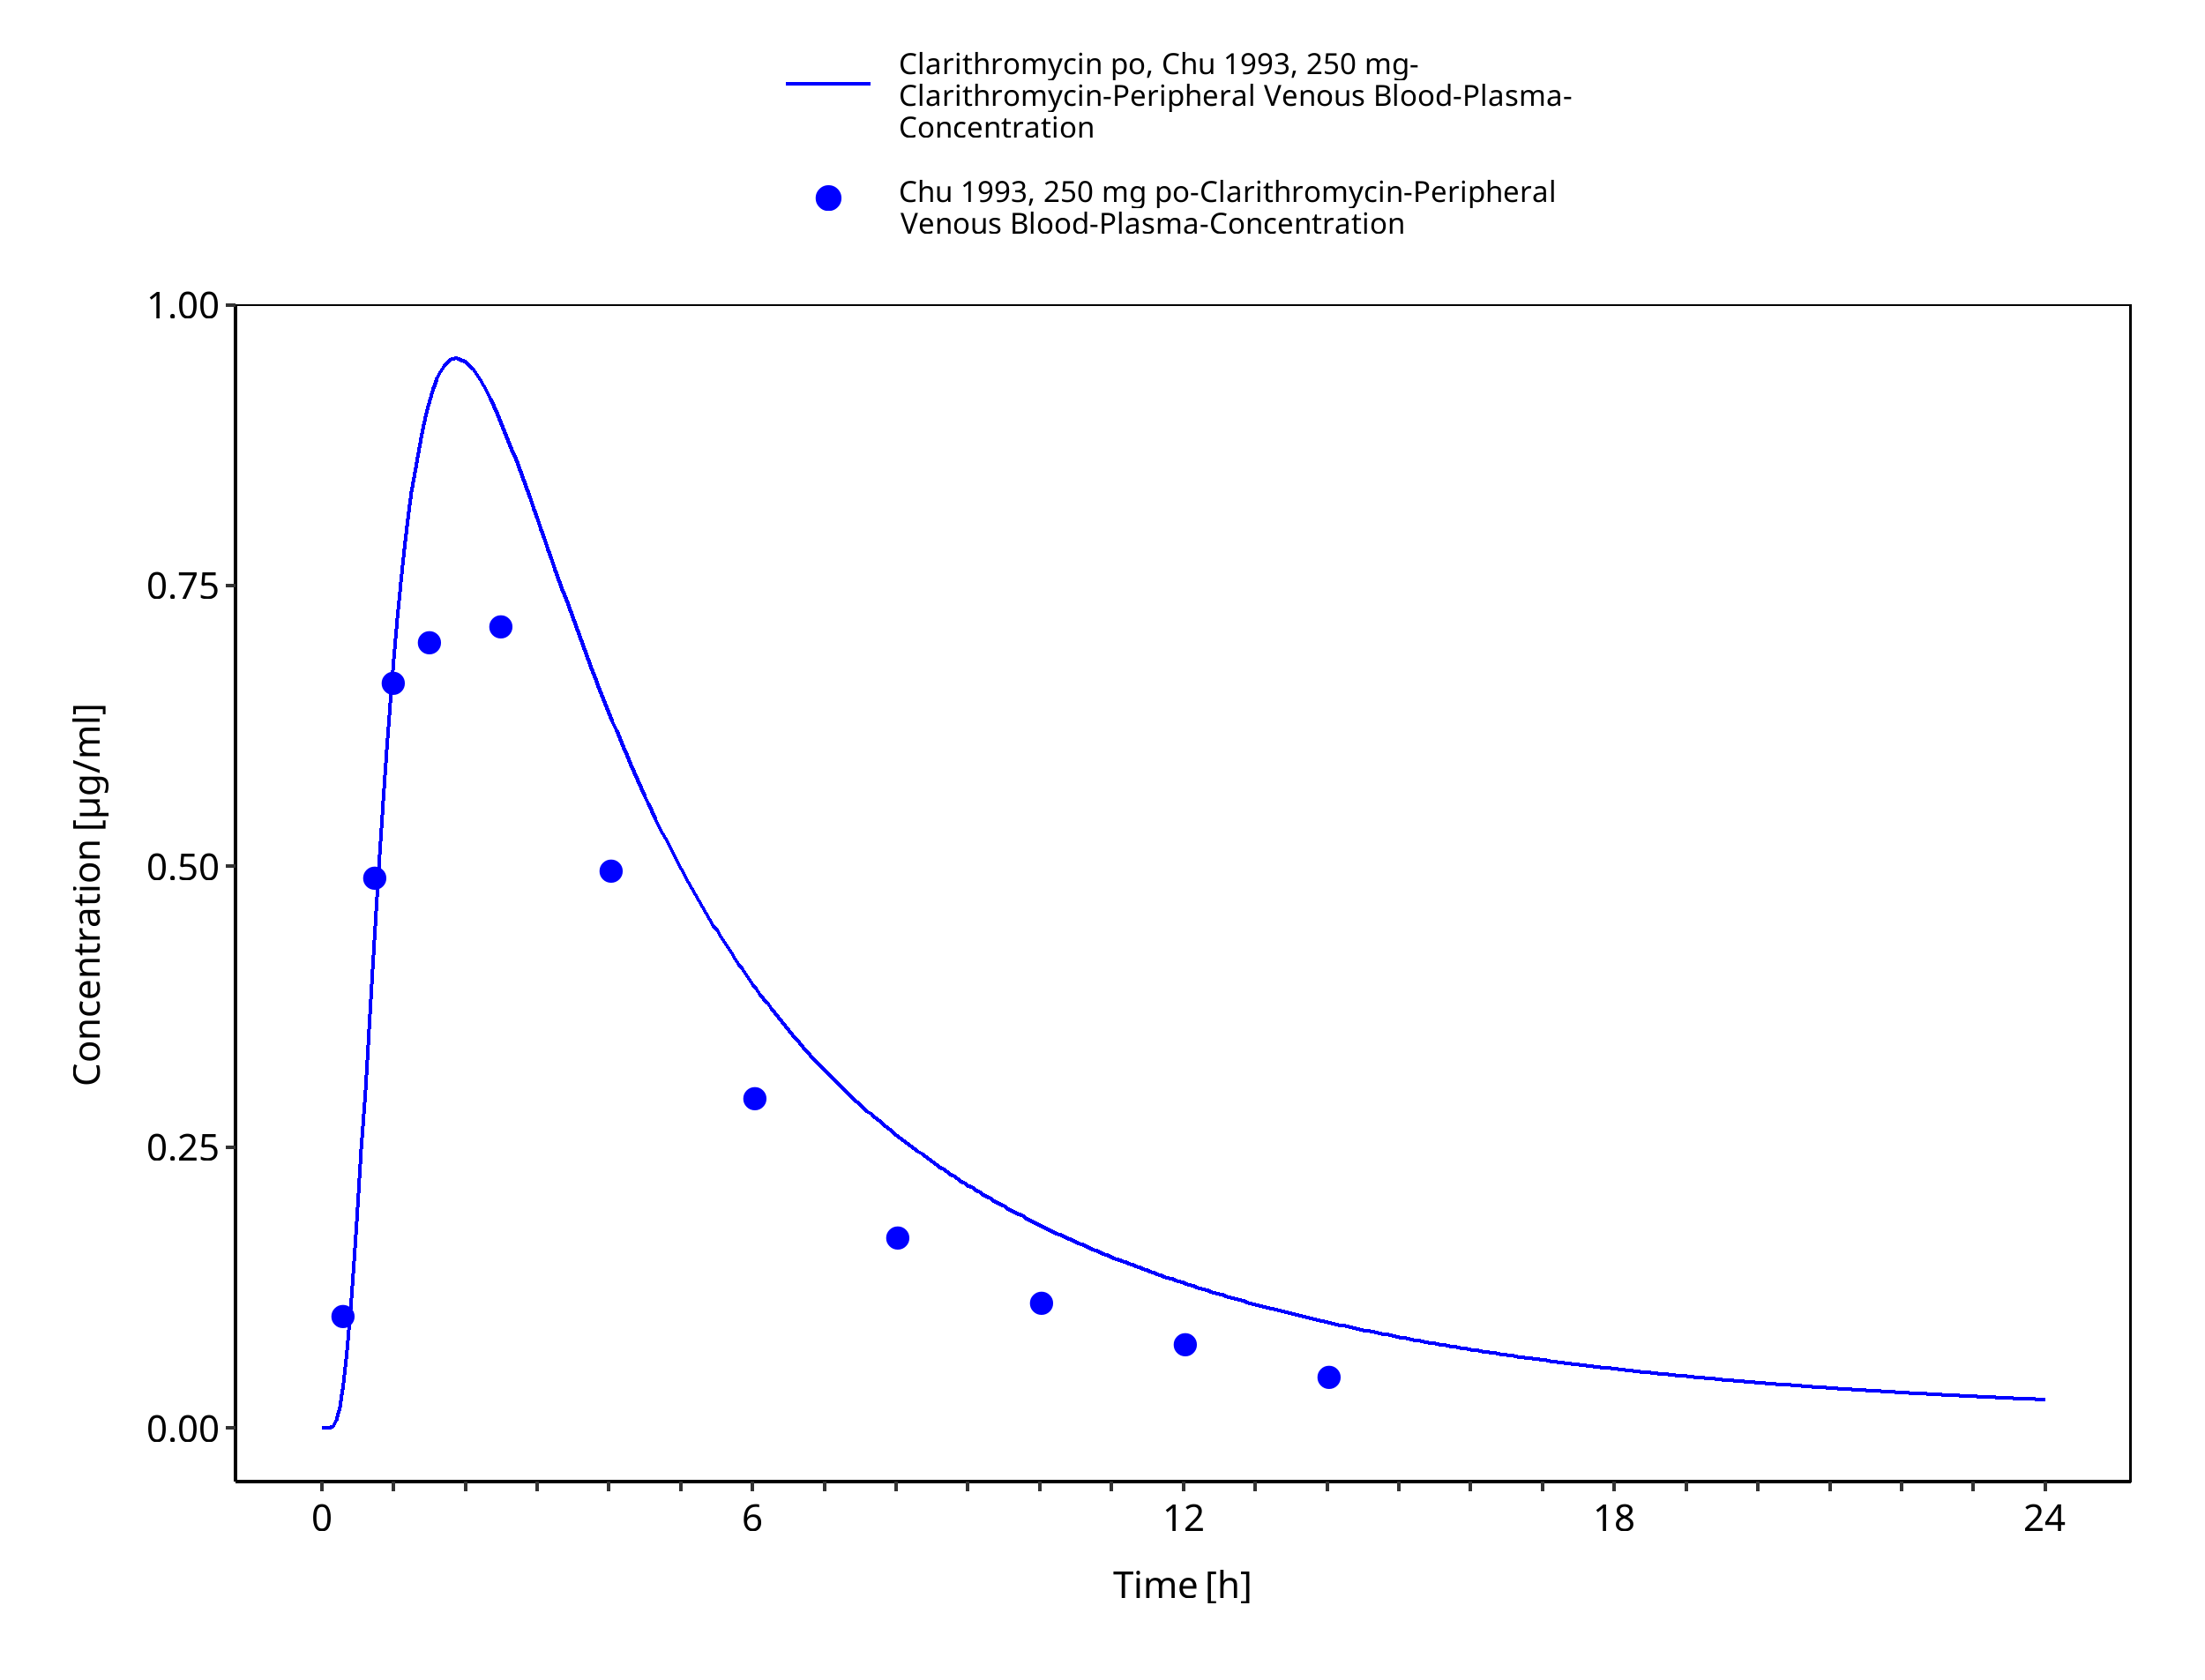
Figure 3-5: Time Profile Analysis
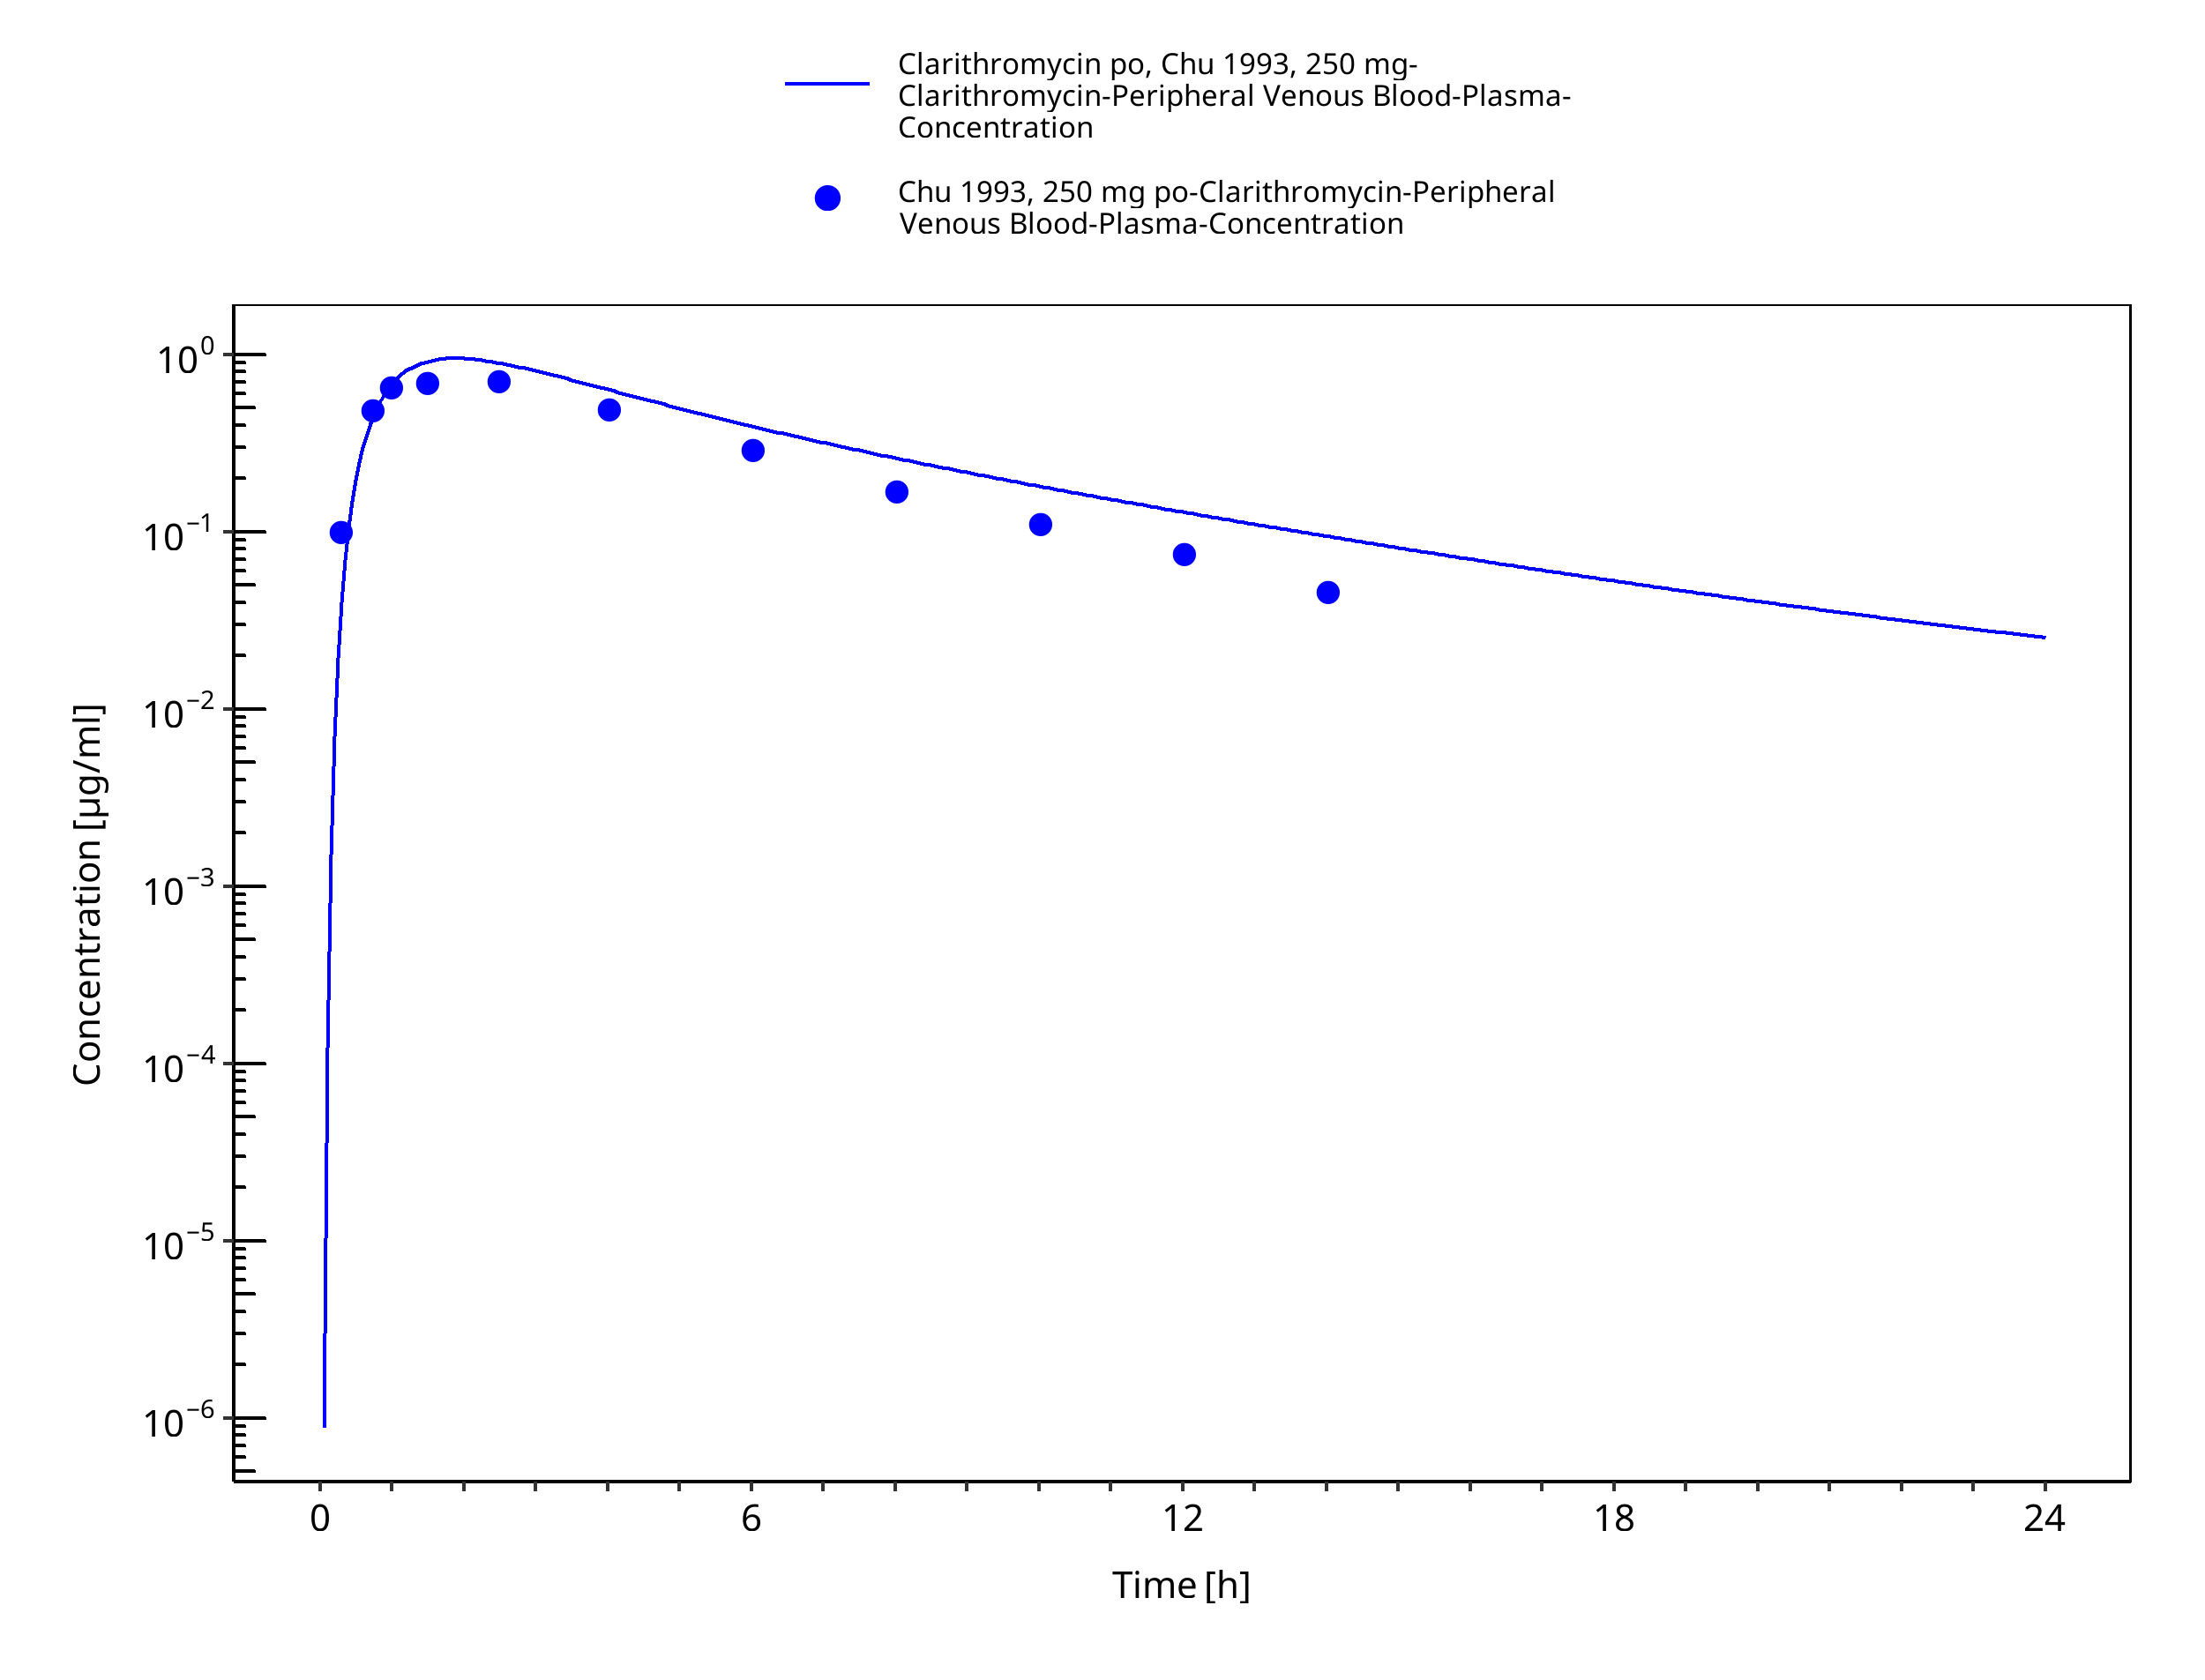
Figure 3-6: Time Profile Analysis 1
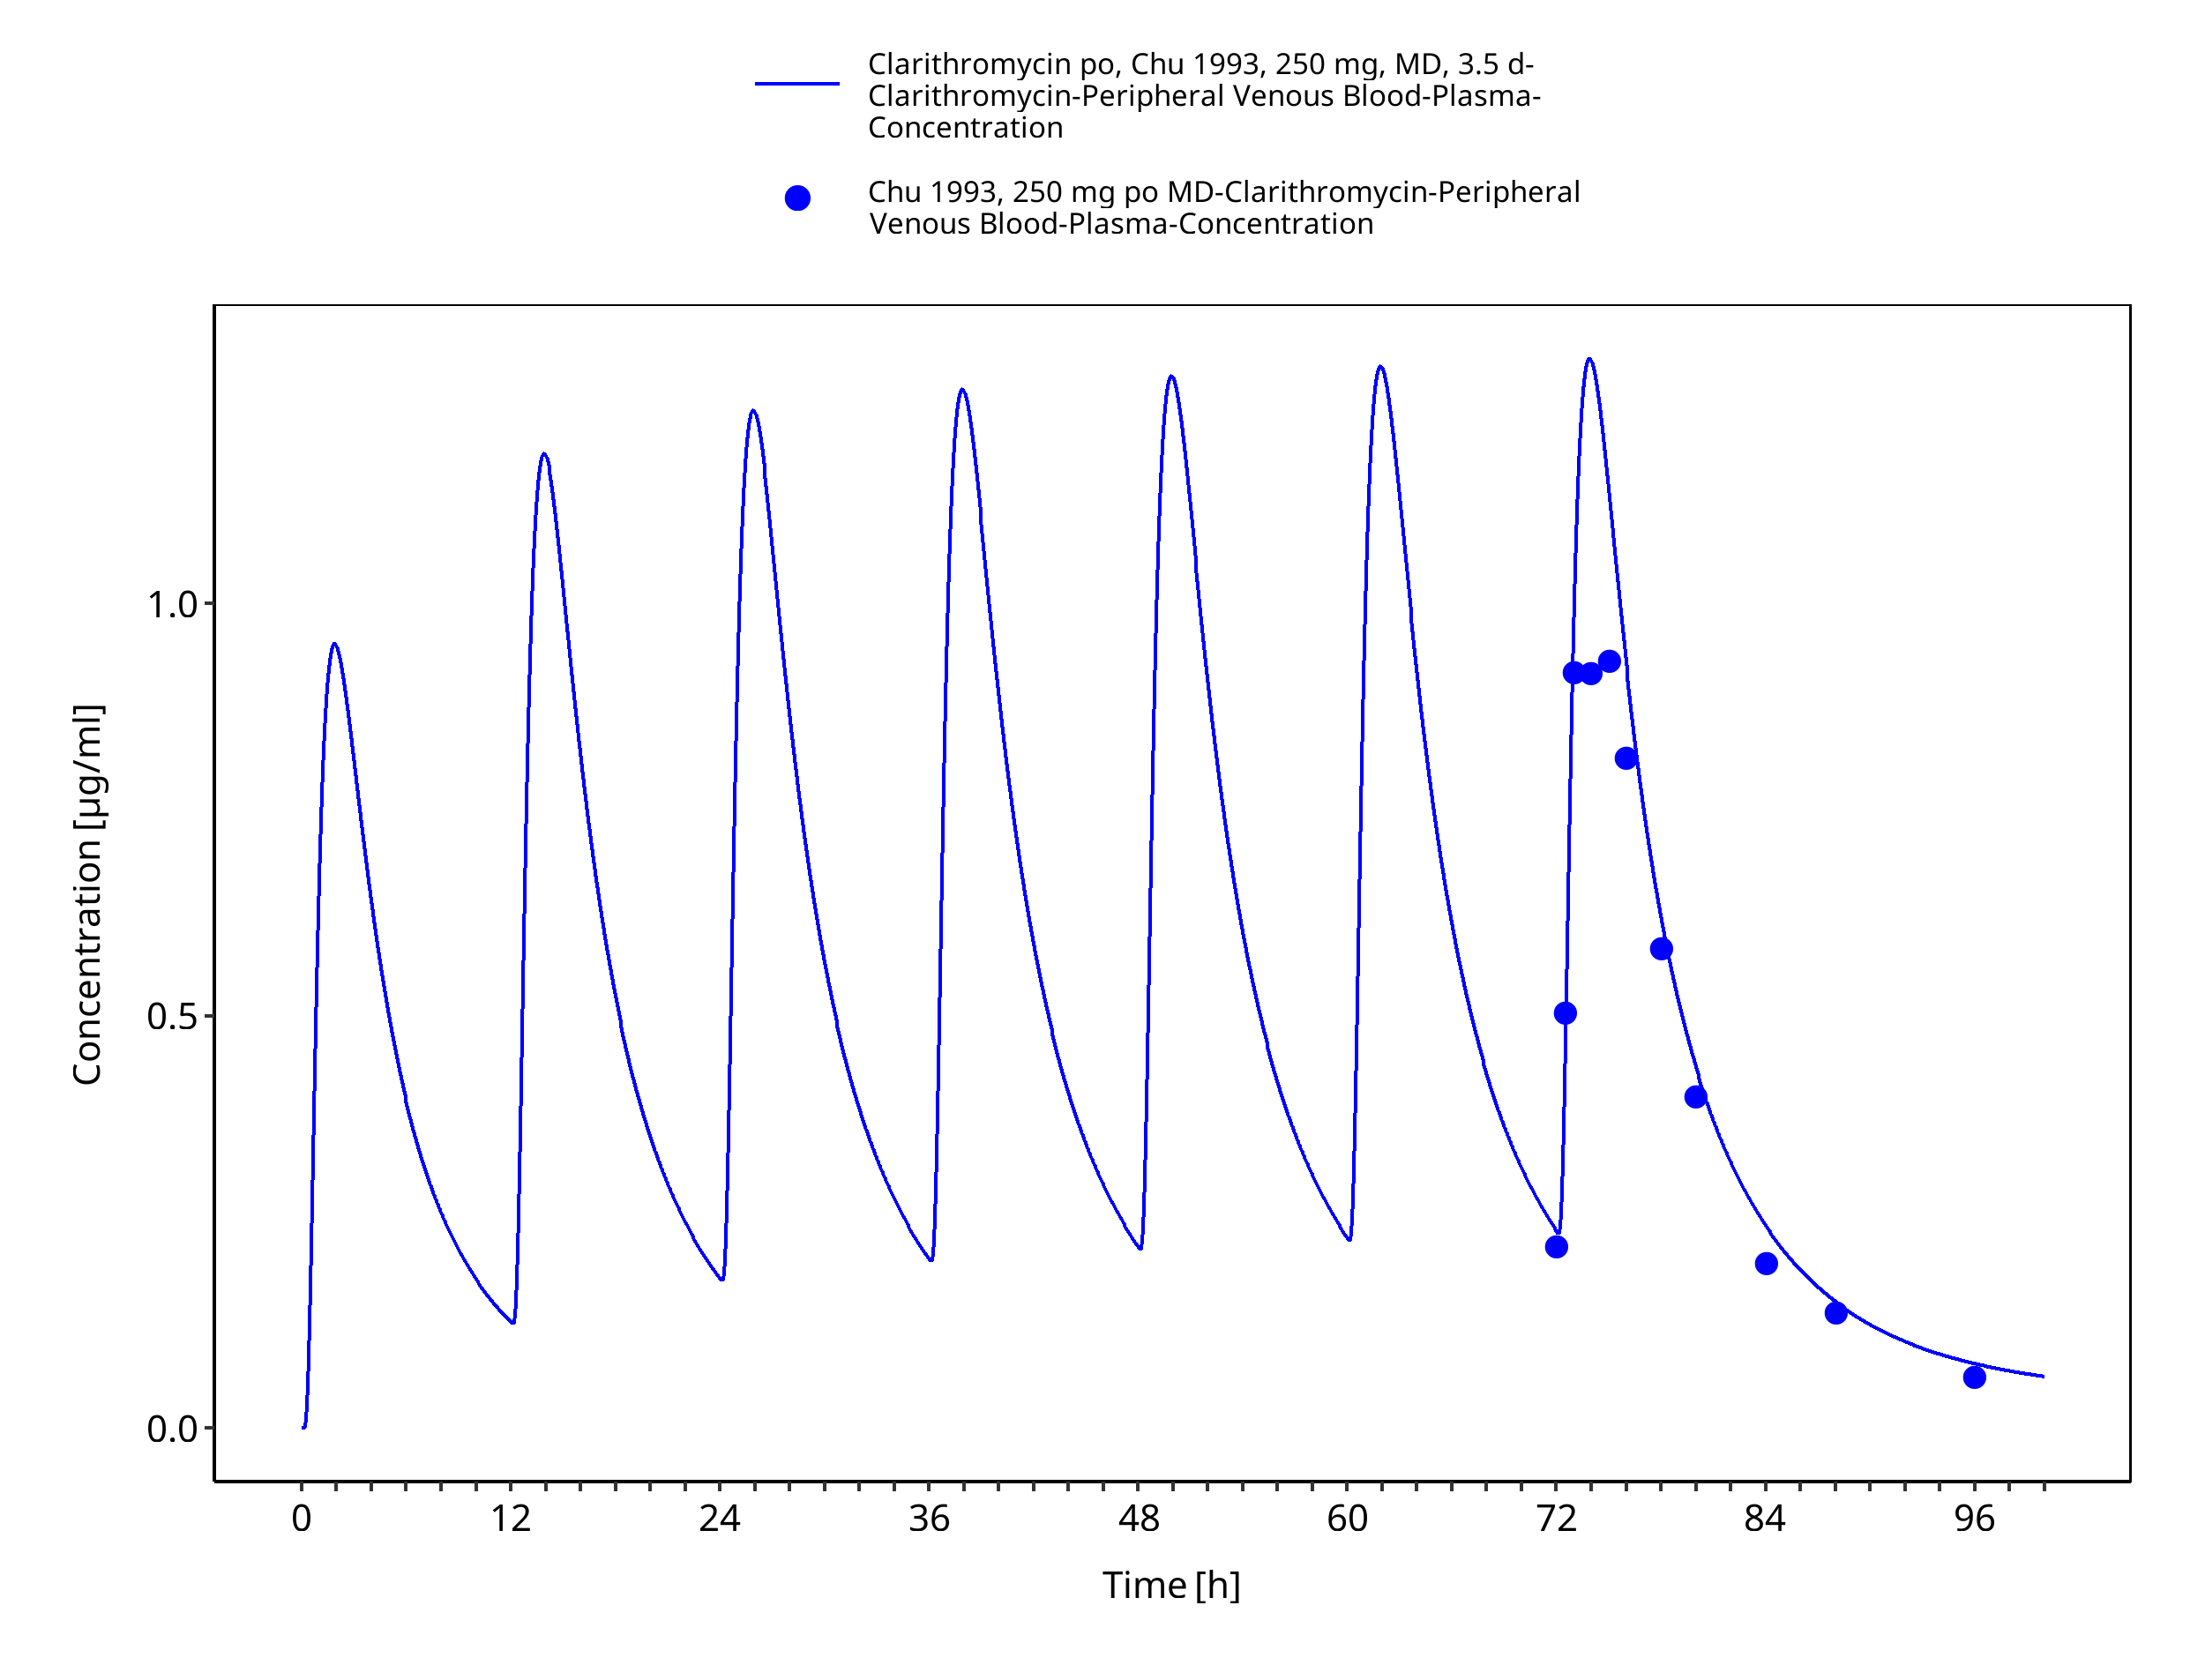
Figure 3-7: Time Profile Analysis
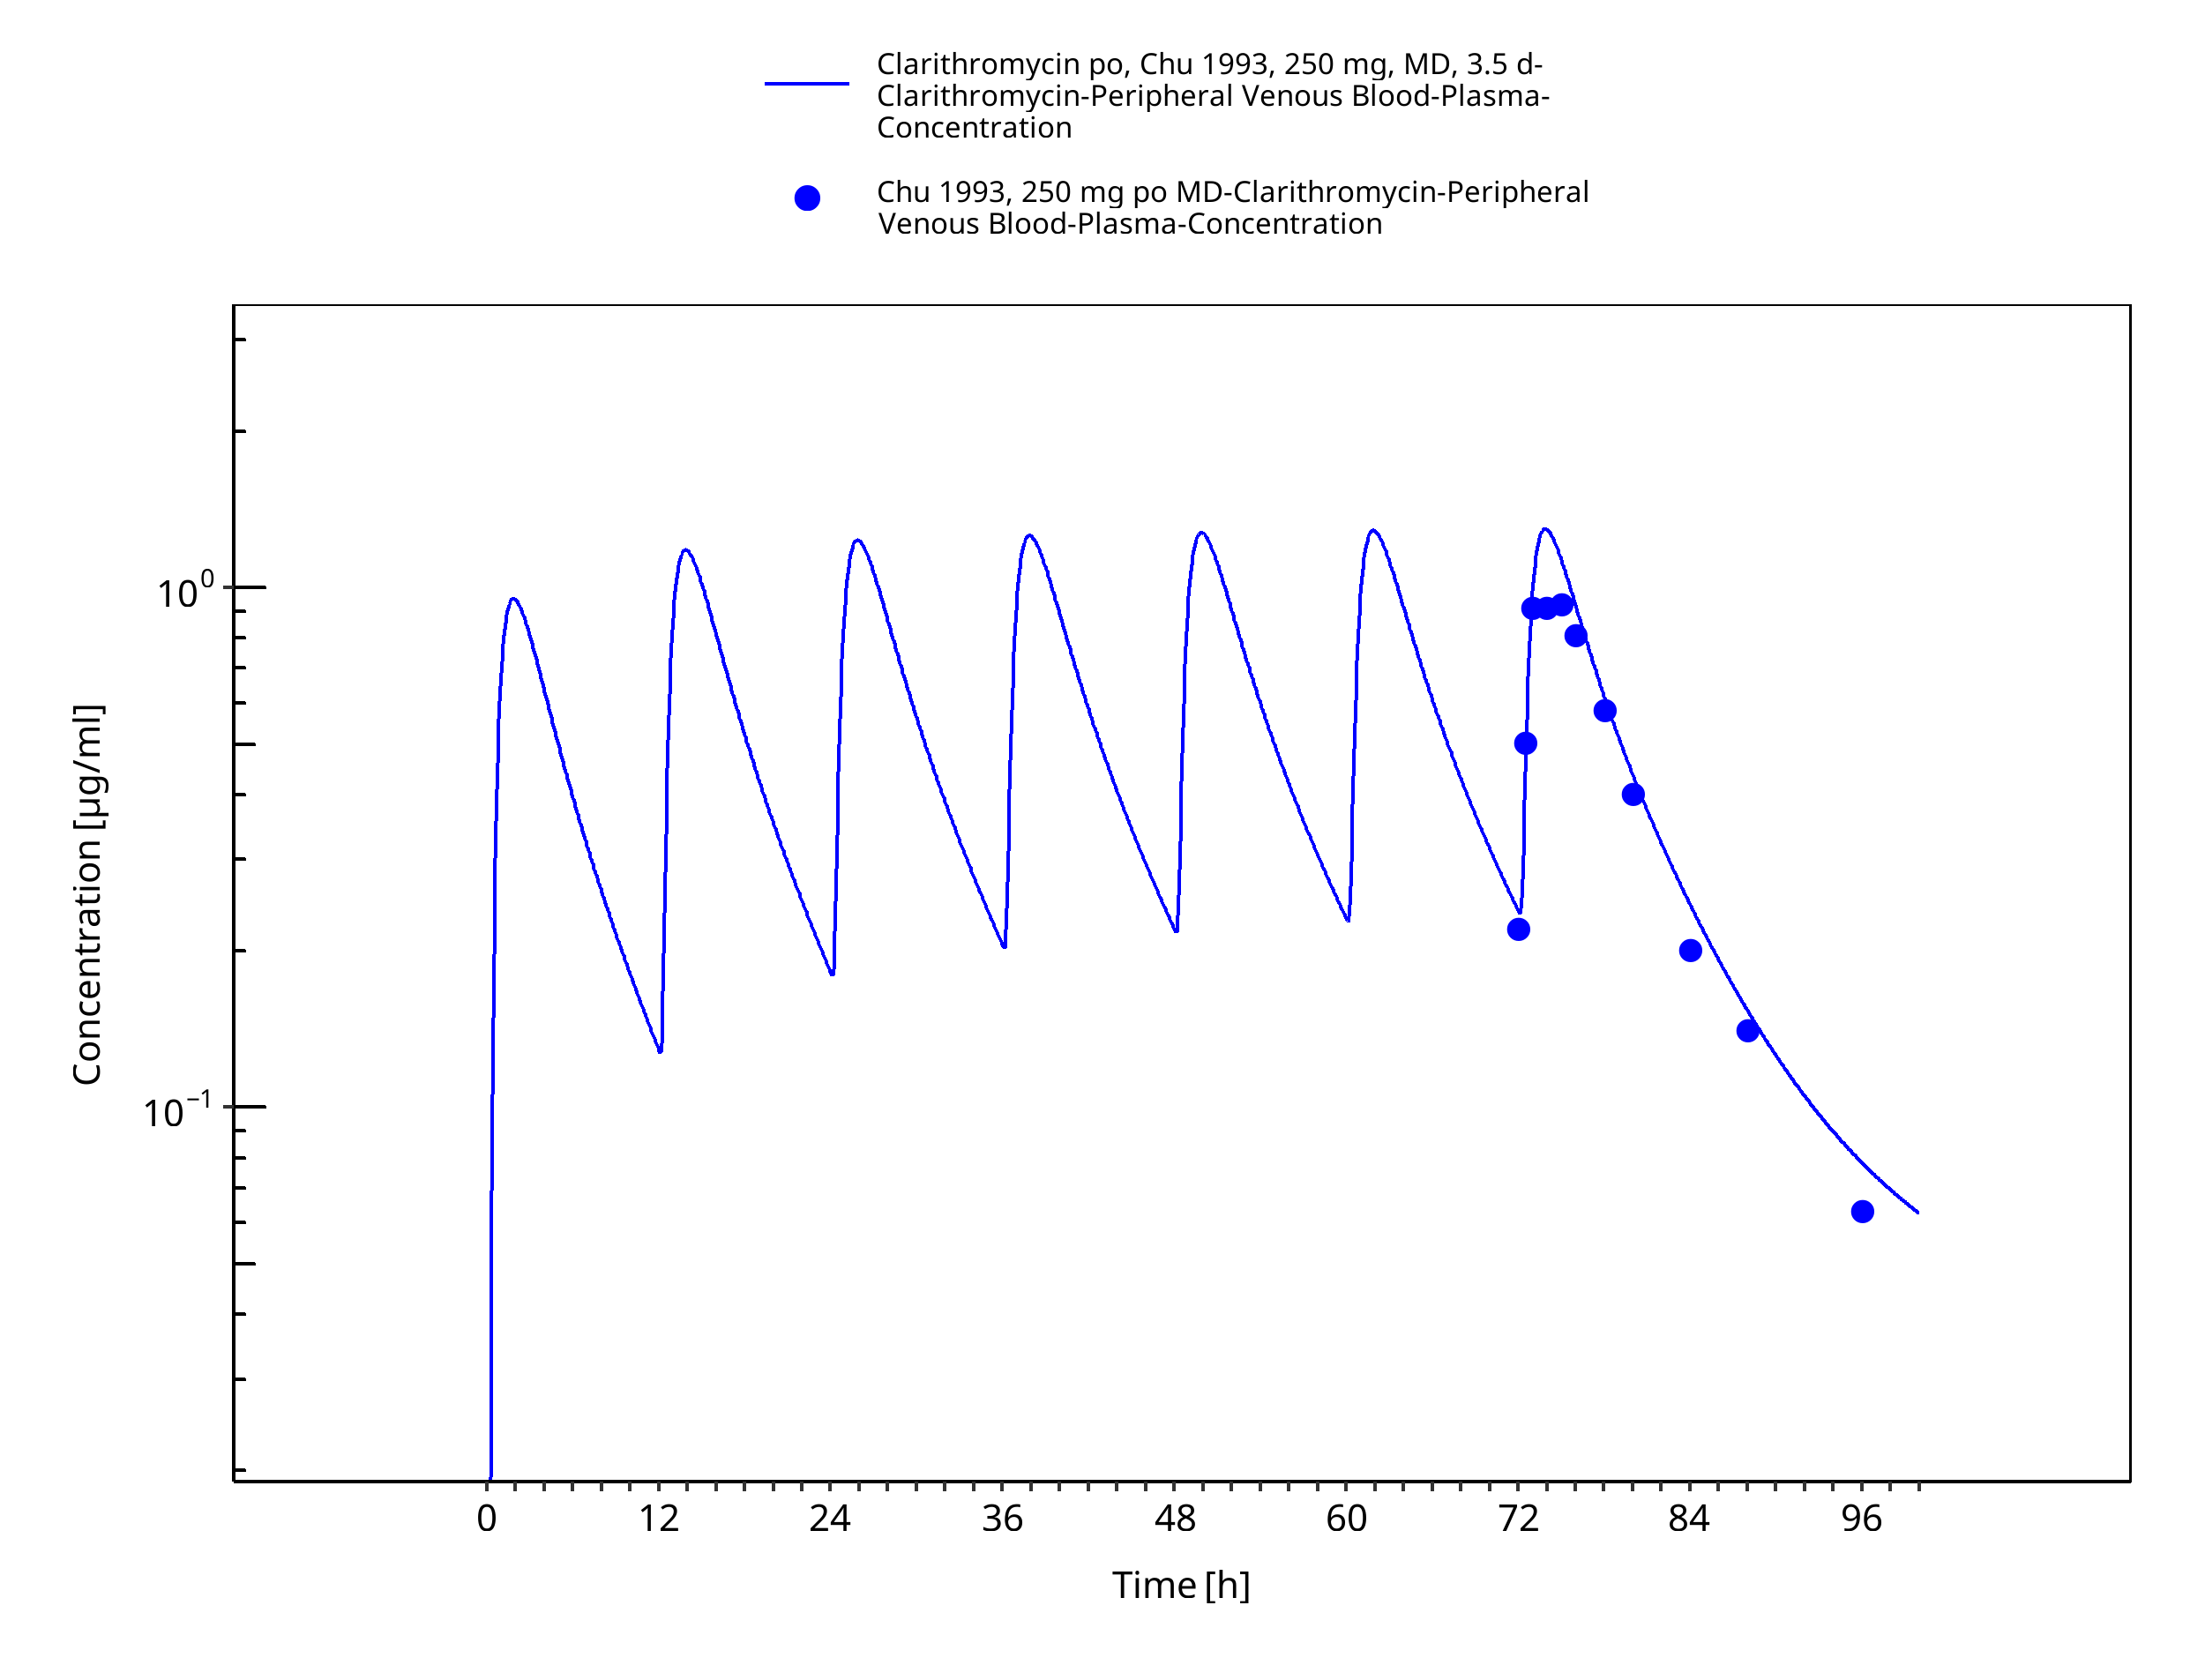
Figure 3-8: Time Profile Analysis 1
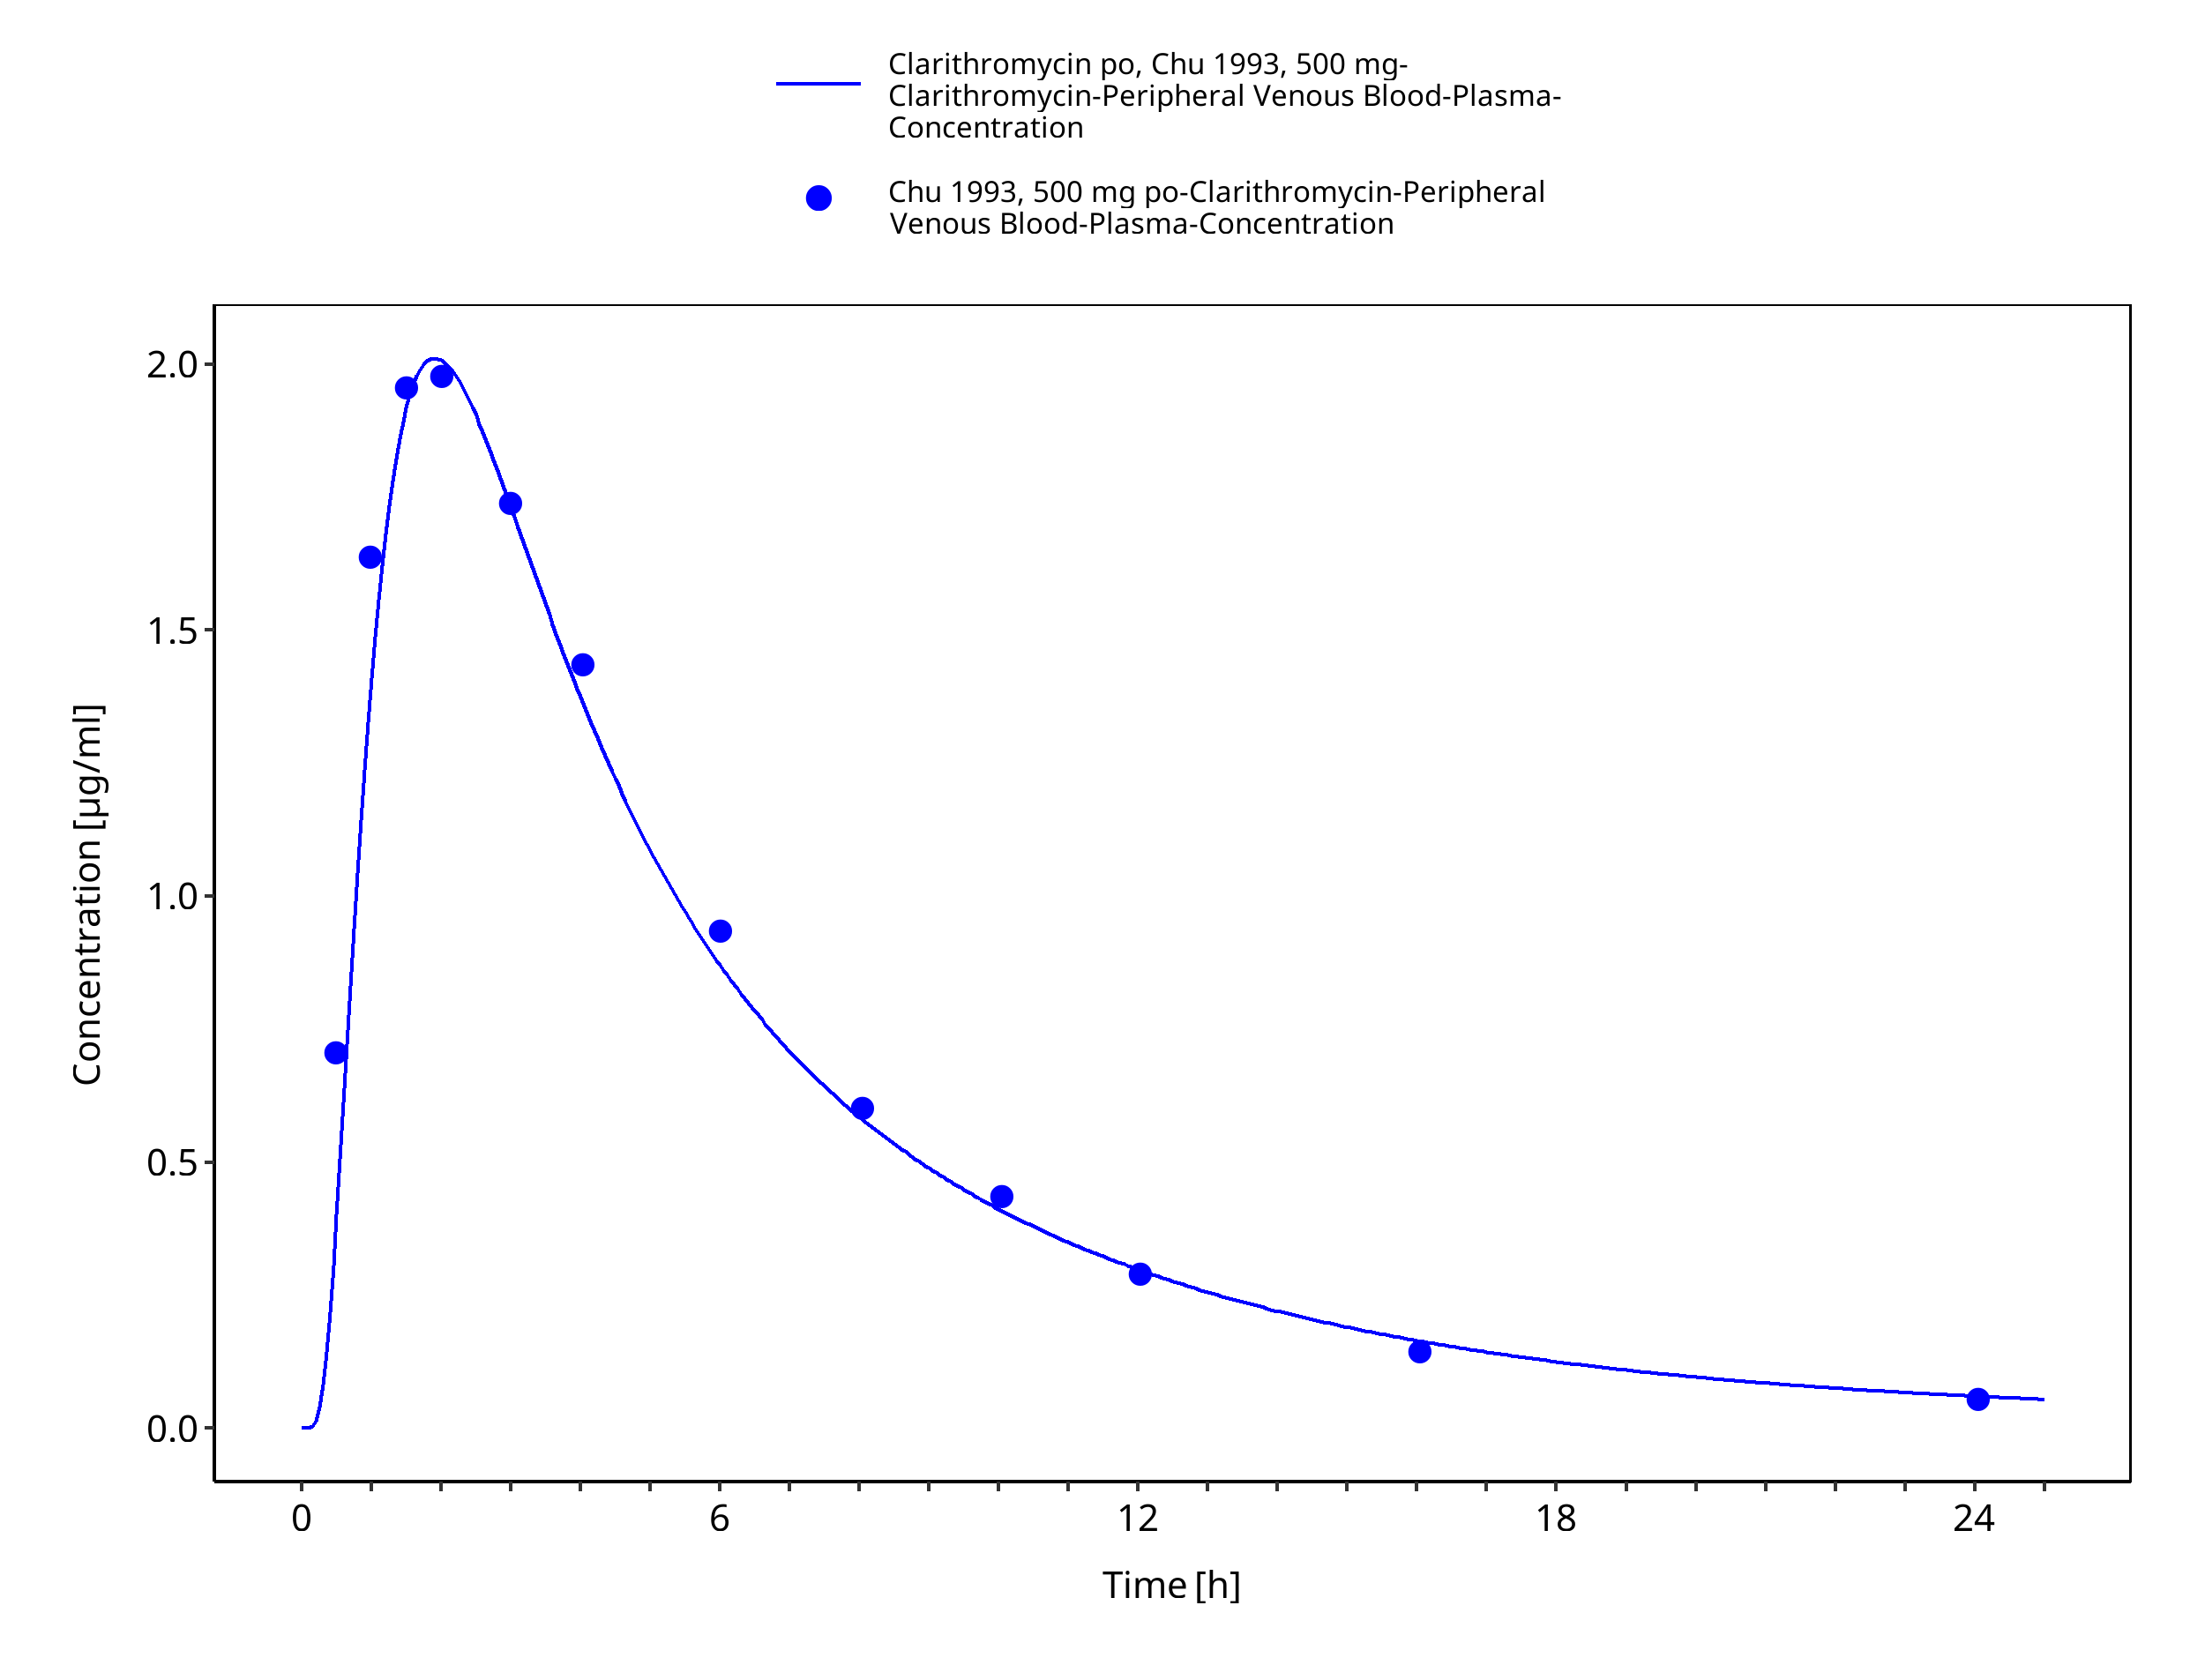
Figure 3-9: Time Profile Analysis
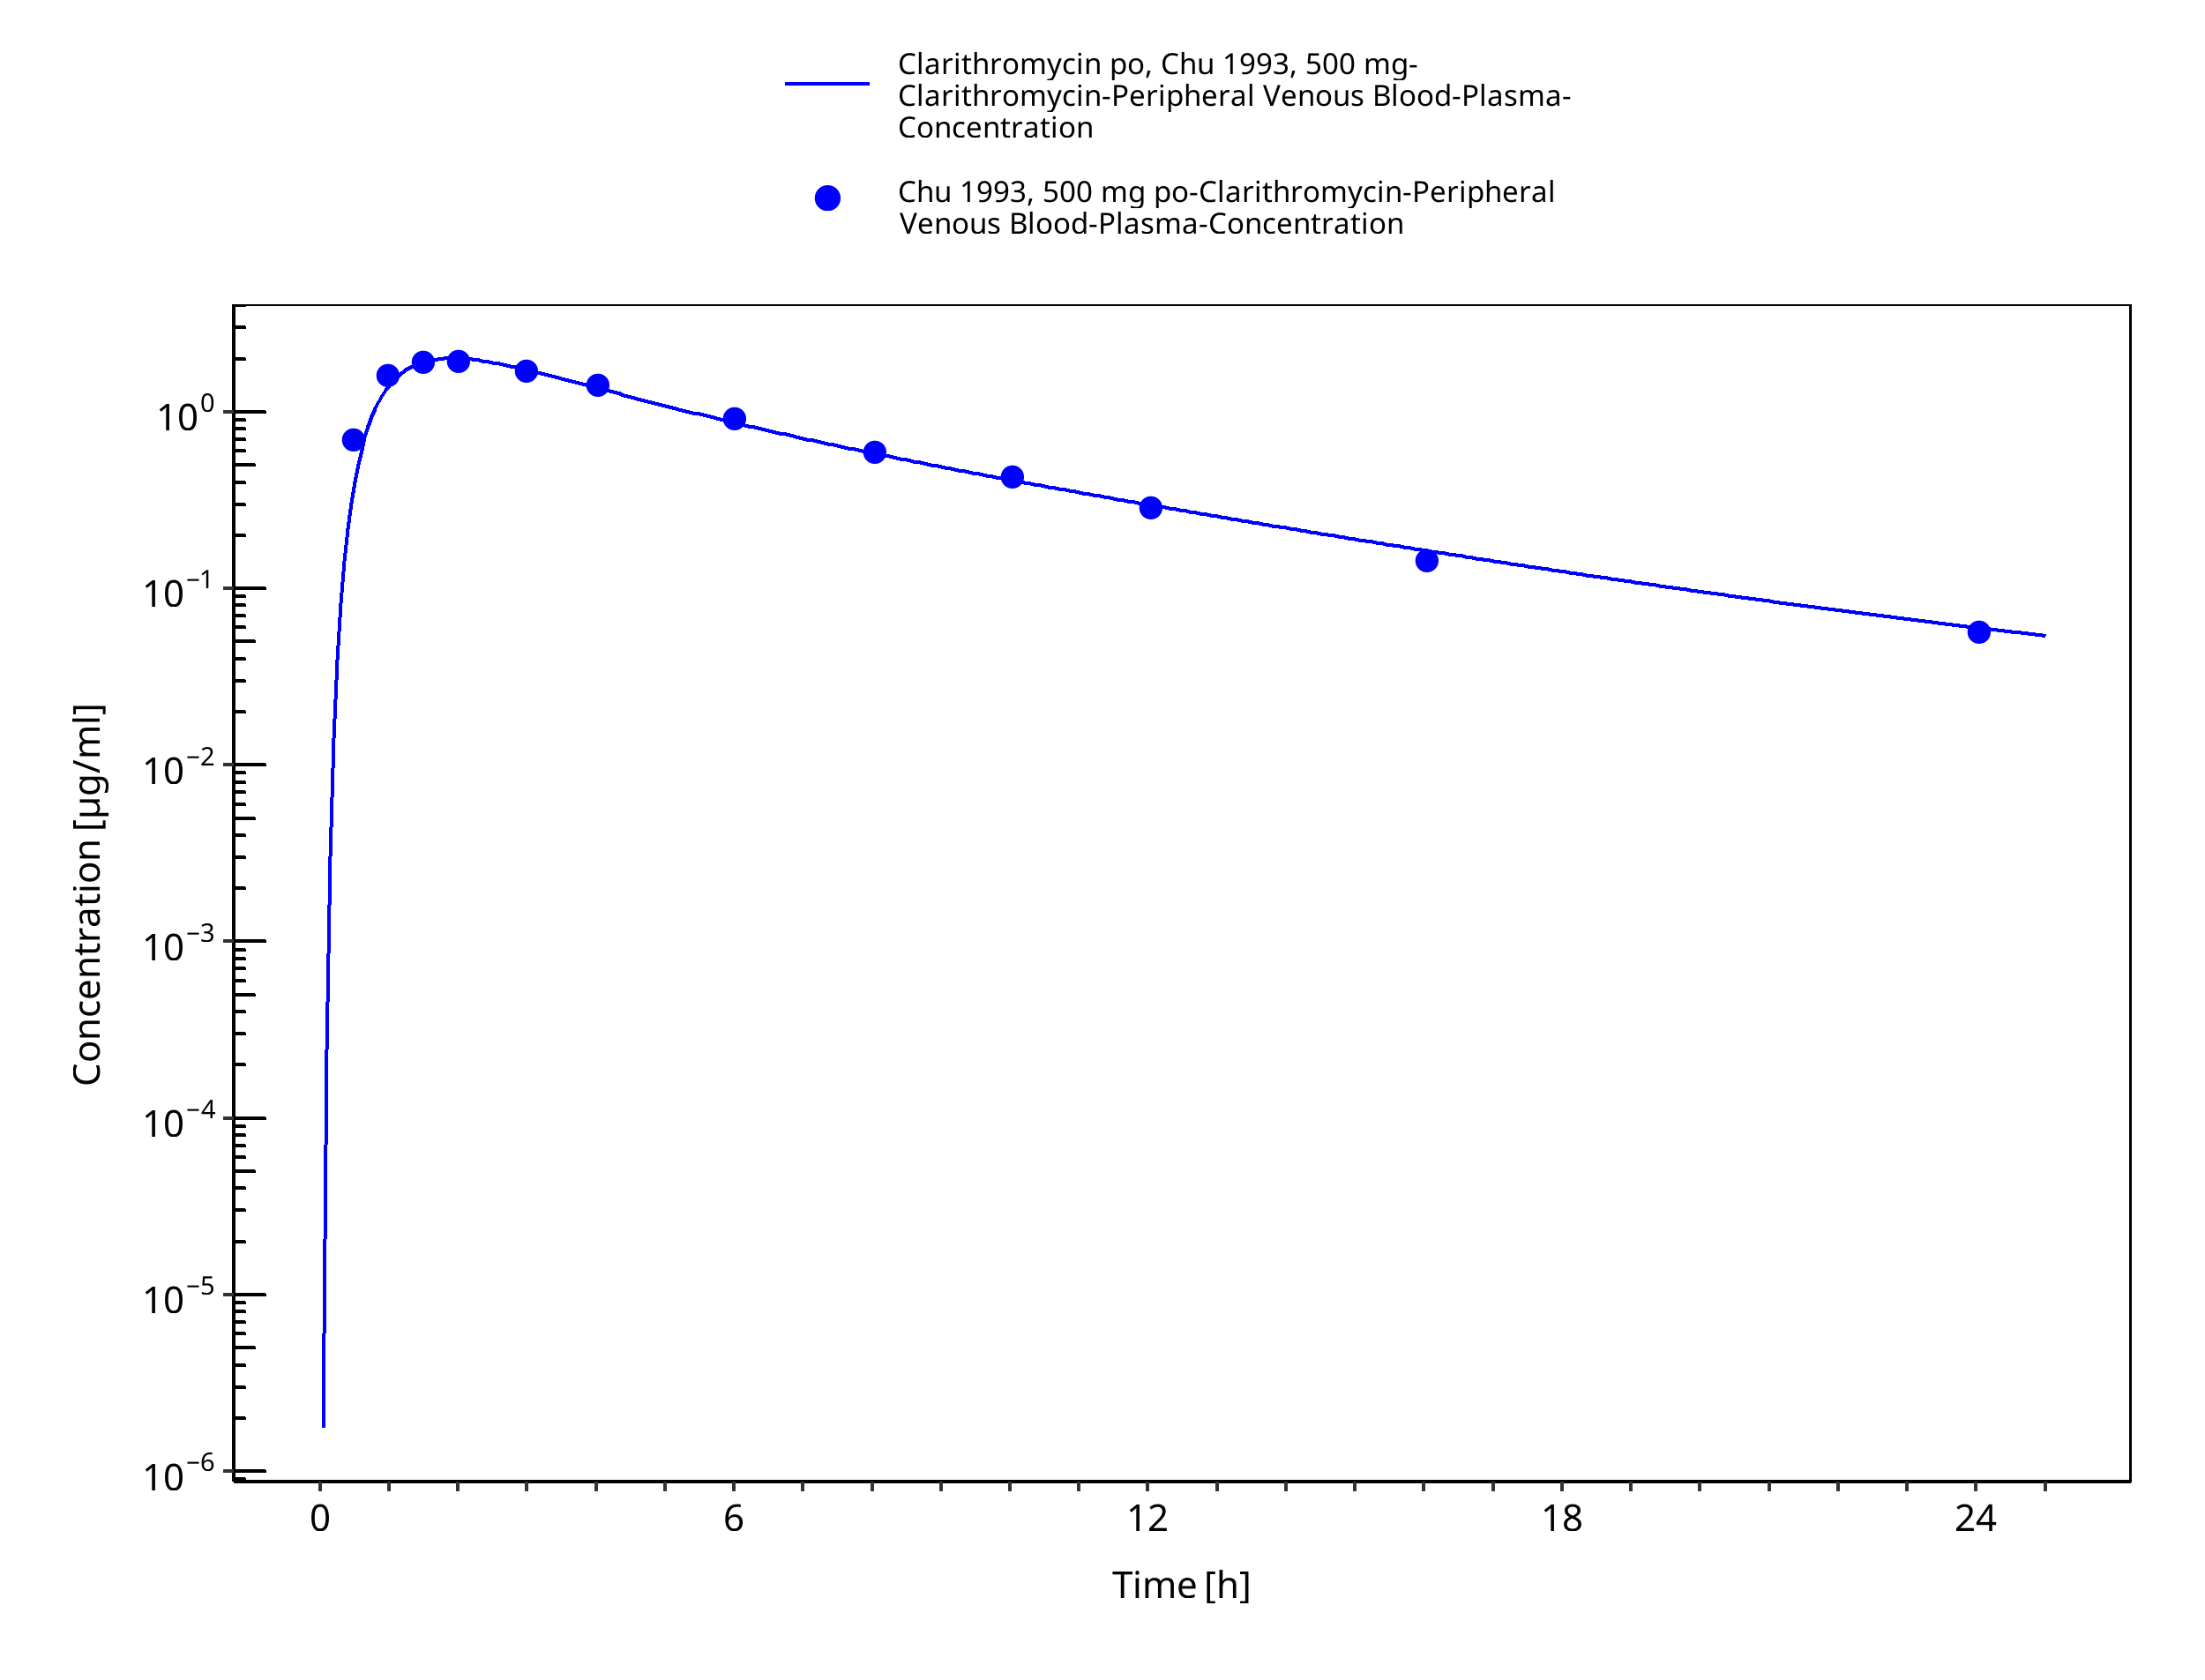
Figure 3-10: Time Profile Analysis 1
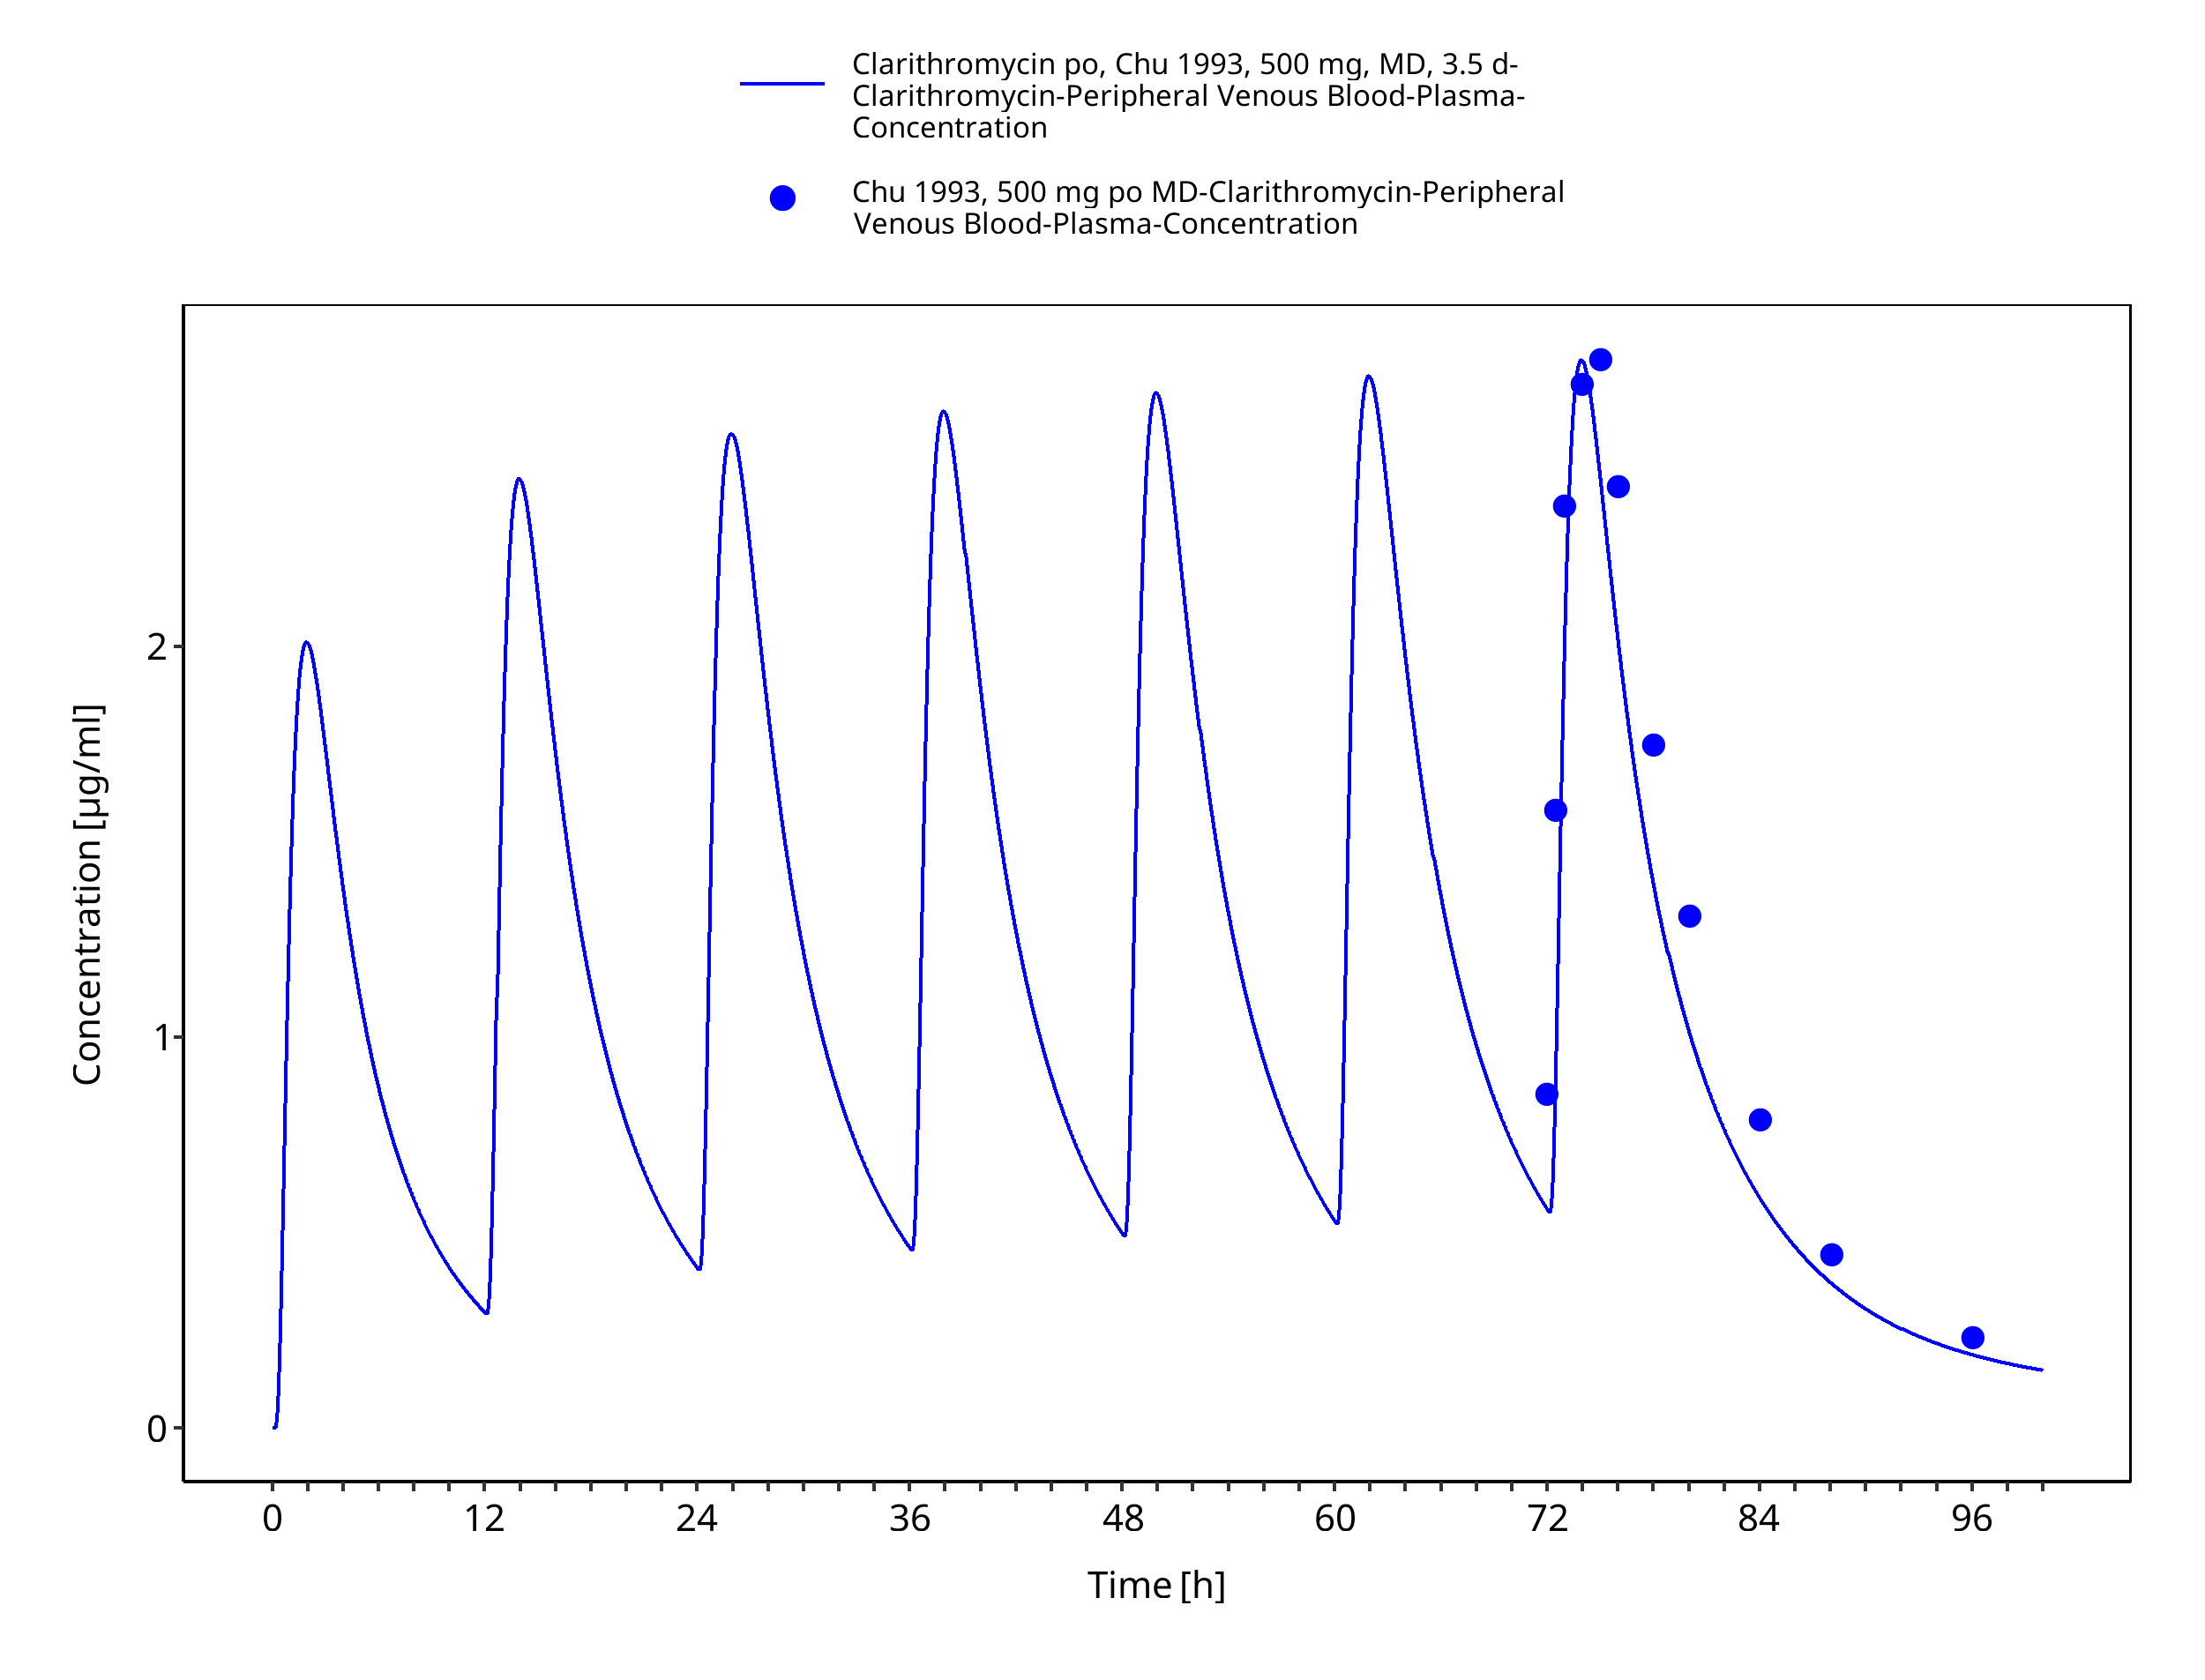
Figure 3-11: Time Profile Analysis
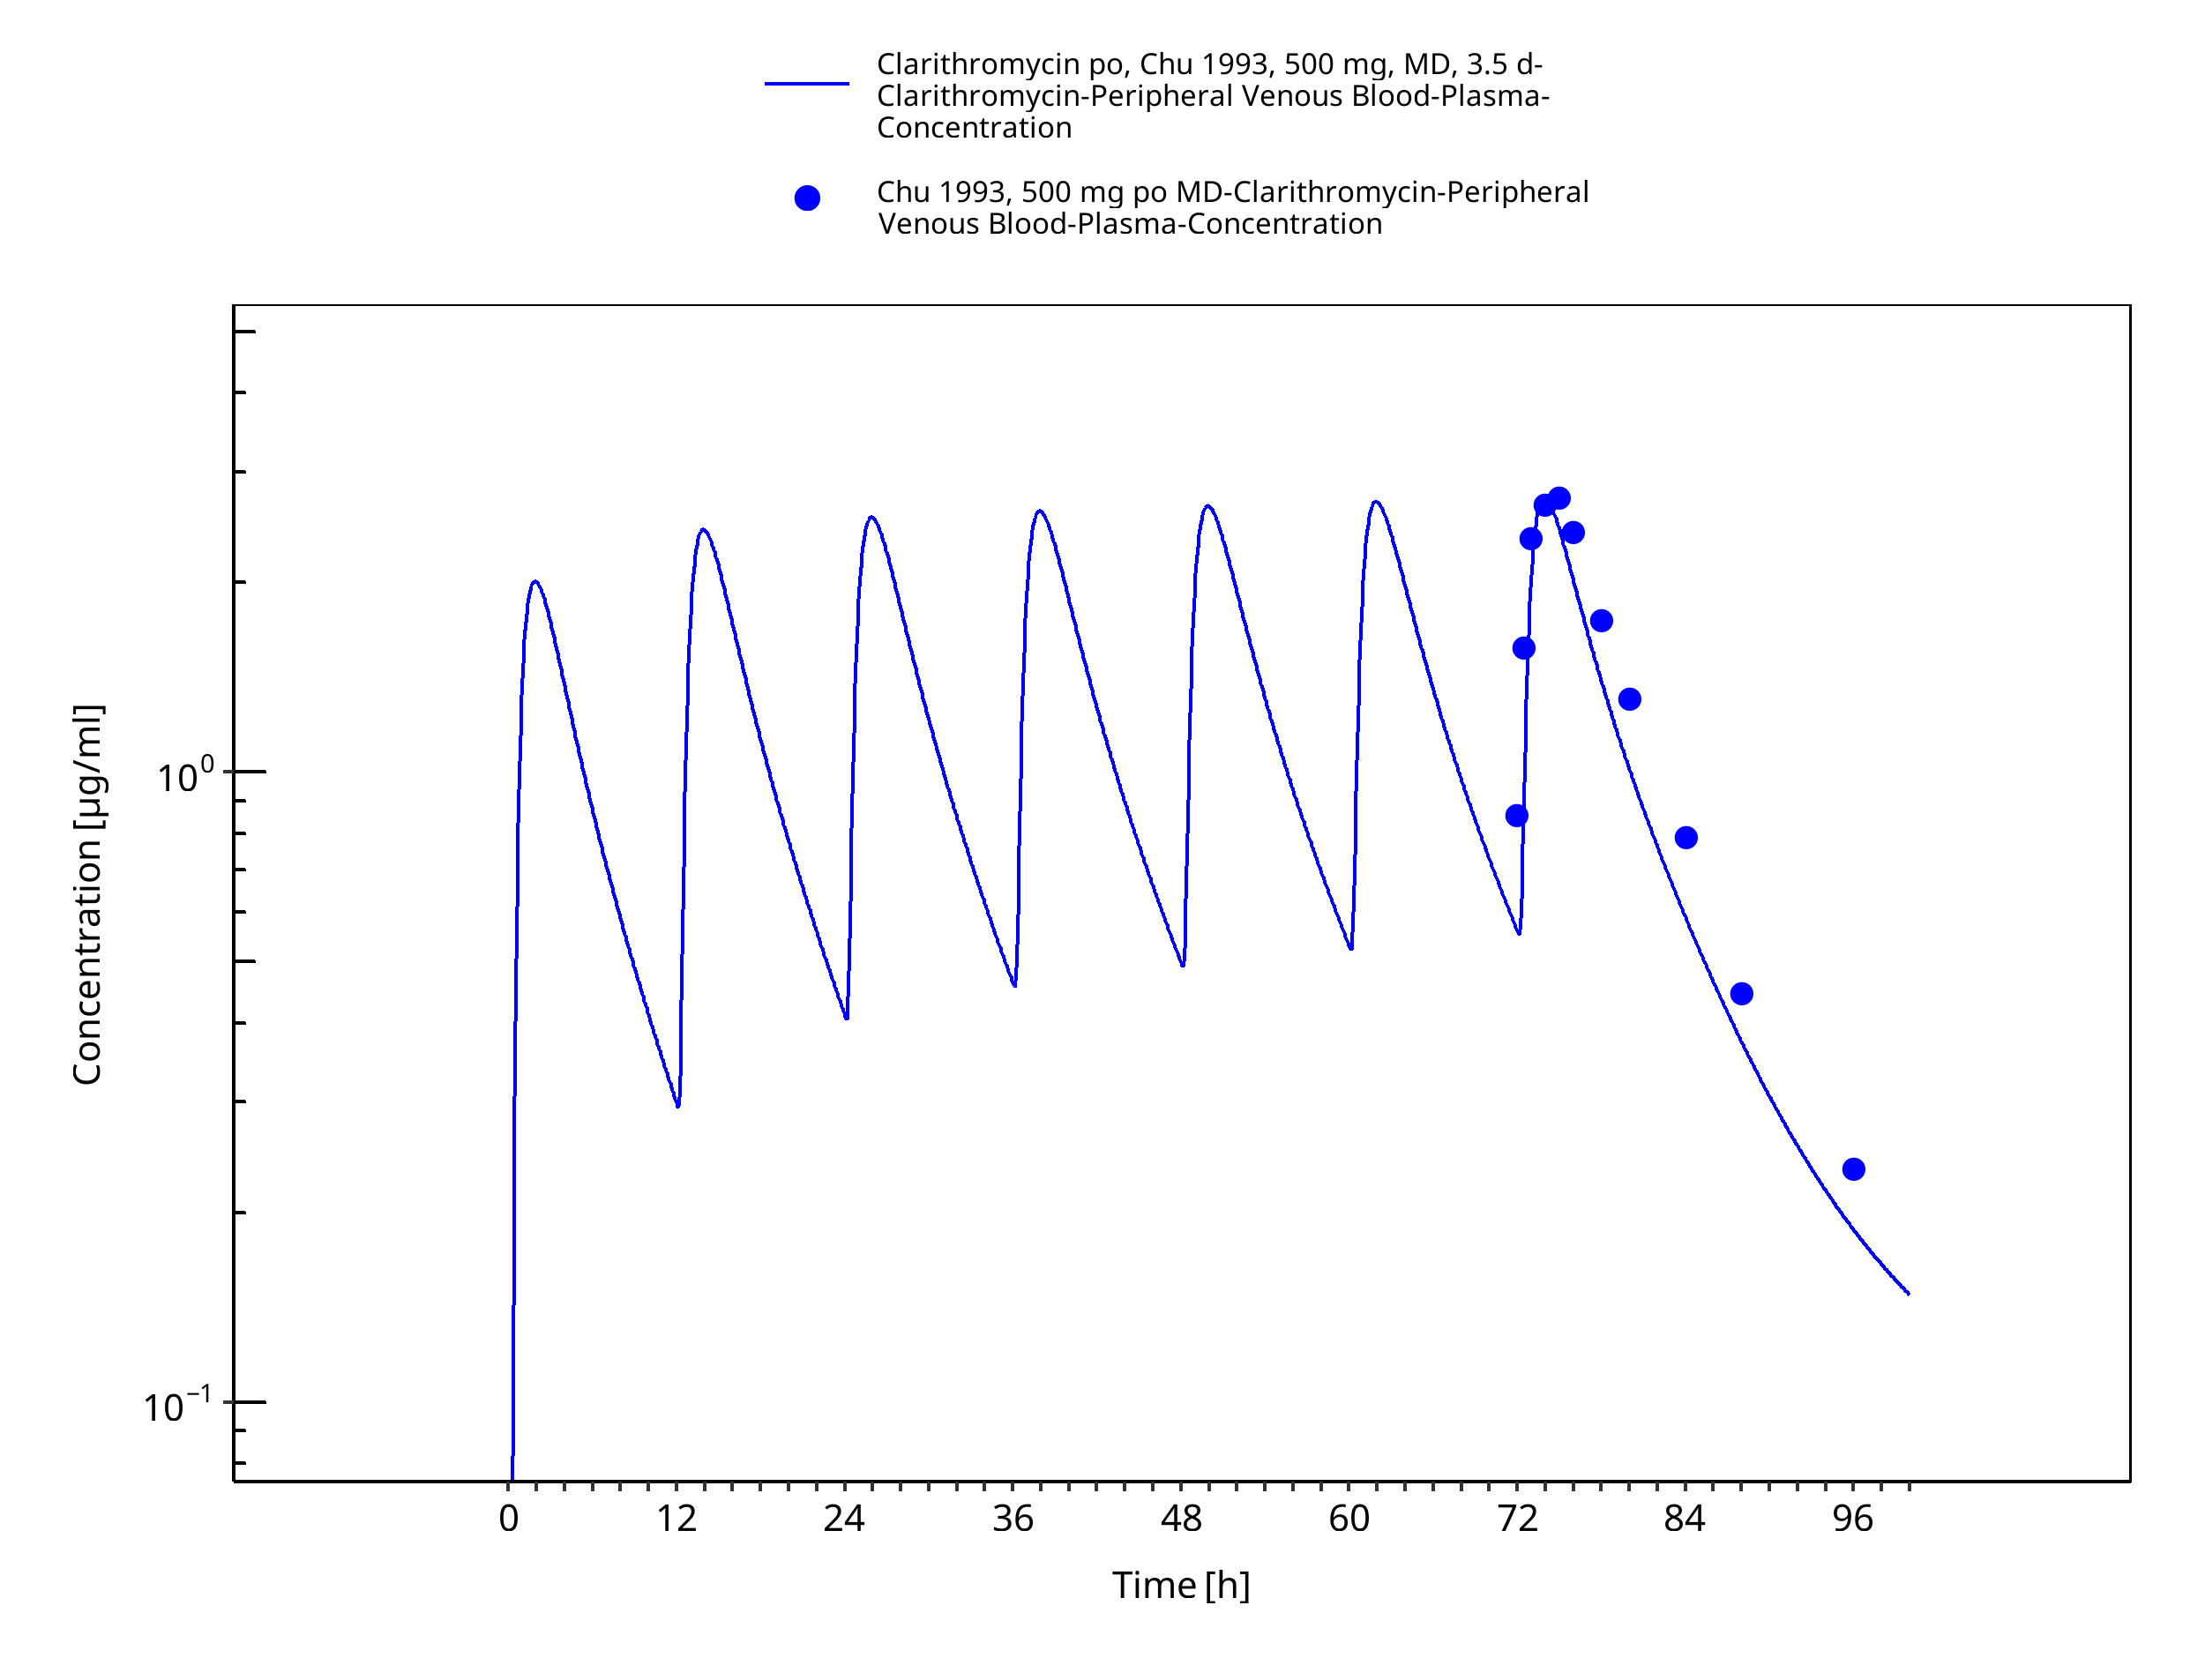
Figure 3-12: Time Profile Analysis 1
3.3.2 Model Verification
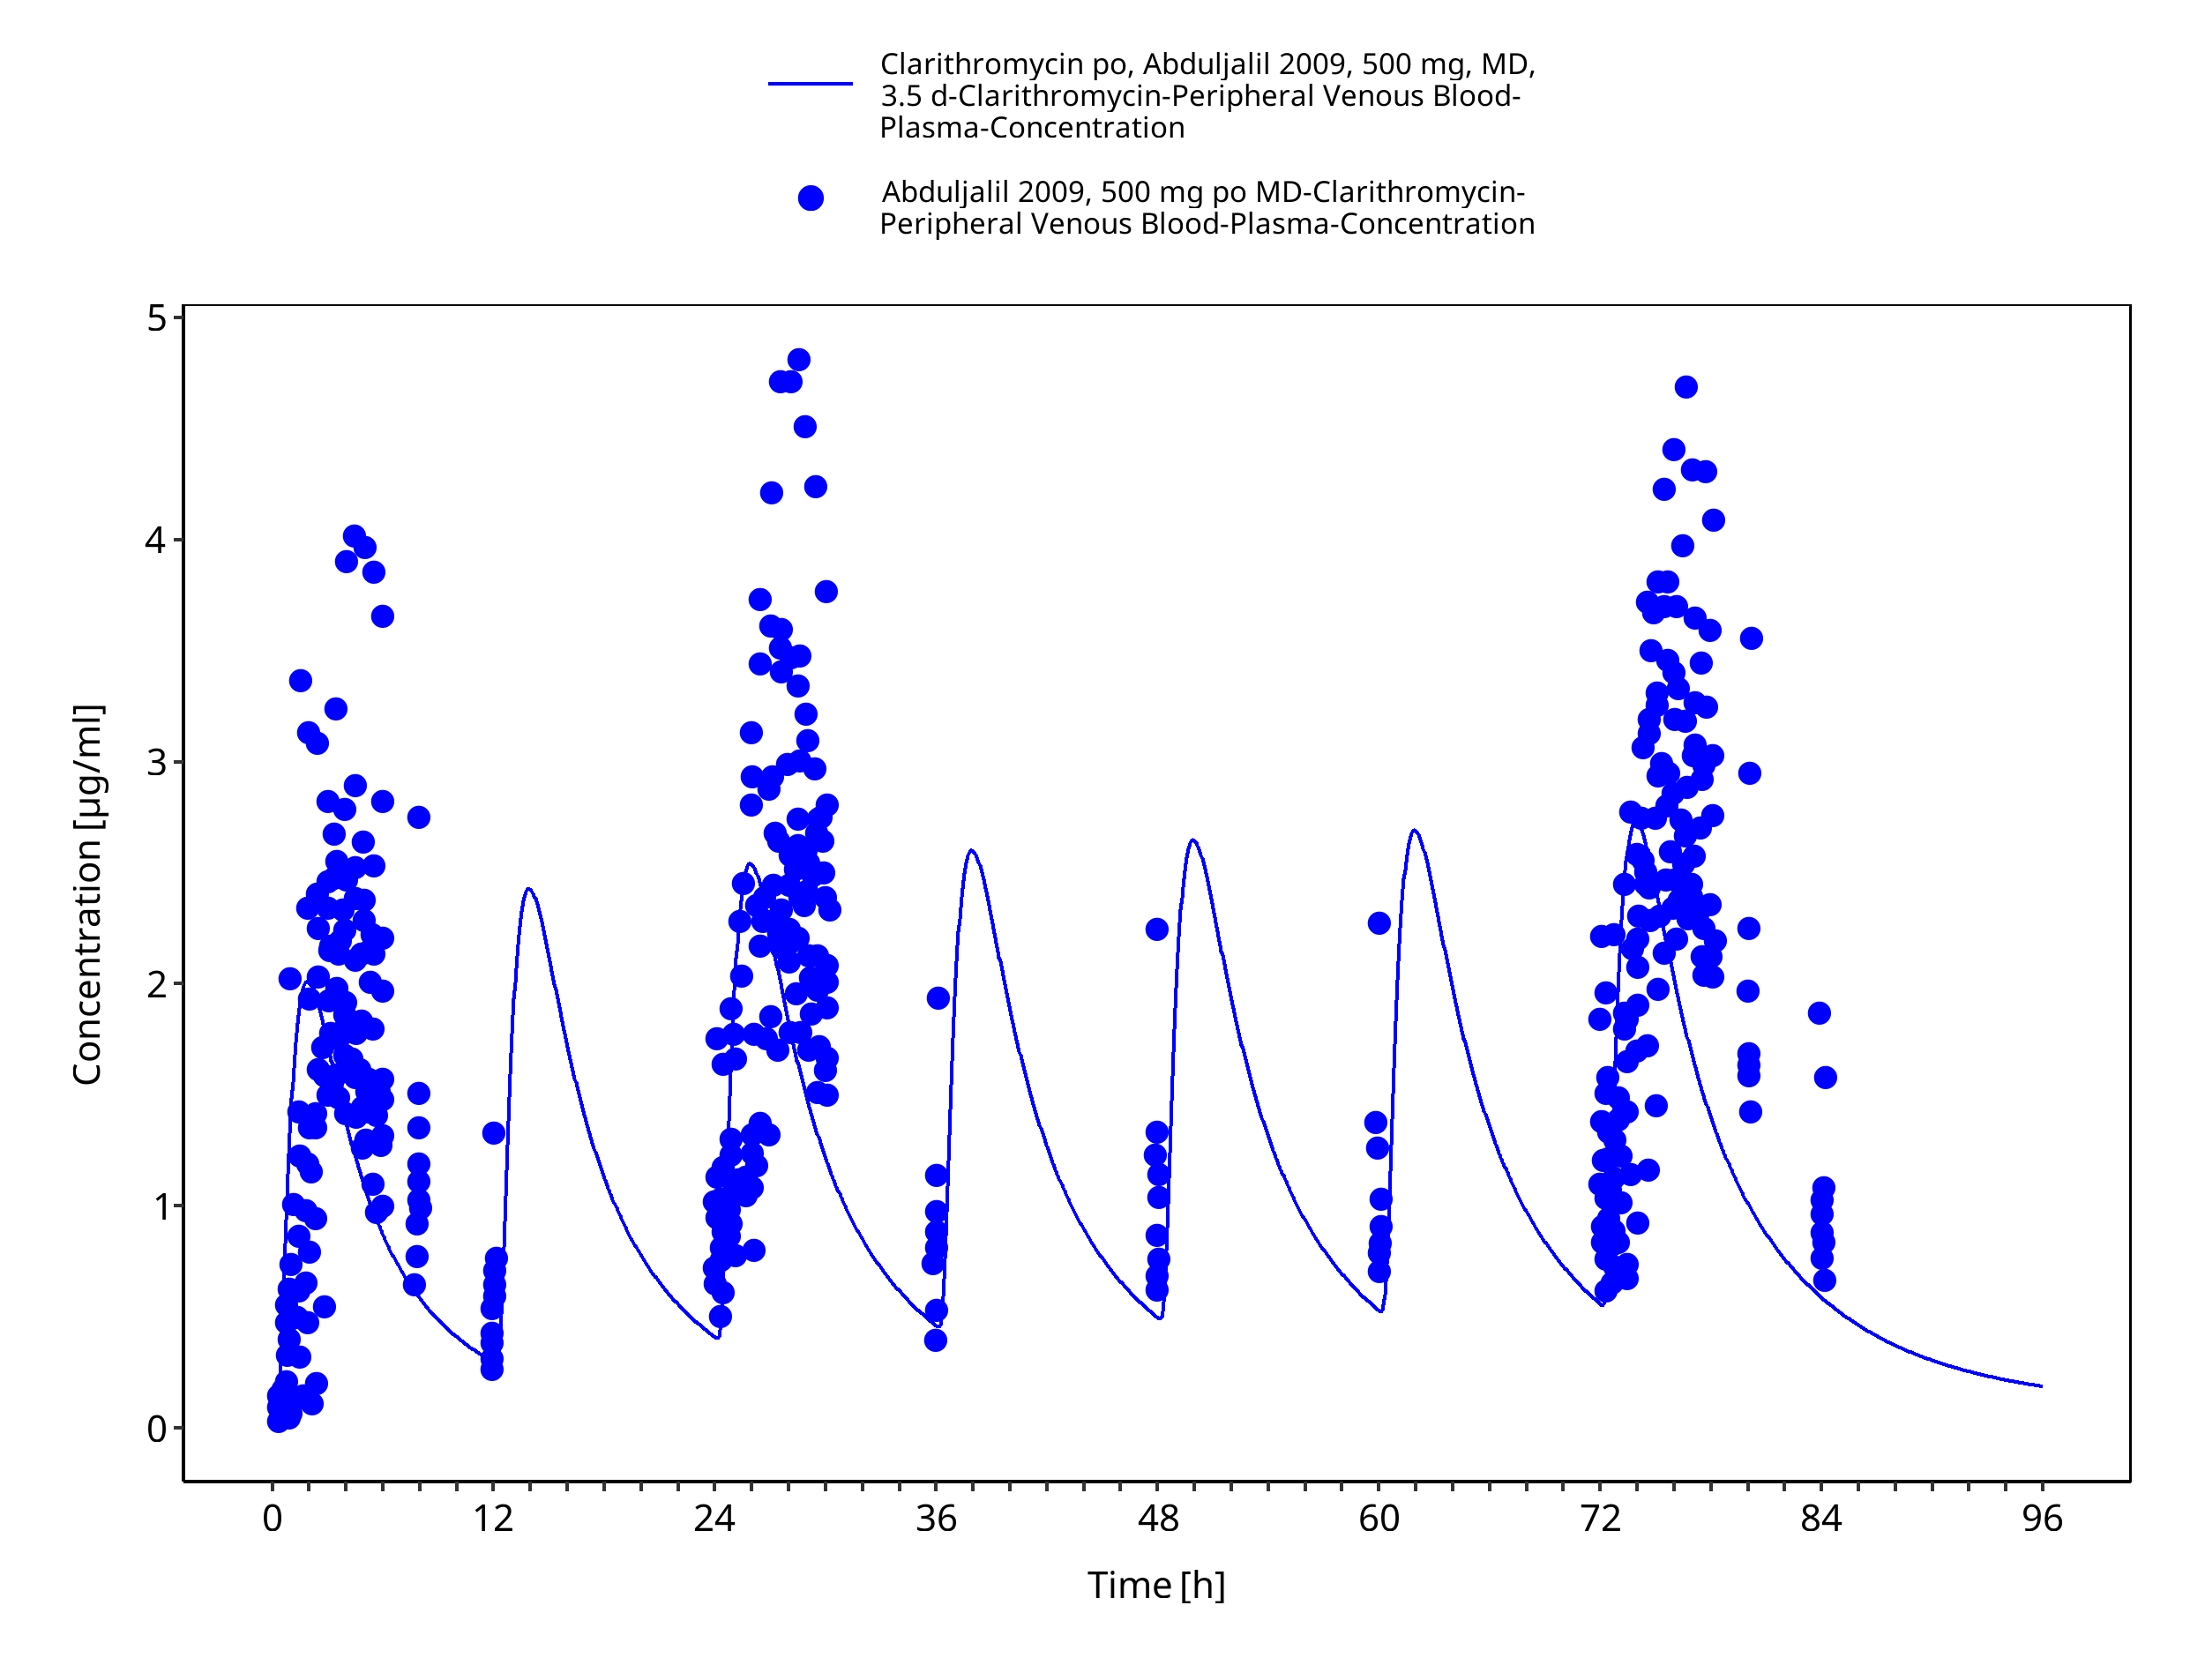
Figure 3-13: Time Profile Analysis
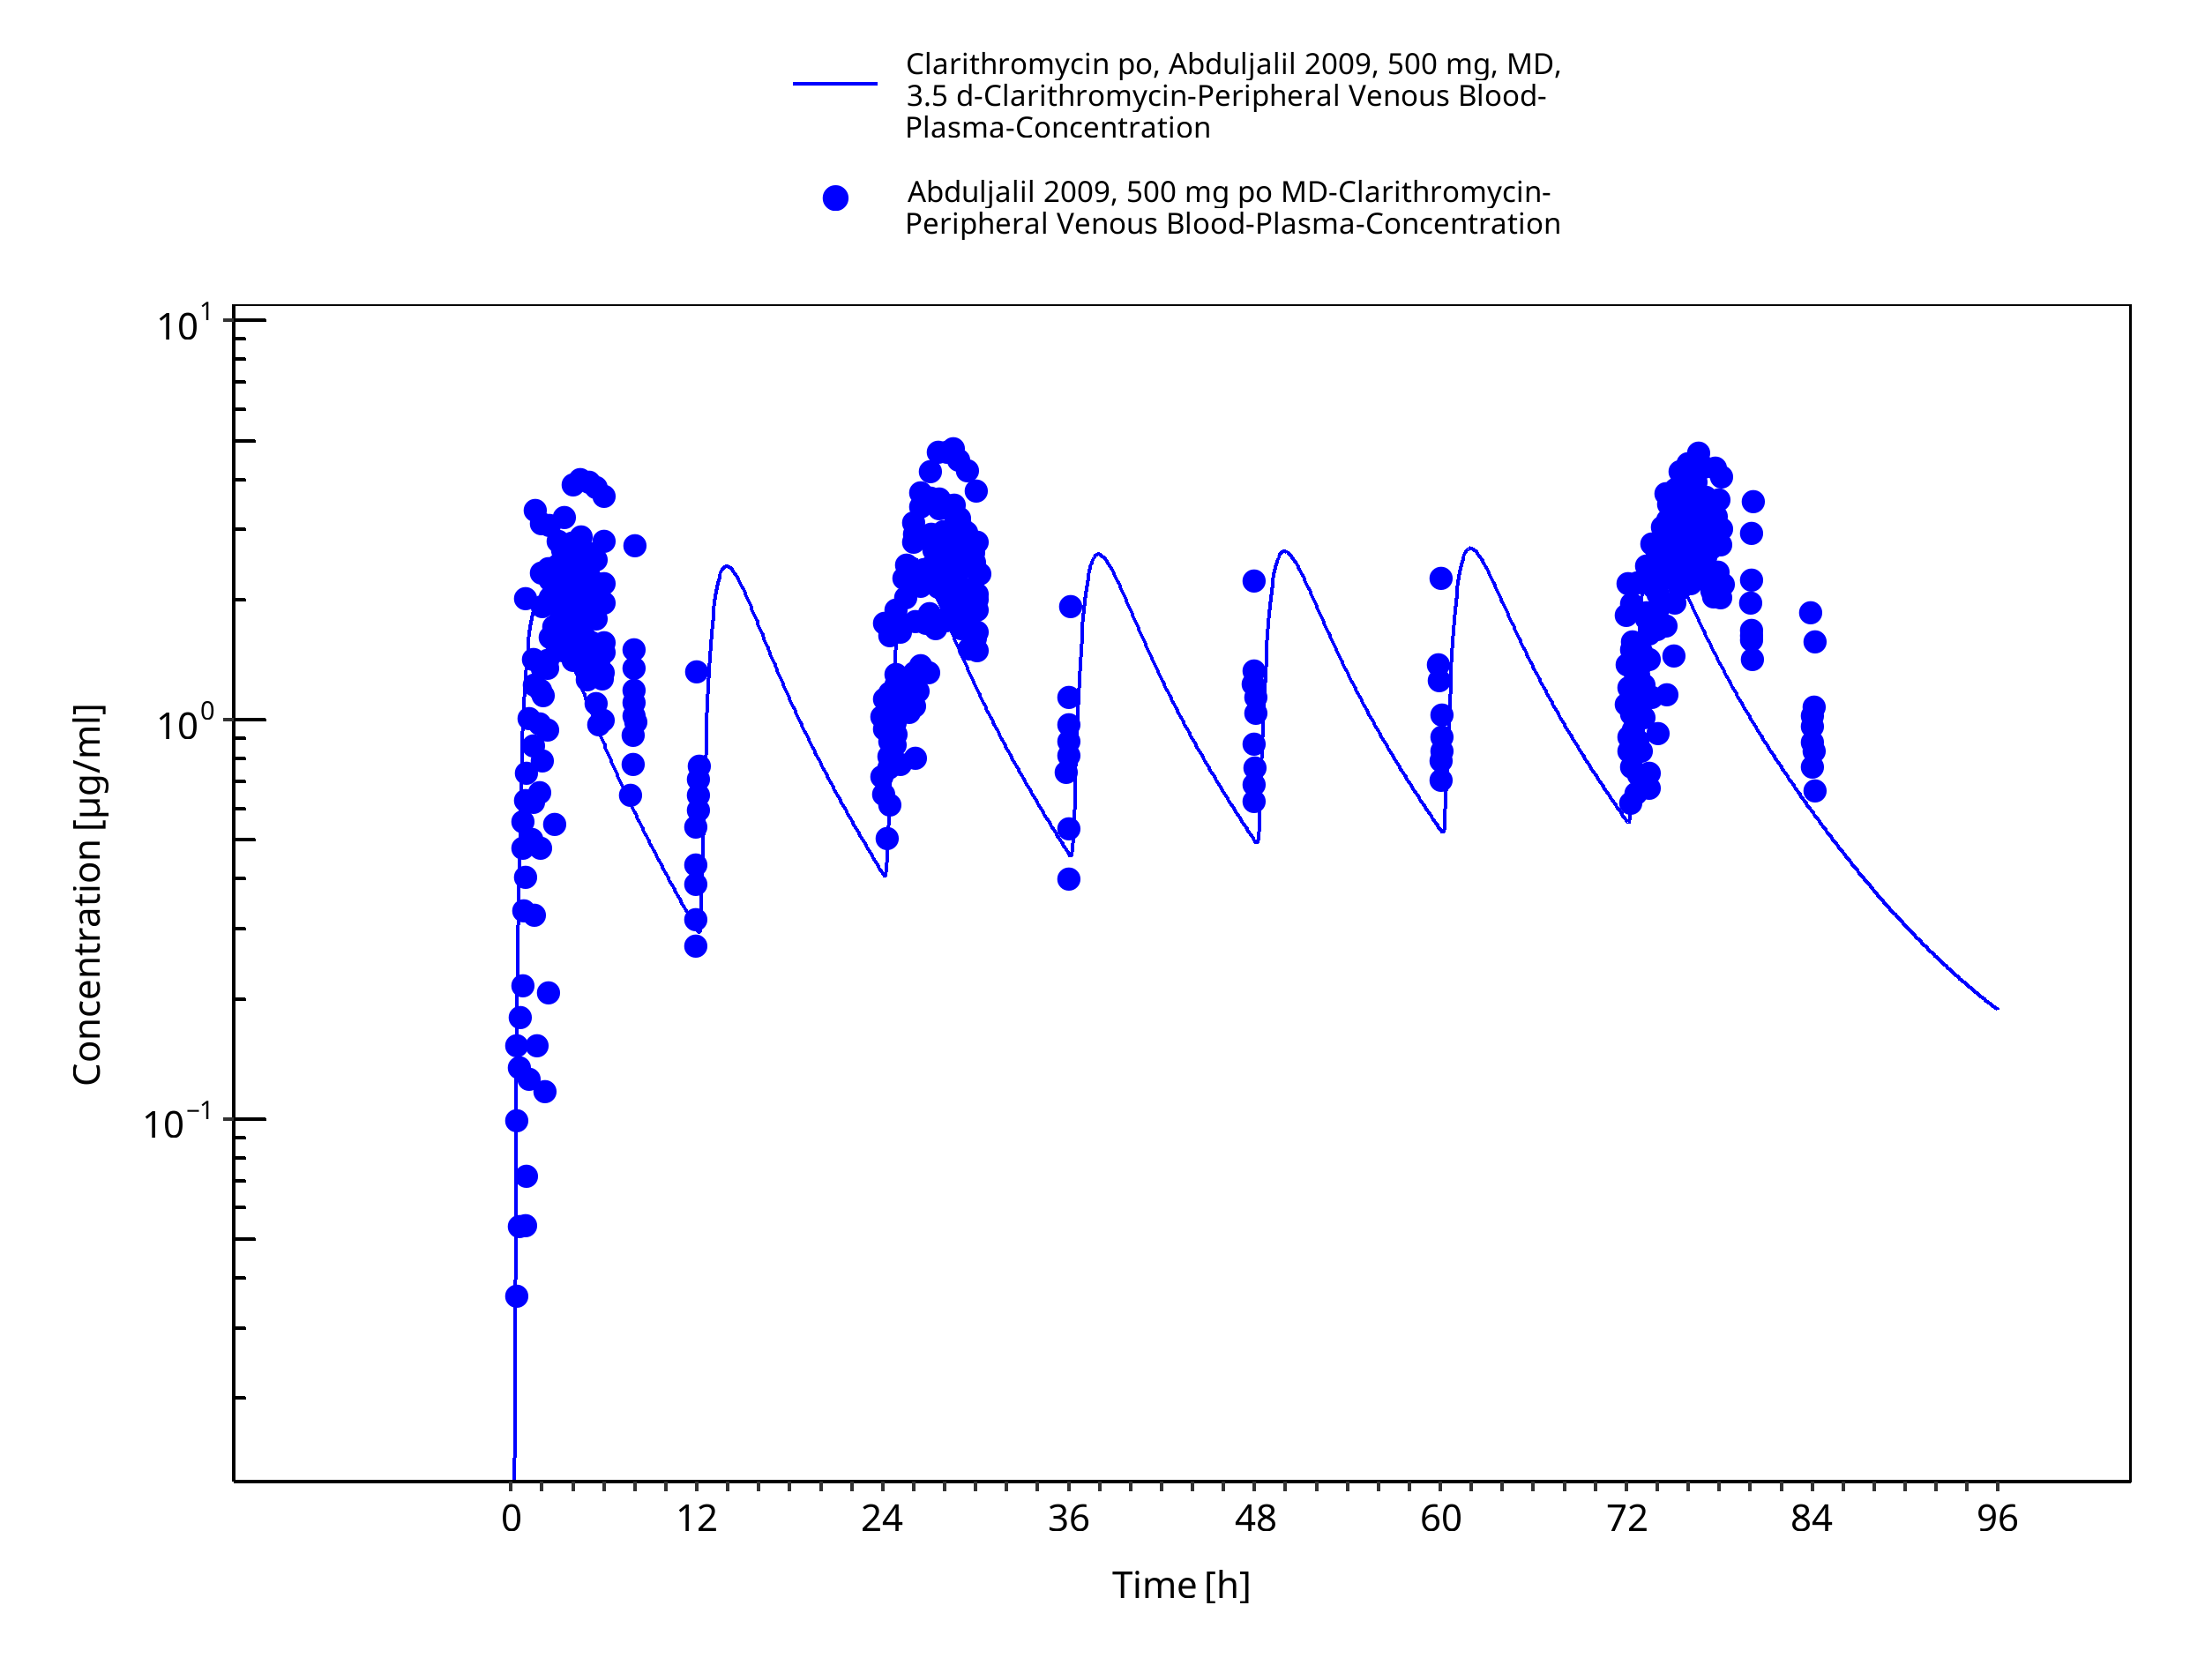
Figure 3-14: Time Profile Analysis 1
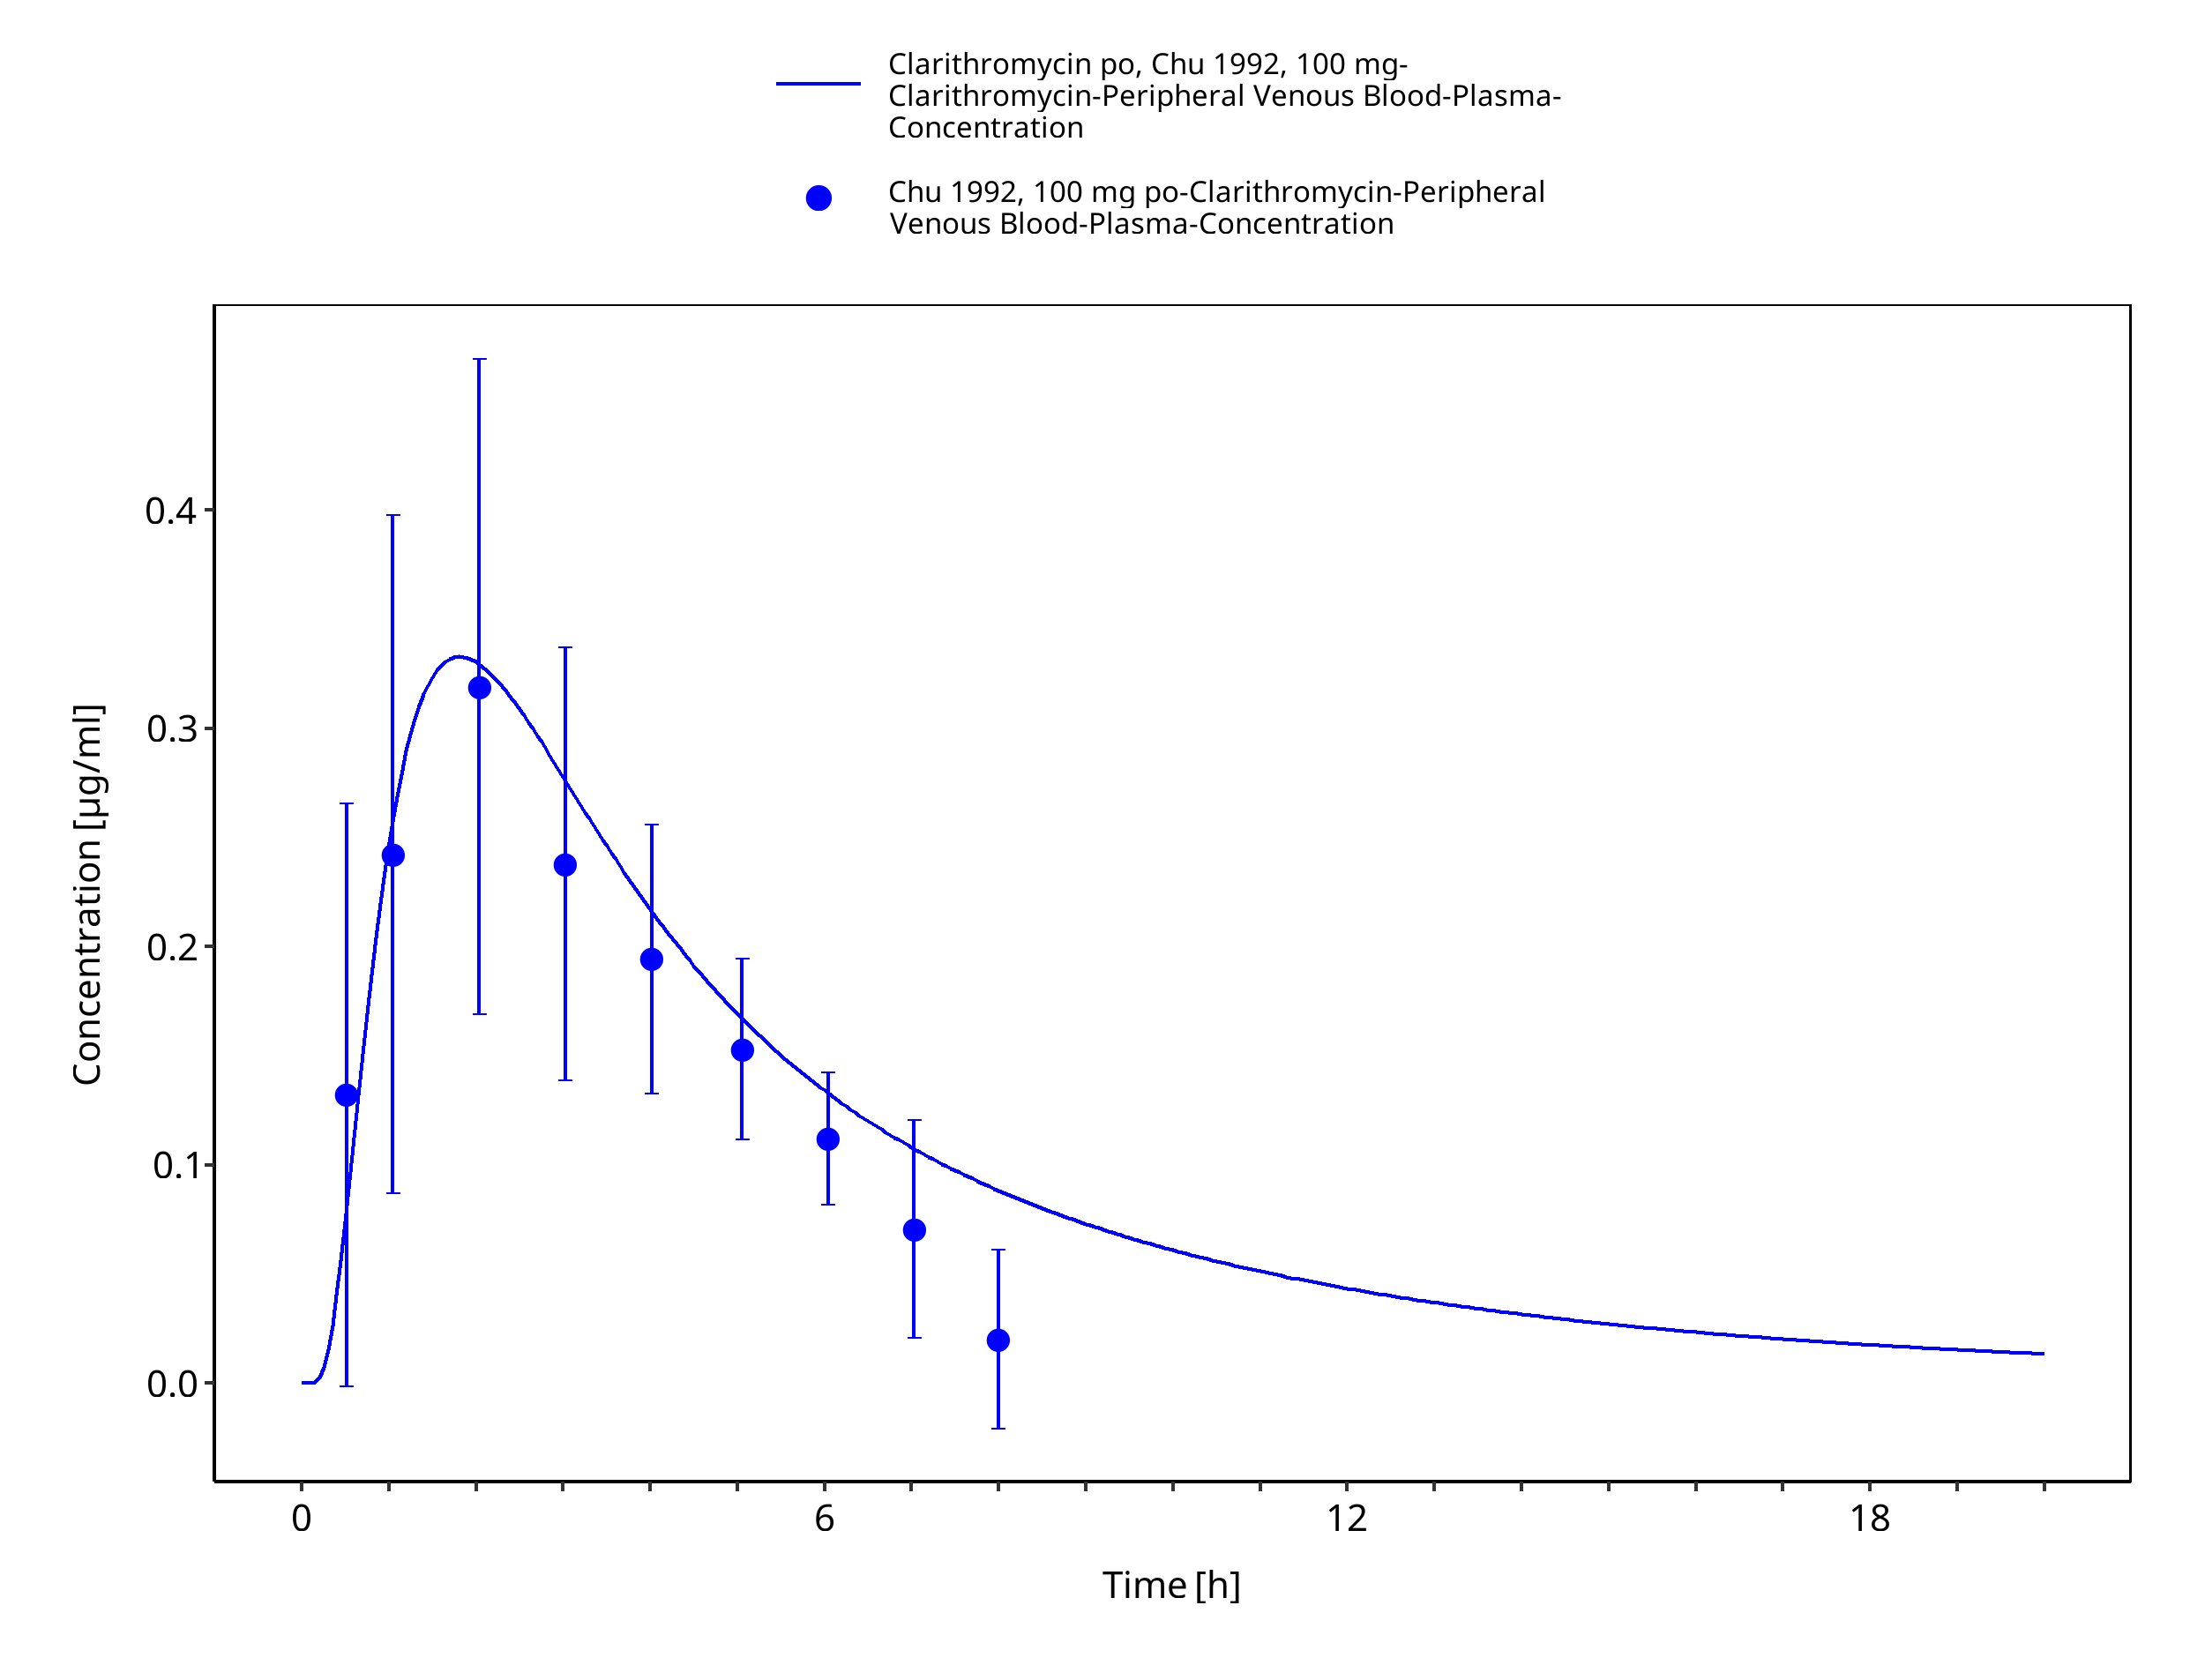
Figure 3-15: Time Profile Analysis
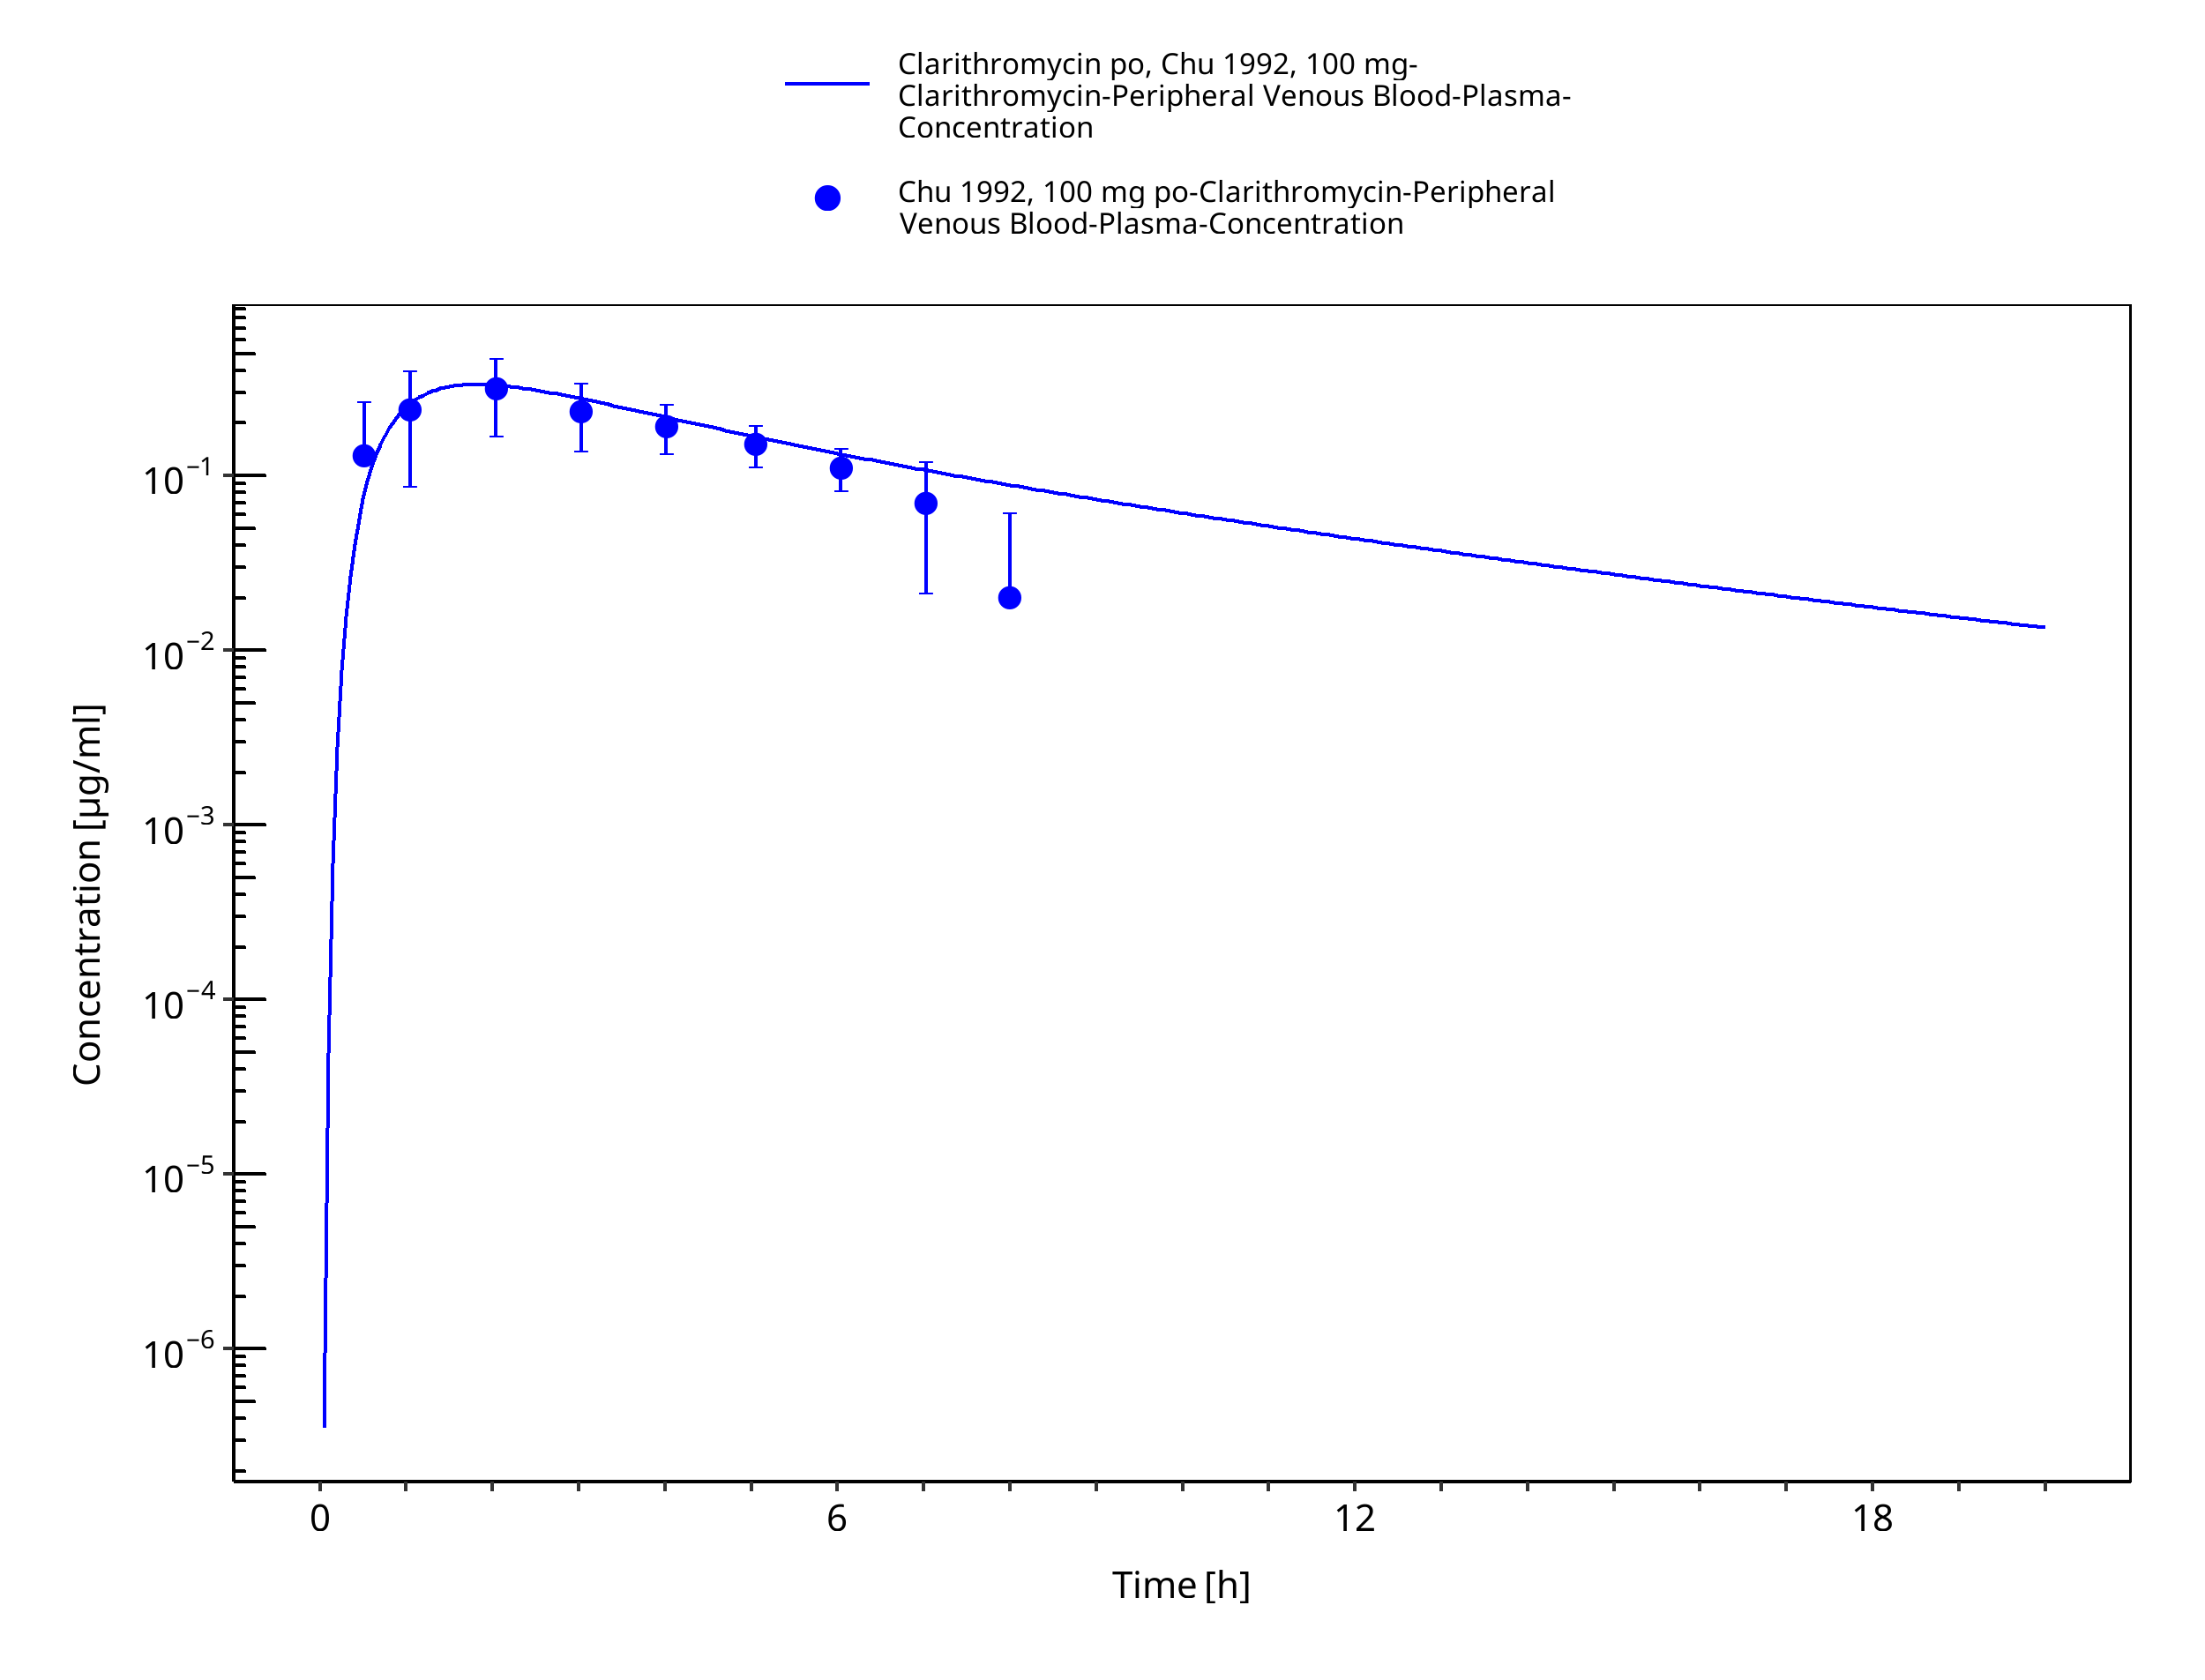
Figure 3-16: Time Profile Analysis 1
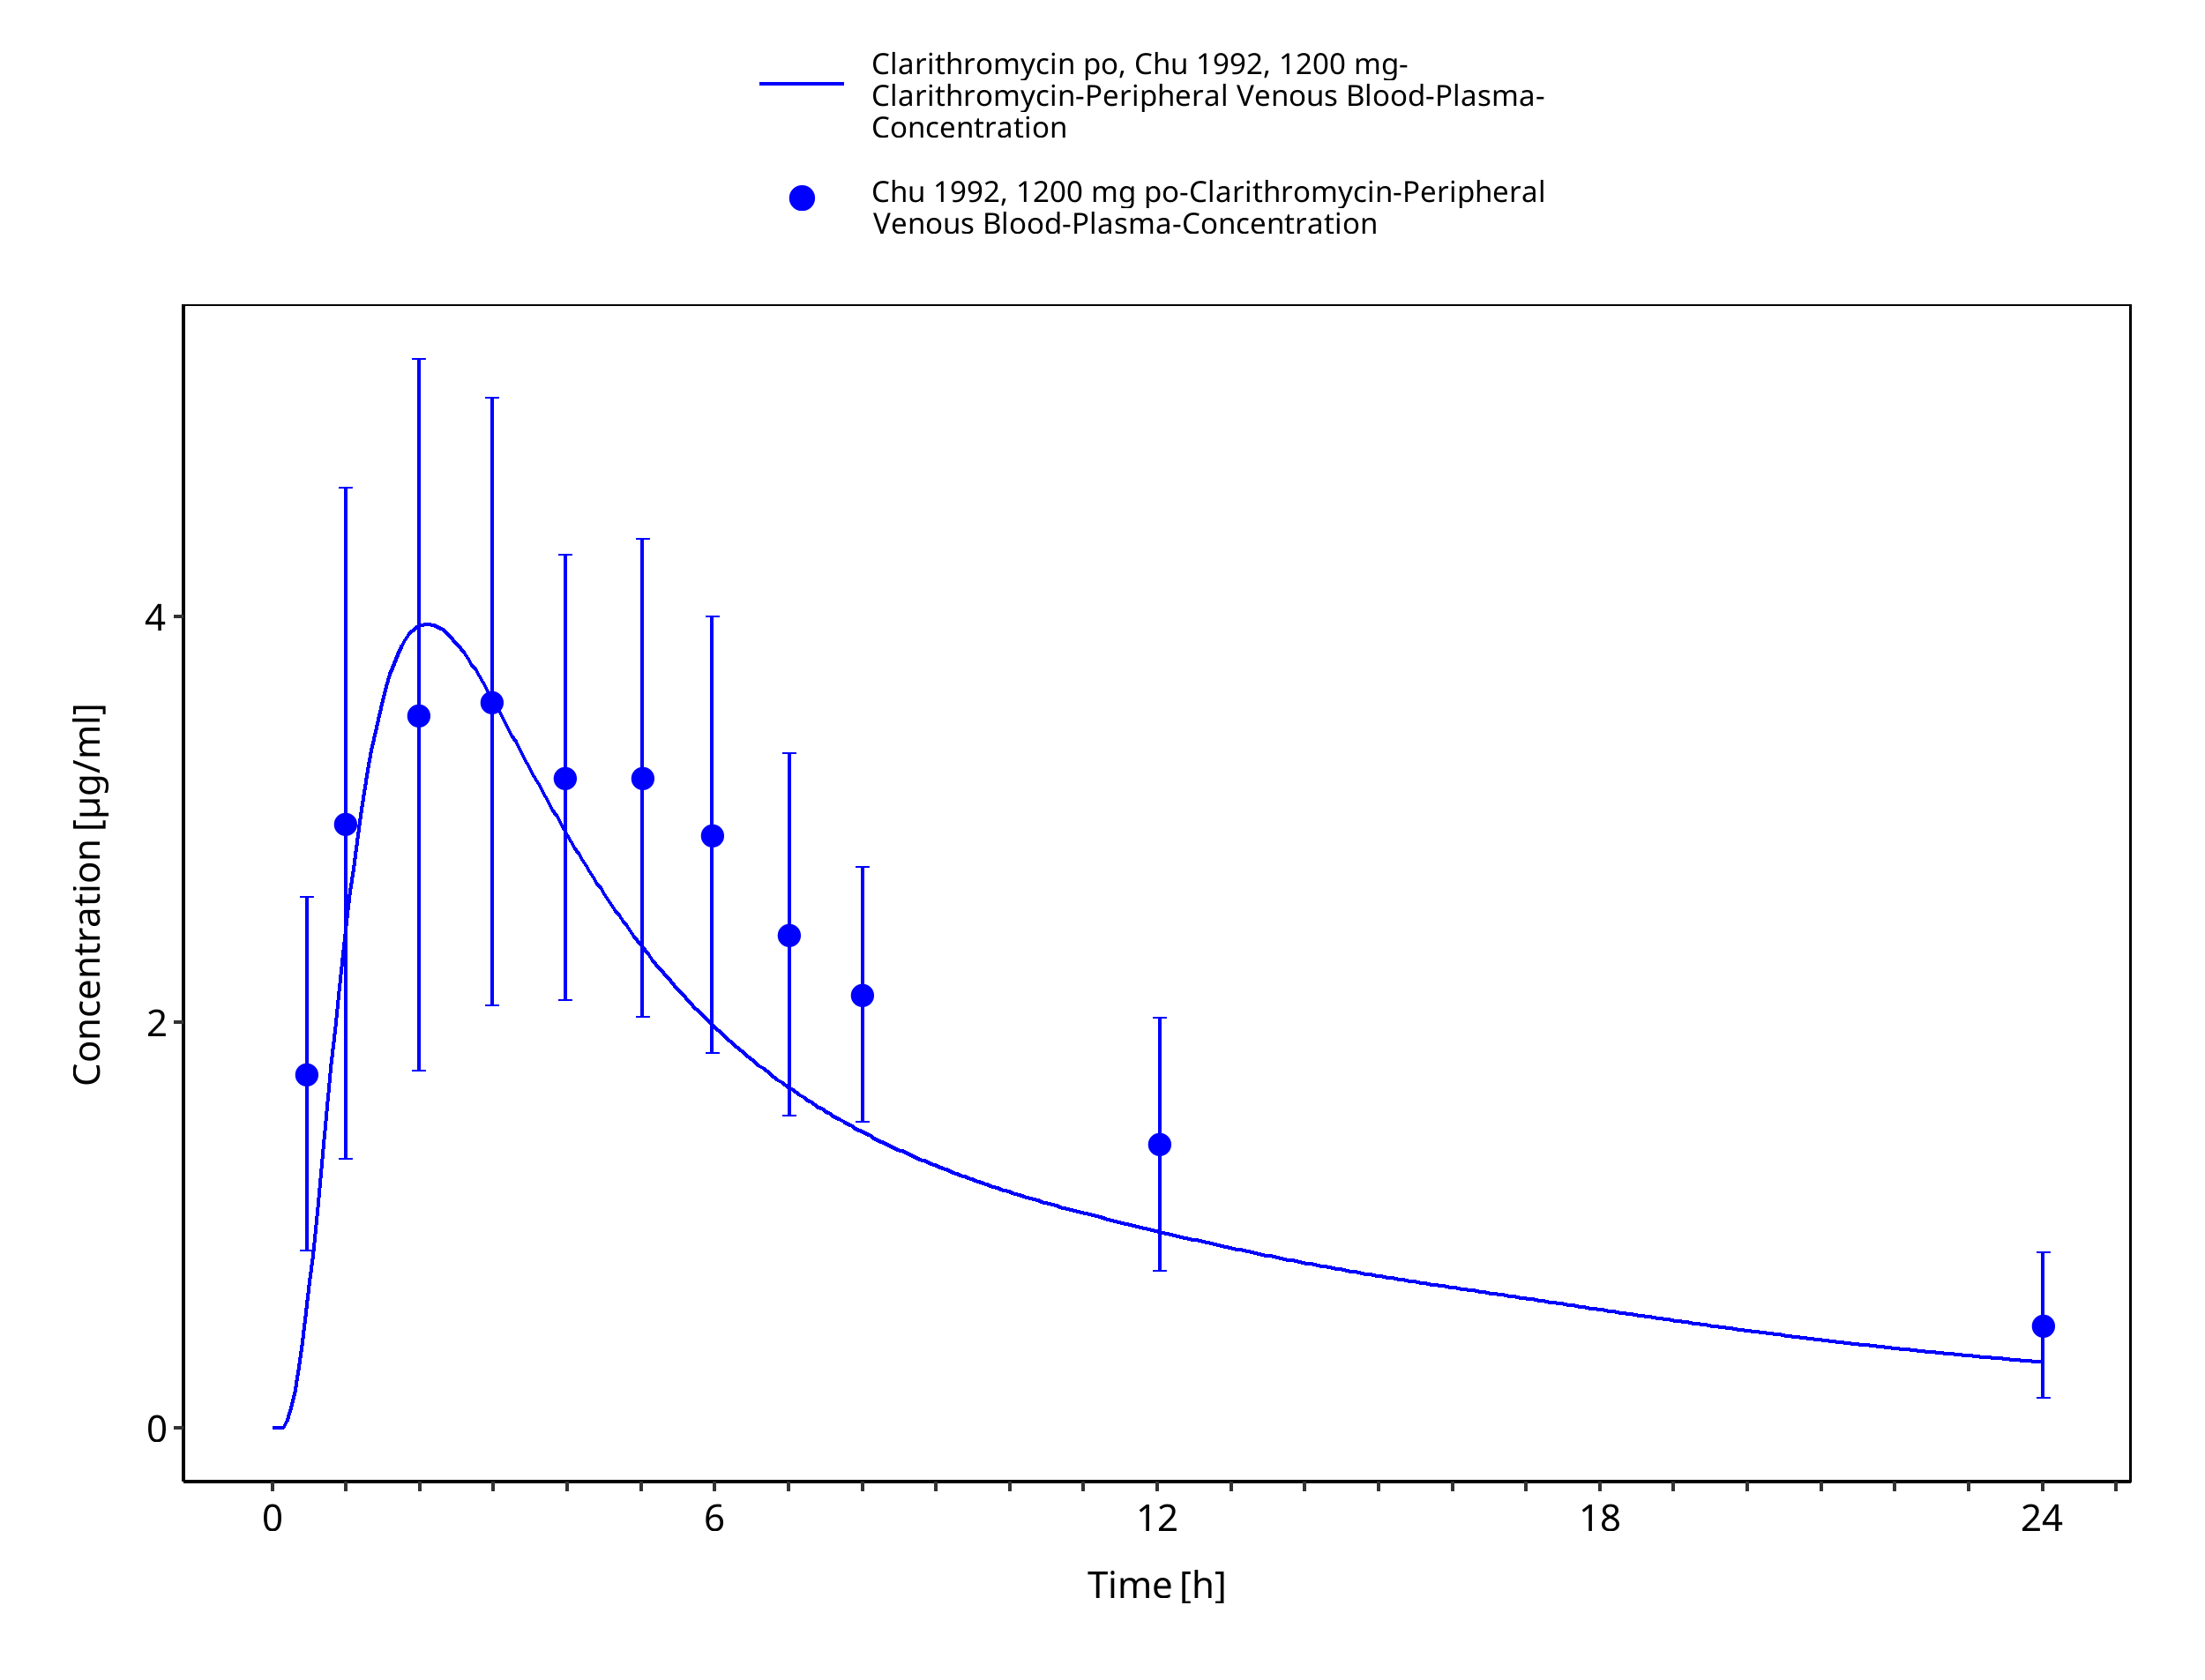
Figure 3-17: Time Profile Analysis
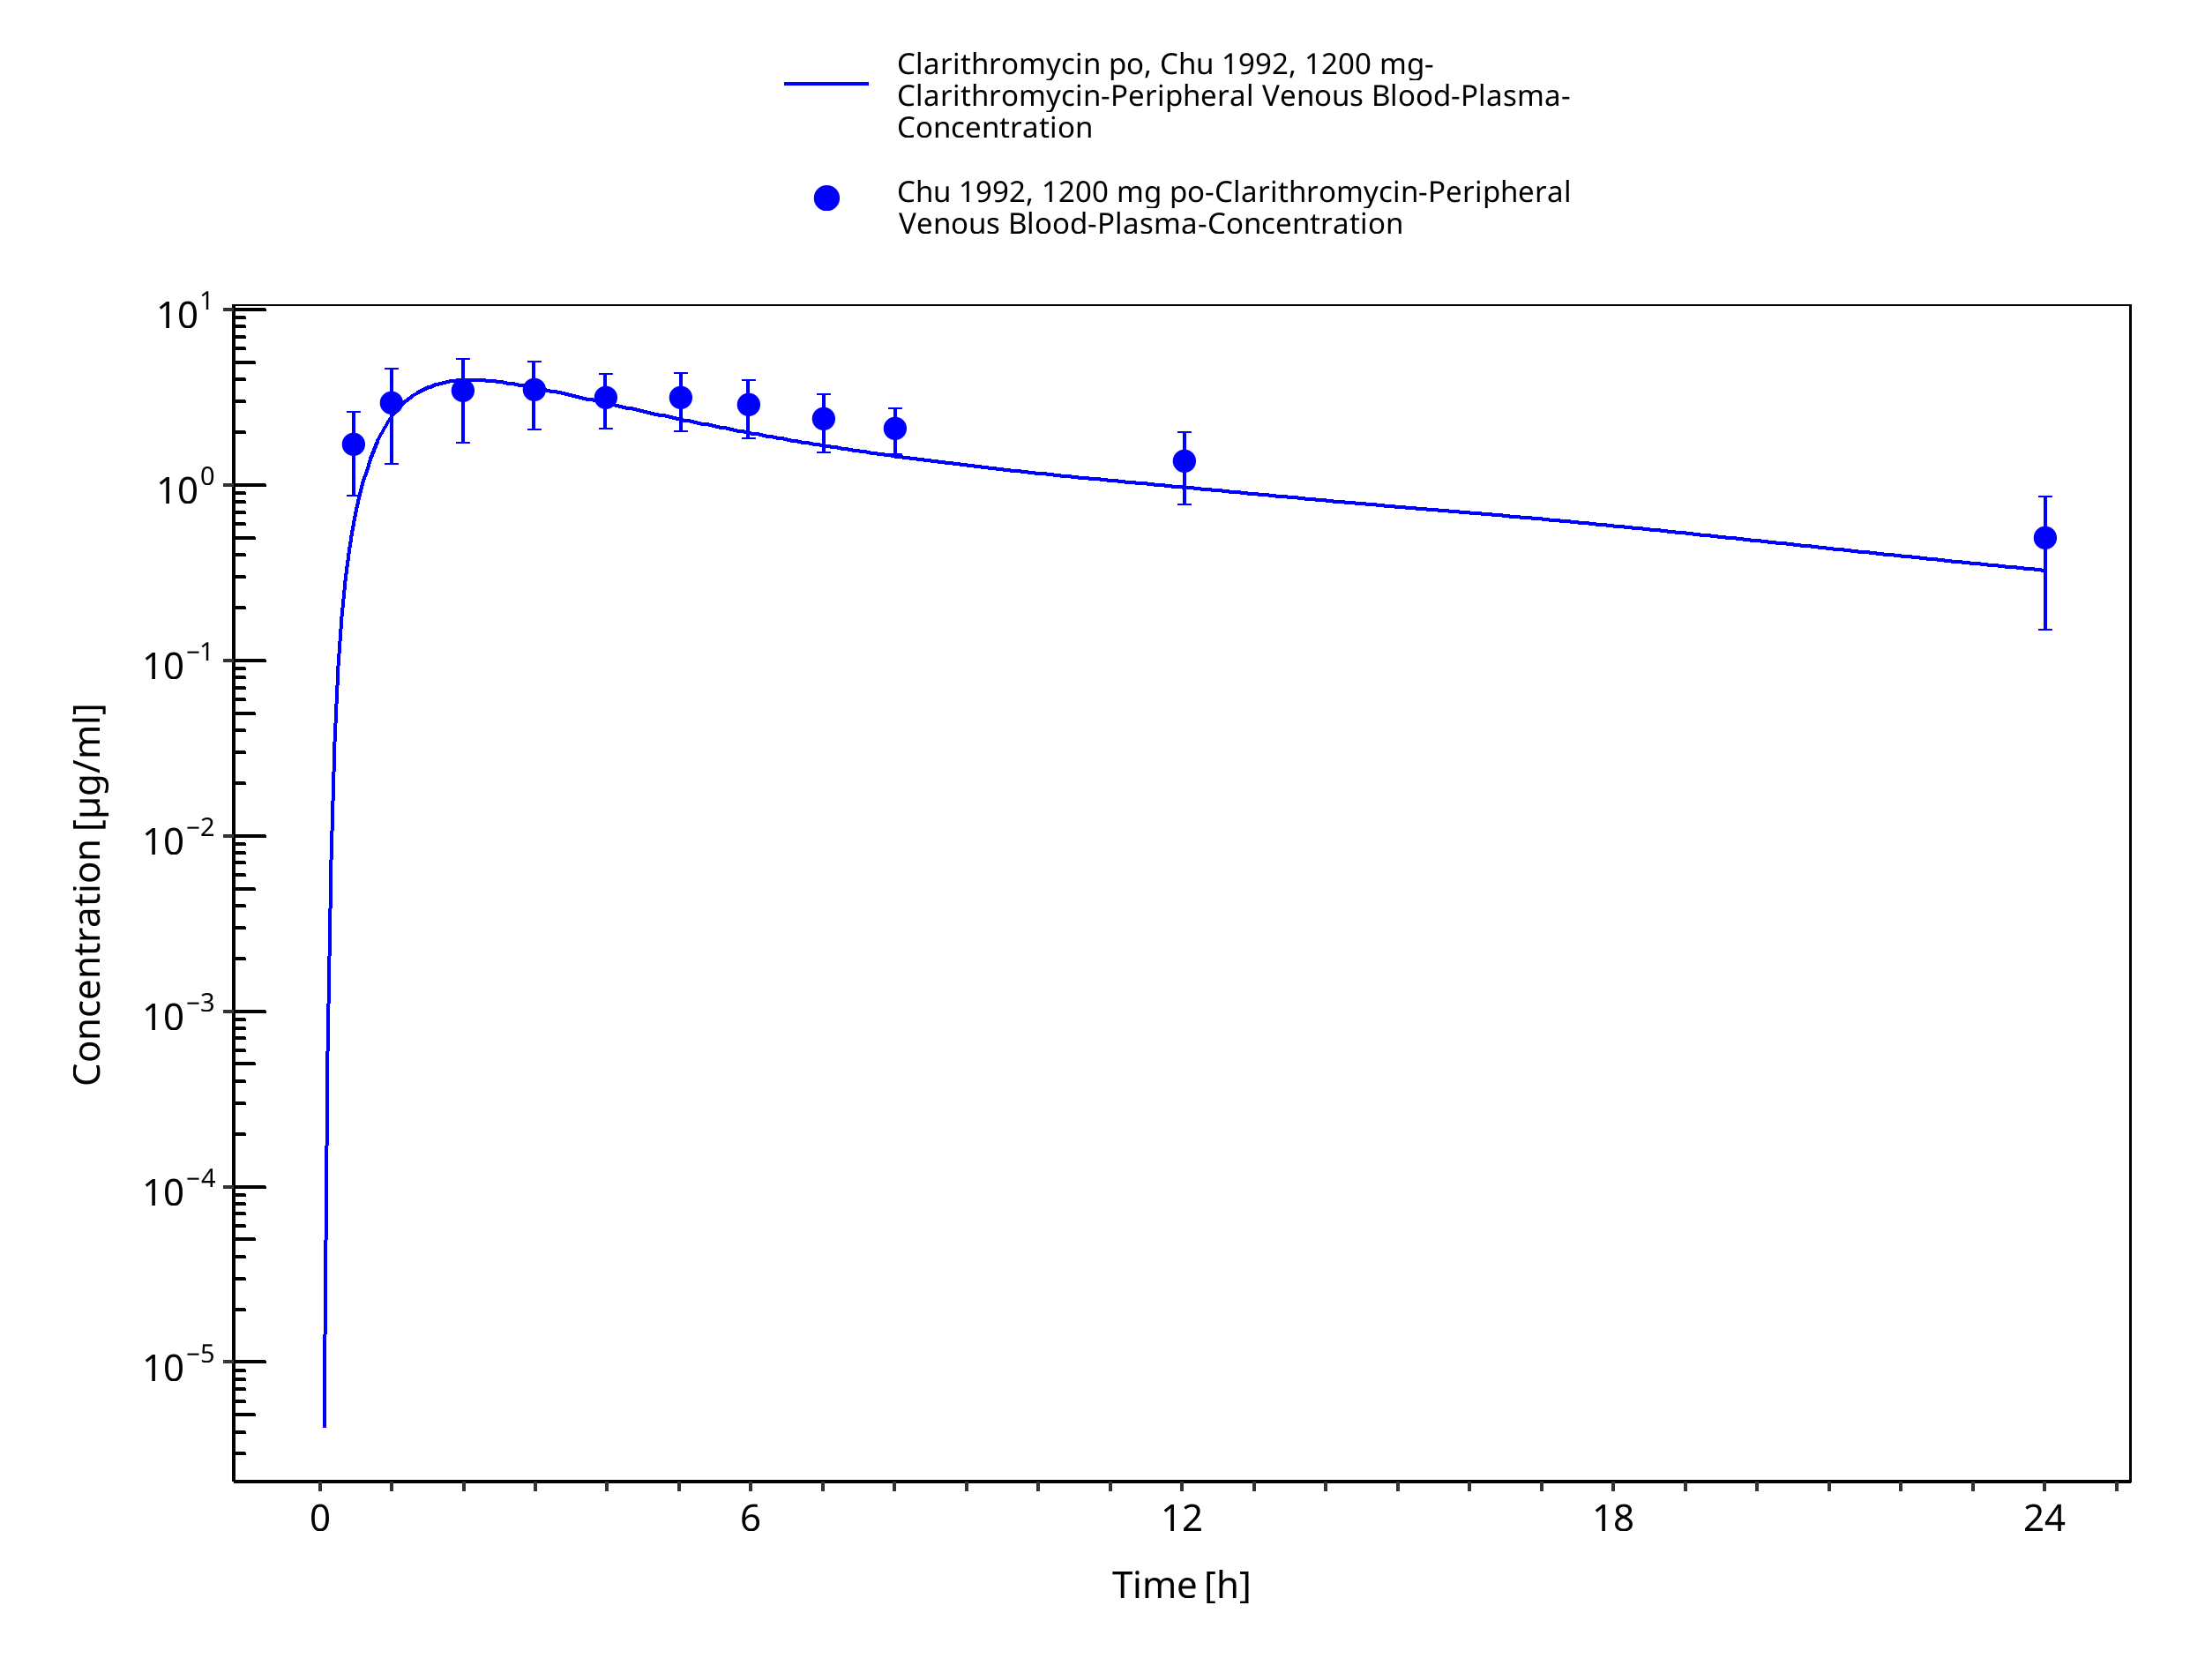
Figure 3-18: Time Profile Analysis 1
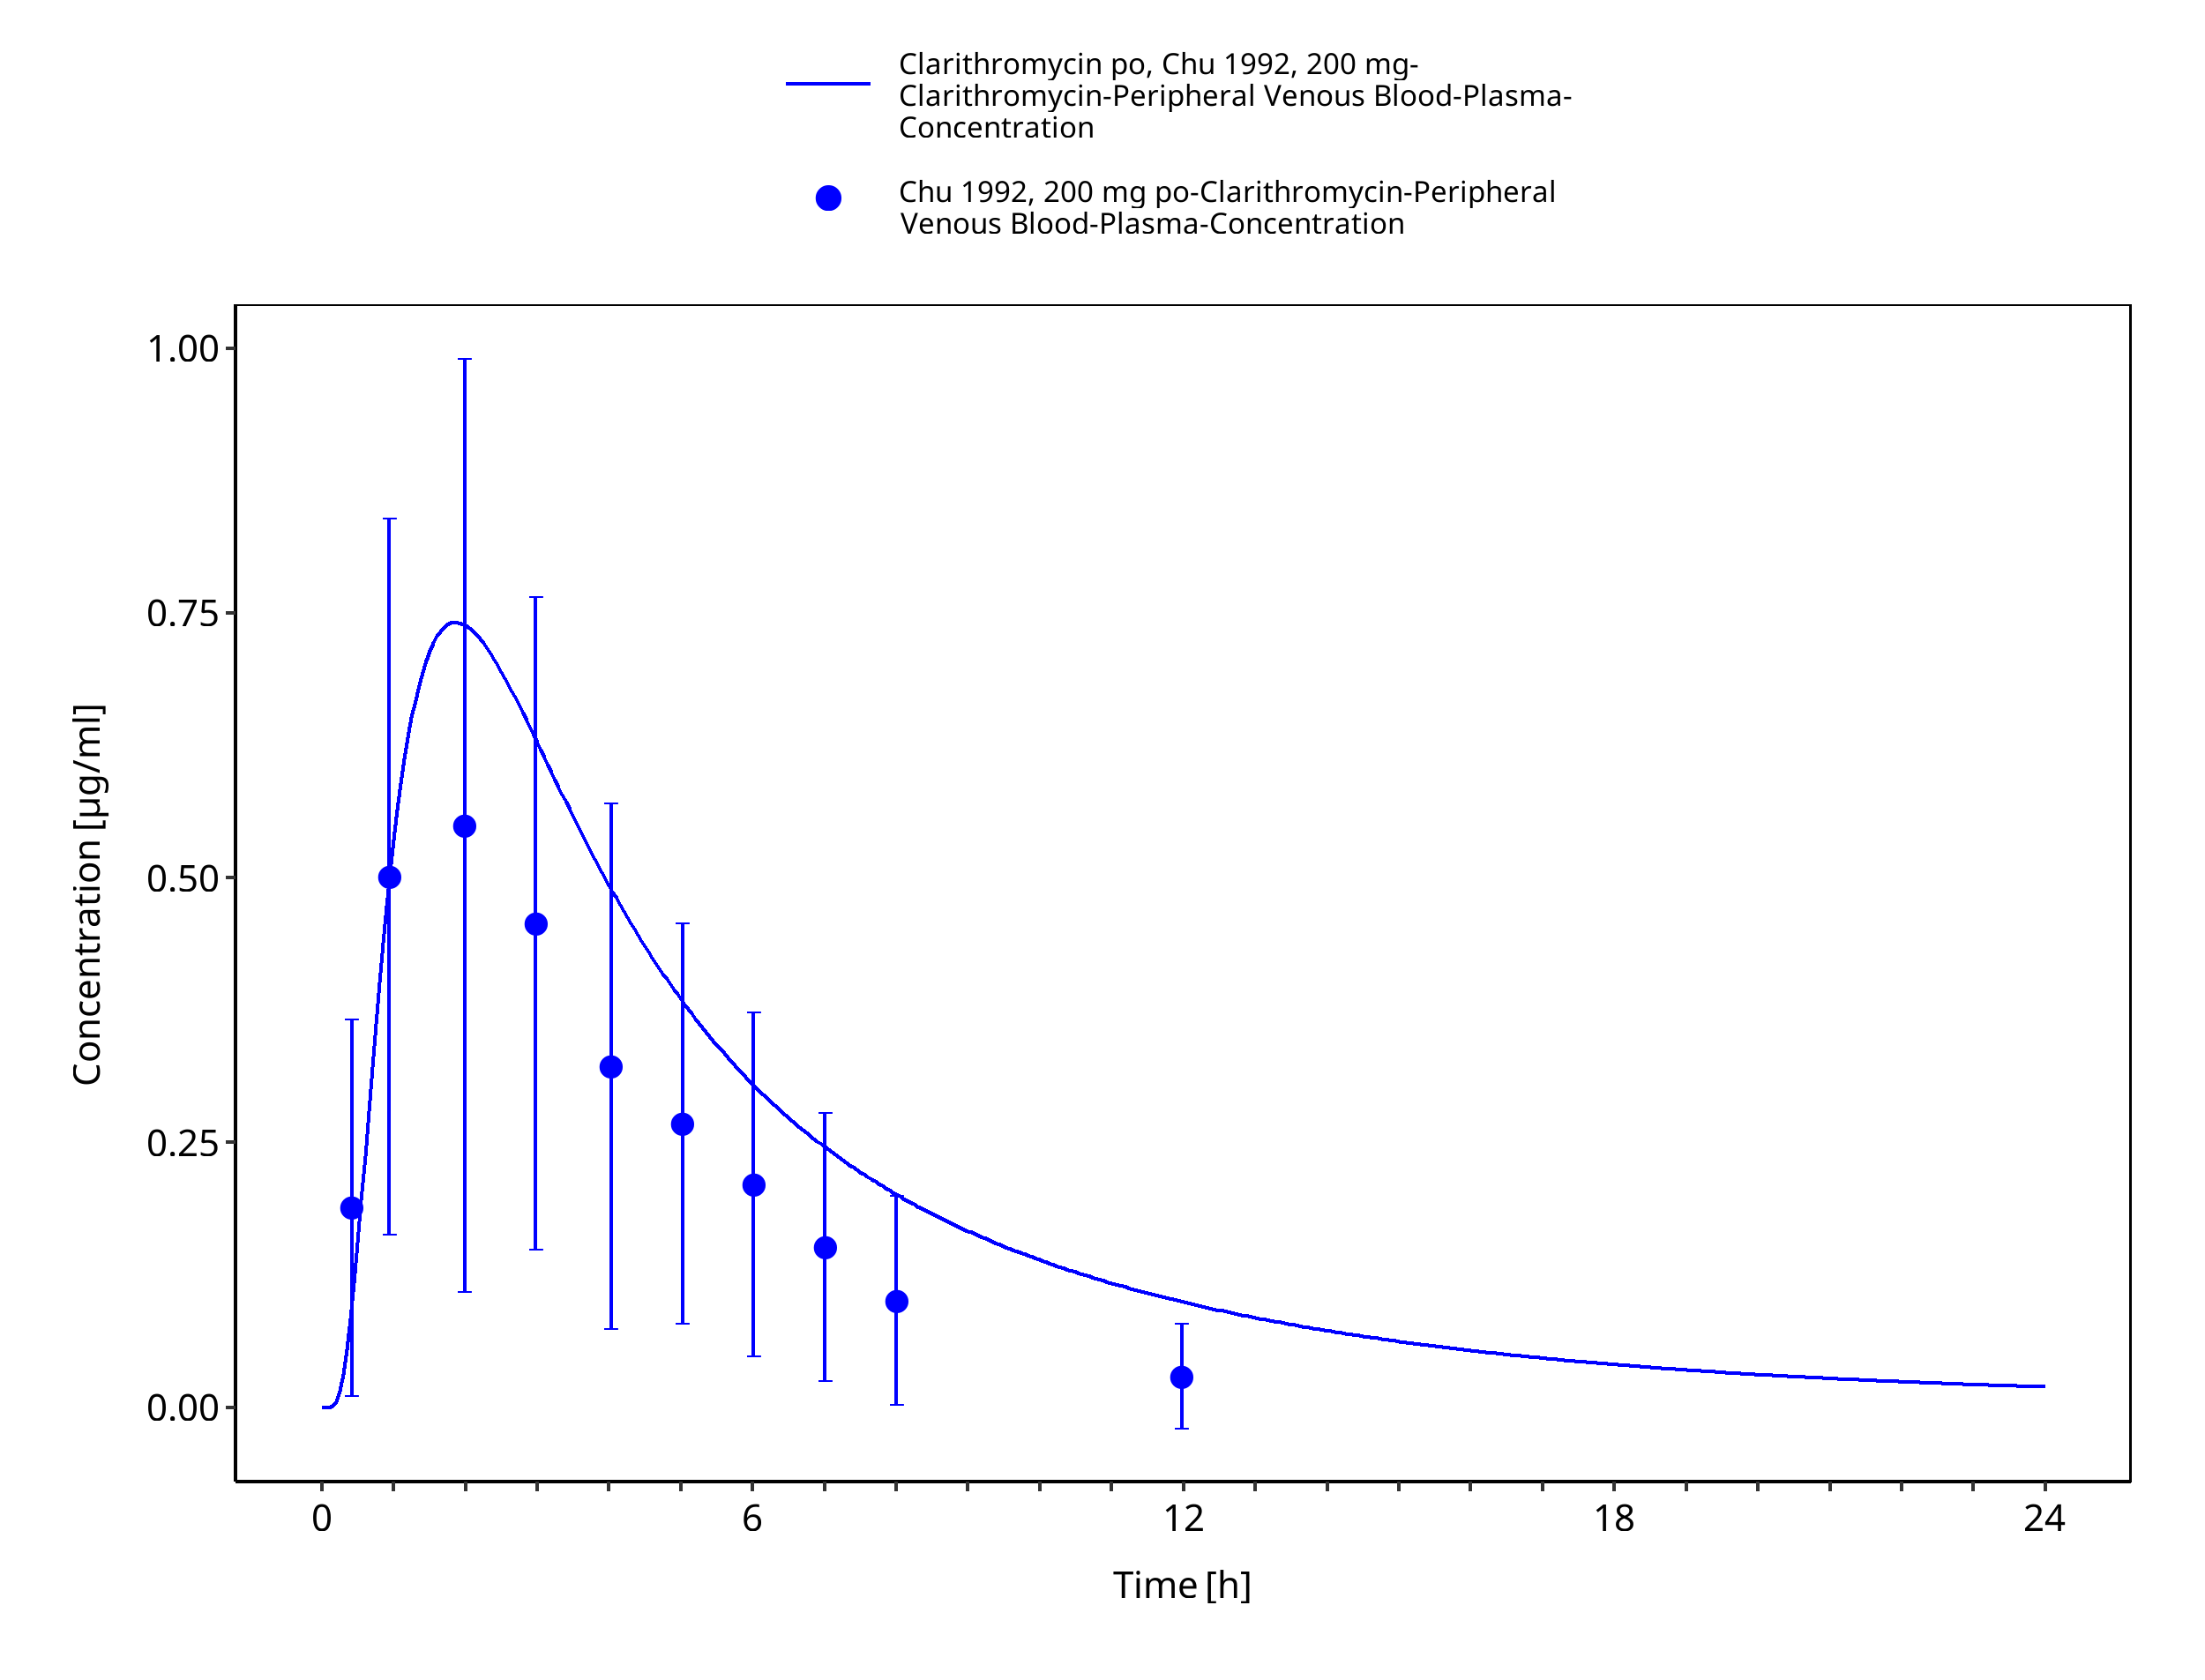
Figure 3-19: Time Profile Analysis
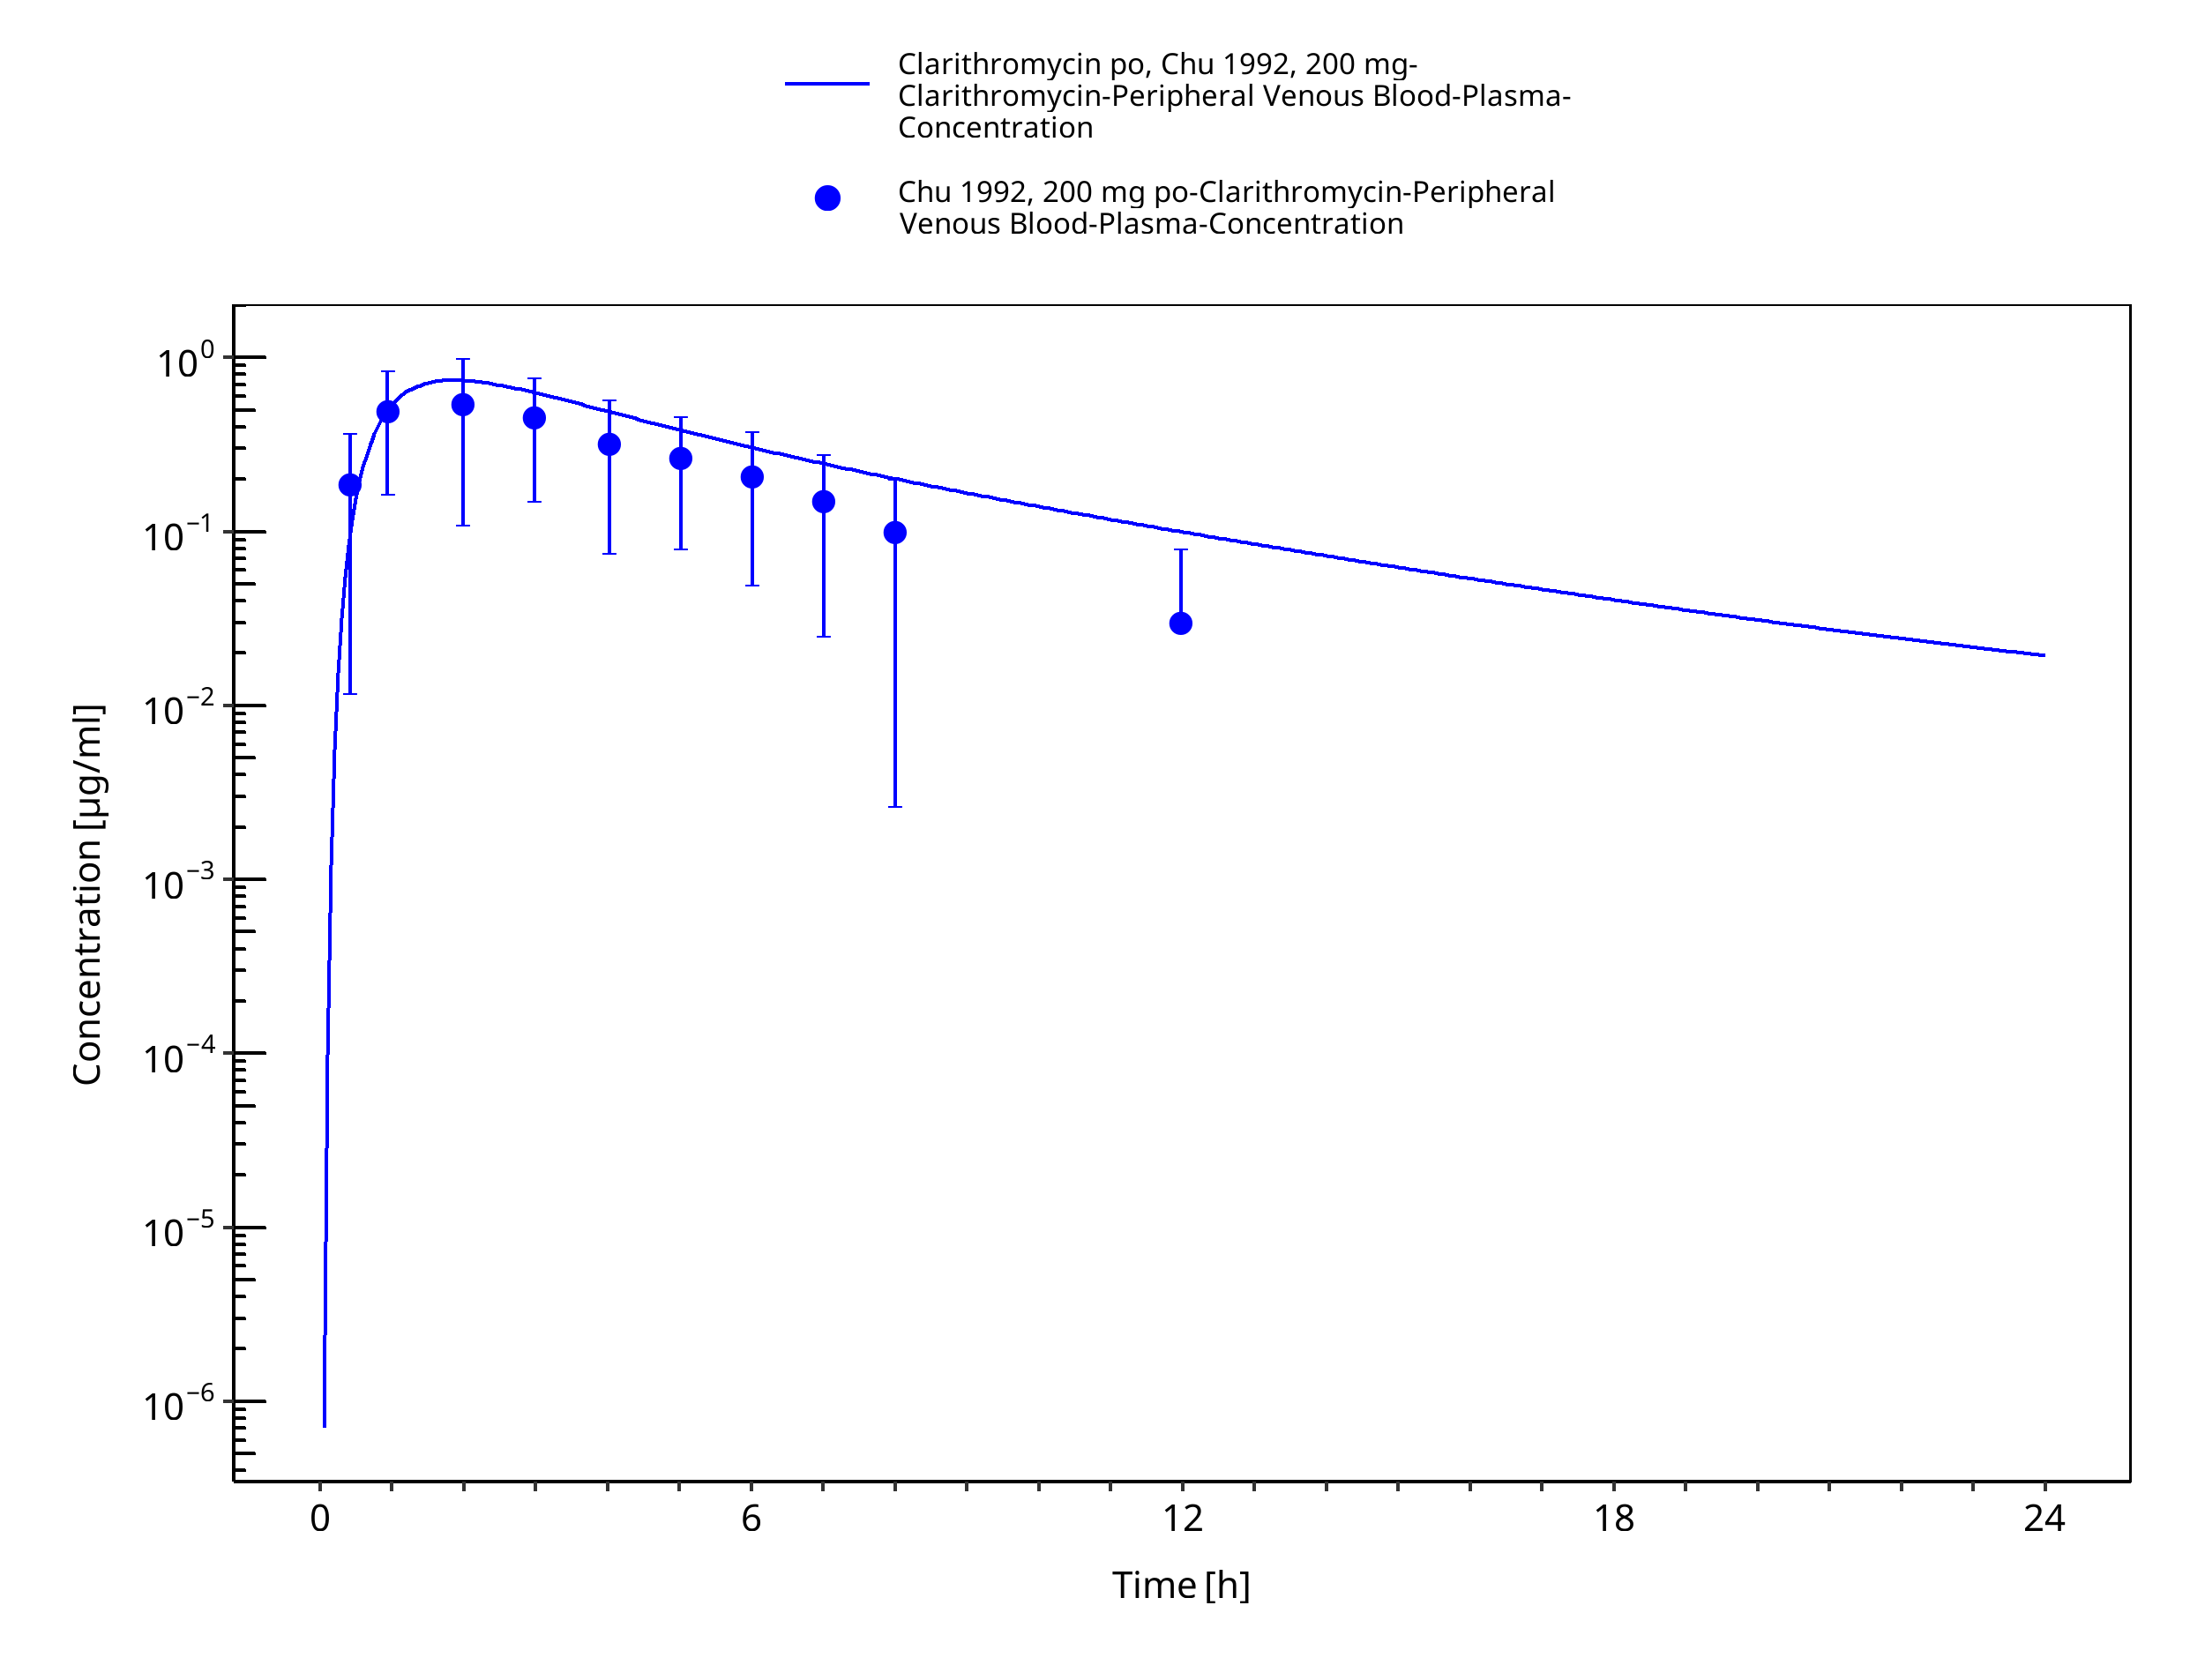
Figure 3-20: Time Profile Analysis 1
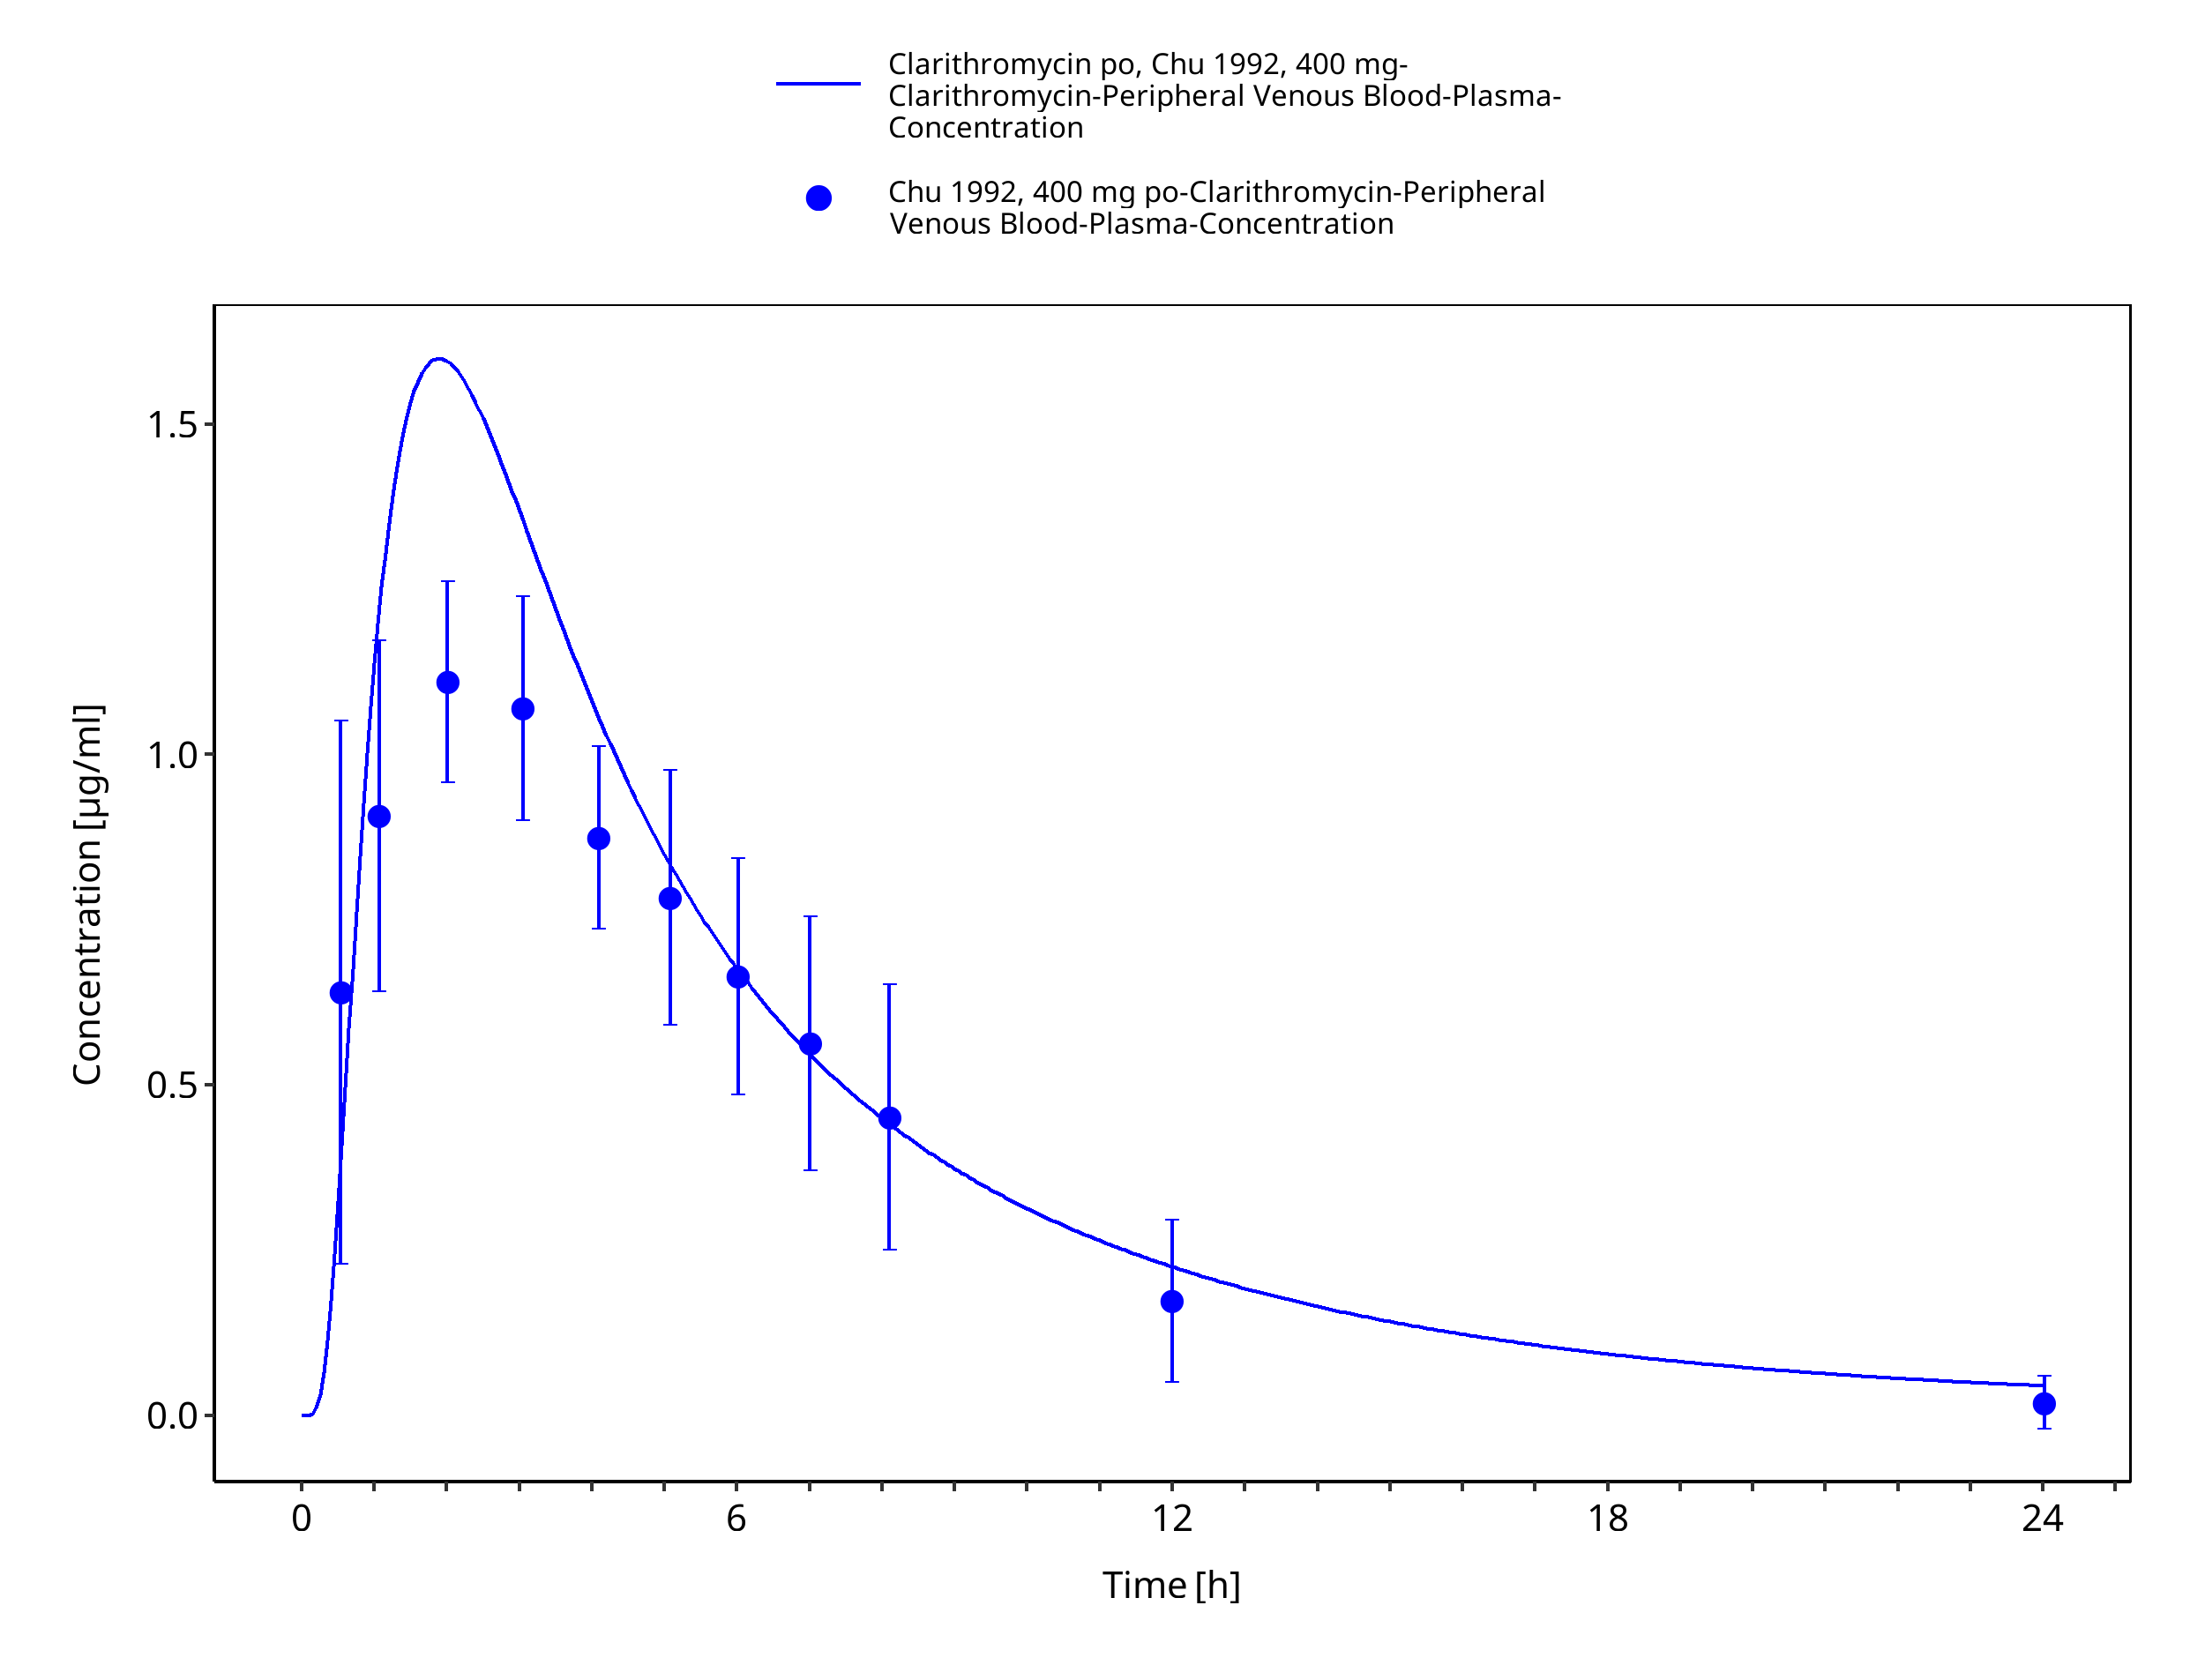
Figure 3-21: Time Profile Analysis
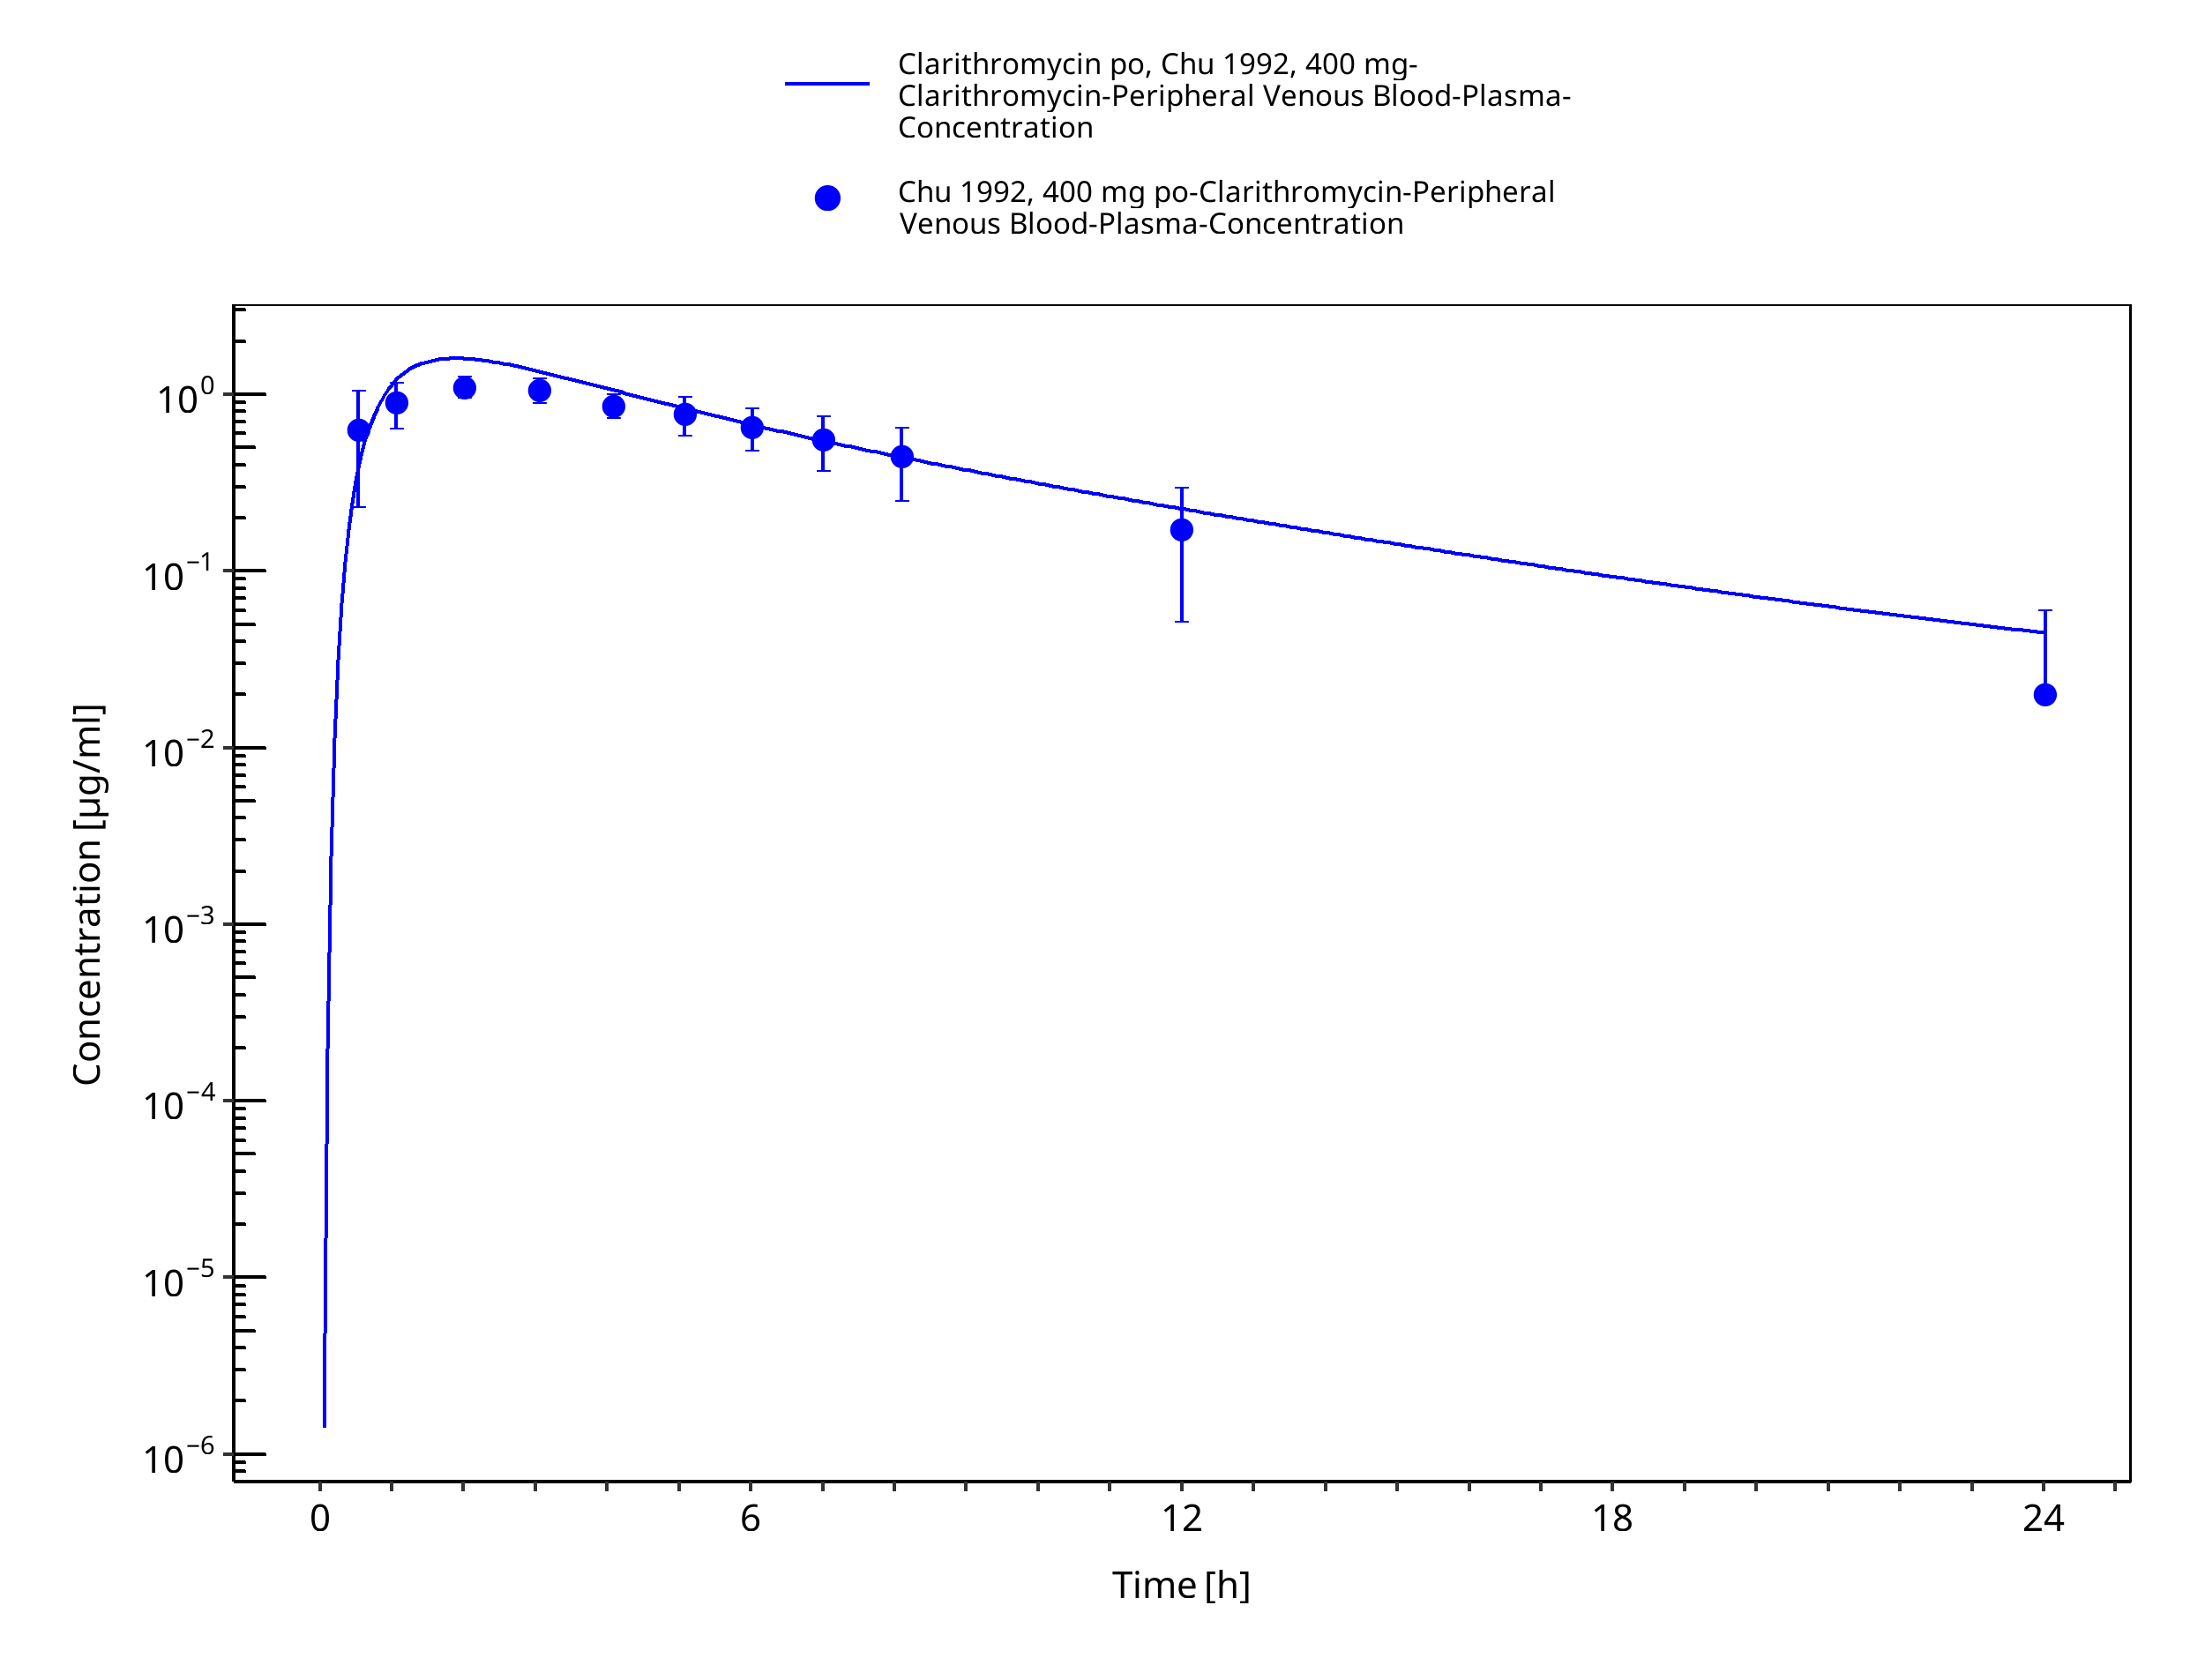
Figure 3-22: Time Profile Analysis 1
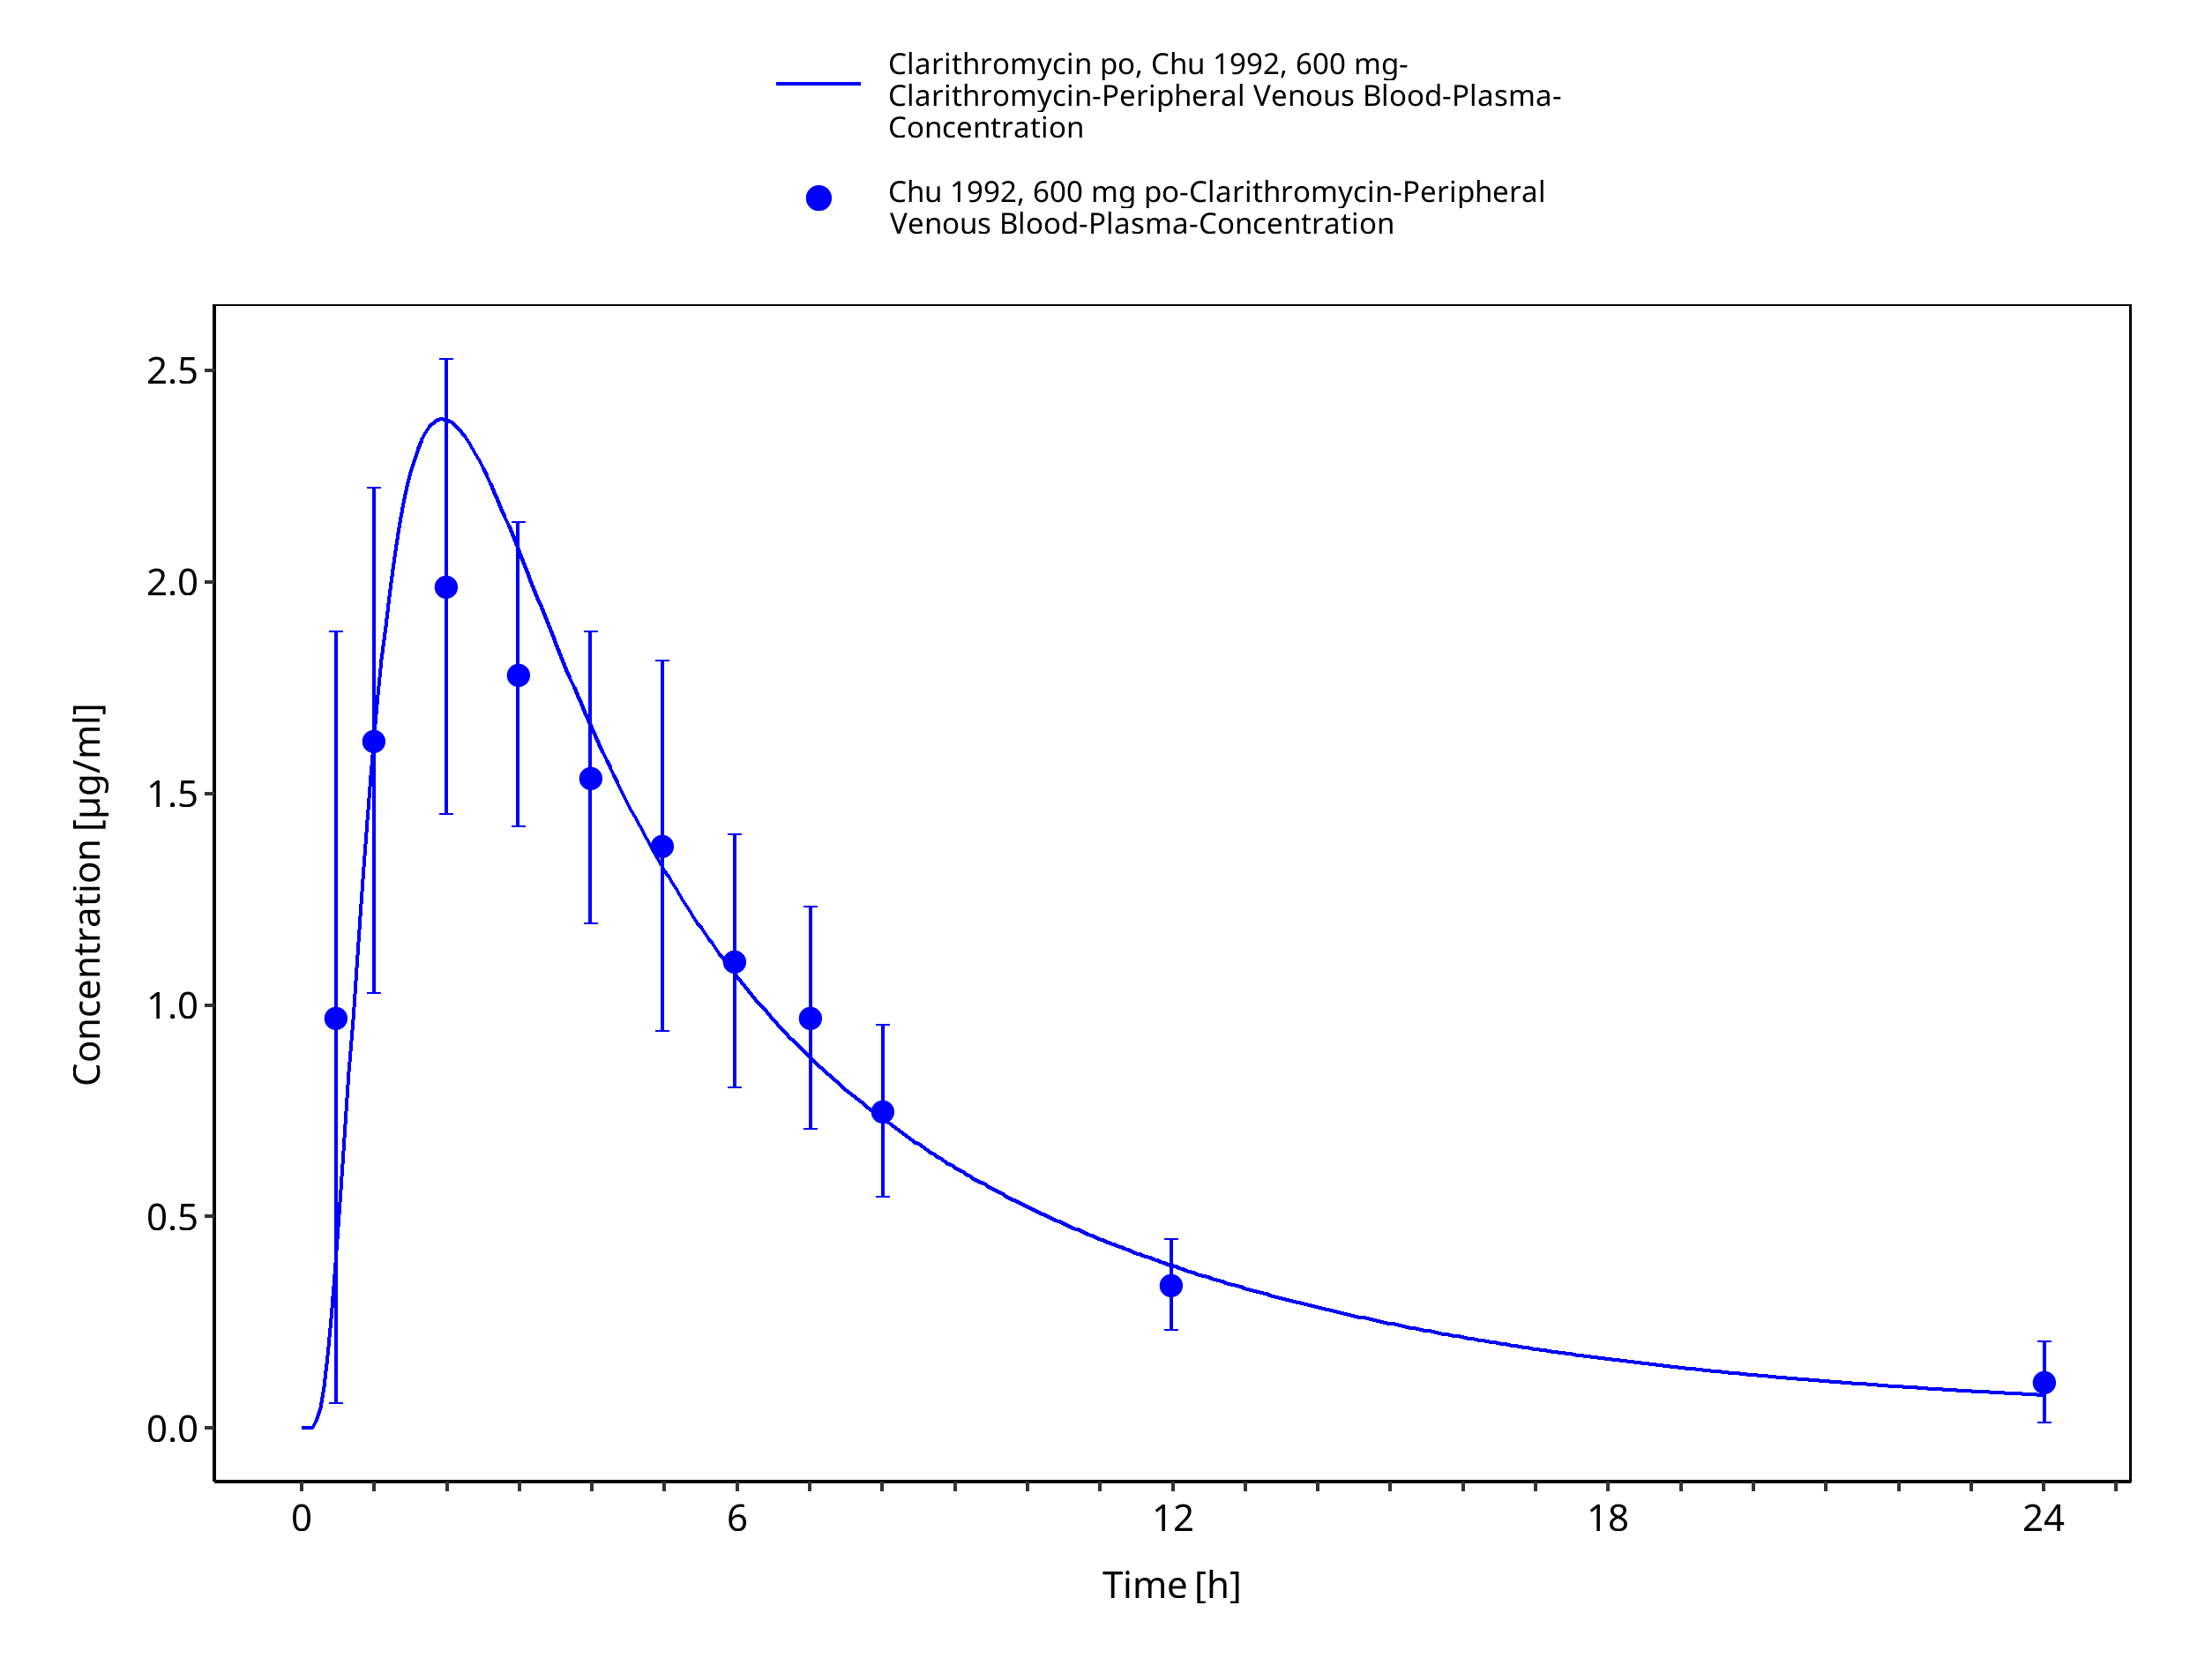
Figure 3-23: Time Profile Analysis
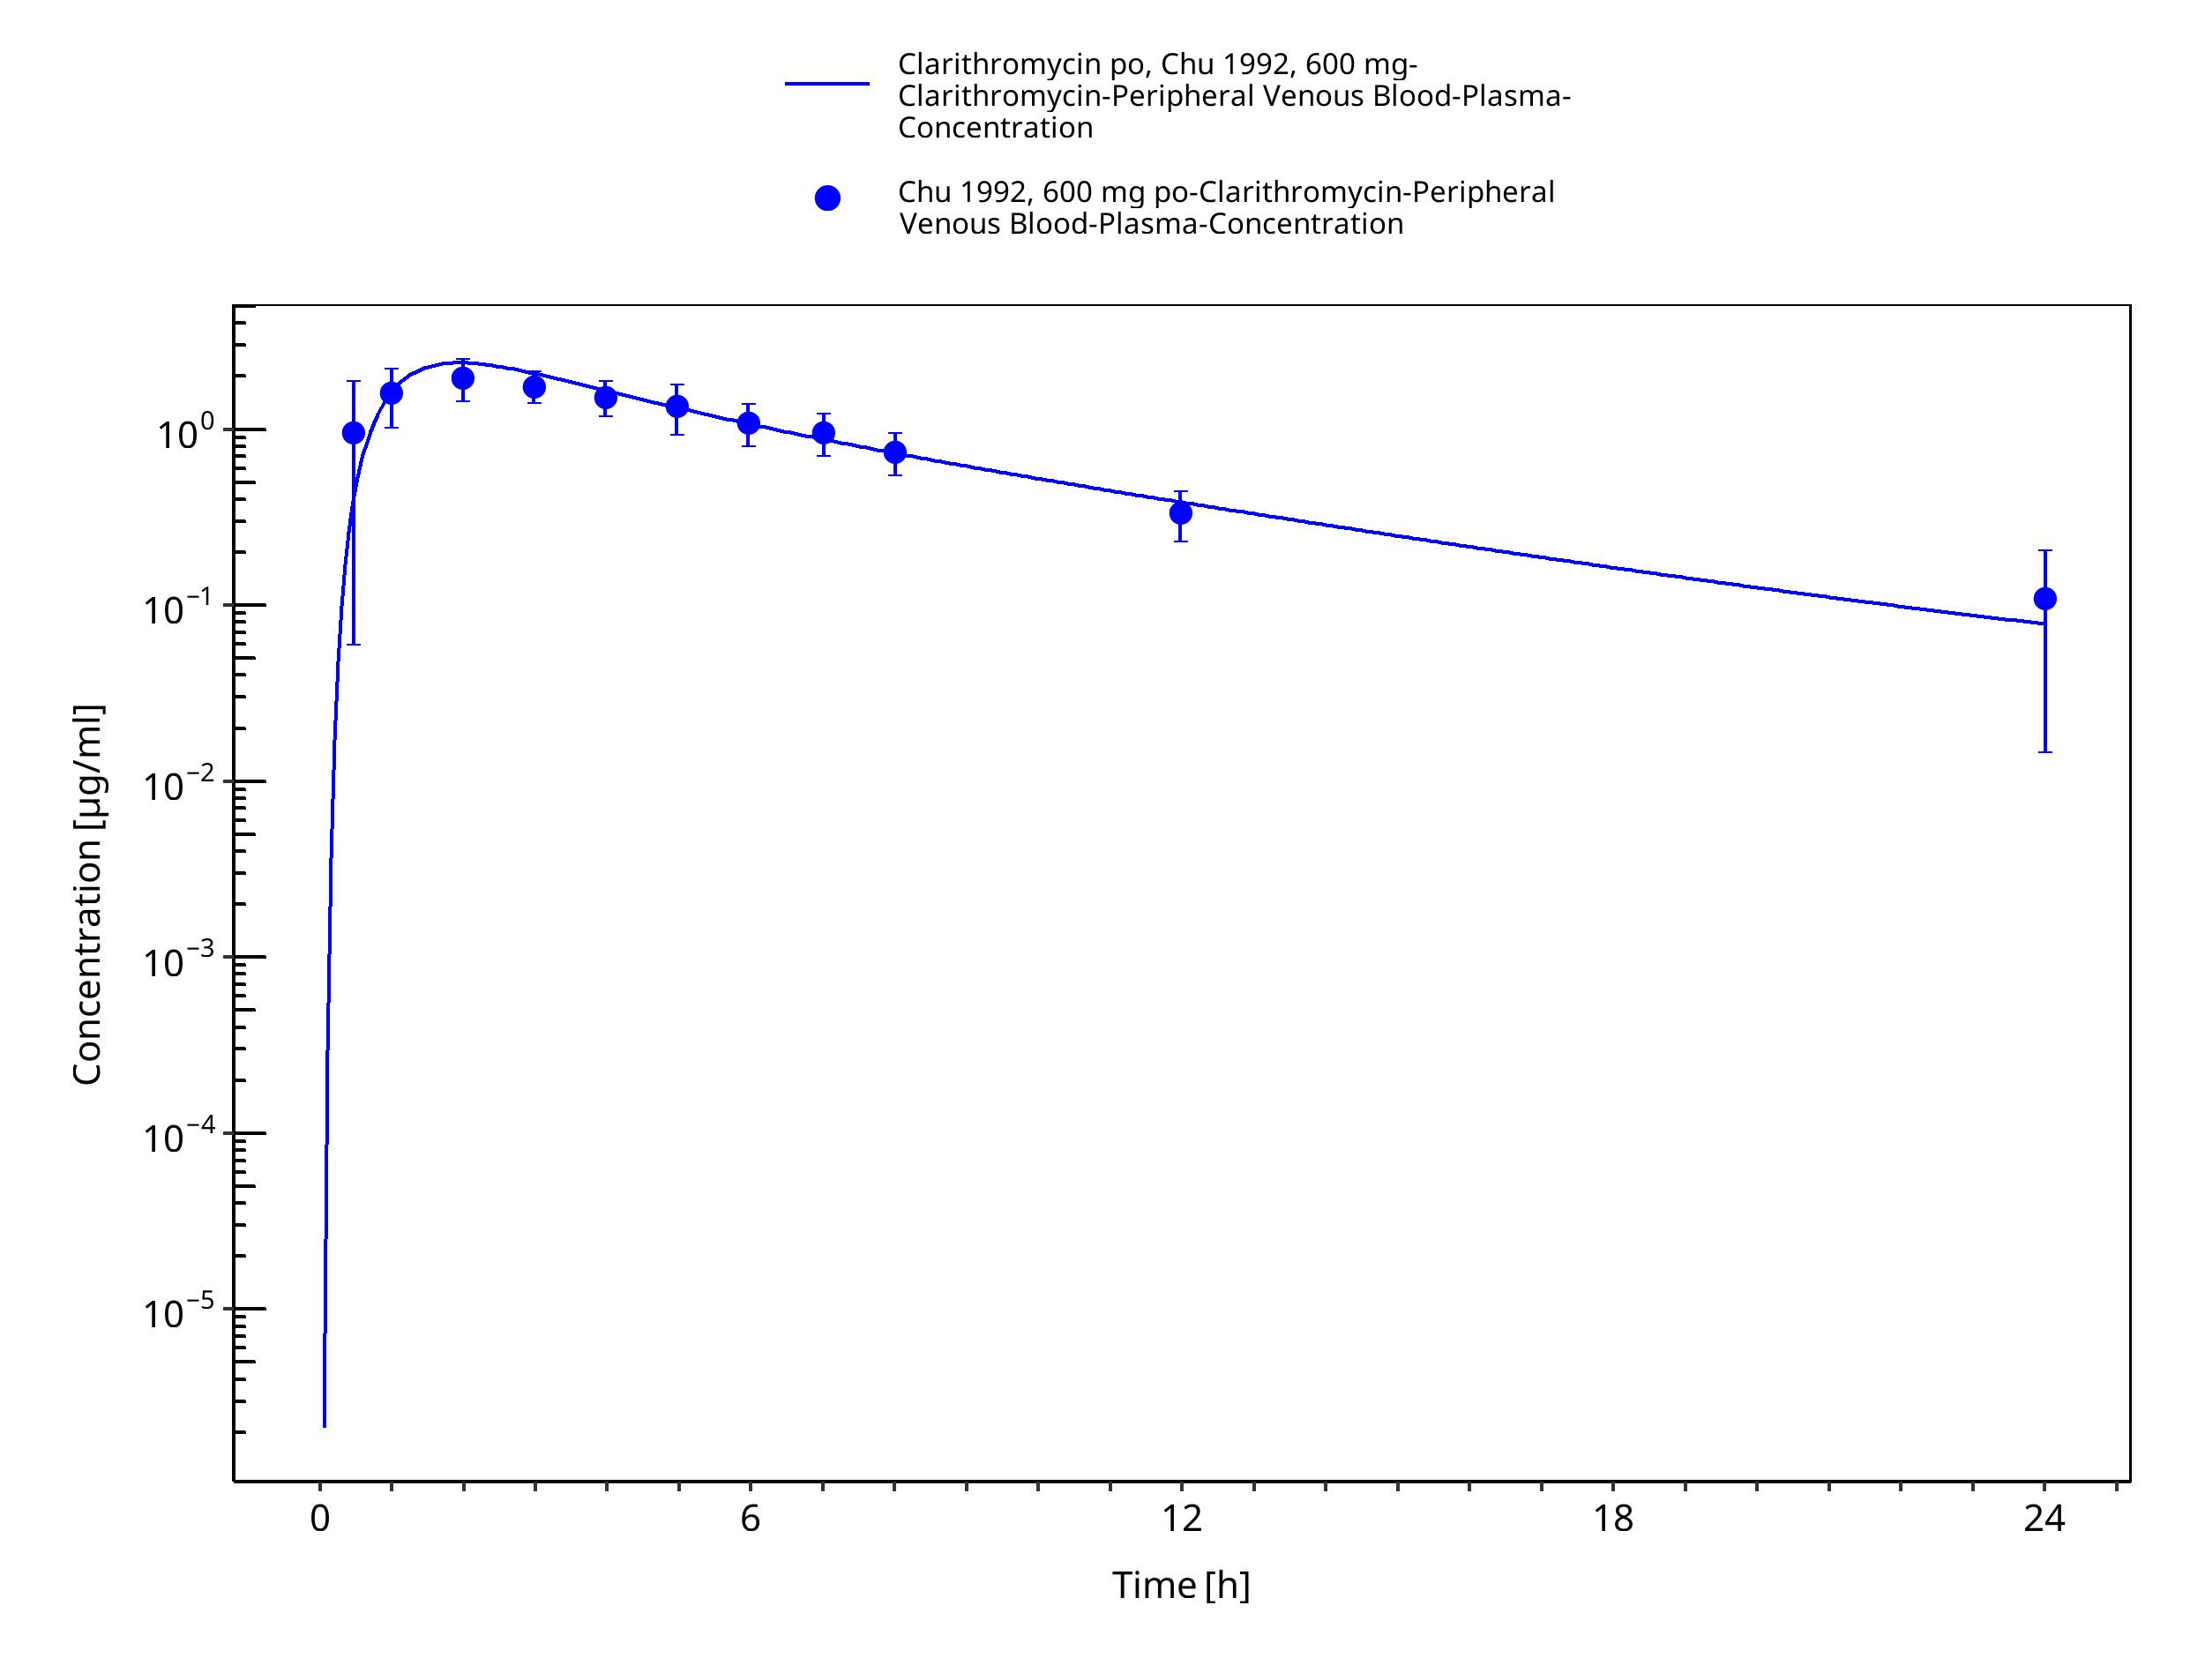
Figure 3-24: Time Profile Analysis 1
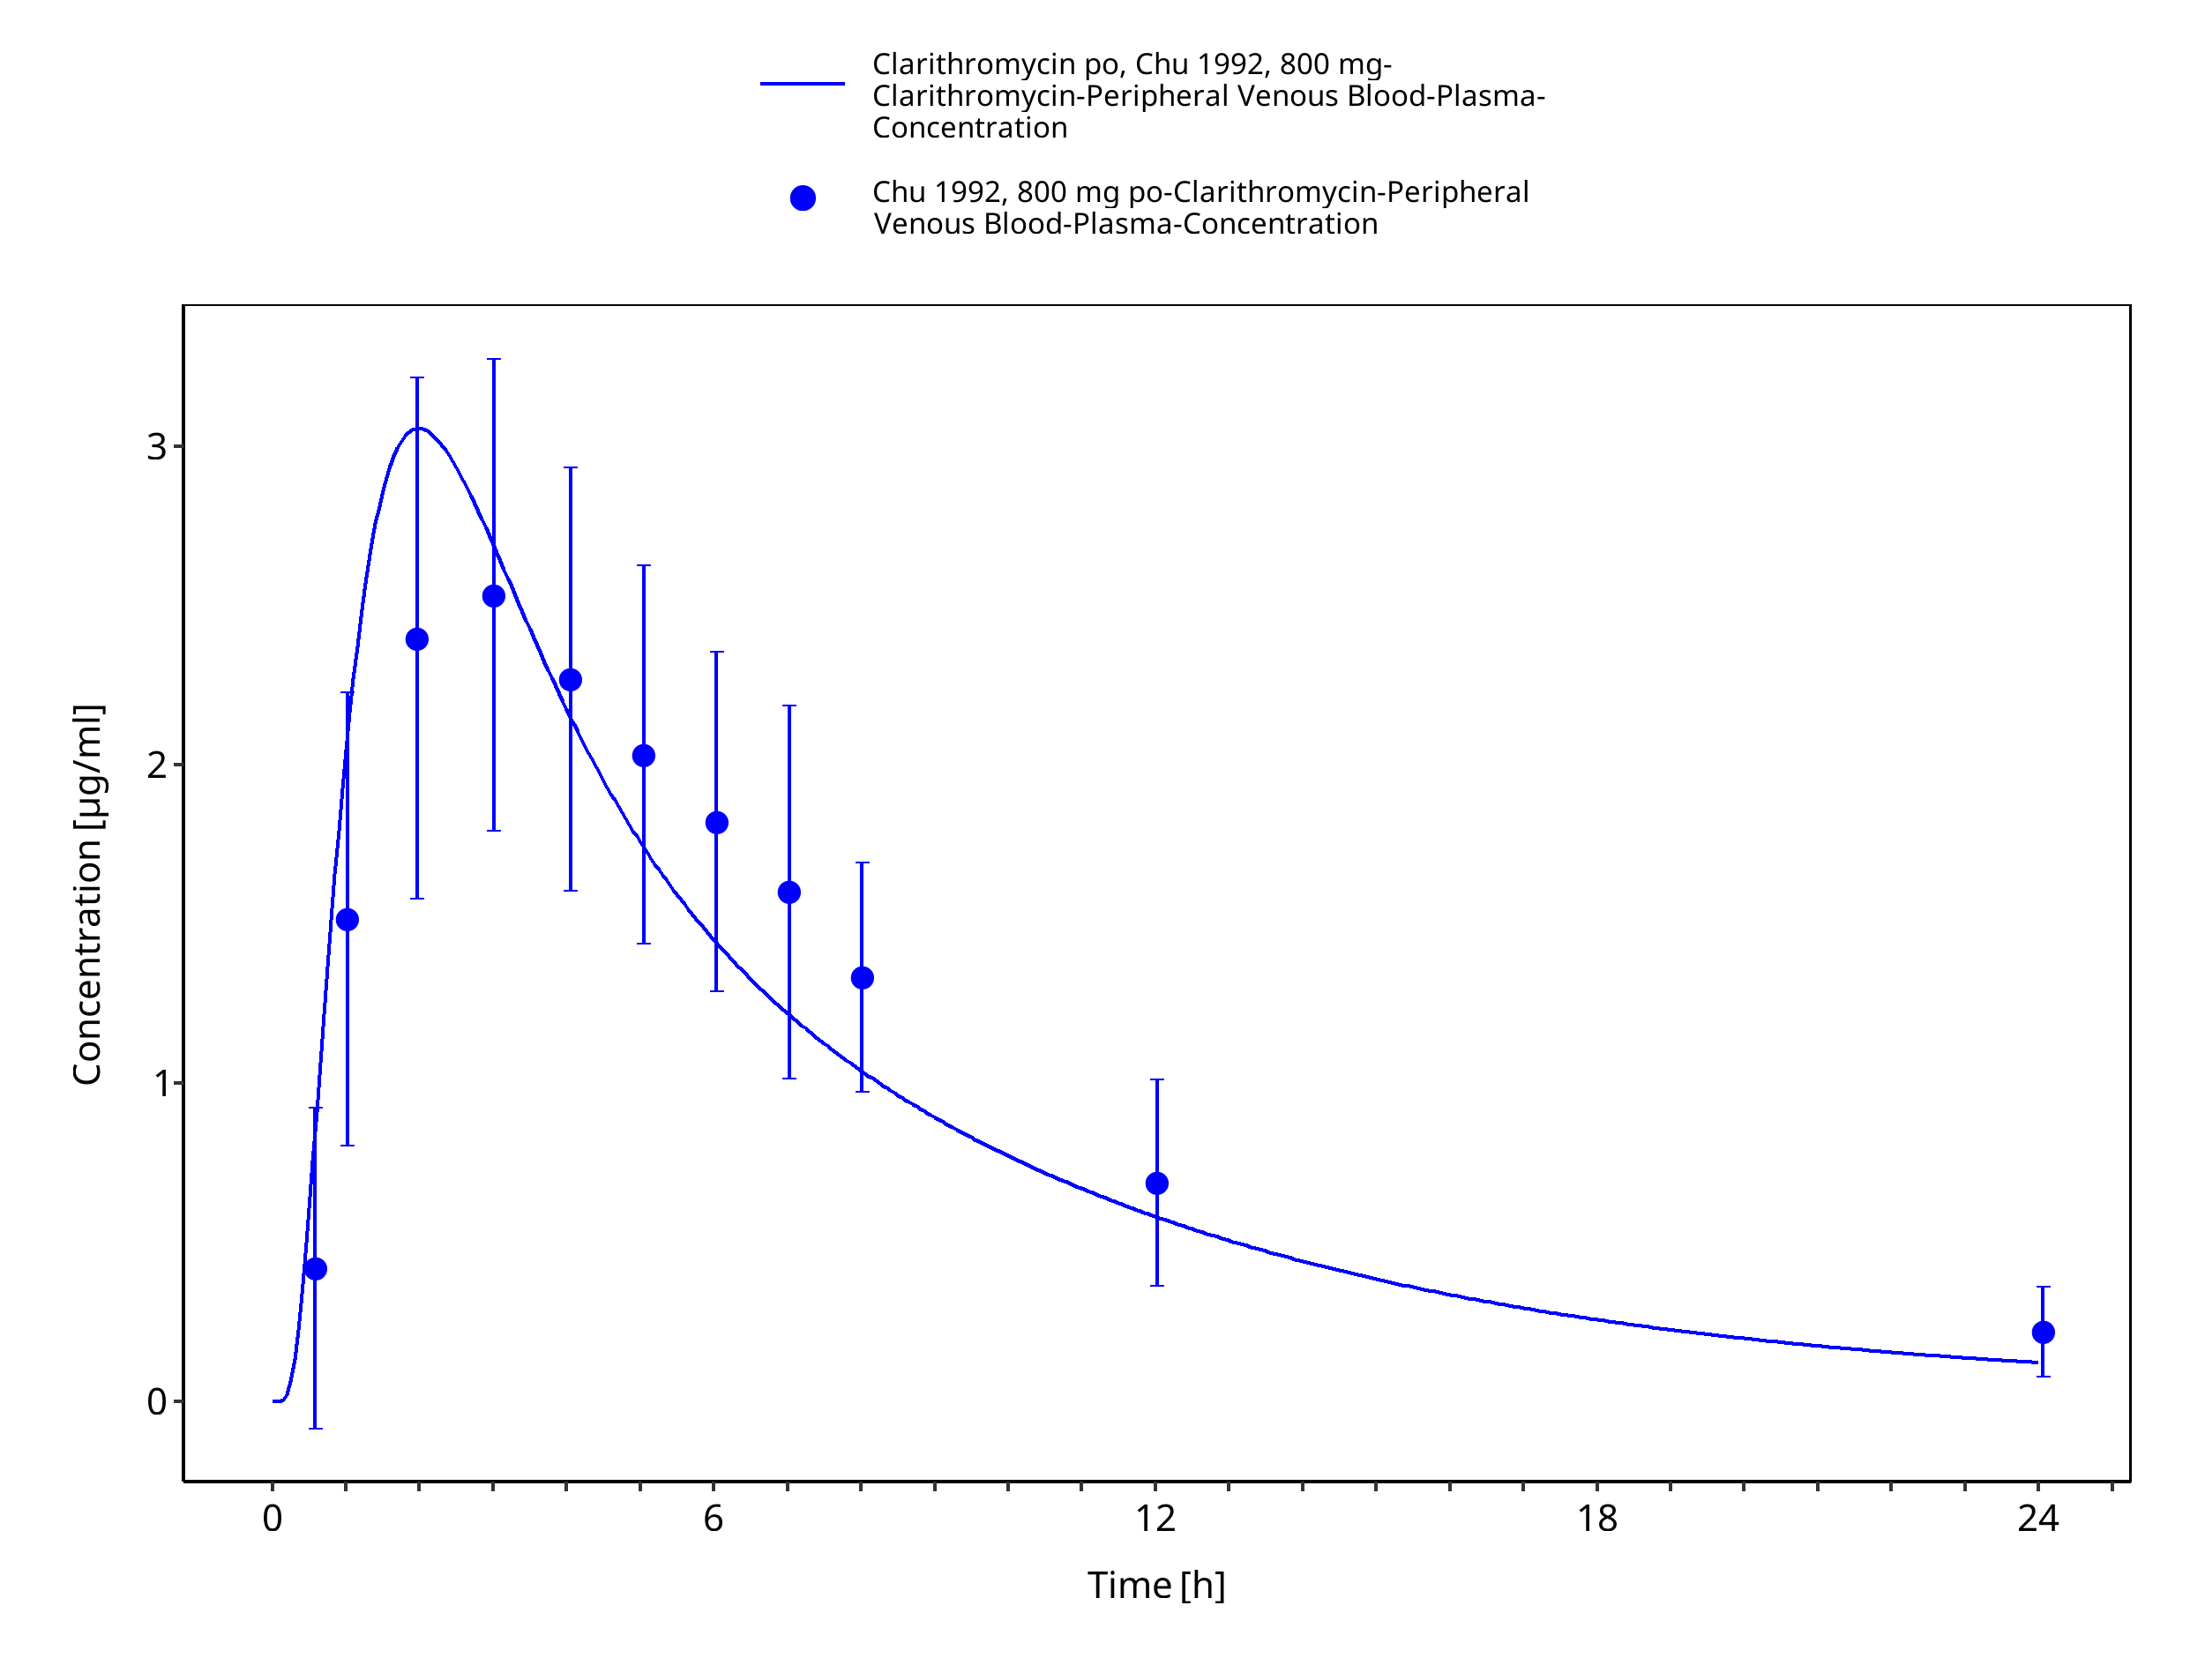
Figure 3-25: Time Profile Analysis
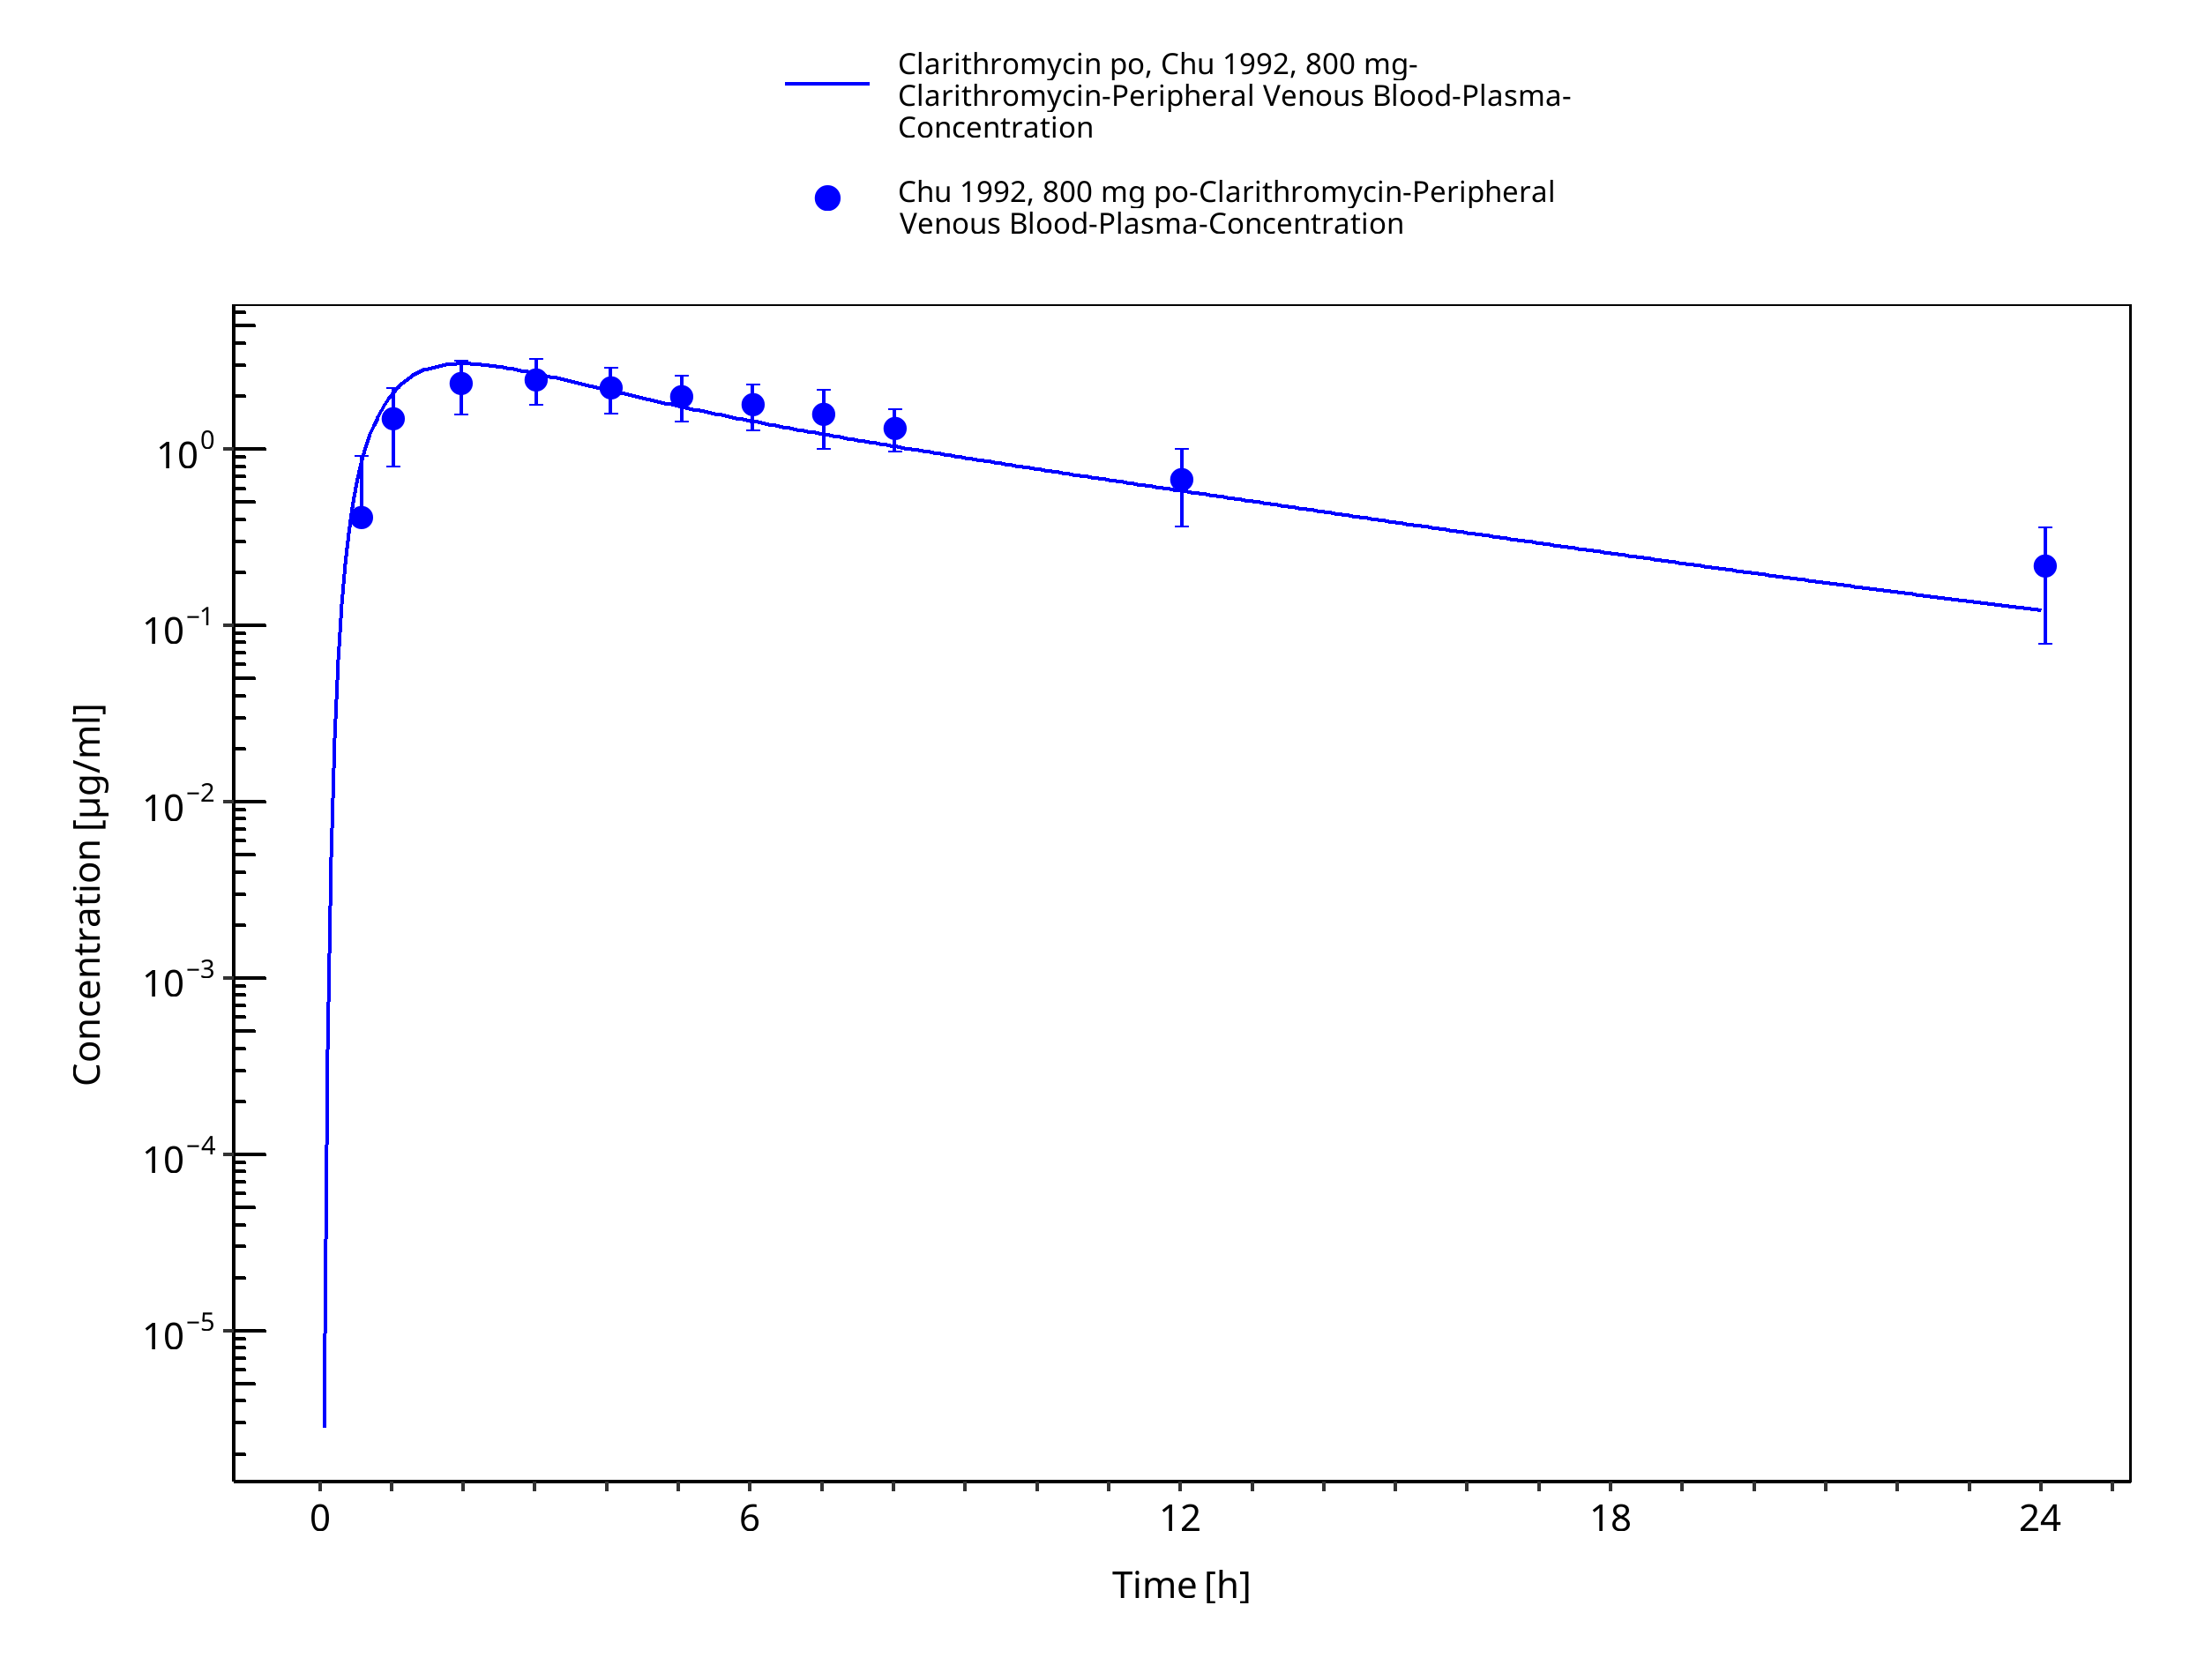
Figure 3-26: Time Profile Analysis 1
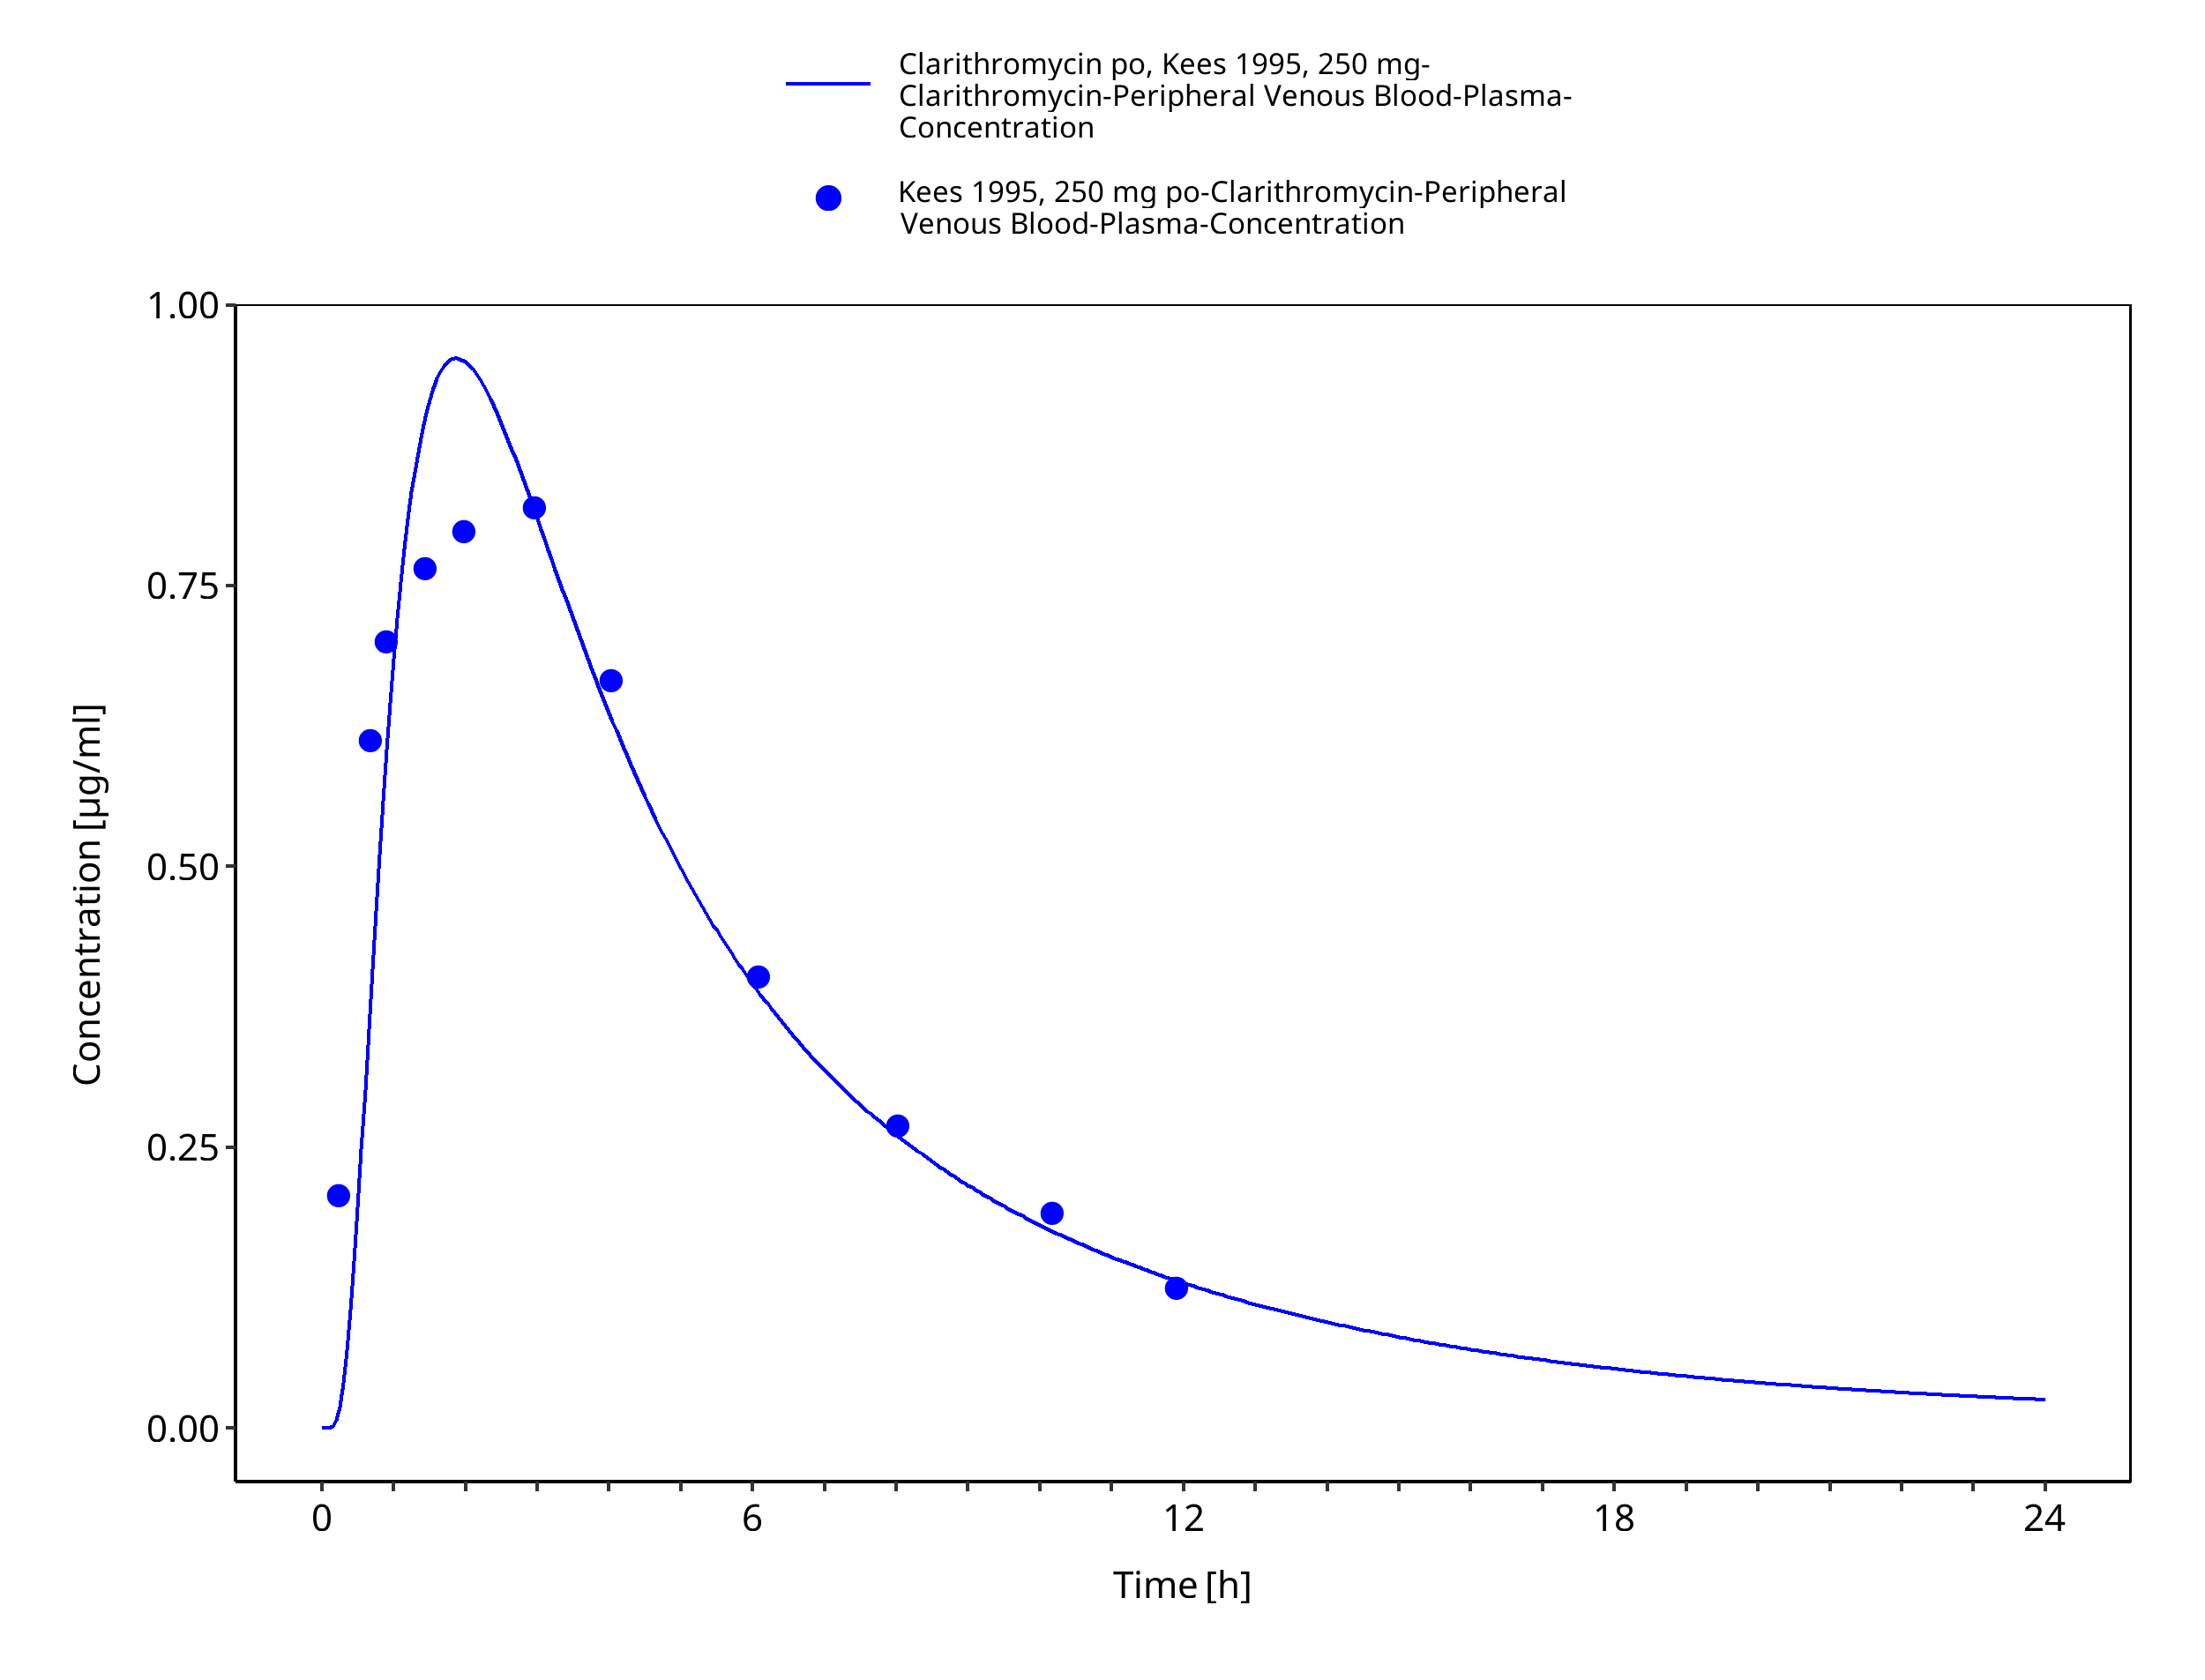
Figure 3-27: Time Profile Analysis
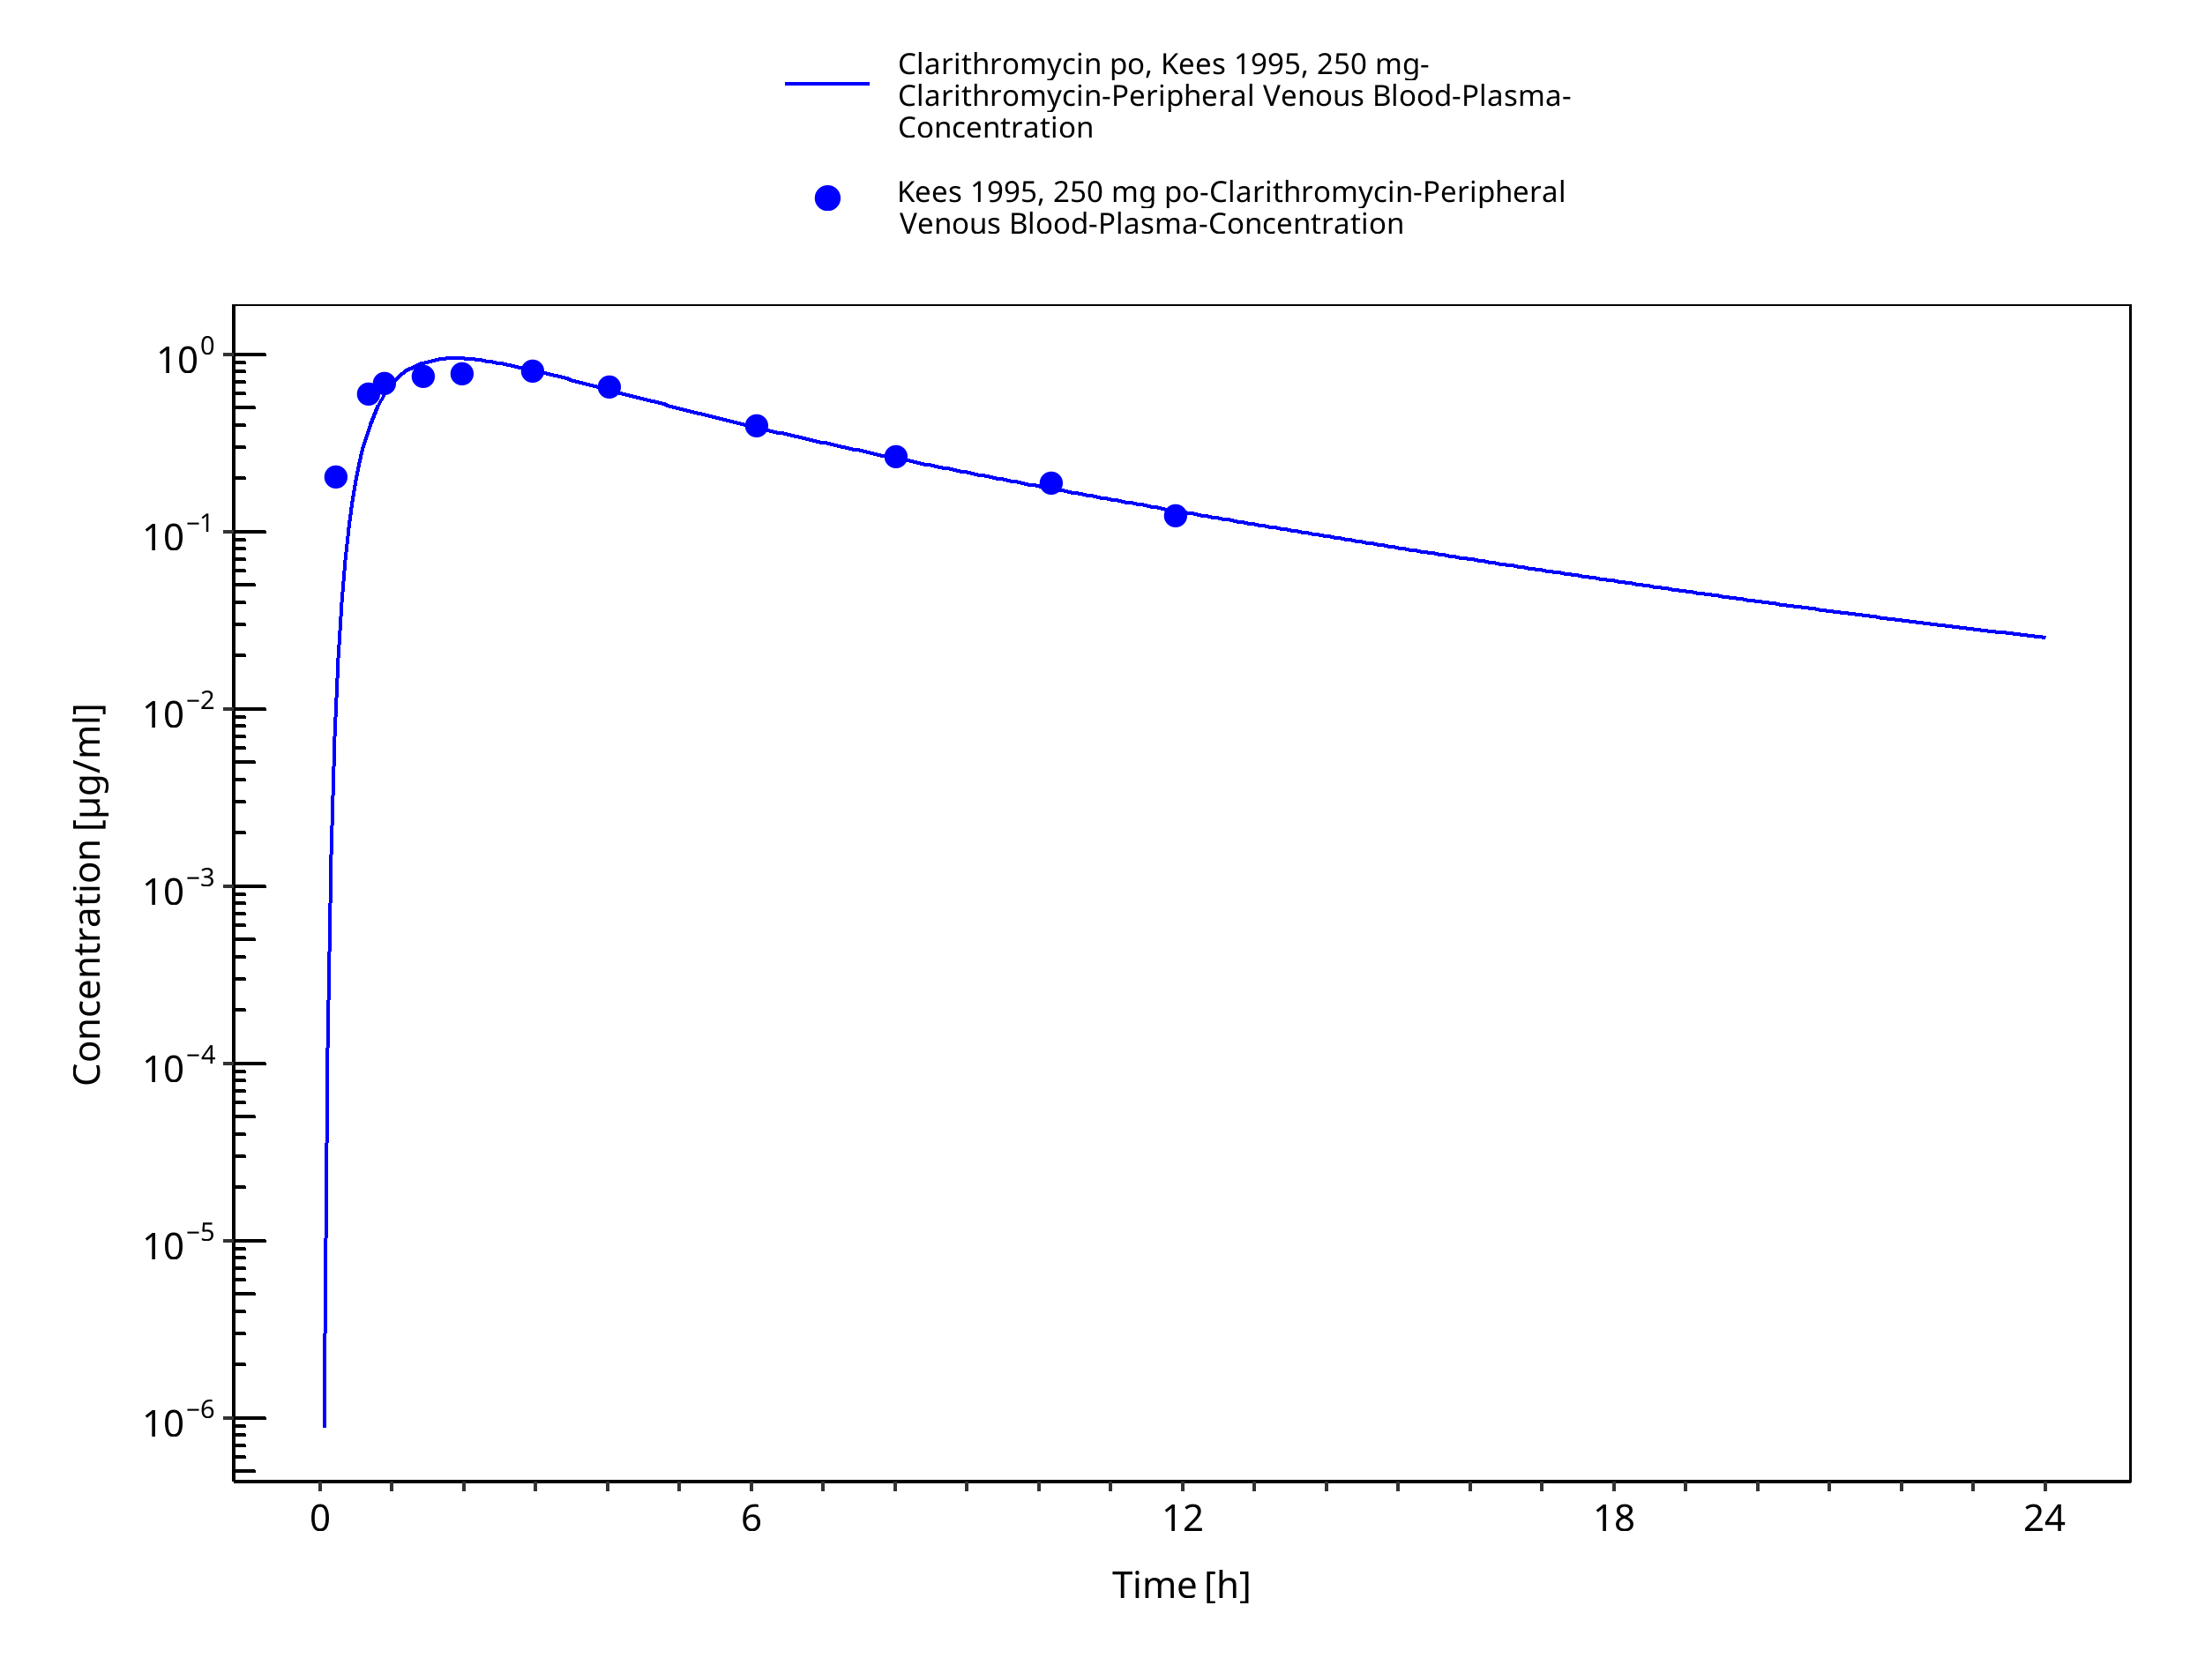
Figure 3-28: Time Profile Analysis 1
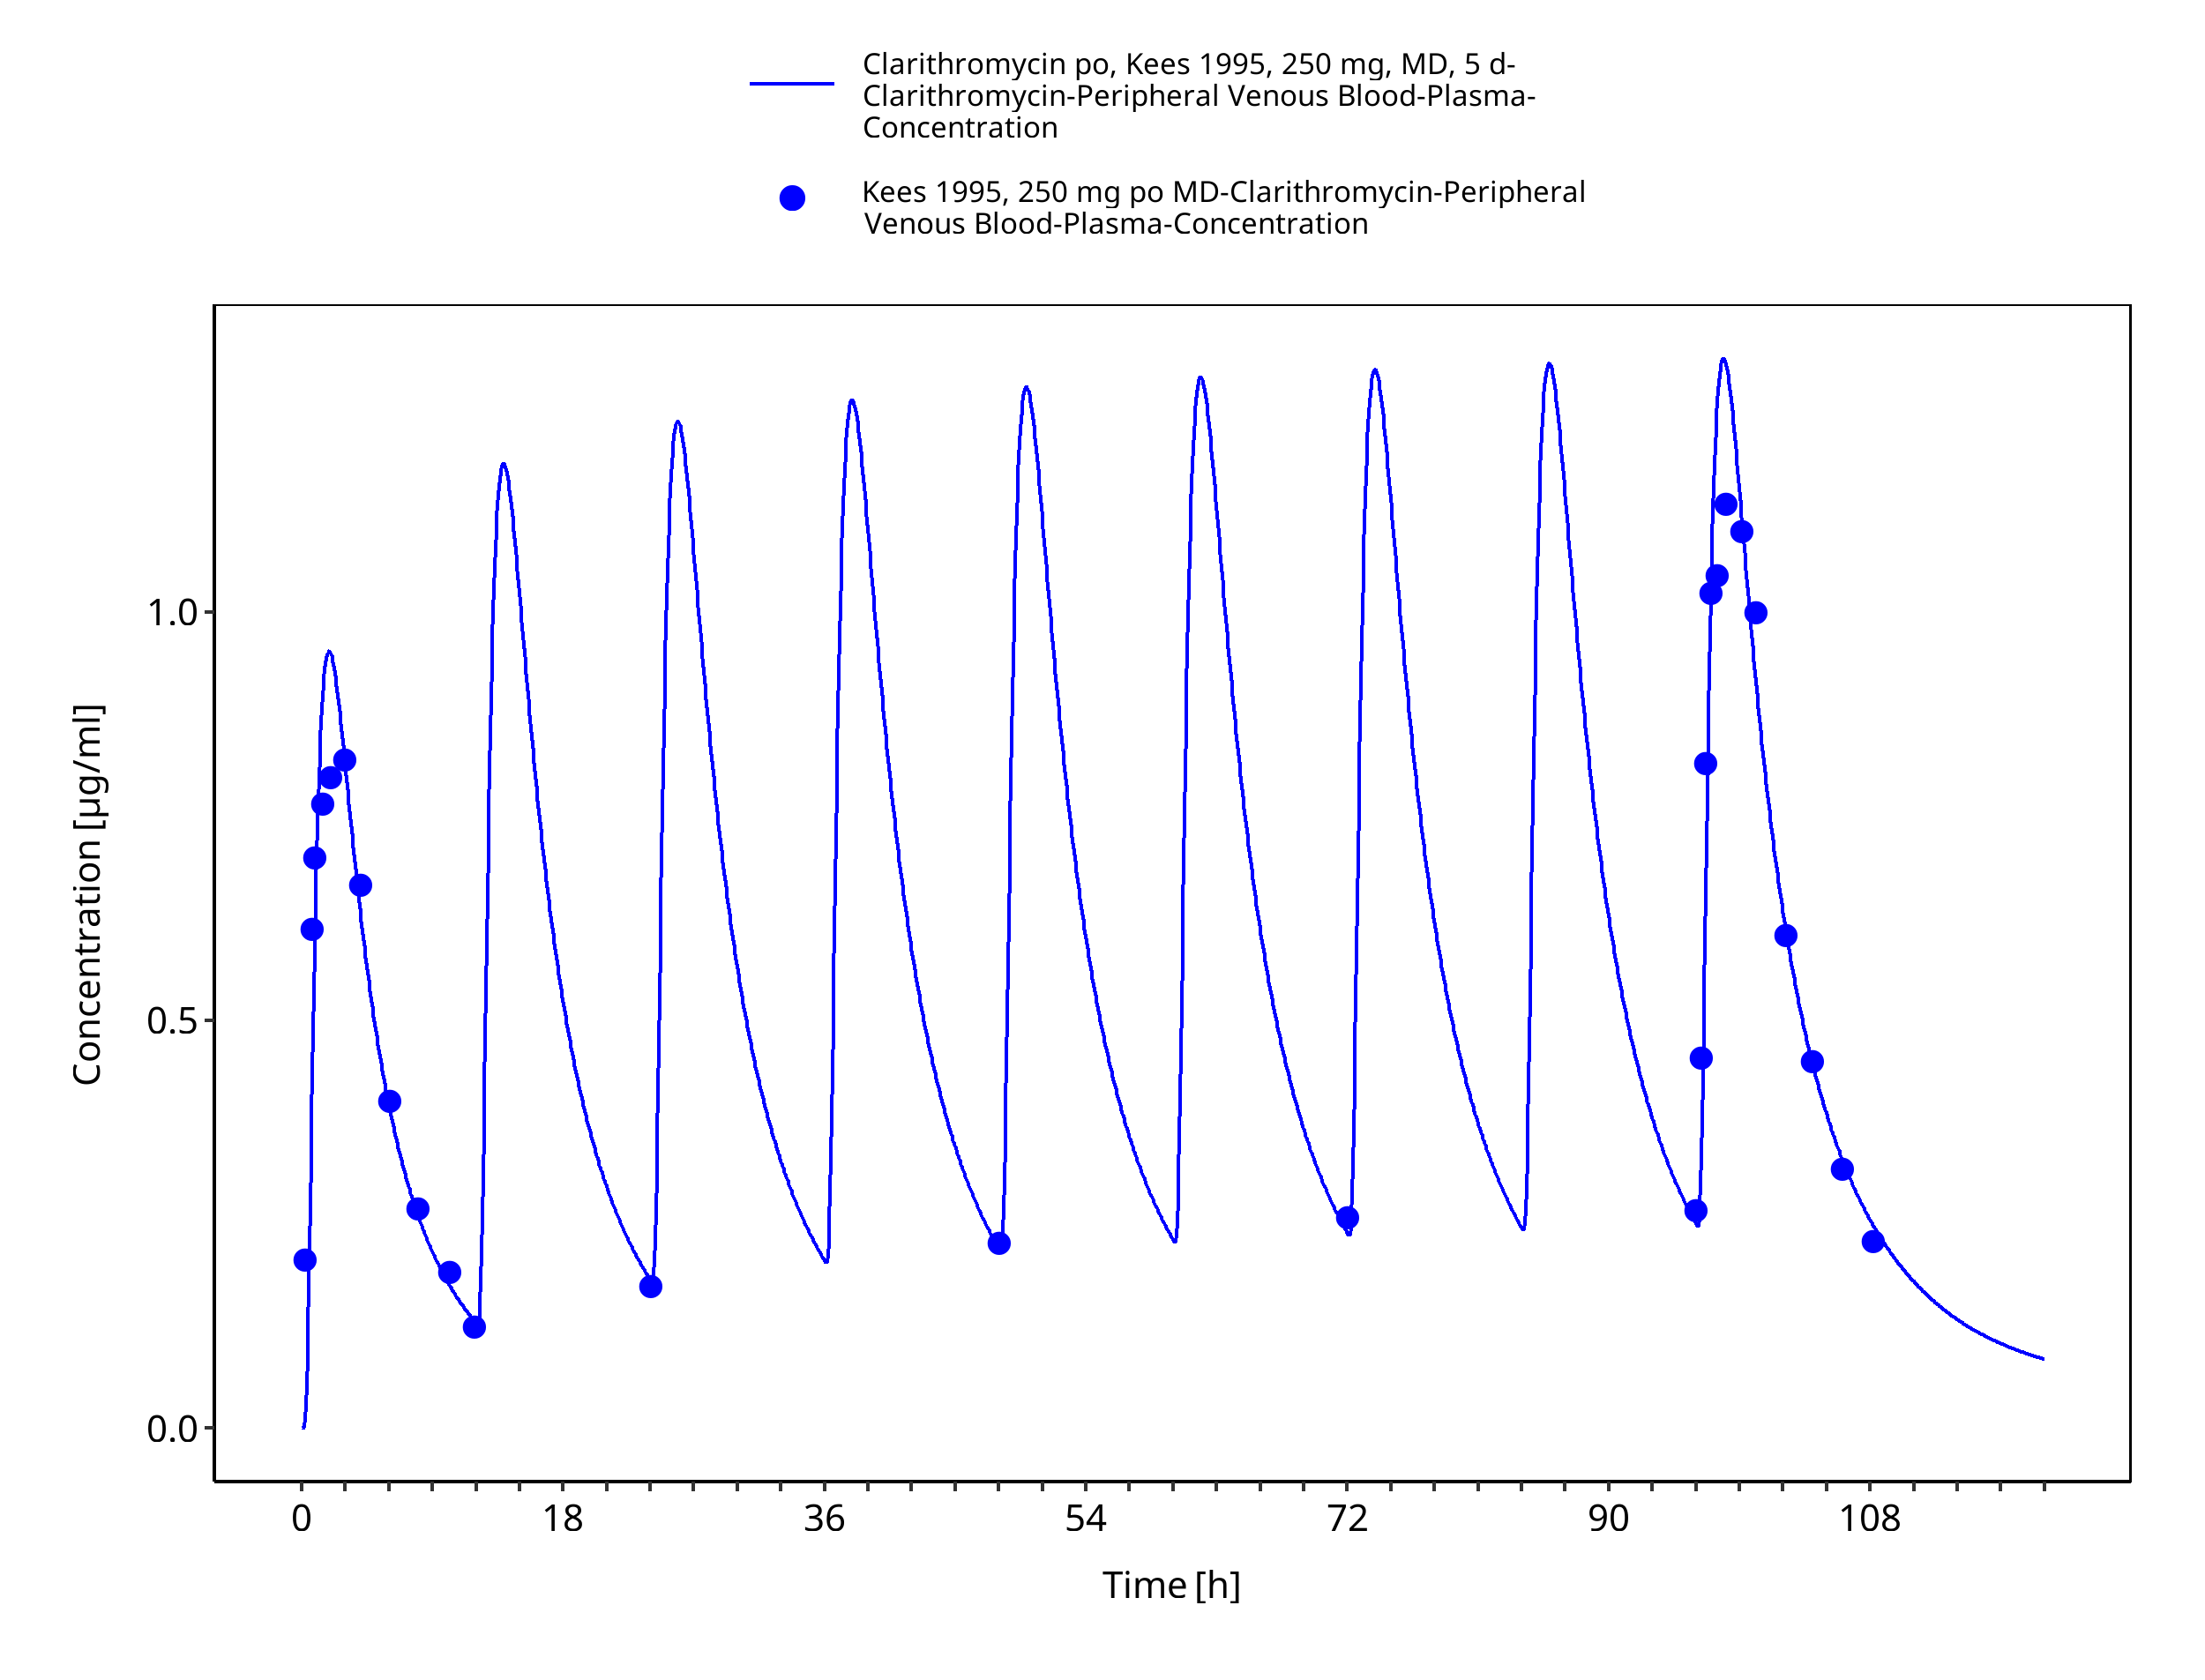
Figure 3-29: Time Profile Analysis
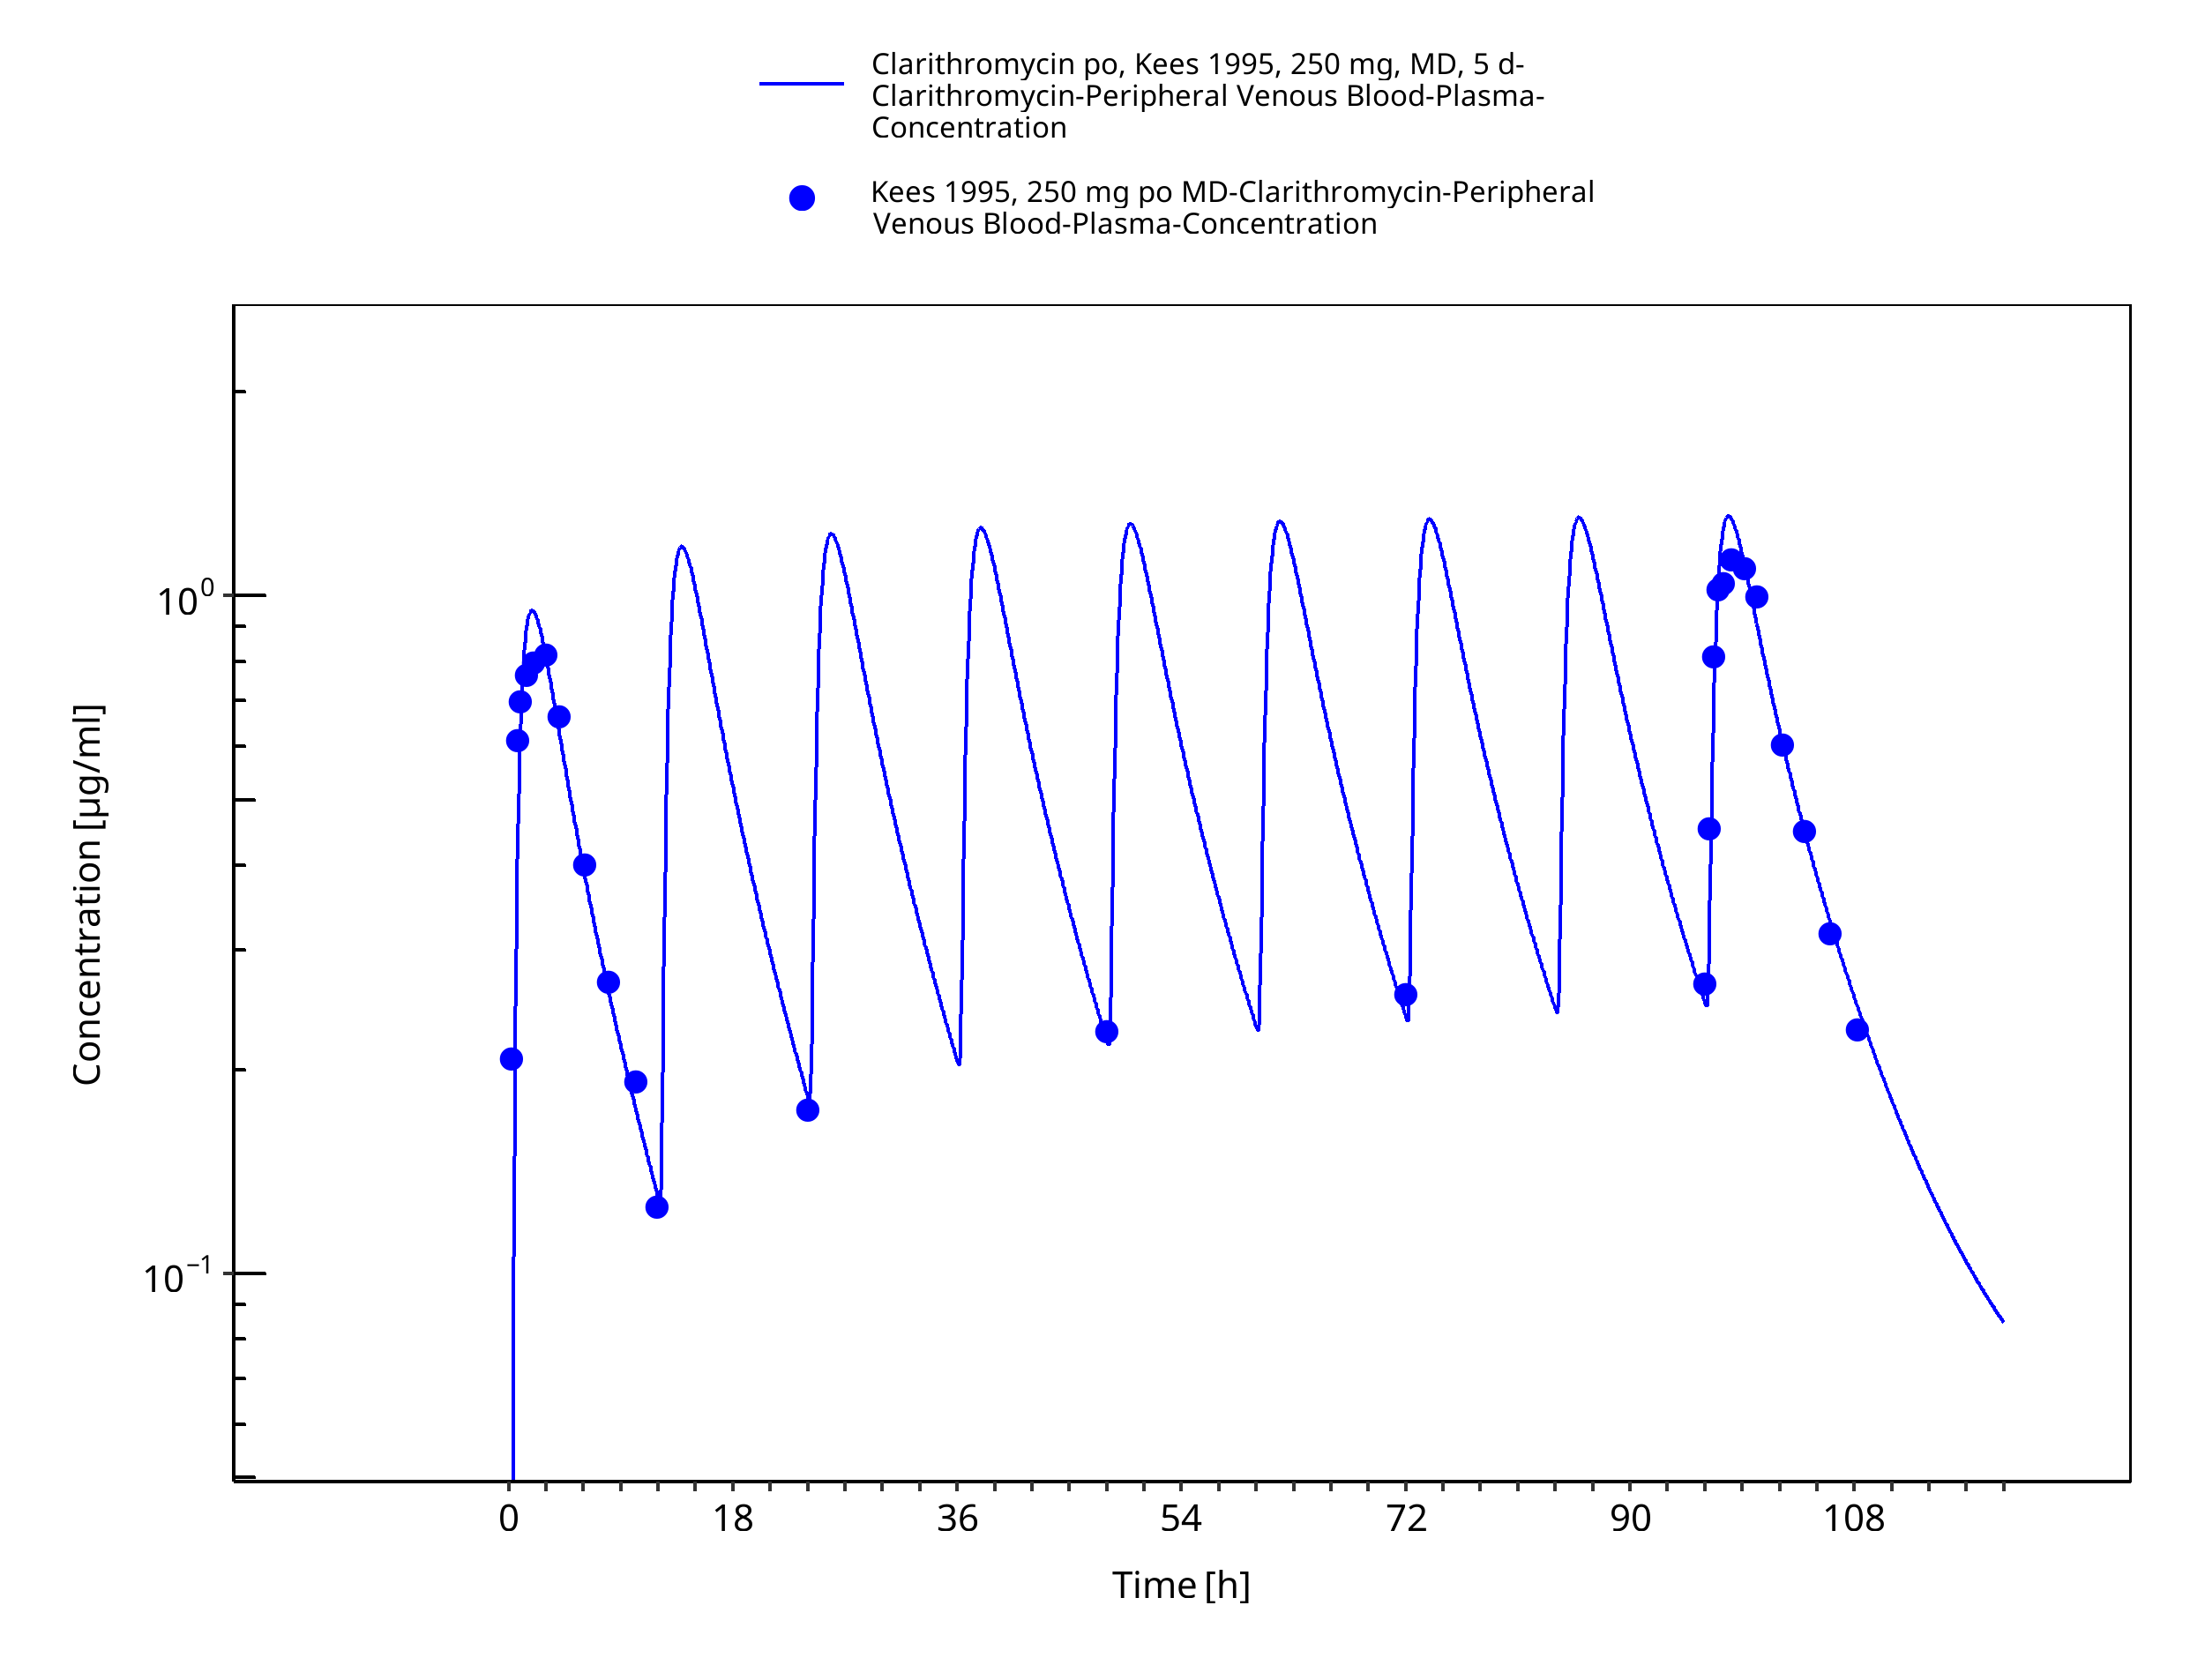
Figure 3-30: Time Profile Analysis 1
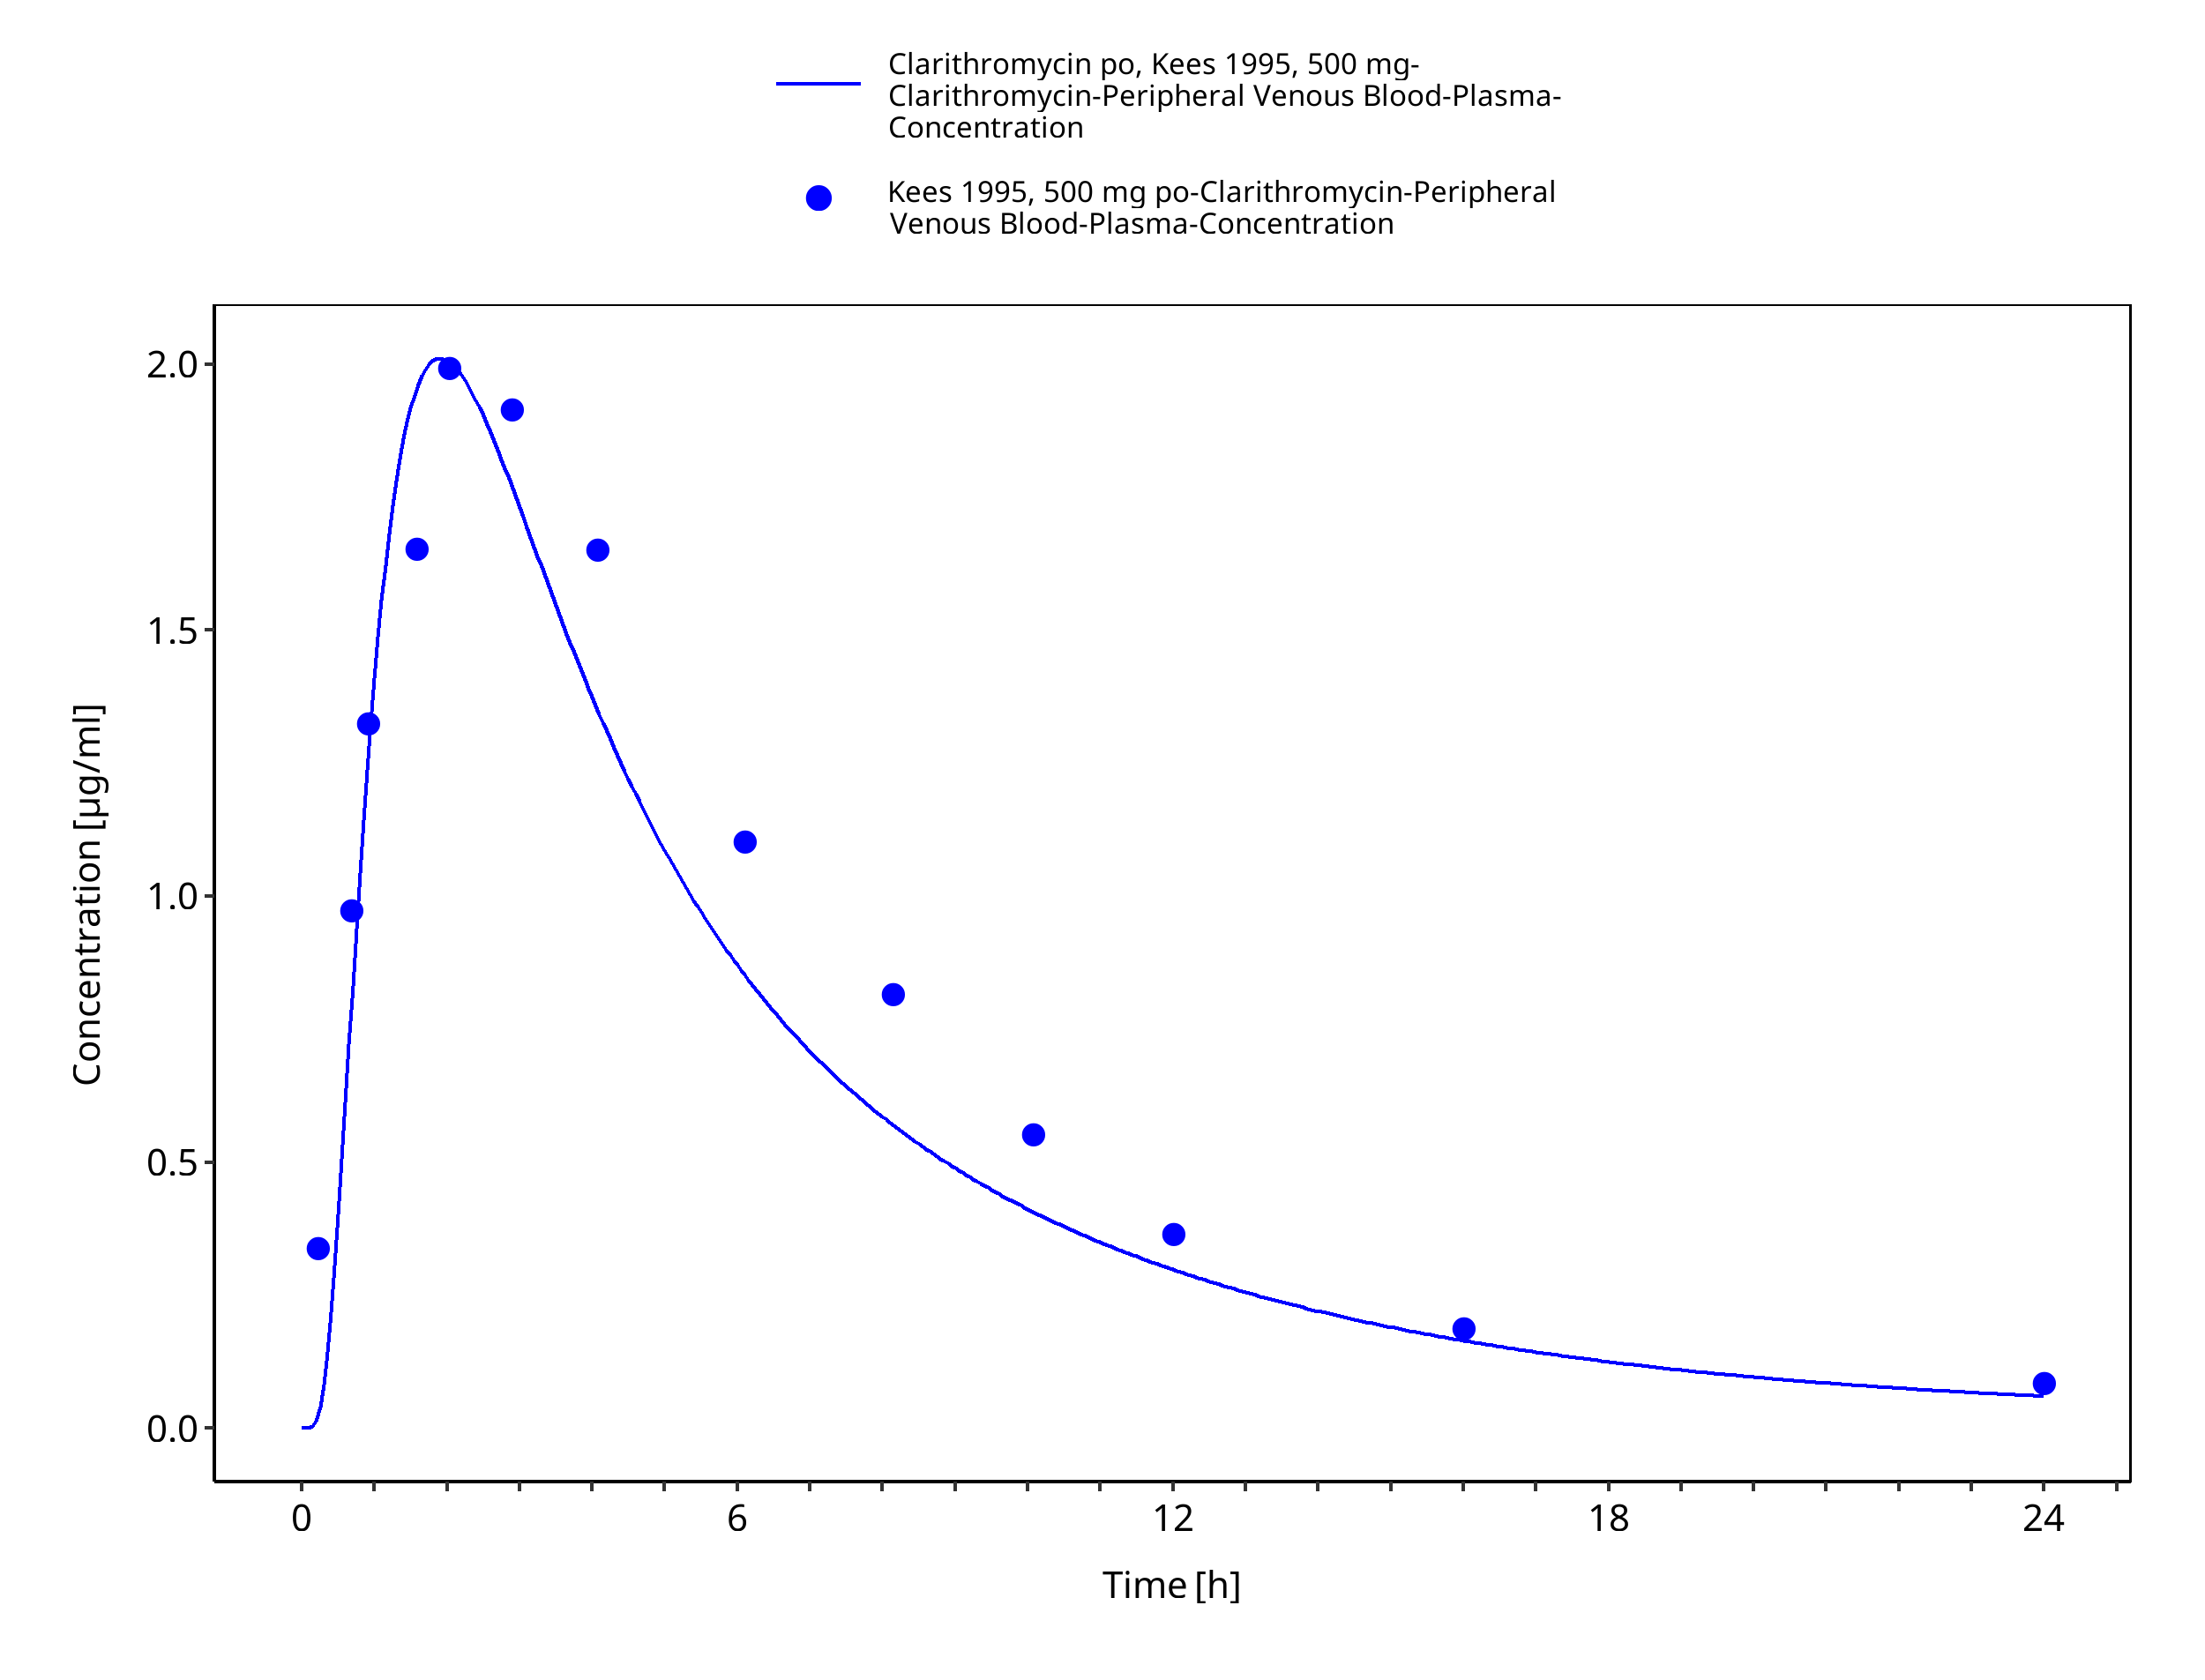
Figure 3-31: Time Profile Analysis
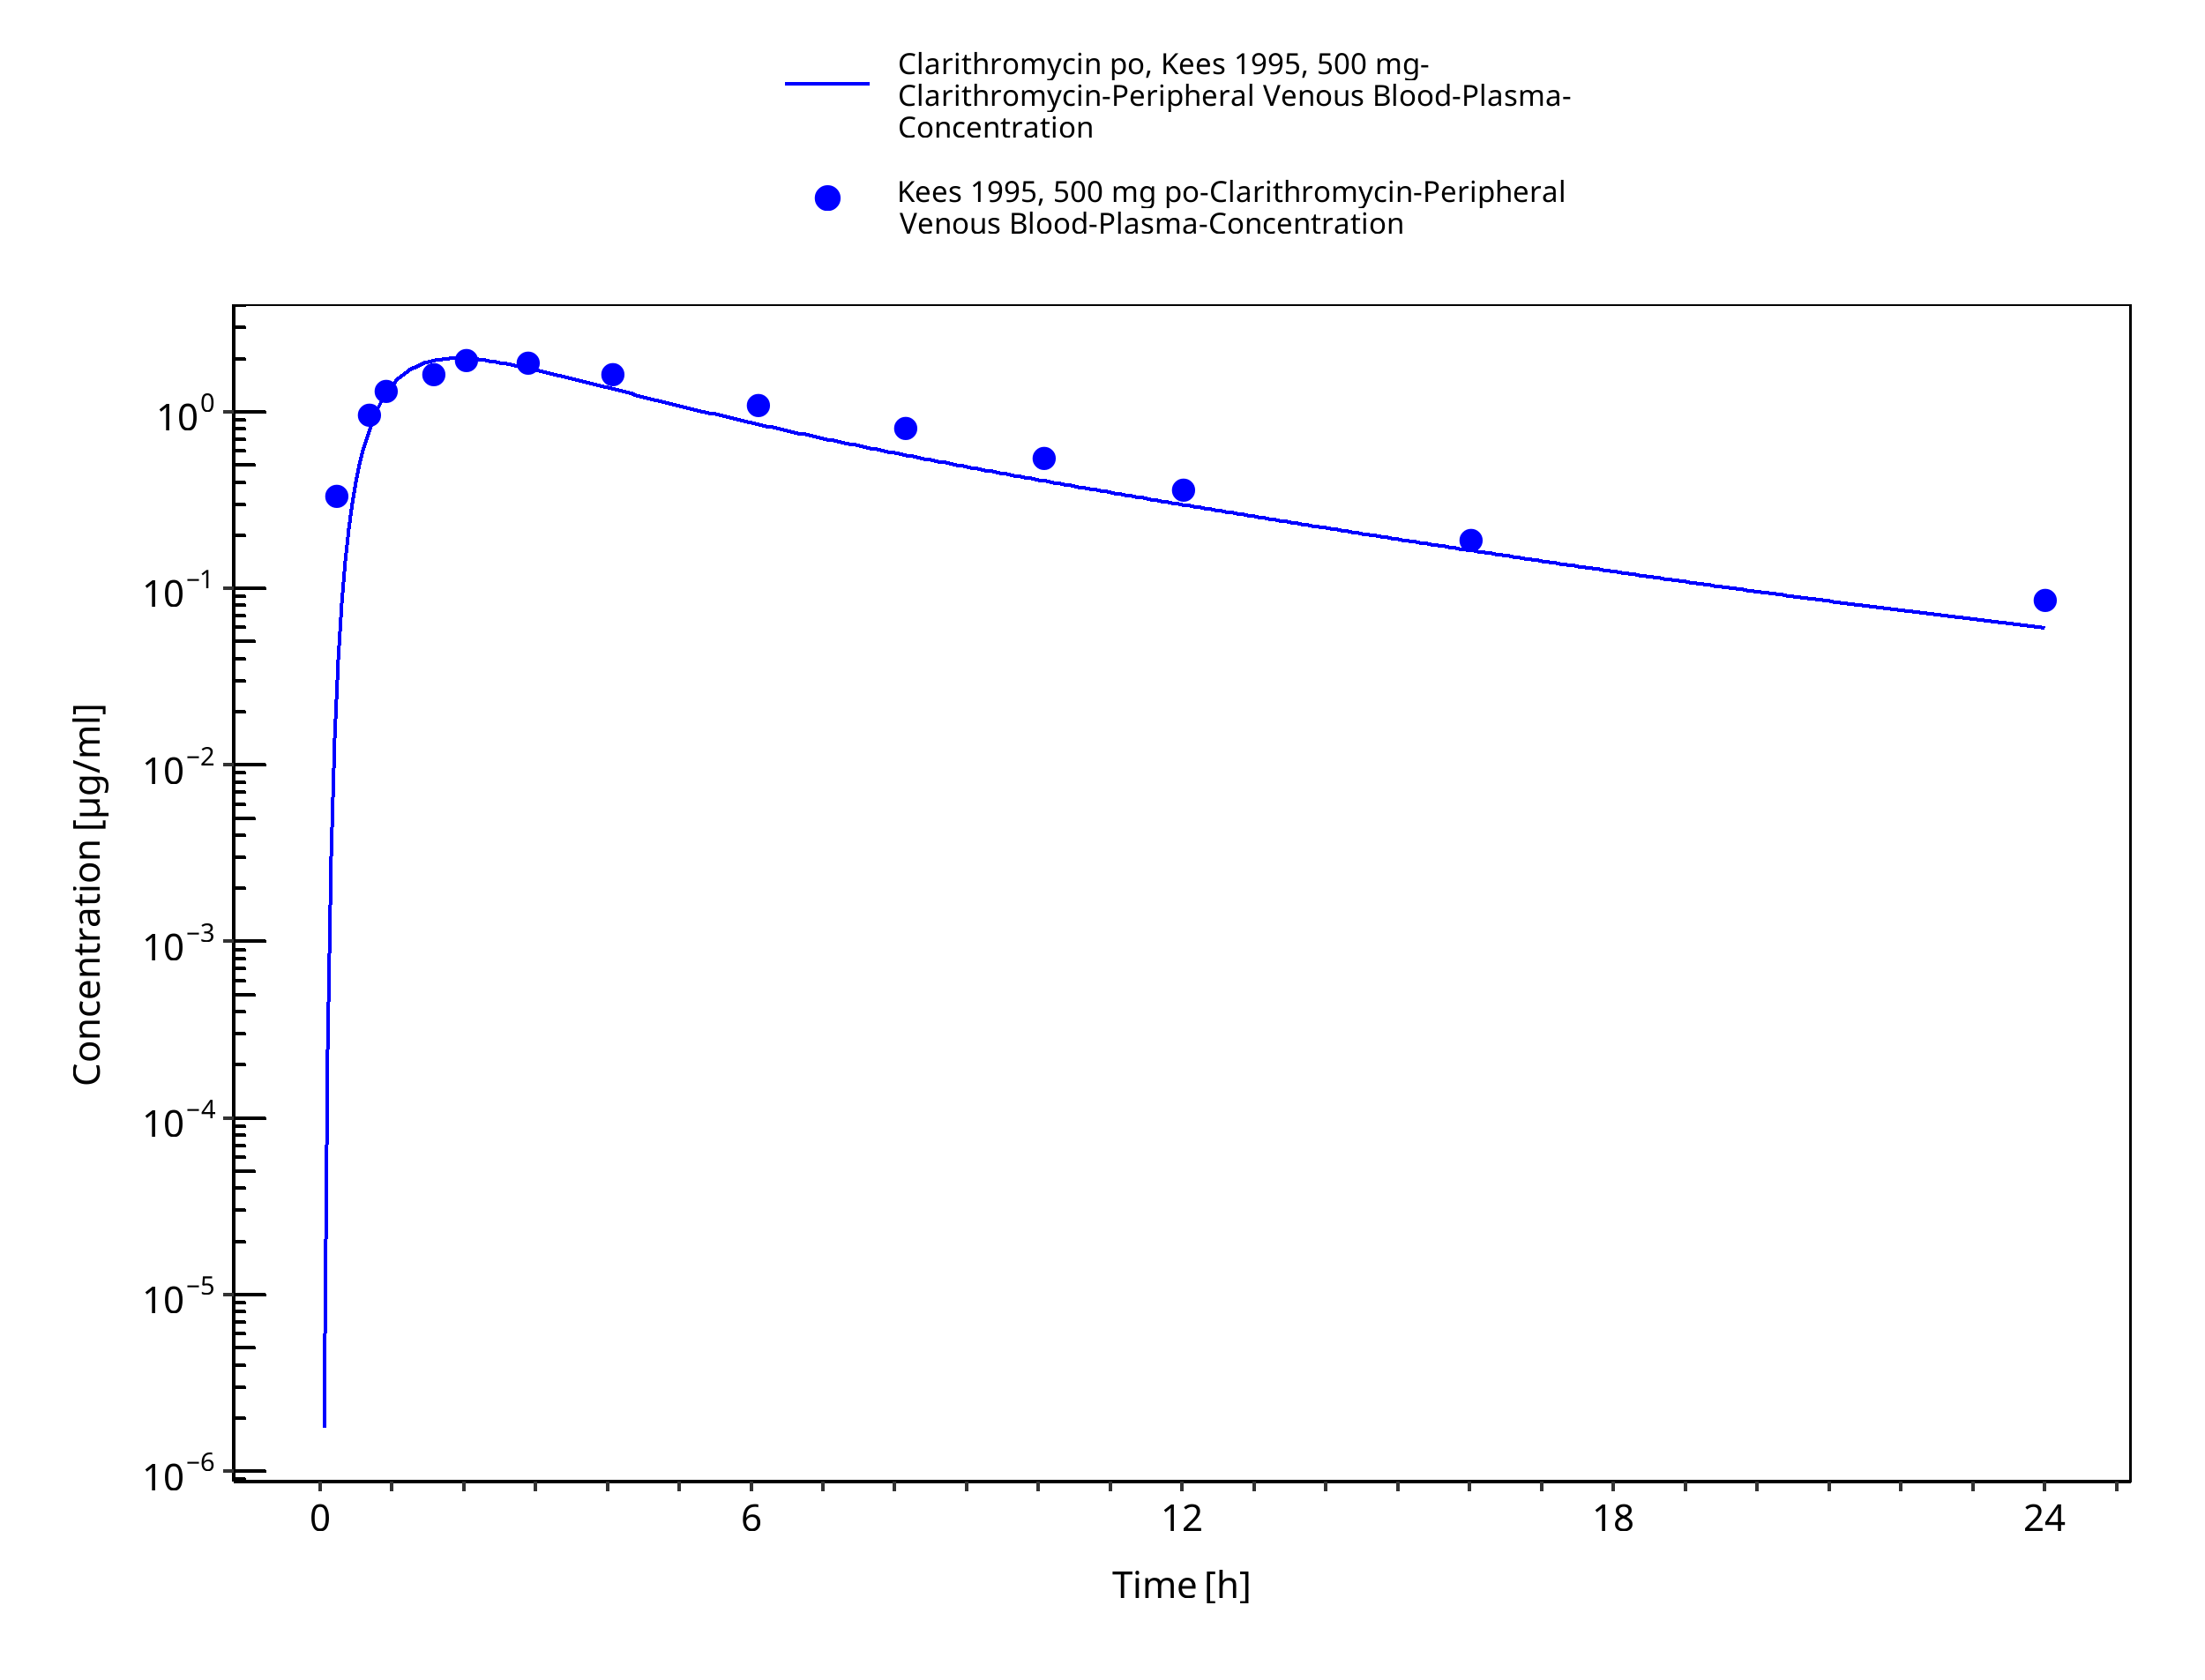
Figure 3-32: Time Profile Analysis 1
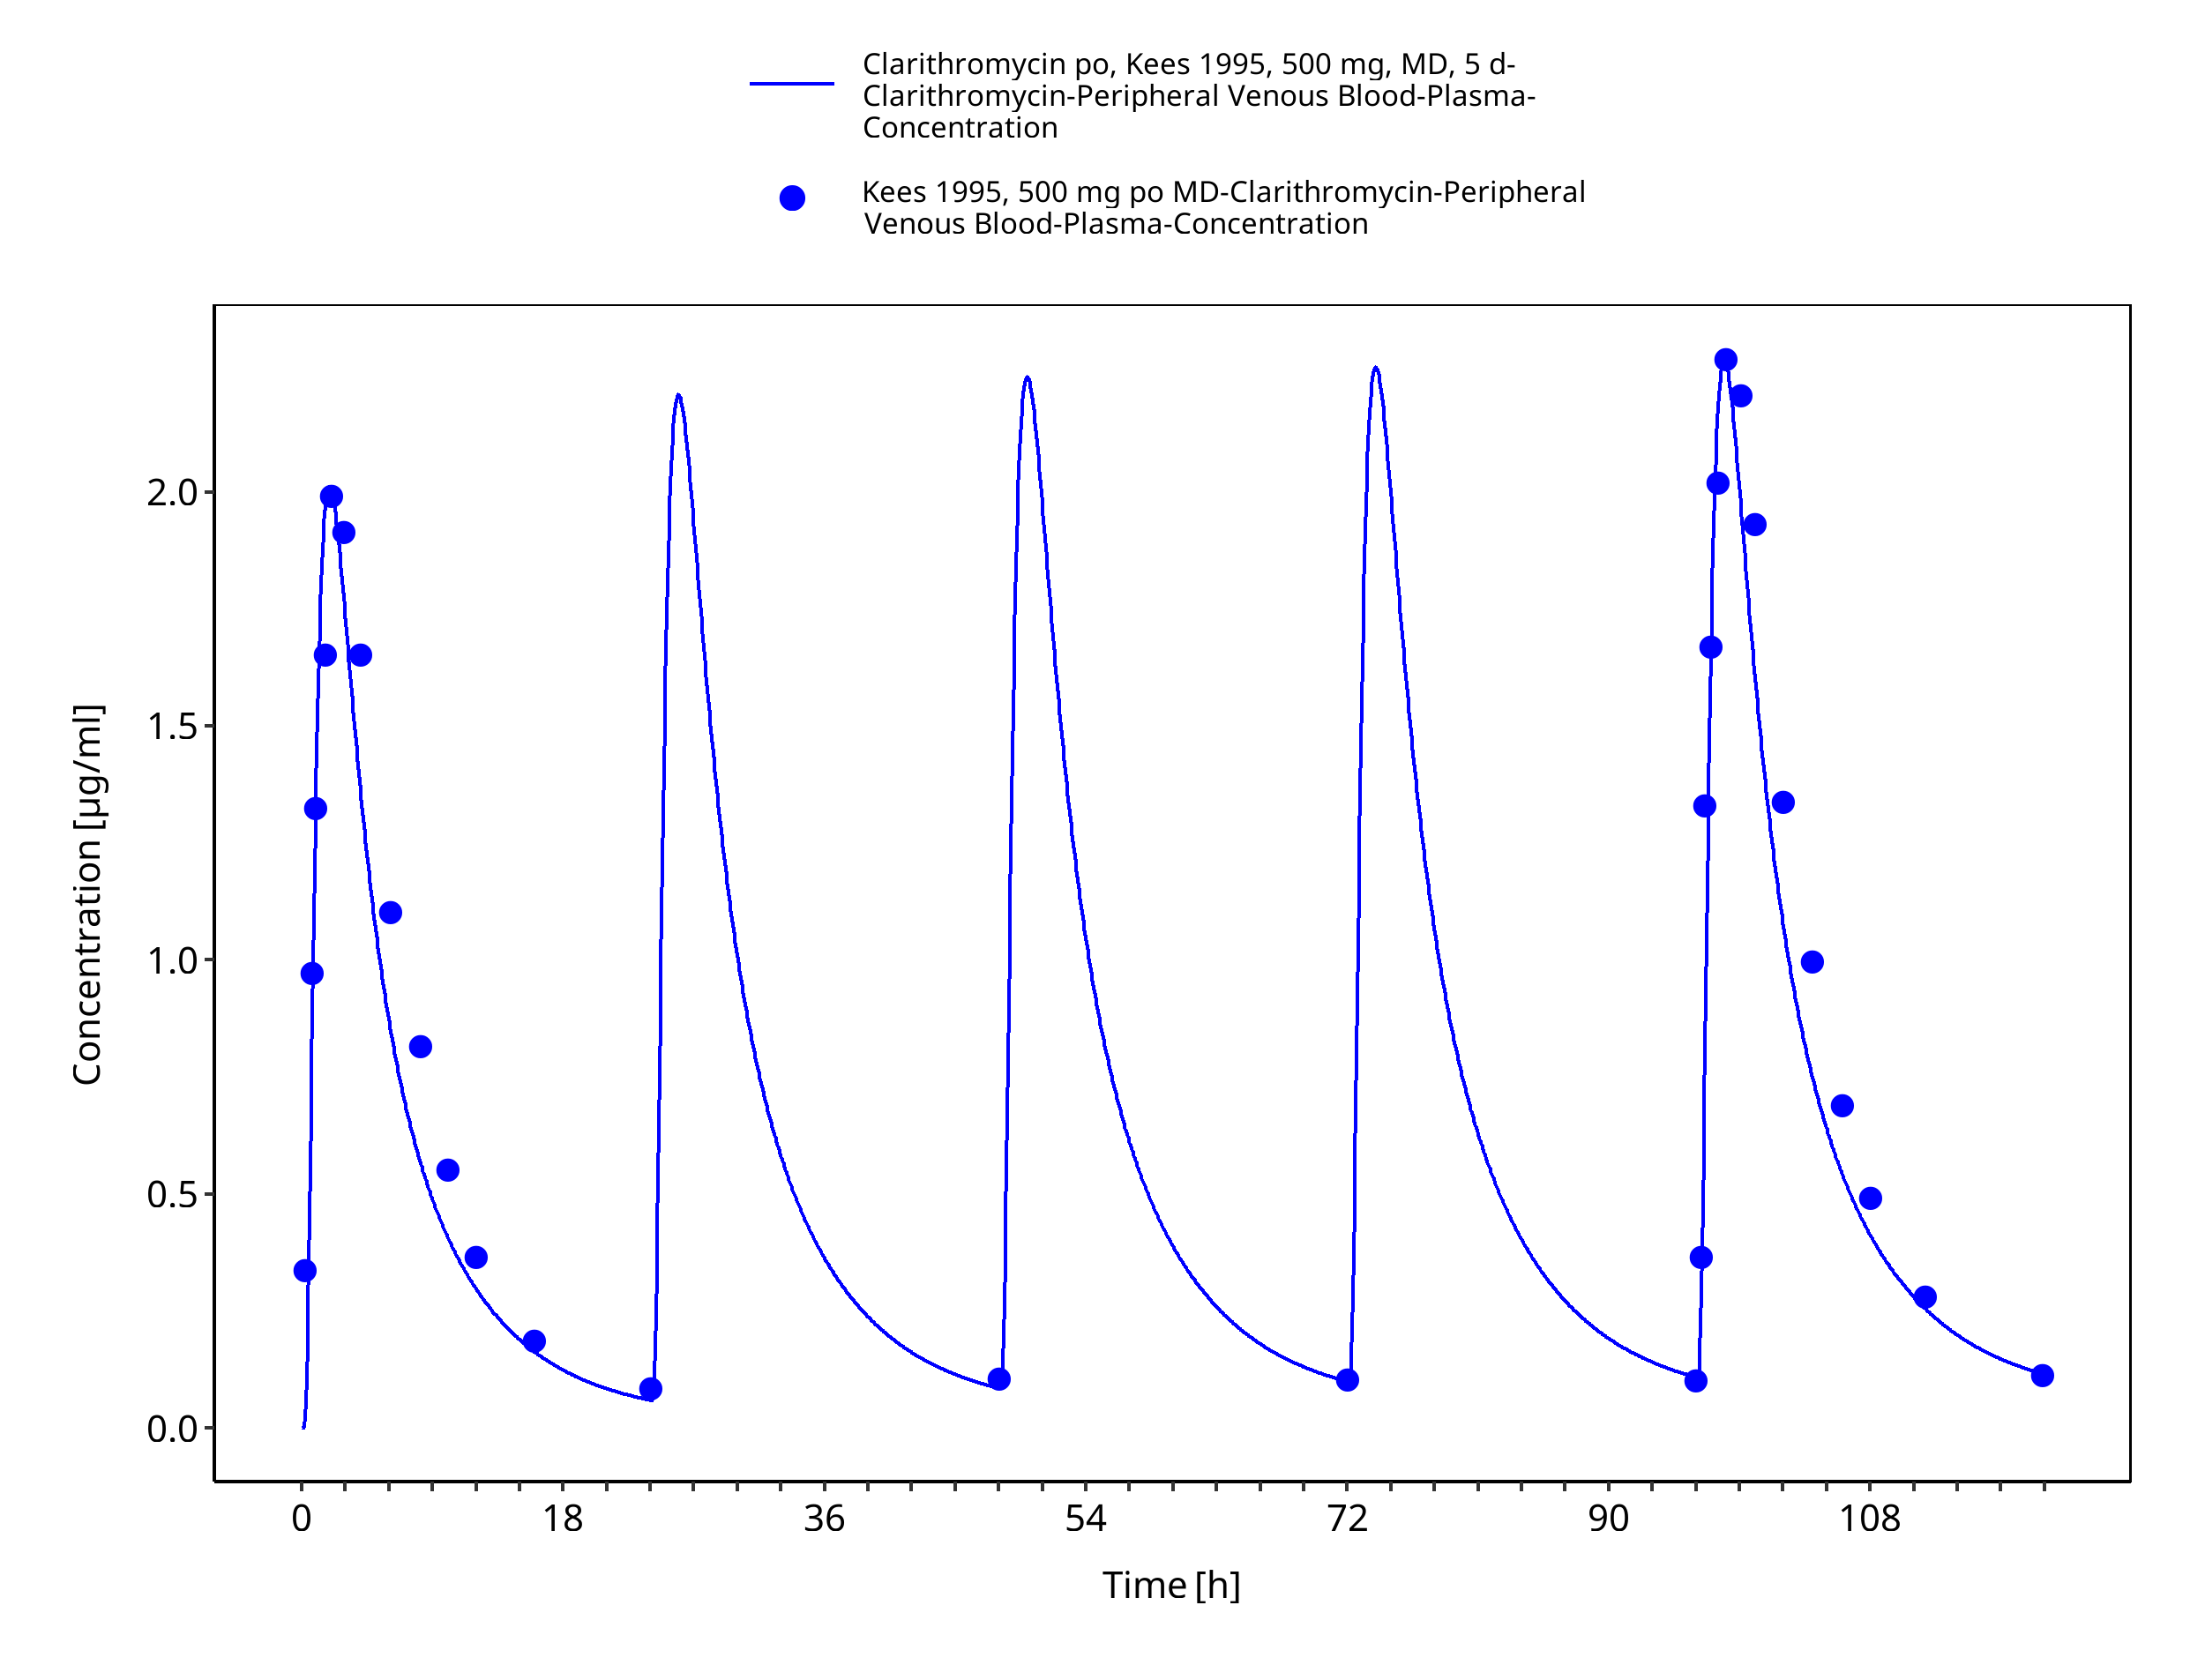
Figure 3-33: Time Profile Analysis
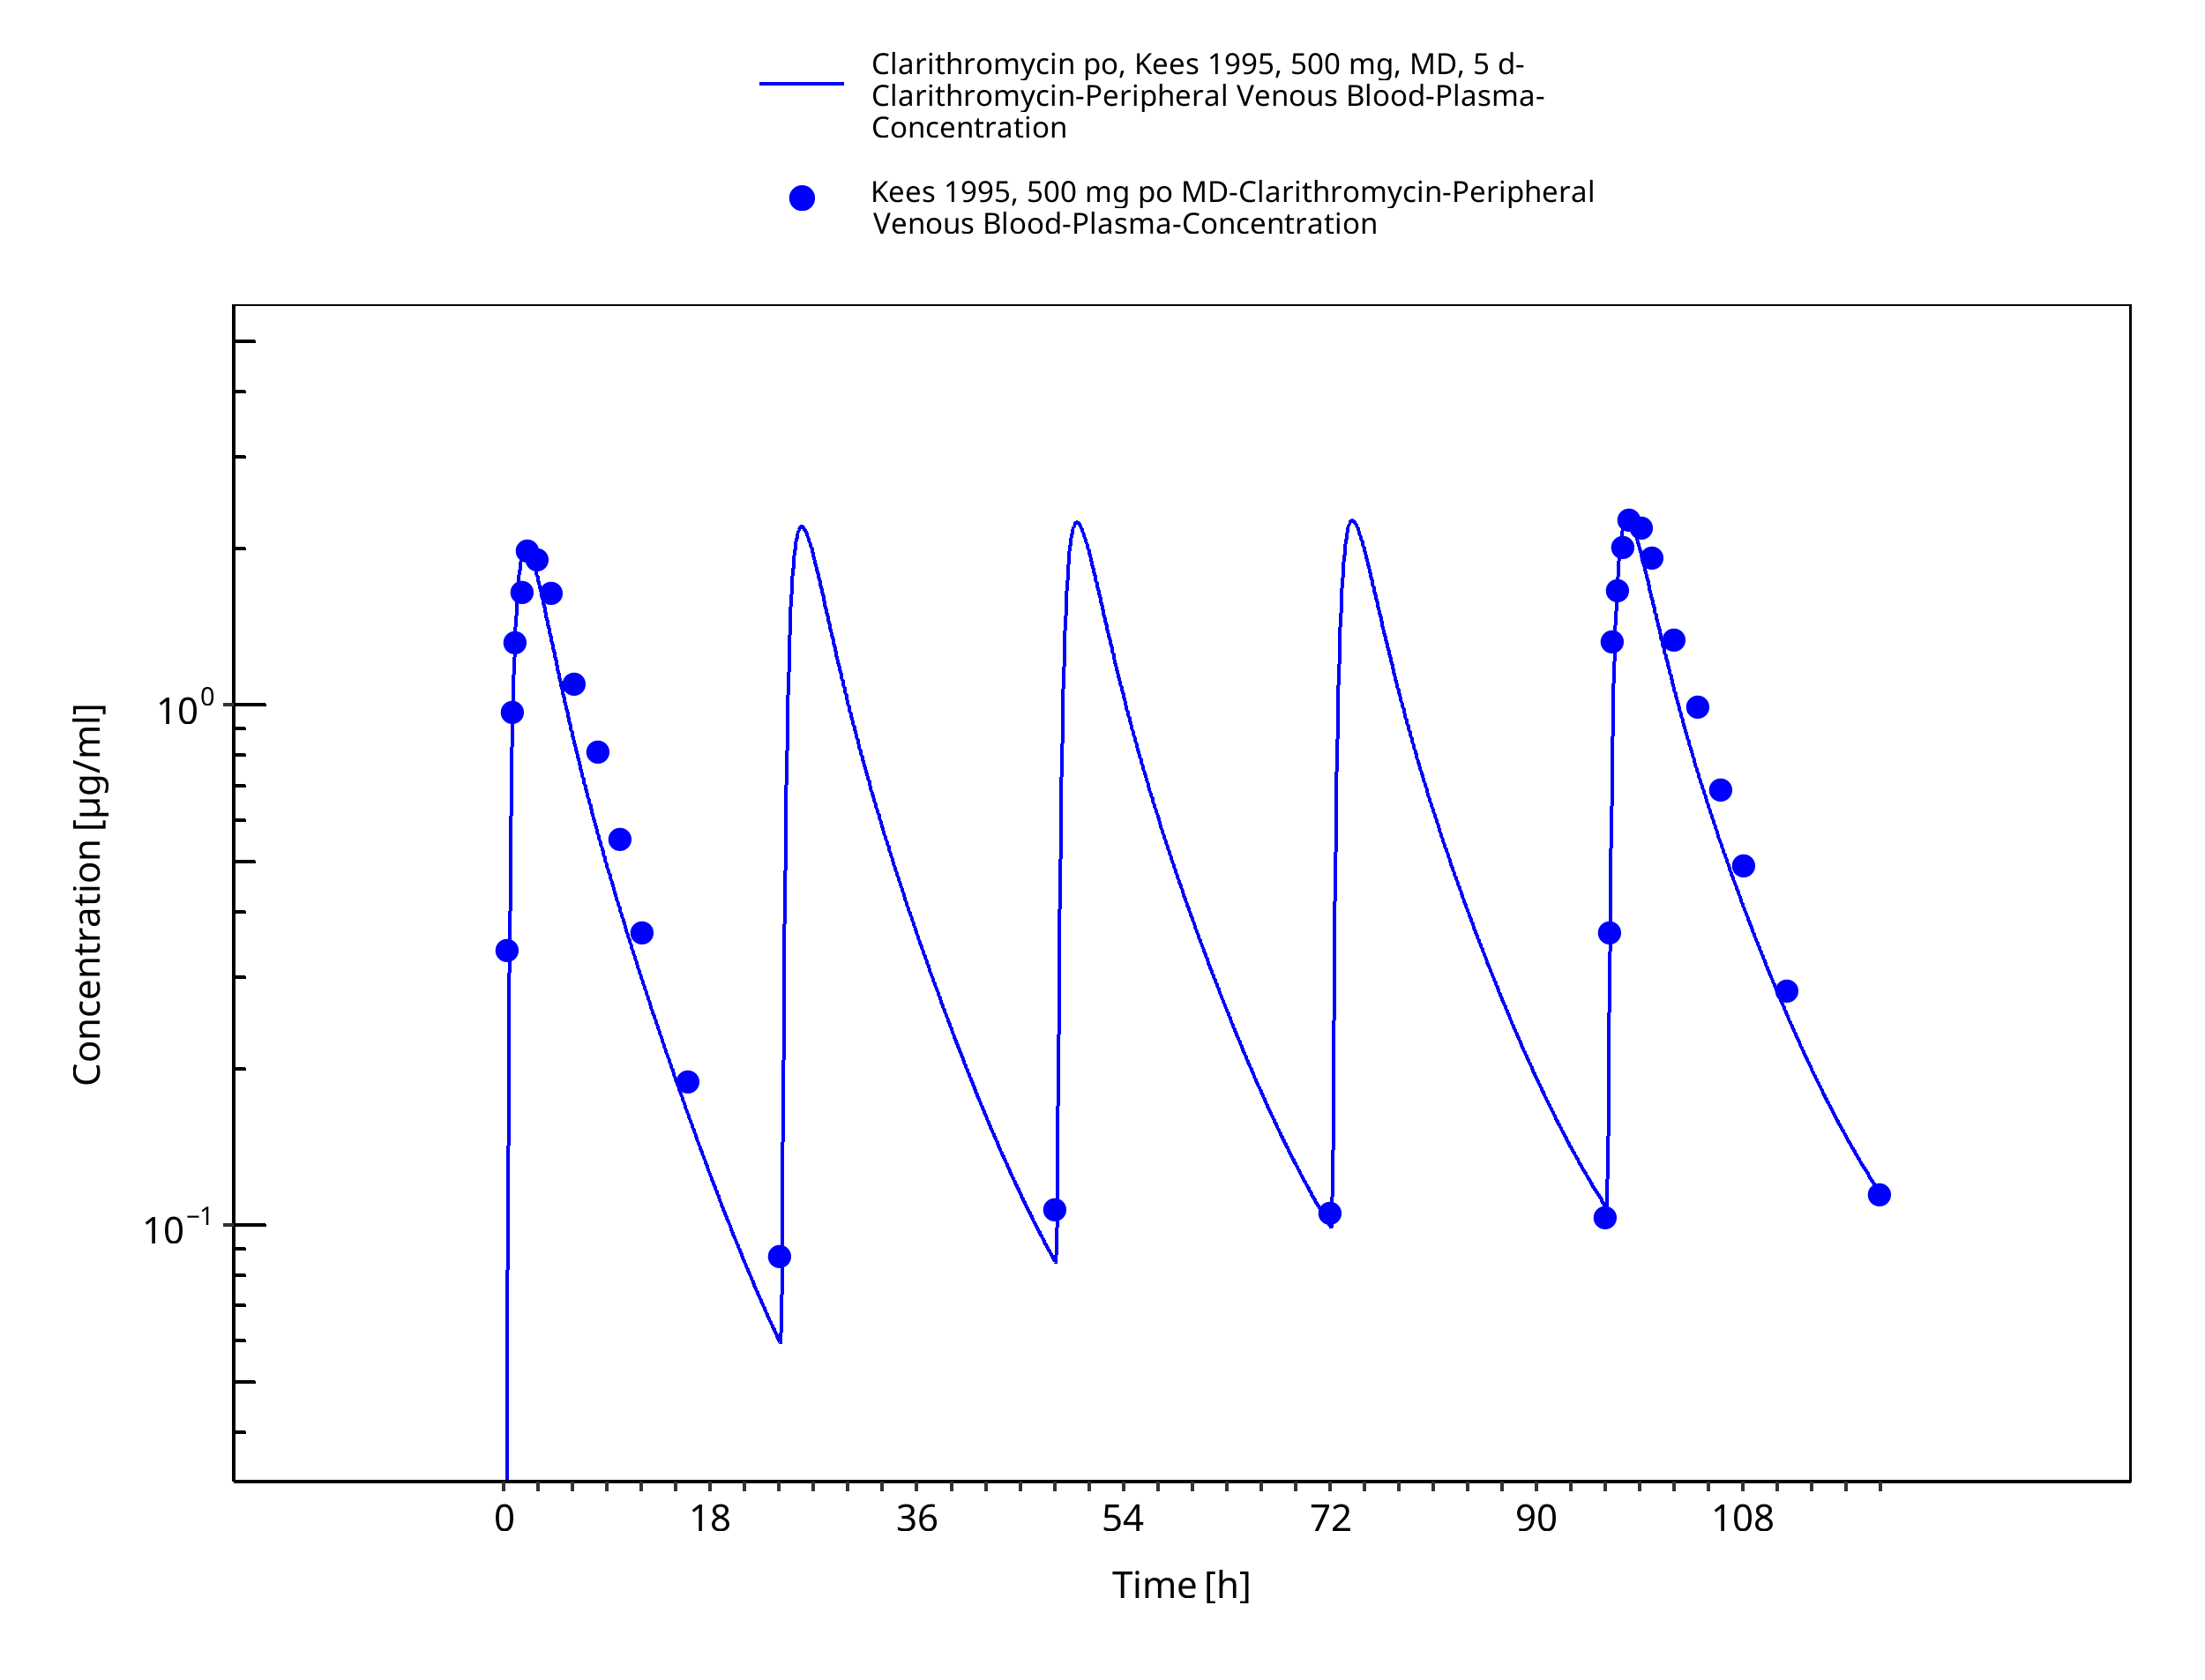
Figure 3-34: Time Profile Analysis 1
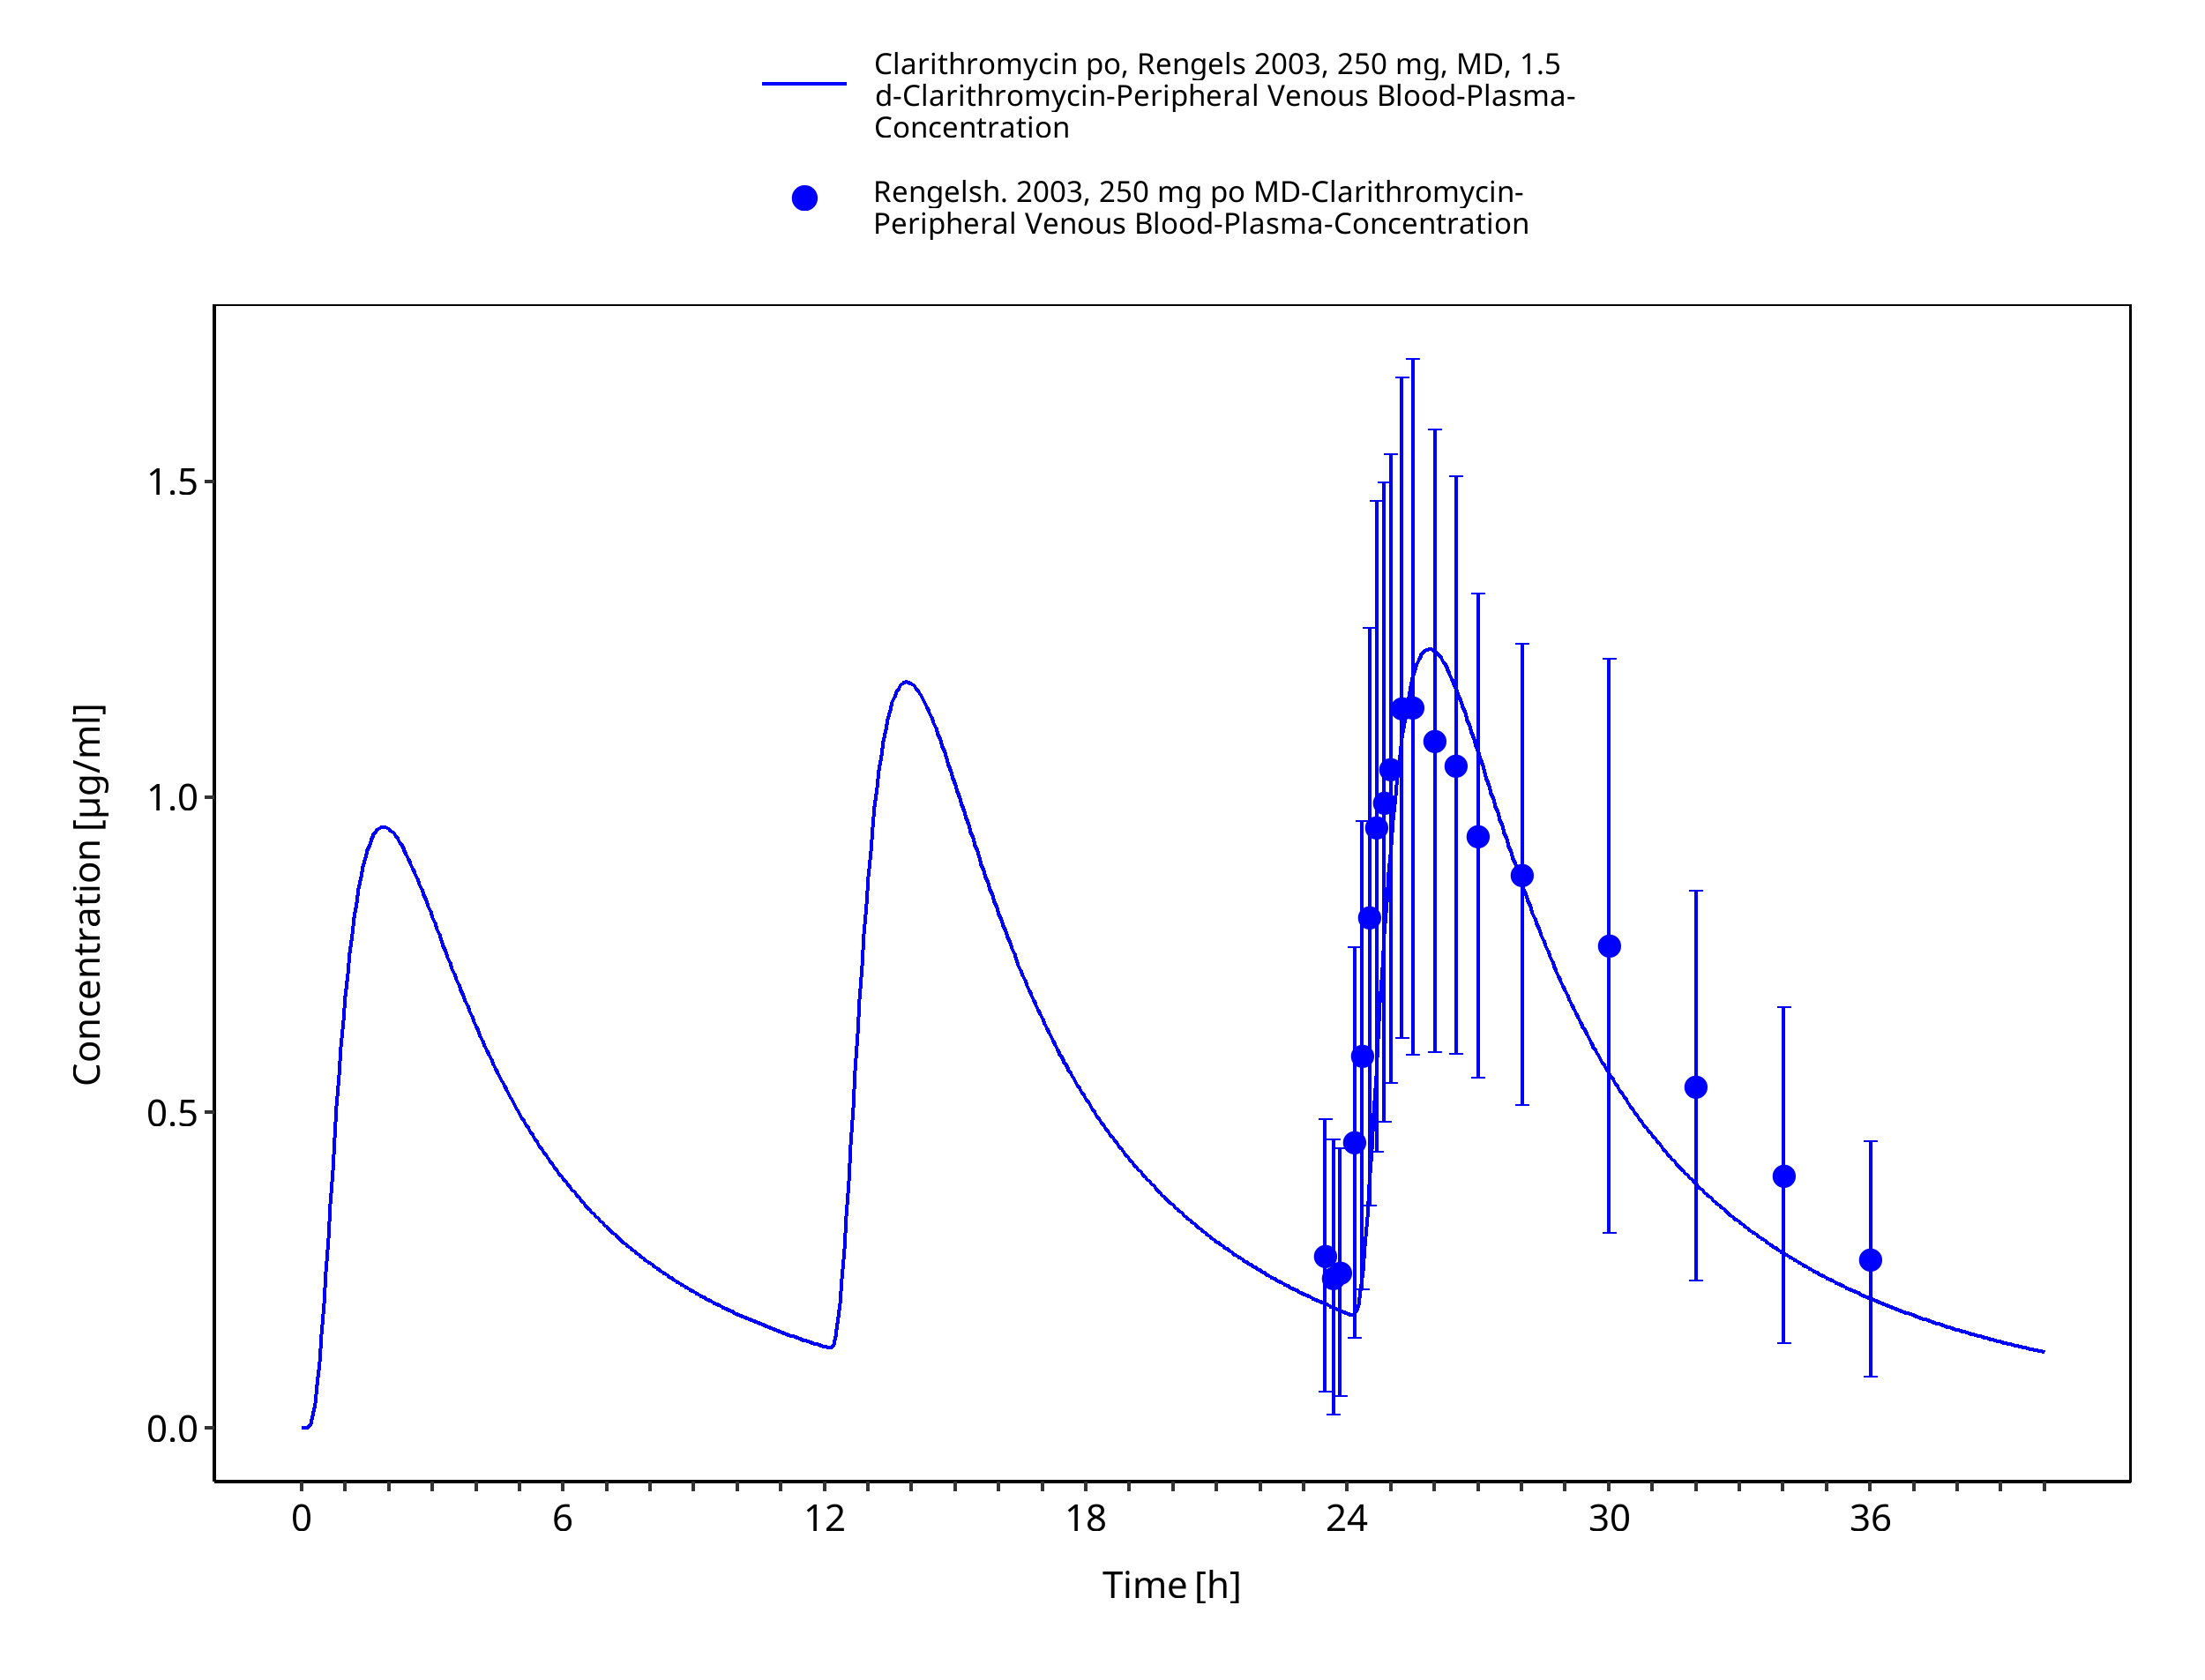
Figure 3-35: Time Profile Analysis
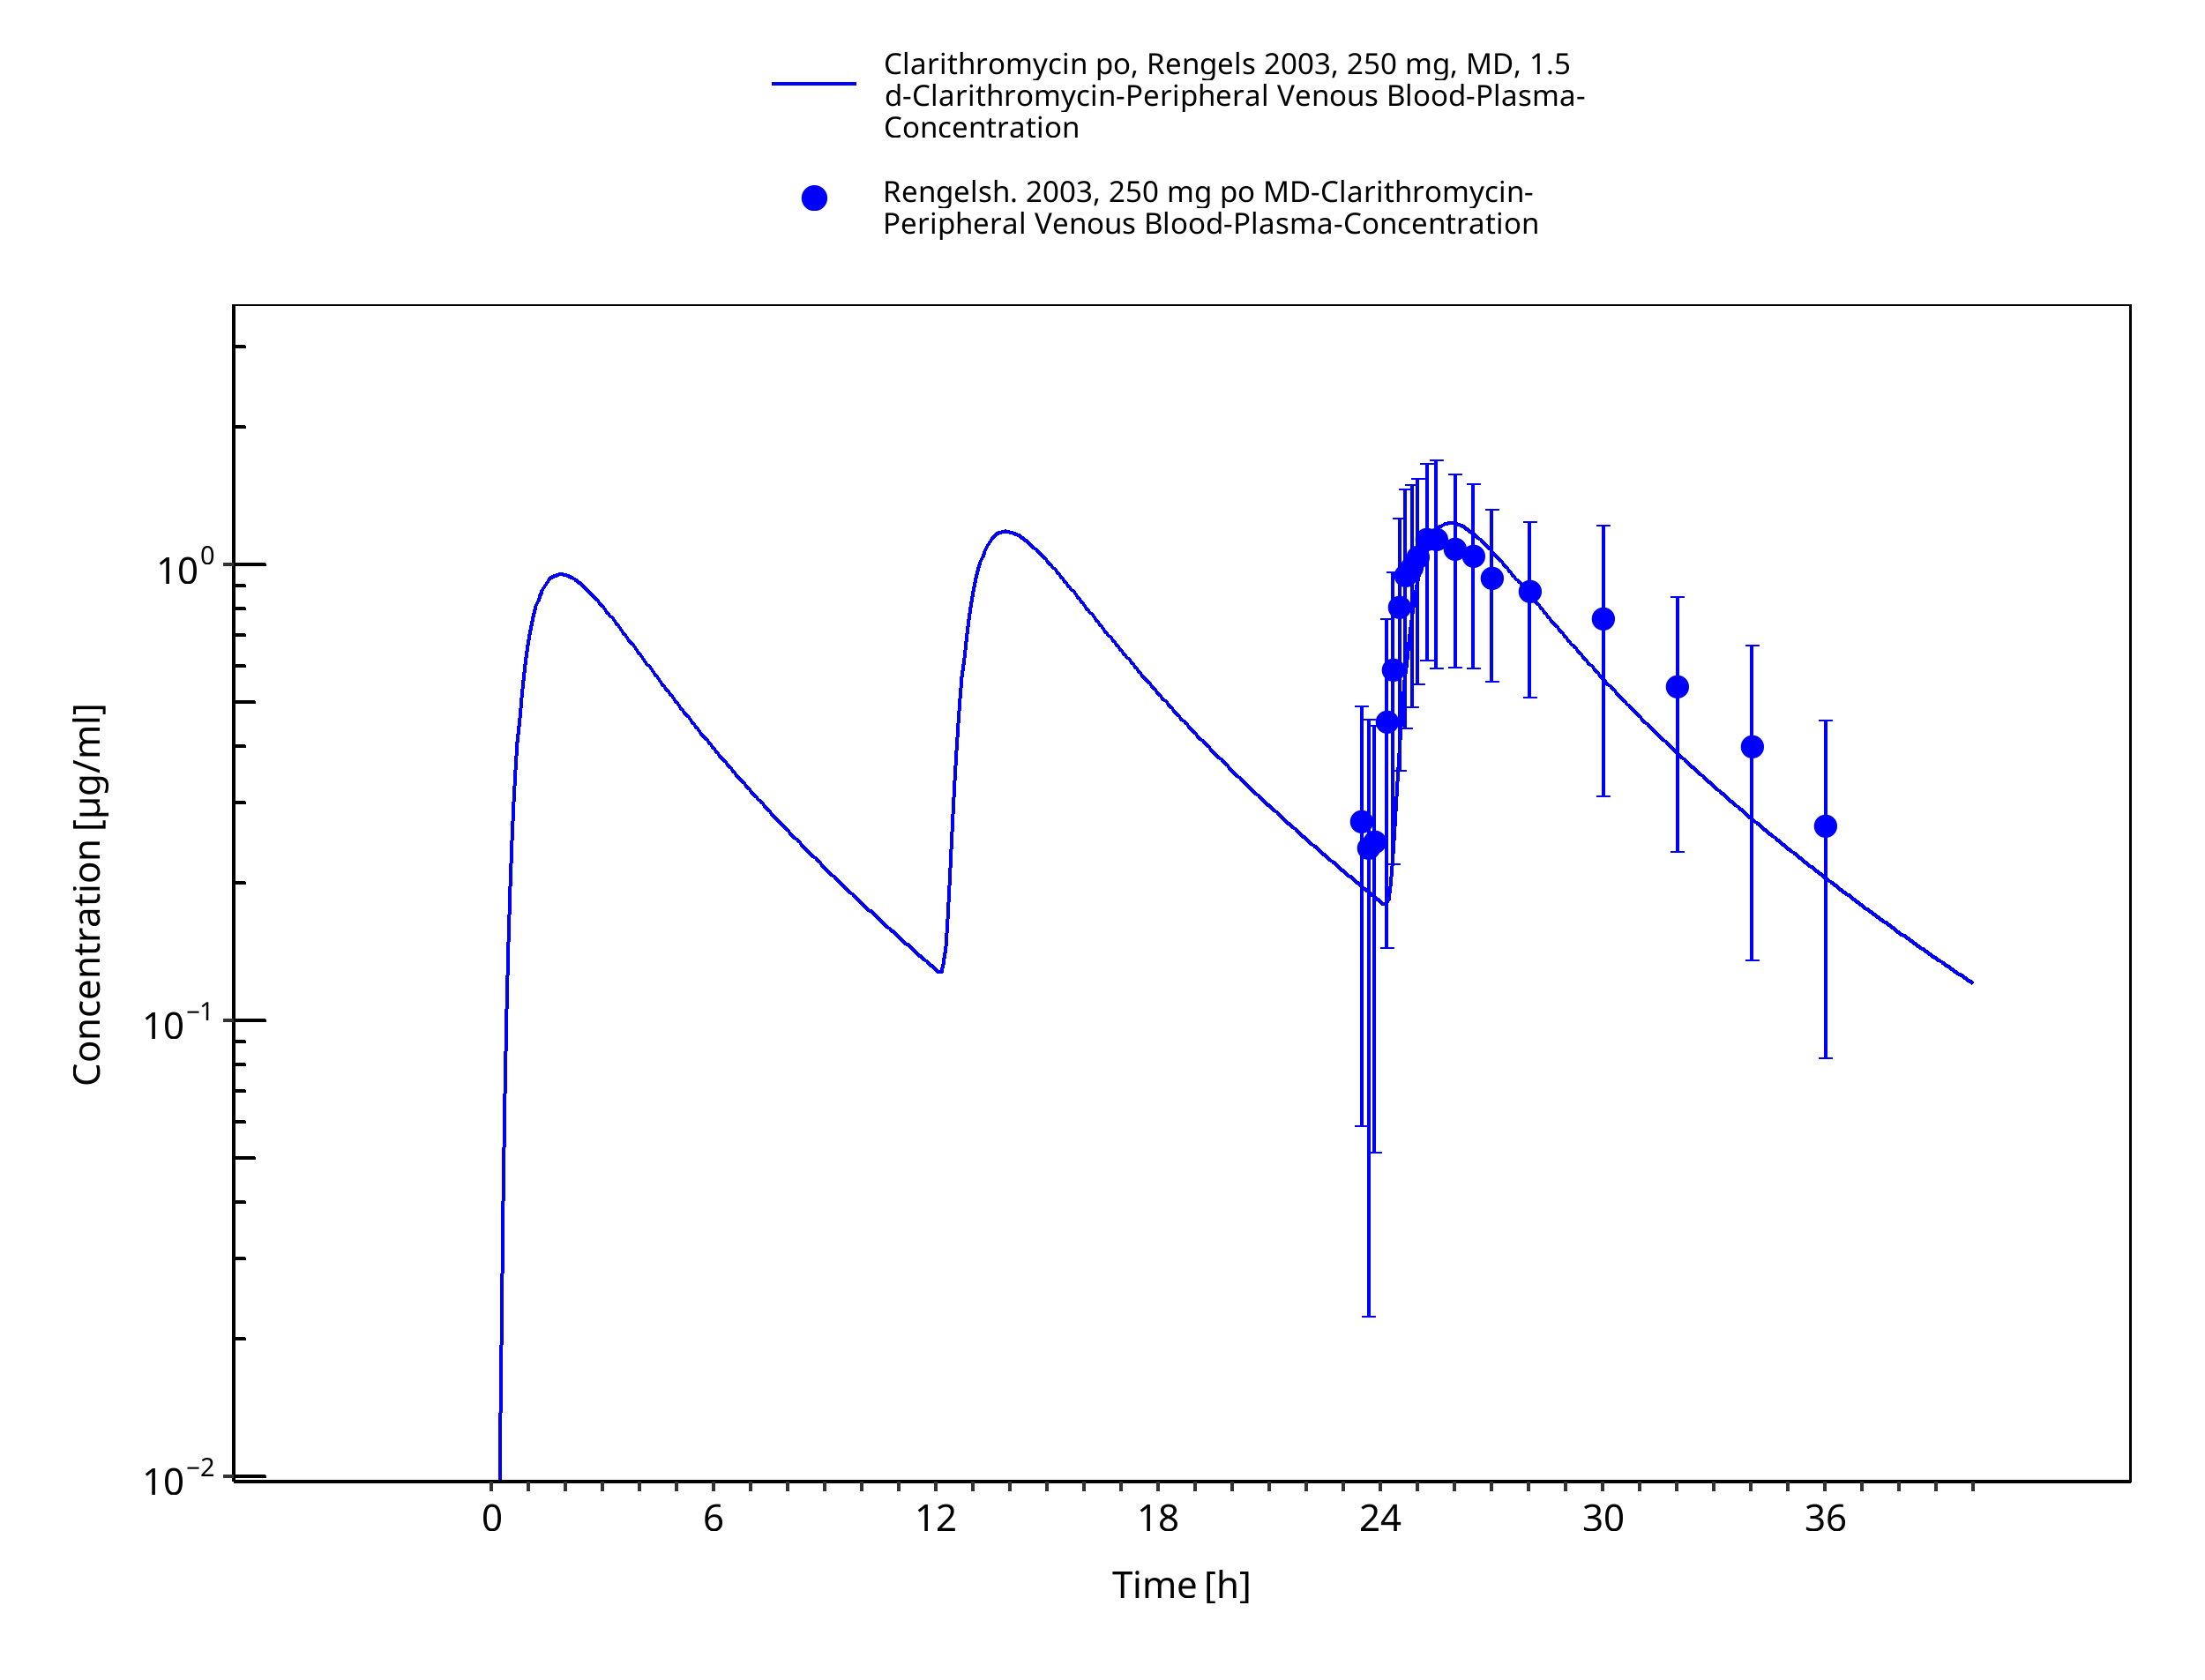
Figure 3-36: Time Profile Analysis 1
4 Conclusion
The herein presented PBPK model adequately describes the pharmacokinetics of clarithromycin in adults. In particular, it applies increased transfer and accumulation in red blood cells, metabolism by CYP3A4, renal clearance as unchanged drug and mechanism-based inactivation of CYP3A4. Thus, the model is fit for purpose to be applied for the investigation of drug-drug interactions with regard to inhibition of CYP3A4 and P-gp.
5 References
Abduljalil 2009 Abduljalil, K. et al. Modeling the autoinhibition of clarithromycin metabolism during repeated oral administration. Antimicrob. Agents Chemother. 53, 2892–901 (2009).
Chu 1992a Chu, S.Y. et al. Pharmacokinetics of clarithromycin, a new macrolide, after single ascending oral doses. Antimicrob. Agents Chemother. 36, 2447–53 (1992).
Chu 1992b Chu, S.Y., Deaton, R. & Cavanaugh, J. Absolute bioavailability of clarithromycin after oral administration in humans. Antimicrob. Agents Chemother. 36, 1147–50 (1992).
Chu 1993a Chu, S. et al. Single- and multiple-dose pharmacokinetics of clarithromycin, a new macrolide antimicrobial. J. Clin. Pharmacol. 33, 719–26 (1993).
Chu 1993b Chu, S.Y. et al. Effect of moderate or severe hepatic impairment on clarithromycin pharmacokinetics. J. Clin. Pharmacol. 33, 480–5 (1993).
Davey 1991 Davey, P.G. The pharmacokinetics of clarithromycin and its 14-OH metabolite. J. Hosp. Infect. 19 Suppl A, 29–37 (1991).
drugbank.ca. (https://www.drugbank.ca/drugs/DB01211), accessed on 04-28-2020.
Eberl 2007 Eberl, S. et al. Role of p-glycoprotein inhibition for drug interactions: evidence from in vitro and pharmacoepidemiological studies. Clin. Pharmacokinet. 46, 1039–49 (2007).
Hanke 2018 Hanke, N. et al. PBPK Models for CYP3A4 and P-gp DDI Prediction: A Modeling Network of Rifampicin, Itraconazole, Clarithromycin,Midazolam, Alfentanil, and Digoxin. CPT Pharmacometrics Syst. Pharmacol. 7, 647-659 (2018)
Ishiguro 1989 Ishiguro M, Koga H, Kohno S, Hayashi T, Yamaguchi K, Hirota M. Penetration of macrolides into human polymorphonuclear leucocytes. J Antimicrob Chemother. 24, 719–29 (1989)
Ito 2003 Ito, K., Ogihara, K., Kanamitsu, S.-I. & Itoh, T. Prediction of the in vivo interaction between midazolam and macrolides based on in vitro studies using human liver microsomes. Drug Metab. Dispos. 31, 945–54 (2003).
Kees 1995 Kees, F., Wellenhofer, M. & Grobecker, H. Serum and cellular pharmacokinetics of clarithromycin 500 mg q.d. and 250 mg b.i.d. in volunteers. Infection 23, 168–72 (1995).
Kuepfer 2016 Kuepfer L, Niederalt C, Wendl T, Schlender JF, Willmann S, Lippert J, Block M, Eissing T, Teutonico D. Applied Concepts in PBPK Modeling: How to Build a PBPK/PD Model.CPT Pharmacometrics Syst Pharmacol. 2016 Oct;5(10):516-531. doi: 10.1002/psp4.12134. Epub 2016 Oct 19.
Lappin 2011 Lappin, G. et al. Comparative pharmacokinetics between a microdose and therapeutic dose for clarithromycin, sumatriptan, propafenone, paracetamol (acetaminophen), and phenobarbital in human volunteers. Eur. J. Pharm. Sci. 43, 141–50 (2011).
Mayhew 2000 Mayhew, B.S., Jones, D.R. & Hall, S.D. An in vitro model for predicting in vivo inhibition of cytochrome P450 3A4 by metabolic intermediate complex formation. Drug Metab. Dispos. 28, 1031–7 (2000).
McFarland 1997 McFarland, J.W. et al. Quantitative structure-activity relationships among macrolide antibacterial agents: in vitro and in vivo potency against Pasteurella multocida. J. Med. Chem. 40, 1340–6 (1997).
Moj 2017 Moj, D. et al. Clarithromycin, midazolam, and digoxin: application of PBPK modeling to gain new insights into drug-drug interactions and co-medication regimens. AAPS J. 19, 298–312 (2017).
Noreddin 2002 Noreddin, A.M. et al. Pharmacodynamic modeling of clarithromycin against macrolide-resistant [PCR-positive mef(A) or erm(B)] Streptococcus pneumoniae simulating clinically achievable serum and epithelial lining fluid free-drug concentrations. Antimicrob. Agents Chemother. 46, 4029–34 (2002).
PK-Sim Ontogeny Database Version 7.3 (https://github.com/Open-Systems-Pharmacology/OSPSuite.Documentation/blob/38cf71b384cfc25cfa0ce4d2f3addfd32757e13b/PK-Sim%20Ontogeny%20Database%20Version%207.3.pdf)
Polasek 2006 Polasek, T.M. & Miners, J.O. Quantitative prediction of macrolide drug-drug interaction potential from in vitro studies using testosterone as the human cytochrome P4503A substrate. Eur. J. Clin. Pharmacol. 62, 203–8 (2006).
Rengelshausen 2003 Rengelshausen, J. et al. Contribution of increased oral bioavailability and reduced nonglomerular renal clearance of digoxin to the digoxin-clarithromycin interaction. Br. J. Clin. Pharmacol. 56, 32–8 (2003).
Rodrigues 1997 Rodrigues, A.D., Roberts, E.M., Mulford, D.J., Yao, Y. & Ouellet, D. Oxidative metabolism of clarithromycin in the presence of human liver microsomes. Major role for the cytochrome P4503A (CYP3A) subfamily. Drug Metab. Dispos. 25, 623–30 (1997).
Rodvold 1999 Rodvold, K.A. Clinical pharmacokinetics of clarithromycin. Clin. Pharmacokinet. 37, 385–98 (1999).
Salem 2003 Salem, I.I. & Düzgünes, N. Efficacies of cyclodextrin-complexed and liposome-encapsulated clarithromycin against Mycobacterium avium complex infection in human macrophages. Int. J. Pharm. 250, 403–14 (2003).
Schlender 2016 Schlender JF, Meyer M, Thelen K, Krauss M, Willmann S, Eissing T, Jaehde U. Development of a Whole-Body Physiologically Based Pharmacokinetic Approach to Assess the Pharmacokinetics of Drugs in Elderly Individuals. Clin Pharmacokinet. 2016 Dec;55(12):1573-1589.
Seithel 2007 Seithel, A. et al. The influence of macrolide antibiotics on the uptake of organic anions and drugs mediated by OATP1B1 and OATP1B3. Drug Metab. Dispos. 35, 779–86 (2007).
Vermeer 2016 Vermeer, L. M., Isringhausen, C. D., Ogilvie, B. W., & Buckley, D. B. Evaluation of ketoconazole and its alternative clinical CYP3A4/5 inhibitors as inhibitors of drug transporters: the in vitro effects of ketoconazole, ritonavir, clarithromycin, and itraconazole on 13 clinically-relevant drug transporters. Drug Metab. Dispos. 44, 453–459 (2016).
Related Models
Explore other Antibiotics models in this library:
- Amikacin - PBPK model and evaluation report
- Erythromycin - PBPK model and evaluation report
- Ethinylestradiol - PBPK model and evaluation report
- Rifampicin - PBPK model and evaluation report
- Vancomycin - PBPK model and evaluation report