Building and evaluation of a PBPK model for erythromycin in healthy adults
| Version | 2.0-OSP12.3 |
|---|---|
| based on Model Snapshot and Evaluation Plan | https://github.com/Open-Systems-Pharmacology/Erythromycin-Model/releases/tag/v2.0 |
| OSP Version | 12.3 |
| Qualification Framework Version | 3.7 |
This evaluation report and the corresponding PK-Sim project file are filed at:
https://github.com/Open-Systems-Pharmacology/OSP-PBPK-Model-Library/
Table of Contents
- 1 Introduction
- 2 Methods
- 2.1 Modeling Strategy
- 2.2 Data
- 2.3 Model Parameters and Assumptions
- 3 Results and Discussion
- 3.1 Final input parameters
- 3.2 Diagnostics Plots
- 3.3 Concentration-Time Profiles
- 4 Conclusion
- 5 References
1 Introduction
The presented model building and evaluation report evaluates the performance of a PBPK model for erythromycin in healthy adults.
Erythromycin a macrolide antibiotic used for the treatment of a number of bacterial infections, including respiratory tract infections, skin infections, chlamydia infections, and others. Erythromycin is available in the form of various salts and formulations, for example as:
- erythromycin lactobionate for intravenous injection
- erythromycin base in enteric-coated capsules or tablets for oral administration
- erythromycin stearate in filmcoated tablets for oral administration
- erythromycin ethylsuccinate in suspension or in filmcoated tablets for oral administration
In its free form as base, erythromycin is easily hydrolyzed in acidic aqueous solution (Mordi 2000). Therefore, orally administered erythromycin is given in the form of enteric-coated formulations or as more acid-stable salts or esters of erythromycin (e.g. erythromycin ethylsuccinate). Once in the small intestine, erythromycin is rapidly absorbed displaying a highly variable bioavailability (Chun 1977, Mather 1981). Erythromycin diffuses in most tissues and accumulates in leukocytes and phagocytes (Miller 1984, Carlier 1987). About 70% of erythromycin is bound to plasma proteins (Barre 1987). Erythromycin has been shown to be a substrate for various transporters including P-gp and OATP1B1. The latter has been shown to critically affect erythromycin disposition (Lancaster 2012). Erythromycin is extensively metabolized through N-demethylation catalyzed by CYP3A. Metabolism via CYP4F11 has also been suggested (Kalsotra 2004). Biliary excretion also appears to play an important role in erythromycin clearance (Acocella 1968, Chelvan 1979), but its contribution to total elimination remains unknown. The dose fraction excreted unchanged in urine is minimal and highly variable; reported fractions after IV administration range from 0.018 ± 0.005 to 0.171 ± 0.11 (mean ± SD) (Pasic 1987, Austin 1980). There is abundant evidence from in vitro studies that erythromycin irreversibly inhibits CYP3A (e.g. Larrey 1983) and the FDA lists erythromycin as moderate index inhibitor for CYP3A. Findings from in vivo studies investigating the dose linearity of erythromycin pharmacokinetics are not fully conclusive, but some studies observed a slight dose dependency (Austin 1980, Josefsson 1982).
2 Methods
2.1 Modeling Strategy
The general workflow for building an adult PBPK model has been described by Kuepfer et al. (Kuepfer 2016). Relevant information on the anthropometry (height, weight) was gathered from the respective clinical study, if reported. Information on physiological parameters (e.g. blood flows, organ volumes, hematocrit) in adults was gathered from the literature and has been incorporated in PK-Sim® as described previously (Willmann 2007). The applied activity and variability of plasma proteins and active processes that are integrated into PK-Sim® are described in the publicly available 'PK-Sim® Ontogeny Database Version 7.3' (PK-Sim Ontogeny Database Version 7.3).
The PBPK model was developed based on clinical data of healthy adult subjects obtained from the literature, covering different formulation types and erythromycin salts. Multiple doses and dosing schedules following intravenous (IV) and oral (PO) administration were included in model building. Mass balance information on urinary excretion of unchanged erythromycin after IV administration was also accounted for during the model building process.
Unknown parameters were simultaneously optimized using all available PK data, in particular:
- 4 data sets following single IV administration of 4 different doses of erythromycin (125 mg, 250 mg, 300 mg, 500 mg) as erythromycin lactobionate
- 6 data sets following single and multiple PO administration of 3 different doses of erythromycin (250 mg, 500 mg, 1000 mg) as film-coated tablets containing erythromycin stearate
- 2 data sets following single PO administration of 500 mg erythromycin as enteric-coated tablets containing erythromycin as base
- 2 data sets following single and multiple PO administration of 2 different doses of erythromycin (250 mg, 500 mg) as enteric-coated capsules containing pellets of erythromycin as base
Structural model selection was mainly guided by visual inspection of the resulting description of data and biological plausibility. The following parameters were identified using the Parameter Identification module provided in PK-Sim® and MoBi® (Open Systems Pharmacology Documentation):
Specific intestinal permeability (transcellular)Transport Protein - OATP1B1 - kcatMetabolizing Enzyme - CYP3A4 - kcatTotal Hepatic Clearance - Specific clearanceGFR fractionK_kinact_halfkinactDissolution shape(separately for the film-coated tablet containing erythromycin stearate, the enteric-coated tablet containing erythromycin as base, and the enteric-coated capsule containing pellets of erythromycin as base)Dissolution time (50% dissolved)(separately for the film-coated tablet containing erythromycin stearate, the enteric-coated tablet containing erythromycin as base, and the enteric-coated capsule containing pellets of erythromycin as base)Dissolution lag time(separately for the enteric-coated tablet containing erythromycin as base and the enteric-coated capsule containing pellets of erythromycin as base)Solubility at reference pH(only for the enteric-coated tablet containing erythromycin as base)
Details about input data (physicochemical, in vitro and clinical) can be found in Section 2.2.
Details about the structural model and its parameters can be found in Section 2.3.
2.2 Data
2.2.1 In vitro / physicochemical data
A literature search was carried out to collect available information on physicochemical properties of erythromycin. The obtained information from the literature is summarized in the table below and is used for model building.
| Parameter | Unit | Literature | Description |
|---|---|---|---|
| Molecular weight | g/mol | 733.9 (drugbank.ca) | Molecular weight |
| pKa (basic) | 8.8 (Lien 1974); 8.88 (McFarland 1997) | Acid dissociation constant | |
| logP | 2.48 (Lien 1974); 2.92 (Capobianco 1994); 3.06 (McFarland 1997) | Partition coefficient between octanol and water | |
| fu | 0.27 ± 0.05a (Sun 2010); 0.28 ± 0.04a (Iliopoulou 1982); 0.305 ± 0.028a (Barre 1987); 0.326 (Xu 2009) | Fraction unbound in human plasma | |
| Water solubility (erythromycin lactobionate) | mg/L | 200000 (U.S. Patent 2,761,859) | Solubility of erythromycin lactobionate in water |
| Water solubility (erythromycin stearate) | mg/L | 182 (Jones 1969) | Solubility of erythromycin stearate in water |
| Water solubility (erythromycin base) | mg/L | 2100 (Manna 1998) | Solubility of free erythromycin as base in water |
a mean ± SD
2.2.2 In vitro data on mechanism-based inhibition of CYP3A
A literature search was carried out to collect quantitative information the kinetic parameters describing the mechanism-based inhibition of CYP3A by erythromycin, KI and kinact. Ample data was collected from the literature and is summarized in the table below.
| Victim compound | In vitro system | Enzyme | KI [µM] | kinact [min-1] | Concentration range of erythromycin [µM] | Concentration of victim compound [µM] | Reference |
|---|---|---|---|---|---|---|---|
| testosterone | rec cDNA CYP3A4 | CYP3A4 | 1.04 | 0.0293 | 0 - 20 | 100 | Akiyoshi 2013 |
| testosterone | rec cDNA CYP3A4 | CYP3A4 | 1.21 | 0.0164 | 0 - 20 | 100 | Akiyoshi 2013 |
| testosterone | rec cDNA CYP3A4 | CYP3A4 | 0.415 | 0.0159 | 0 - 20 | 100 | Akiyoshi 2013 |
| testosterone | rec cDNA CYP3A4 | CYP3A4 | 2.24 | 0.0293 | 0 - 20 | 100 | Akiyoshi 2013 |
| testosterone | rec cDNA CYP3A4 | CYP3A4 | 0.753 | 0.0248 | 0 - 20 | 100 | Akiyoshi 2013 |
| midazolam | rec cDNA CYP3A4 | CYP3A | 9.5 | 0.16 | 50-fold range | 10 | Atkinson 2005 |
| midazolam | rec cDNA CYP3A4 | CYP3A | 8.82 | 0.12 | 50-fold range | 10 | Atkinson 2005 |
| midazolam | rec cDNA CYP3A4 | CYP3A | 8.3 | 0.09 | 50-fold range | 10 | Atkinson 2005 |
| testosterone | rec cDNA CYP3A4 | CYP3A | 9.5 | 0.06 | 4 - 200 | 16.7 | Atkinson 2005 |
| triazolam | HLM | CYP3A | 5.4 | 0.069 | 400 | Aueviriyavit 2010 | |
| testosterone | rec cDNA CYP3A4 | CYP3A4 | 5.3 | 0.12 | 5 - 20 | 200 | Chan 2000 |
| midazolam | cryopreserved HEP | CYP3A | 60 | 0.081 | 3 - 300 | 30 | Chen 2011 |
| midazolam | cryopreserved HEP | CYP3A | 67.9 | 0.079 | 3 - 300 | 30 | Chen 2011 |
| midazolam | rec cDNA CYP3A4 | CYP3A4 | 0.762 | 0.0648 | 0.1 - 30 | 4 | Ishikawa 2017 |
| testosterone | rec cDNA CYP3A4 | CYP3A4 | 1.00 | 0.0604 | 0.1 - 30 | 150 | Ishikawa 2017 |
| nifedipine | rec cDNA CYP3A4 | CYP3A4 | 0.794 | 0.0766 | 0.1 - 30 | 6 | Ishikawa 2017 |
| triazolam | HLM | CYP3A4 | 15.9 | 0.062 | 3 - 100 | 300 | Kanamitsu 2000 |
| triazolam | HLM | CYP3A4 | 17.4 | 0.055 | 3 - 100 | 300 | Kanamitsu 2000 |
| triazolam | rec cDNA CYP3A4 | CYP3A4 | 19.1 | 0.173 | 3 - 100 | 300 | Kanamitsu 2000 |
| triazolam | rec cDNA CYP3A4 | CYP3A4 | 18.9 | 0.097 | 3 - 100 | 300 | Kanamitsu 2000 |
| testosterone | HLM | CYP3A4 | 29.4 | 0.0271 | 250 | Kosaka 2017 | |
| testosterone | HLM | CYP3A4 | 30 | 0.040 | 0.3 - 300 | Kozakai 2013 | |
| midazolam | HLM | CYP3A4 | 12 | 0.035 | 0.3 - 300 | Kozakai 2013 | |
| midazolam | HLM | CYP3A4 | 20 | 0.033 | 0.3 - 300 | Kozakai 2013 | |
| midazolam | cryopreserved HEP | CYP3A | 25.15 | 0.08 | 0.13 - 100 | 30 | Mao 2011 |
| midazolam | HLM | CYP3A | 10.8 | 0.032 | Mao 2016 | ||
| midazolam | cryopreserved HEP | CYP3A | 30.7 | 0.05 | 0 - 300 | 20 | Mao 2016 |
| midazolam | cryopreserved HEP | CYP3A | 59.2 | 0.062 | 0 - 100 | 5 | Mao 2016 |
| midazolam | cryopreserved HEP | CYP3A | 80.3 | 0.052 | 0 - 100 | 20 | Mao 2016 |
| midazolam | rec cDNA CYP3A4 | CYP3A4 | 7.47 | 0.042 | 2 - 50 | 8 | McConn 2004 |
| midazolam | HLM | CYP3A4 | 10.9 | 0.046 | 2 - 100 | 8 | McConn 2004 |
| midazolam | primary HEP | CYP3A | 11 | 0.07 | 0.1 - 10 | 3 | McGinnity 2006 |
| midazolam | HLM | CYP3A4 | 10 | 0.036 | 0 - 25 | Obach 2007 | |
| testosterone | HLM | CYP3A4 | 9.8 | 0.039 | 0 - 25 | 500 | Obach 2007 |
| testosterone | rec cDNA CYP3A4 | CYP3A4 | 0.92 | 0.058 | 5 - 100 | 250 | Polasek 2006 |
| testosterone | HLM | CYP3A4 | 12.8 | 0.037 | 5 - 100 | 250 | Polasek 2006 |
| midazolam | rec cDNA CYP3A4 | CYP3A4 | 5.1 | 0.30 | 0.5 - 50 | 100 | Ring 2005 |
| testosterone | rec cDNA CYP3A4 | CYP3A4 | 0.92 | 0.058 | Teng 2010 | ||
| testosterone | HLM | CYP3A4 | 4.579 | 0.0115 | Teng 2010 | ||
| domperidone | HLM | CYP3A4 | 18.4 | 0.022 | 2.5 - 200 | 500 | Ung 2009 |
| domperidone | rec cDNA CYP3A4 | CYP3A4 | 4.1 | 0.026 | 2.5 - 200 | 500 | Ung 2009 |
| midazolam | HLM | CYP3A4 | 12.1 | 0.0215 | 0 - 100 | 25 | Watanabe 2007 |
| nifedipine | HLM | CYP3A4 | 11.3 | 0.0295 | 0 - 100 | 50 | Watanabe 2007 |
| testosterone | HLM | CYP3A4 | 10.9 | 0.0352 | 0 - 100 | 200 | Watanabe 2007 |
| midazolam | HLM | CYP3A | 1.48 | 0.017 | 0.5 - 500 | 20 | Xu 2009 |
| midazolam | cryopreserved HEP | CYP3A | 20.0 | 0.016 | 0.5 - 500 | 20 | Xu 2009 |
| midazolam | cryopreserved HEP | CYP3A | 109 | 0.055 | 0.5 - 500 | 20 | Xu 2009 |
| midazolam | HLM | CYP3A | 81.8 | 0.0665 | 20 - 400 | 10 | Yamano 2001 |
| midazolam | HLM | CYP3A | 15.7 | 0.1 | Zhang 2006 | ||
| testosterone | rec cDNA CYP3A4 | CYP3A4 | 5 | 0.34 | 1 - 50 | 200 | Zhang 2009 |
| testosterone | HLM | CYP3A4 | 15.7 | 0.09 | 1 - 50 | 200 | Zhang 2009 |
| midazolam | HLM | CYP3A4 | 26.5 | 0.041 | 2.5 - 50 | 10 | Zimmerlin 2011 |
Note: Abbreviations: HEP: human hepatocytes; HLM: human liver microsomes; rec cDNA CYP3A4: human recombinant c-DNA CYP3A4 enzymes (e.g. supersomes, baculovirus-insect cell system, E. coli transfected cells)
The data listed in the Table above can be statistically summarized as follows:
| Parameter [unit] | Min | Q1 | Geometric mean | Median | Arithmetic mean | Q3 | Max |
|---|---|---|---|---|---|---|---|
| KI [µM] | 0.420 | 4.89 | 8.71 | 10.9 | 18.4 | 19.3 | 109 |
| kinact [min-1] | 0.0115 | 0.0314 | 0.0504 | 0.0535 | 0.0664 | 0.0772 | 0.340 |
2.2.3 Clinical data
A literature search was carried out to collect available PK data on erythromycin in healthy adults. The following data from the publications listed below were used for model building and evaluation:
| Publication | Study description |
|---|---|
| Austin 1980 | IV administration of 125 mg, 250 mg, 500 mg, and 900 mg as erythromycin lactobionate; single dose |
| Barre 1987 | IV administration of 500 mg as erythromycin lactobionate; single dose |
| Berend 1979 | PO administration of 500 mg erythromycin stearate; multiple dose |
| Birkett 1990 | PO administration of 250 mg as enteric-coated capsules containing pellets of erythromycin base; single and multiple dose |
| Brannan 1995 | PO administration of 500 mg erythromycin stearate; multiple dose |
| DiSanto 1981 | PO administration of 500 mg as unprotected tablets containing erythromycin base, as film-coated tablets containing erythromycin base, as enteric-coated tablets containing erythromycin base and as film-coated tablets containing erythromycin stearate; single and multiple dose |
| Henry 1980 | PO administration of 500 mg erythromycin stearate; single dose |
| Huppertz 2011 | IV administration of 1000 mg as erythromycin lactobionate; single dose |
| Iliopoulou 1982 | PO administration of 500 mg as film-coated tablet containing erythromycin stearate; multiple dose |
| Josefsson 1982 | PO administration of 500 mg as film-coated tablet containing erythromycin stearate and 250 mg, 500 mg, 1000 mg as enteric coated capsules containing pellets of erythromycin base; single dose |
| Kavi 1988 | PO administration of 500 mg as film-coated tablet containing erythromycin stearate; single dose |
| Kivistö 1997 | PO administration of 500 mg as enteric-coated capsules containing erythromycin base; multiple dose |
| Kroboth 1982 | PO administration of 500 mg as enteric-coated tablets containing erythromycin base; single dose |
| Malmborg 1978 | PO administration of 500 mg as film-coated tablet containing erythromycin stearate; multiple dose |
| Miglioli 1990 | PO administration of 1000 mg erythromycin stearate; multiple dose |
| Olkkola 1993 | Midazolam-erythromycin interaction study; PO administration of 500 mg as enteric-coated tablet containing erythromycin base; multiple dose |
| Parsons 1977 | PO administration of 500 mg erythromycin stearate; single dose |
| Pasic 1987 | IV administration of 300 mg as erythromycin lactobionate; single dose |
| Posti 1983 | PO administration of 500 mg as film-coated tablets containing erythromycin stearate, as enteric-coated tablets containing erythromycin base, and as enteric-coated tablets containing erythromycin stearate; single dose |
| Schreiner 1984 | PO administration of 500 mg as film-coated tablets containing erythromycin stearate and as enteric-coated capsule containing pellets of erythromycin base; single dose |
| Shanson 1984 | PO administration of 1500 mg erythromycin stearate; single dose |
| Simon 1980 | IV administration of 500 mg erythromycin lactobionate and PO administration of 500 mg erythromycin stearate; single dose |
| Sun 2010 | IV administration of 125 mg and PO administration of 250 mg (salt and formulation type not specified); single dose |
| Yakatan 1979 | PO administration of 250 mg as film-coated tablet containing erythromycin stearate; single dose |
| Yakatan 1980 | PO administration of 250 mg as film-coated tablet containing erythromycin stearate and as enteric-coated tablet containing erythromycin base; single and multiple dose |
2.3 Model Parameters and Assumptions
2.3.1 Dissolution and absorption
Development of an adequate absorption model for erythromycin was complicated by the large intersubject variability in the absorption kinetics of erythromycin (Chun 1977, Mather 1981). Additionally, multiple formulation types are available entailing different dissolution and absorption kinetics (Chun 1977, Yakatan 1980, Mather 1981). The herein presented model was developed for the following oral dosage forms:
- film-coated tablets containing erythromycin stearate
- enteric-coated tablets containing erythromycin as free base
- enteric-coated capsules containing pellets of erythromycin as free base
The following sections briefly address how each of these formulations was modeled in presented PBPK models.
2.3.1.1 Film-coated tablet containing erythromycin stearate
Comparison of the reported erythromycin PK following administration of different doses of film-coated tablets containing the stearate salt indicated that the lowest dose (250 mg) yields a larger tmax than the higher doses (500, 1000 and 1500 mg). Different dissolution kinetics were therefore used for this formulation type; relatively slow dissolution kinetics was used for the 250 mg dose, whereas dissolution of the higher doses (500, 1000 and 1500 mg) was described by immediate-release kinetics. Both types of dissolution kinetics were described by the Weibull function. The parameters Dissolution shape and Dissolution time (50% dissolved) were optimized to optimally describe the clinical data. Additionally, solubility was also optimized as it was found during model building that solubility-limited absorption of the high doses captured the observed PK profiles better.
2.3.1.2 Enteric-coated tablet containing erythromycin as free base
Relatively few PK data were available for enteric-coated tablets containing erythromycin as free base. For this formulation type, PK profiles were only available for the 250 mg and 500 mg dose. For these two doses, dissolution was described by the Weibull function. To account for the enteric coating (protecting the tablet from dissolving in the stomach), a lag time > 0 min was applied in the model. To optimally describe the clinical data, relevant parameters of the Weibull function were optimized, namely the Dissolution shape, Dissolution time (50% dissolved) and lag time. Similar to the film-coated tablet containing the stearate salt, it was found that the observed PK profiles of the enteric-coated tablet containing erythromycin as free base could be better described when optimizing solubility.
2.3.1.3 Enteric-coated capsule containing pellets of erythromycin as free base
Comparison of the reported erythromycin PK following administration of different doses of enteric-coated capsules containing pellets of erythromycin base showed large variability in Cmax and tmax both within and between different doses (dose range: 250 mg - 1000 mg). Here, dissolution kinetics was also described by the Weibull function with relevant parameters (Dissolution shape, Dissolution time (50% dissolved) and lag time) being optimized to better describe clinical data. However, optimizing solubility did not result in a better description of the observed PK profiles. Consequently, solubility of erythromycin in this formulation type was fixed to a high value (500 mg/L) to avoid any solubility-related limitations in dissolution and absorption.
For all three formulations, the same Specific intestinal permeability (transcellular) was used in the PBPK model. This parameter was also optimized to better describe the clinical PK data.
2.3.2 Distribution
With an average fraction unbound in human plasma of approximately 0.30, erythromycin is moderately protein-bound. In the developed model, the fraction unbound (plasma, reference value) was set to 0.305 which is the value reported by Barre et al. (Barre 1987). Lipophilicity was fixed to a value of 2.82 which is the average of three experimentally measured values reported in the literature (Lien 1974, Capobianco 1994, McFarland 1997). The observed PK data were found to be best described using the model for estimating intracellular-to-plasma partition coefficients according to the method by Rodgers and Rowland (Rodgers 2005, Rodgers 2006). Cellular permeabilities were automatically calculated using the method Charge dependent Schmitt (Open Systems Pharmacology Documentation). Active transfer of erythromycin by OATP1B1 was modeled as Michaelis-Menten kinetics using an Influx transporter type; the Km value of 13.2 µM was taken from the literature (Lancaster 2012) and kcat was optimized to best match observed clinical data. The gene expression profile of OATP1B1 (default symbol for the gene: LST-3TM12) was loaded from the internal PK-Sim® database using the expression data quantified by RT-PCR (Open Systems Pharmacology Documentation).
2.3.3 Elimination
Erythromycin is extensively metabolized via N-demethylation catalyzed by CYP3A. Kinetics of this biotransformation was described by a Michaelis-Menten process. The following kinetic parameters erythromycin N-demethylation have been measured in human liver microsomes (HLM) and reported in the literature (mean ± standard error):
| Vmax [nmol/min/mg mic protein] | Km [µM] | Microsomal preparation | Reference |
|---|---|---|---|
| 2 ± 0.09 | 78 ± 9 | HLM from donor HL 3926 | Wang 1997 |
| 0.41 ± 0.02 | 44 ± 7 | HLM from donor HL 24493 | Wang 1997 |
| 0.345 ± 0.013 | 88 ± 10 | mixed HLM pool | Riley 1997 |
In the PBPK model, Vmax and Km were fixed to the mean of the values tabulated above (70 µM and 0.918 nmol/min/mg mic protein). The gene expression profile of CYP3A4 was loaded from the internal PK-Sim® database using the expression data quantified by RT-PCR (Open Systems Pharmacology Documentation).
Although it has also been observed that erythromycin is metabolized via CYP4F11 in vitro (Kalsotra 2004), this elimination pathway was not accounted for in the model because its contribution to overall elimination was assumed to be low. In humans, CYP4F11 is mainly expressed in the liver and to a much lesser extent in the kidney (Cui 2000) and the CYP4F family makes up approximately 15% of all hepatic CYP enzymes (Michaels 2014). The Km and Vmax values for the CYP4F11-mediated biotransformation reported by Kalsotra 2004 are similar to those measured for CYP3A4 (Riley 1997, Wang 1997), suggesting that the relative mass balance of these two metabolism pathways mainly depends on the absolute amount of each enzyme in the liver. While no information on total CYP4F11 in the human liver could be found in the literature, CYP4F11 expression in the liver of cynomolgus monkeys was observed to be approximately 6-fold lower than that of CYP3A4 (Uehara 2015). Hence, it was assumed that CYP4F11-mediated metabolism of erythromycin can be neglected in humans.
Additional elimination pathways suggested for erythromycin are acid-catalyzed degradation (hydrolysis) the acidic milieu of the stomach (Mordi 2000) and biliary excretion (Acocella 1968, Chelvan 1979), but no quantitative information on the mass balance of these pathways could be found in the literature. Additionally, mechanism-based inhibition of CYP3A4 by erythromycin might constitute another clearance process which was neither considered in the model. However, a total hepatic clearance process was implemented in the model which could at least partly account for other elimination pathways not explicitly accounted for in the model. Of note, despite the name total hepatic clearance, this clearance pathway was implemented as dummy clearance accounting for additional elimination processes that are not covered by CYP3A-mediated clearance and unchanged renal excretion and it should hence rather be regarded as a partial than a total clearance.
The reported dose fractions of erythromycin undergoing unchanged renal excretion after IV administration range from 0.018 ± 0.005 to 0.171 ± 0.11 (mean ± SD) (Pasic 1987, Austin 1980). This information was accounted for in the model by implementing a glomerular filtration process and optimizing the GFR fraction to match the observed dose fractions excreted unchanged in urine.
2.3.4 Autoinhibition via CYP3A4
In the scientific literature, large ranges have been reported for KI and kinact (Section 2.2.2). Since the exact values are unknown, K_kinact_half and kinact were both optimized within the observed range (see Section 2.2.2) during model building to best match the observed clinical data.
To better inform optimization of these two parameters, clinical data of a midazolam-erythromycin interaction study conducted by Olkkola et al. (Olkkola 1993) were included in the parameter optimization during model building. Therefore, the midazolam PBPK model v0.9 available on OSP GitHub (https://github.com/Open-Systems-Pharmacology/Midazolam-Model/releases/tag/0.9) was loaded in the PK-Sim® erythromycin file and the study by Olkkola et al. (Olkkola 1993) was simulated. However, instead of using the reported midazolam plasma concentrations as observed data in the parameter identification, the AUC of midazolam was used. More specifically, a midazolam target AUC after IV and oral administration was calculated by multiplying the simulated midazolam AUC (24.3 and 54.0 µmol min/L and after IV and oral administration, respectively) with the observed geometric mean AUC ratio (1.96 and 4.07 after IV and PO administration, respectively) (Olkkola 1993) resulting in target AUCs of 47.4 and 220 µmol min/L after IV and oral administration of midazolam, respectively. These values were included as observed data values in the parameter identification during model building. Since the AUC is not a default output that can directly be used in the parameter identification, the PBPK model structure was modified prior to running the parameter identification as described in the following. After exporting the model to MoBi®, an artificial reaction of a dummy molecule was created. The reaction rate was defined as the simulated peripheral venous blood plasma concentration of midazolam, hence yielding the AUC at any specific time point. Thereafter, the model was imported in PK-Sim® and included in the parameter identification. After being used in the parameter identification during model building, the model was not used any further.
2.3.5 Inhibition of P-gp
The model also includes competitive inhibition of P-gp with a Ki of 22.7 µmol/L (Eberl 2007).
2.3.6 Automated Parameter Identification
This is the result of the final parameter identification:
| Model Parameter | Formulation type/salt form | Optimized Value | Unit |
|---|---|---|---|
Dissolution shape |
Enteric coated pellets | 1.0564916105 | |
Dissolution shape |
Enteric coated tablet | 1.0838799888 | |
Dissolution shape |
Filmcoated tablet (except 250 mg dose) | 1.0960212213 | |
Dissolution shape |
Filmcoated tablet, 250 mg | 3.2811974117 | |
Dissolution time (50% dissolved) |
Enteric coated pellets | 1.7462743767 | min |
Dissolution time (50% dissolved) |
Enteric coated tablet | 79.6337524677 | min |
Dissolution time (50% dissolved) |
Filmcoated tablet (except 250 mg dose) | 1.7038947098 | min |
Dissolution time (50% dissolved) |
Filmcoated tablet, 250 mg | 83.6562552486 | min |
GFR fraction |
1.1591081815 | ||
K_kinact_half (CYP3A4) |
7.6007360452 | µmol/L | |
kcat (OATP1B1) |
2.0201069202* | 1/min | |
kinact (CYP3A4) |
0.0296261146 | 1/min | |
Km (OATP1B1) |
0.735836485 | µmol/L | |
Lag time |
Enteric coated pellets | 54.3490442506 | min |
Lag time |
Enteric coated tablet | 78.7967495765 | min |
Solubility at ref pH |
Enteric coated tablet, erythromycin base | 8.3990771997 | mg/L |
Solubility at ref pH |
Filmcoated tablet, erythromycin stearate | 28.0708790976 | mg/L |
Specific clearance |
4.1462183378 | 1/min | |
Specific intestinal permeability |
0.00038668371665 | cm/min |
* The value in the model was updated to 1.350032201 with the release of PK-Sim 10 to account for the updated calculation method of interstitial concentrations (please refer to the respective release notes of version 10).
3 Results and Discussion
The PBPK model for erythromycin was developed and verified with clinical pharmacokinetic data.
The next sections show:
- the final model parameters for the building blocks: Section 3.1.
- the overall goodness of fit: Section 3.2.
- simulated vs. observed concentration-time profiles for the clinical studies used for model building and for model verification: Section 3.3.
3.1 Final input parameters
The compound parameter values of the final PBPK model are illustrated below.
Compound: Erythromycin
Parameters
| Name | Value | Value Origin | Alternative | Default |
|---|---|---|---|---|
| Solubility at reference pH | 28.0708790976 mg/l | Parameter Identification-Parameter Identification-Value updated from '003 - BP conc ratio FIX' on 2019-11-14 14:43 | Erythromycin stearate film-coated tablet | True |
| Reference pH | 7 | Parameter Identification-Parameter Identification-Value updated from '001' on 2019-10-01 13:46 | Erythromycin stearate film-coated tablet | True |
| Solubility at reference pH | 500 mg/l | Parameter Identification-Parameter Identification-Value updated from '001' on 2019-10-01 13:46 | Erythromycin base enteric coated pellets | False |
| Reference pH | 7 | Parameter Identification-Parameter Identification-Value updated from '001' on 2019-10-01 13:46 | Erythromycin base enteric coated pellets | False |
| Solubility at reference pH | 200 mg/ml | Publication-In Vitro-Hoffhine, Jr Charles E. "Aqueous soluble salts of erythromycin." U.S. Patent 2,761,859, issued September 4, 1956. | Erythromycin lactobionate | False |
| Reference pH | 7 | Publication-In Vitro-Hoffhine, Jr Charles E. "Aqueous soluble salts of erythromycin." U.S. Patent 2,761,859, issued September 4, 1956. | Erythromycin lactobionate | False |
| Solubility at reference pH | 8.3990771997 mg/l | Parameter Identification-Parameter Identification-Value updated from 'Parameter Identification 1' on 2020-01-13 15:01 | Erythromycin base enteric coated tablet | False |
| Reference pH | 7 | Erythromycin base enteric coated tablet | False | |
| Lipophilicity | 2.82 Log Units | Parameter Identification-Parameter Identification-Value updated from 'Parameter Identification 1' on 2020-01-13 15:01 | Literature (average value) | True |
| Fraction unbound (plasma, reference value) | 0.305 | Publication-In Vivo-PMID: 3606934 | Barre 1987 | True |
| Specific intestinal permeability (transcellular) | 0.00038668371665 cm/min | Parameter Identification-Parameter Identification-Value updated from 'Parameter Identification 1' on 2020-01-13 15:01 | Fitted | True |
| Is small molecule | Yes | |||
| Molecular weight | 733.927 g/mol | Internet-drugbank.ca | ||
| Plasma protein binding partner | Unknown |
Calculation methods
| Name | Value |
|---|---|
| Partition coefficients | Rodgers and Rowland |
| Cellular permeabilities | Charge dependent Schmitt |
Processes
Metabolizing Enzyme: CYP3A4-Biotransformation_fitted
Molecule: CYP3A4
Parameters
| Name | Value | Value Origin |
|---|---|---|
| In vitro Vmax for liver microsomes | 918.33333 pmol/min/mg mic. protein | Publication-In Vitro-PMID: 9566442 |
| Km | 70 µM | Publication-In Vitro-Average of reported values in the literature (PMID: 9107550 and PMID: 9566442) |
Systemic Process: Glomerular Filtration-fitted
Species: Human
Parameters
| Name | Value | Value Origin |
|---|---|---|
| GFR fraction | 1.1591081815 | Parameter Identification-Parameter Identification-Value updated from 'Parameter Identification 1' on 2020-01-13 15:01 |
Inhibition: CYP3A4-MBI
Molecule: CYP3A4
Parameters
| Name | Value | Value Origin |
|---|---|---|
| kinact | 0.0296261146 1/min | Parameter Identification-Parameter Identification-Value updated from 'Parameter Identification 1' on 2020-01-13 15:01 |
| K_kinact_half | 7.6007360452 µmol/l | Parameter Identification-Parameter Identification-Value updated from 'Parameter Identification 1' on 2020-01-13 15:01 |
Transport Protein: OATP1B1-fitted
Molecule: OATP1B1
Parameters
| Name | Value | Value Origin |
|---|---|---|
| Transporter concentration | 1 µmol/l | |
| Vmax | 11.66 pmol/ml/min | Publication-In Vitro-PMID: 22990751 |
| Km | 0.735836485 µmol/l | Parameter Identification-Parameter Identification-Value updated from 'Parameter Identification 1' on 2020-01-13 15:01 |
| kcat | 1.350032201 1/min | Parameter Identification-Parameter Identification-Value updated from 'Parameter Identification 1' on 2020-01-13 15:01 |
Systemic Process: Total Hepatic Clearance-fitted
Species: Human
Parameters
| Name | Value | Value Origin |
|---|---|---|
| Fraction unbound (experiment) | 0.305 | |
| Lipophilicity (experiment) | 2.48 Log Units | |
| Plasma clearance | 0 ml/min/kg | |
| Specific clearance | 4.1462183378 1/min | Parameter Identification-Parameter Identification-Value updated from 'Parameter Identification 1' on 2020-01-13 15:01 |
Inhibition: P-gp-Eberl2007
Molecule: P-gp
Parameters
| Name | Value | Value Origin |
|---|---|---|
| Ki | 22.7 µmol/l | Publication-Eberl S, Renner B, Neubert A, Reisig M, Bachmakov I, König J, Dörje F, Mürdter TE, Ackermann A, Dormann H, Gassmann KG, Hahn EG, Zierhut S, Brune K, Fromm MF. Role of p-glycoprotein inhibition for drug interactions: evidence from in vitro and pharmacoepidemiological studies. Clin Pharmacokinet. 2007;46(12):1039-49. doi: 10.2165/00003088-200746120-00004. PMID: 18027988. |
Formulation: Erythromycin_Weibull_enteric-coated-pellets
Type: Weibull
Parameters
| Name | Value | Value Origin |
|---|---|---|
| Dissolution time (50% dissolved) | 1.7462743767 min | Parameter Identification-Parameter Identification-Value updated from 'Parameter Identification 1' on 2020-01-13 15:01 |
| Lag time | 54.3490442506 min | Parameter Identification-Parameter Identification-Value updated from 'Parameter Identification 1' on 2020-01-13 15:01 |
| Dissolution shape | 1.0564916105 | Parameter Identification-Parameter Identification-Value updated from 'Parameter Identification 1' on 2020-01-13 15:01 |
| Use as suspension | Yes |
Formulation: Erythromycin_Weibull_enteric-coated-tablet
Type: Weibull
Parameters
| Name | Value | Value Origin |
|---|---|---|
| Dissolution time (50% dissolved) | 79.6337524677 min | Parameter Identification-Parameter Identification-Value updated from 'Parameter Identification 1' on 2020-01-13 15:01 |
| Lag time | 78.7967495765 min | Parameter Identification-Parameter Identification-Value updated from 'Parameter Identification 1' on 2020-01-13 15:01 |
| Dissolution shape | 1.0838799888 | Parameter Identification-Parameter Identification-Value updated from 'Parameter Identification 1' on 2020-01-13 15:01 |
| Use as suspension | Yes |
Formulation: Erythromycin_Weibull_filmtablet
Type: Weibull
Parameters
| Name | Value | Value Origin |
|---|---|---|
| Dissolution time (50% dissolved) | 1.7038947098 min | Parameter Identification-Parameter Identification-Value updated from 'Parameter Identification 1' on 2020-01-13 15:01 |
| Lag time | 0 min | Other-Assumption |
| Dissolution shape | 1.0960212213 | Parameter Identification-Parameter Identification-Value updated from 'Parameter Identification 1' on 2020-01-13 15:01 |
| Use as suspension | Yes |
3.2 Diagnostics Plots
Below you find the goodness-of-fit visual diagnostic plots for the PBPK model performance of all data used presented in Section 2.2.3.
The first plot shows simulated versus observed plasma concentration, the second weighted residuals versus time.
Table 3-1: GMFE for Goodness of fit plot for concentration in plasma
| Group | GMFE |
|---|---|
| IV | 1.57 |
| IV (model building) | 1.46 |
| PO enteric coated capsule, base pellets | 1.82 |
| PO enteric coated capsule, base pellets (model building) | 1.24 |
| PO enteric coated tablet, base (model building) | 1.35 |
| PO film-coated tablet, base | 1.90 |
| PO film-coated tablet, stearate | 1.78 |
| PO film-coated tablet, stearate (model building) | 1.38 |
| All | 1.58 |
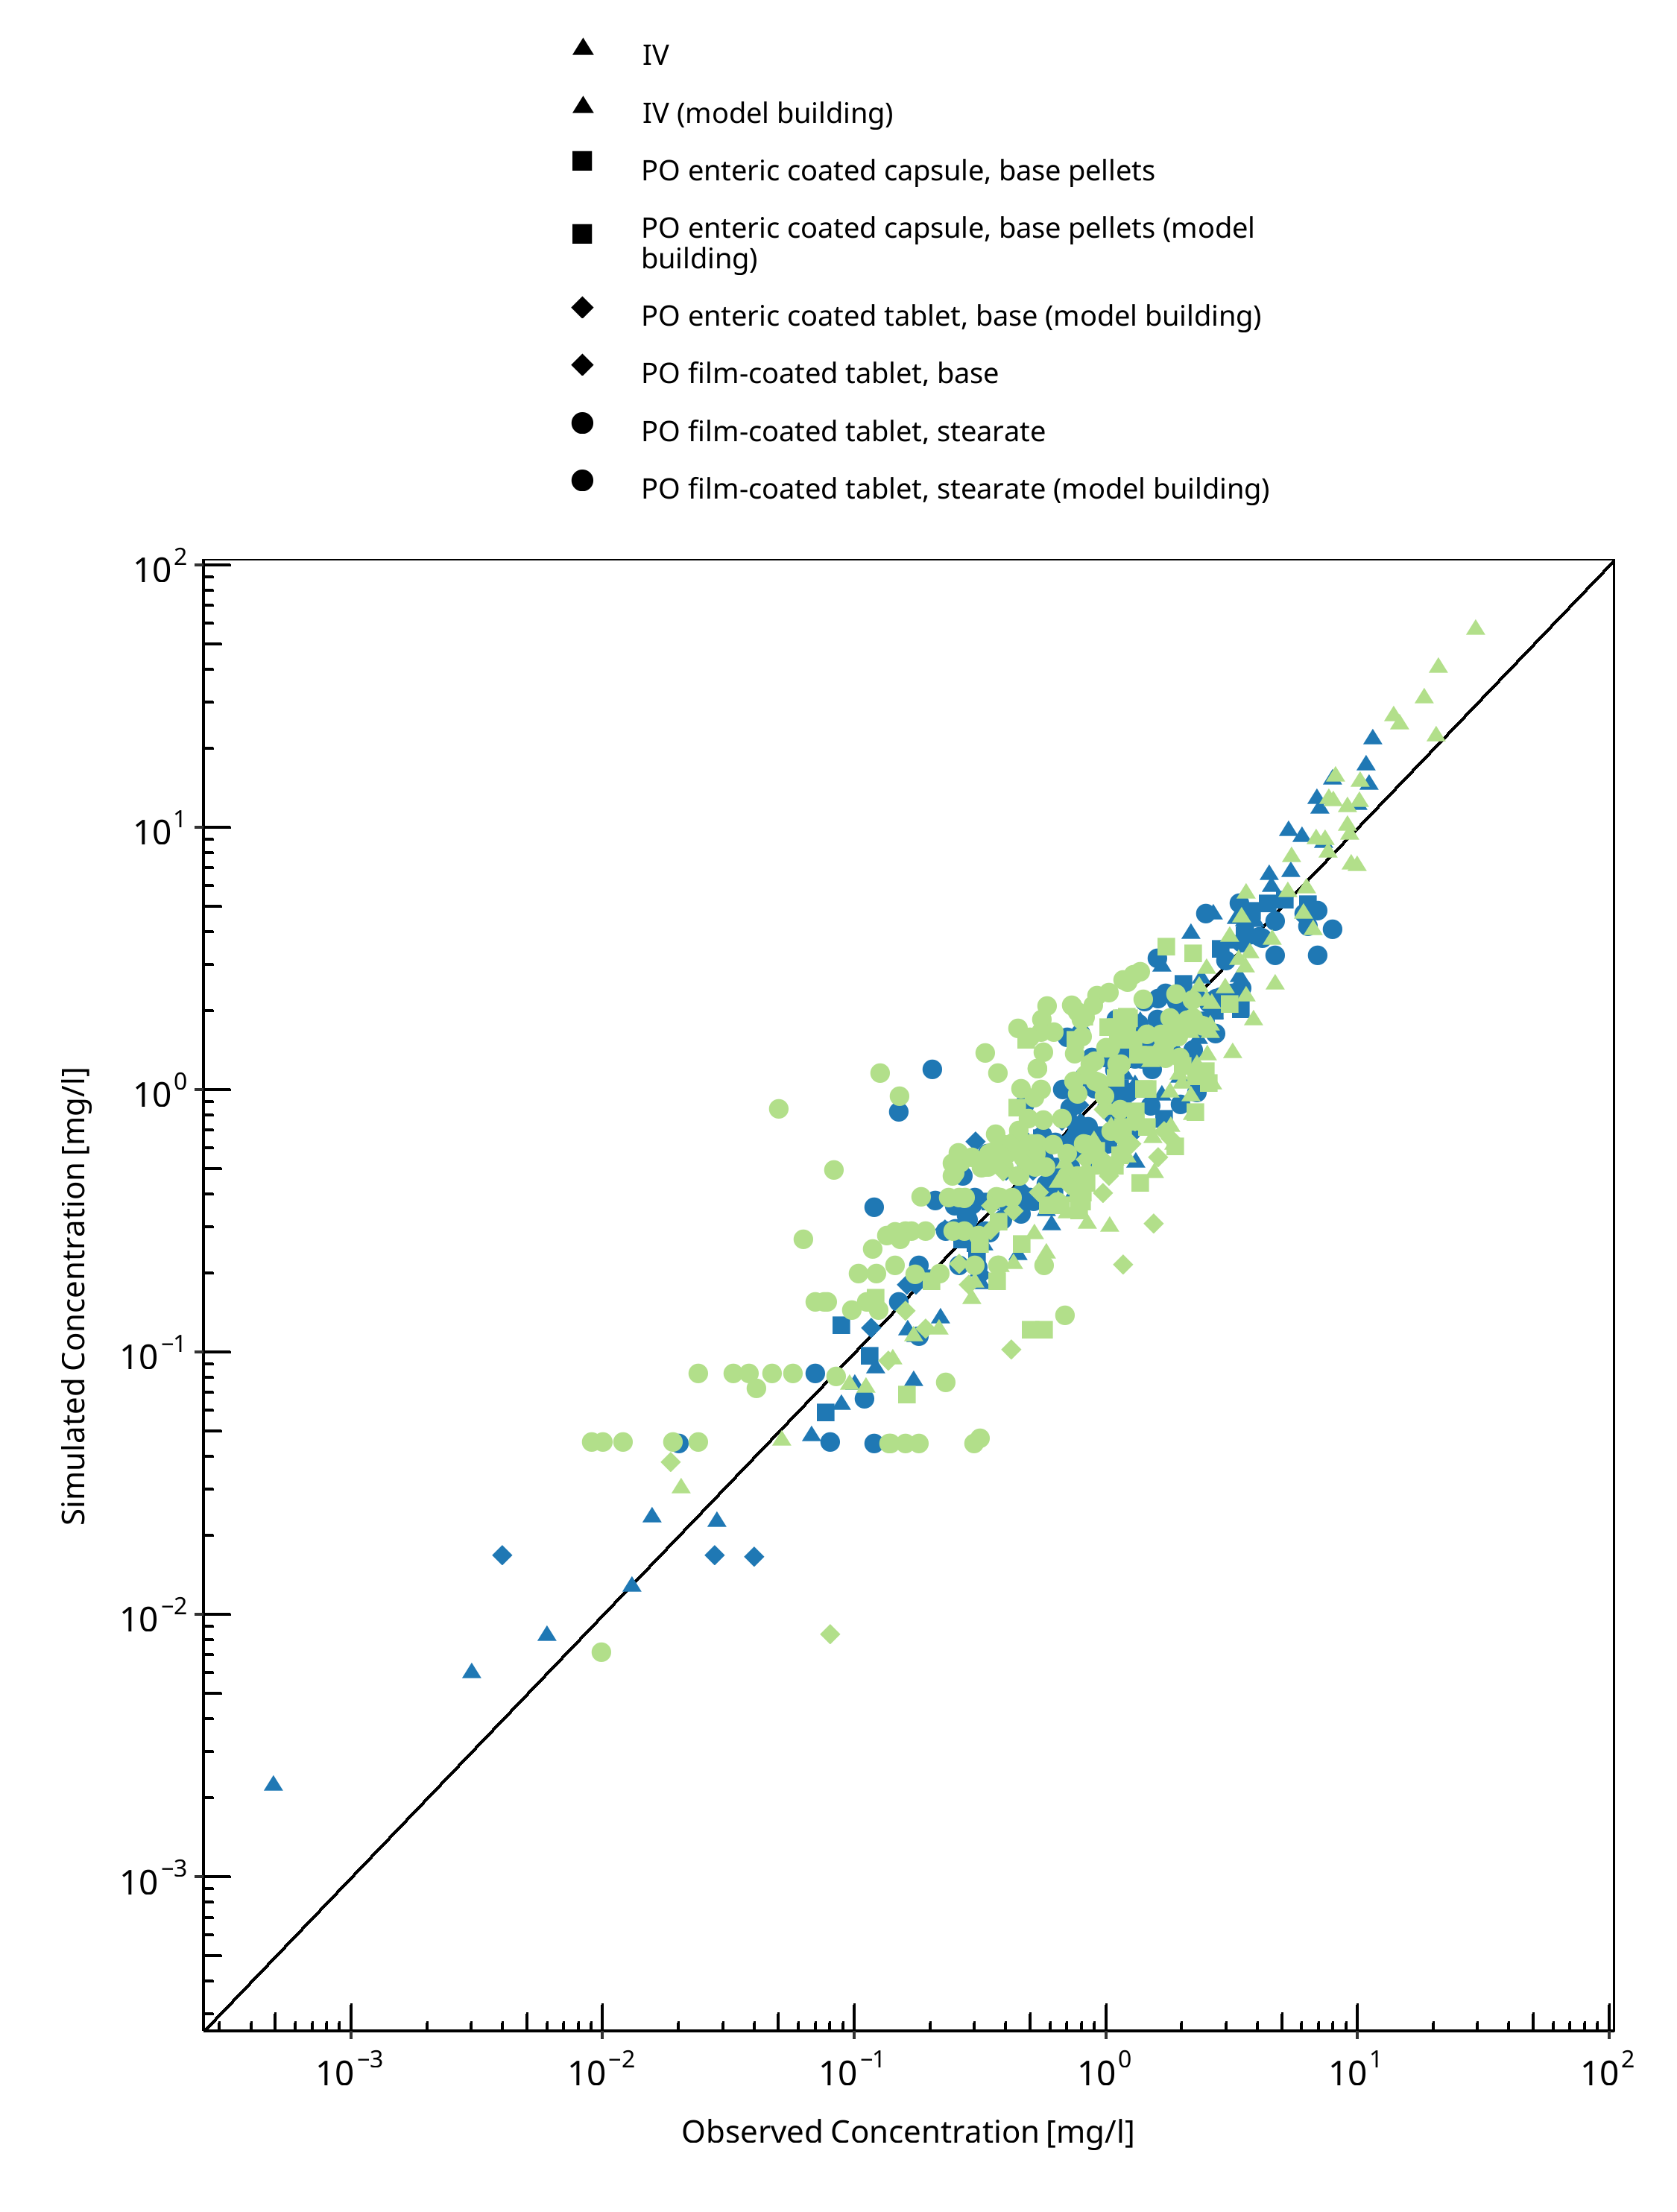
Figure 3-1: Goodness of fit plot for concentration in plasma
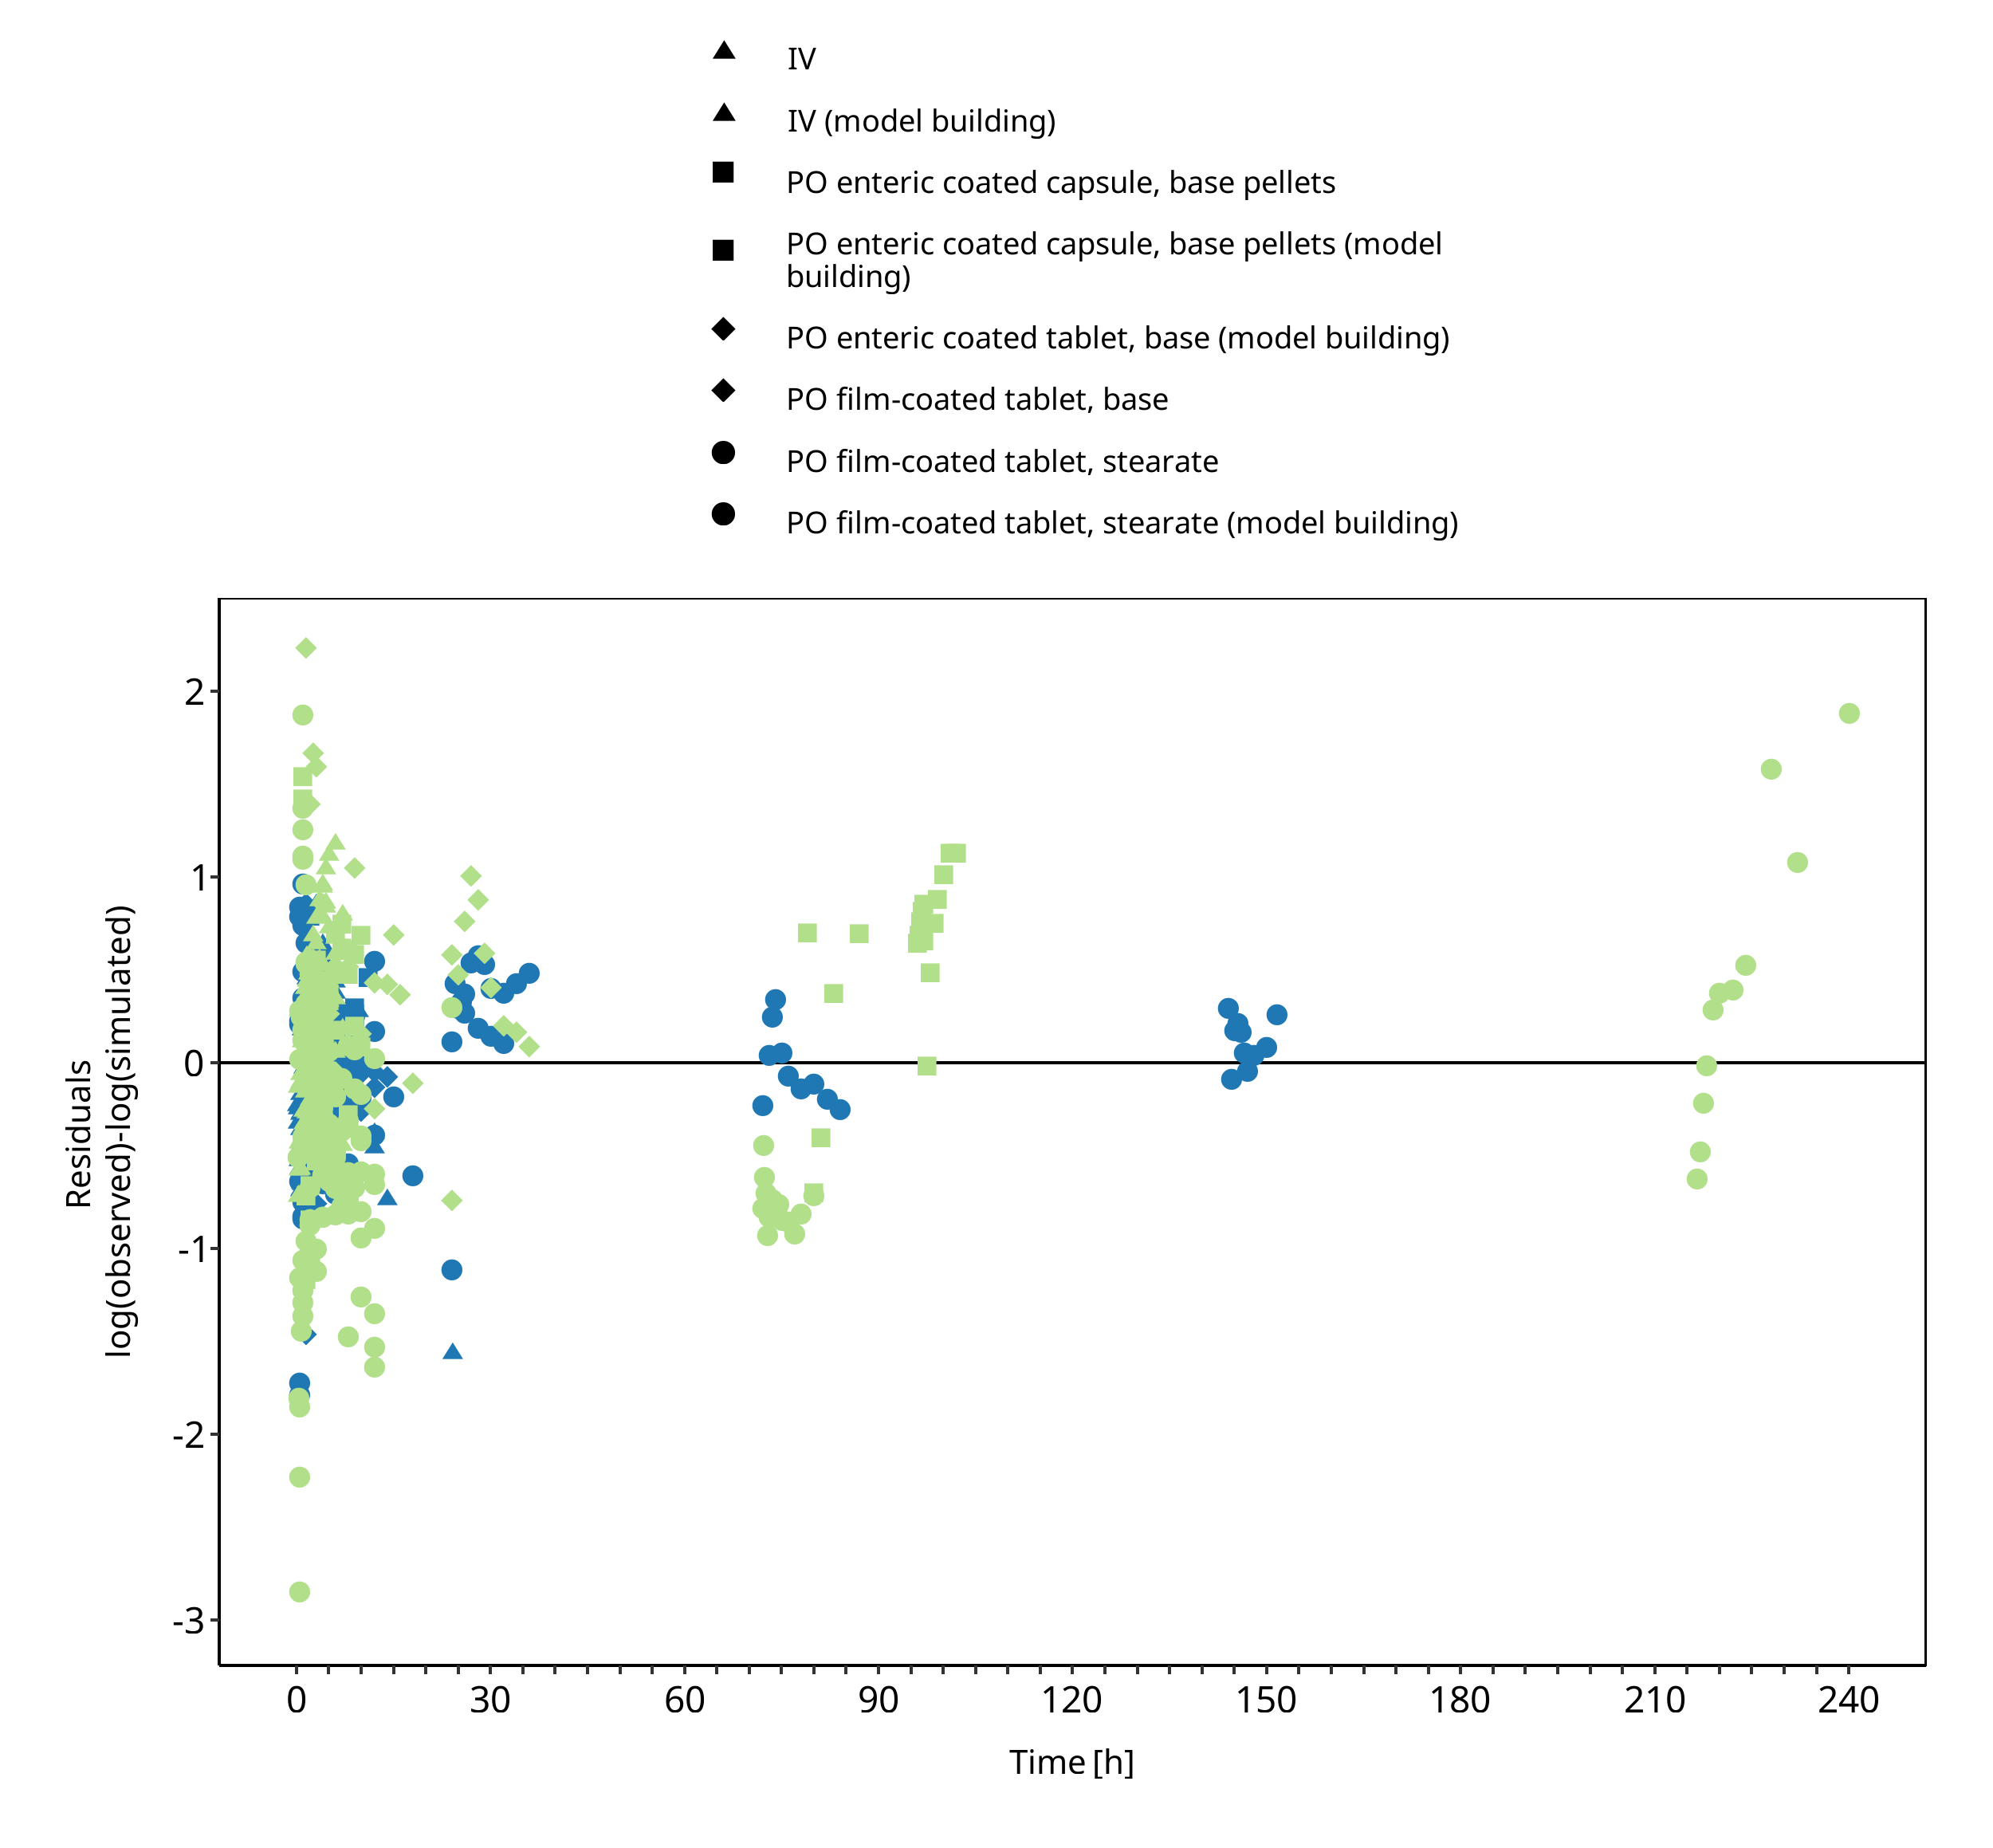
Figure 3-2: Goodness of fit plot for concentration in plasma
3.3 Concentration-Time Profiles
Simulated versus observed concentration-time profiles of all data listed in Section 2.2.3 are presented below.
3.3.1 Model Building
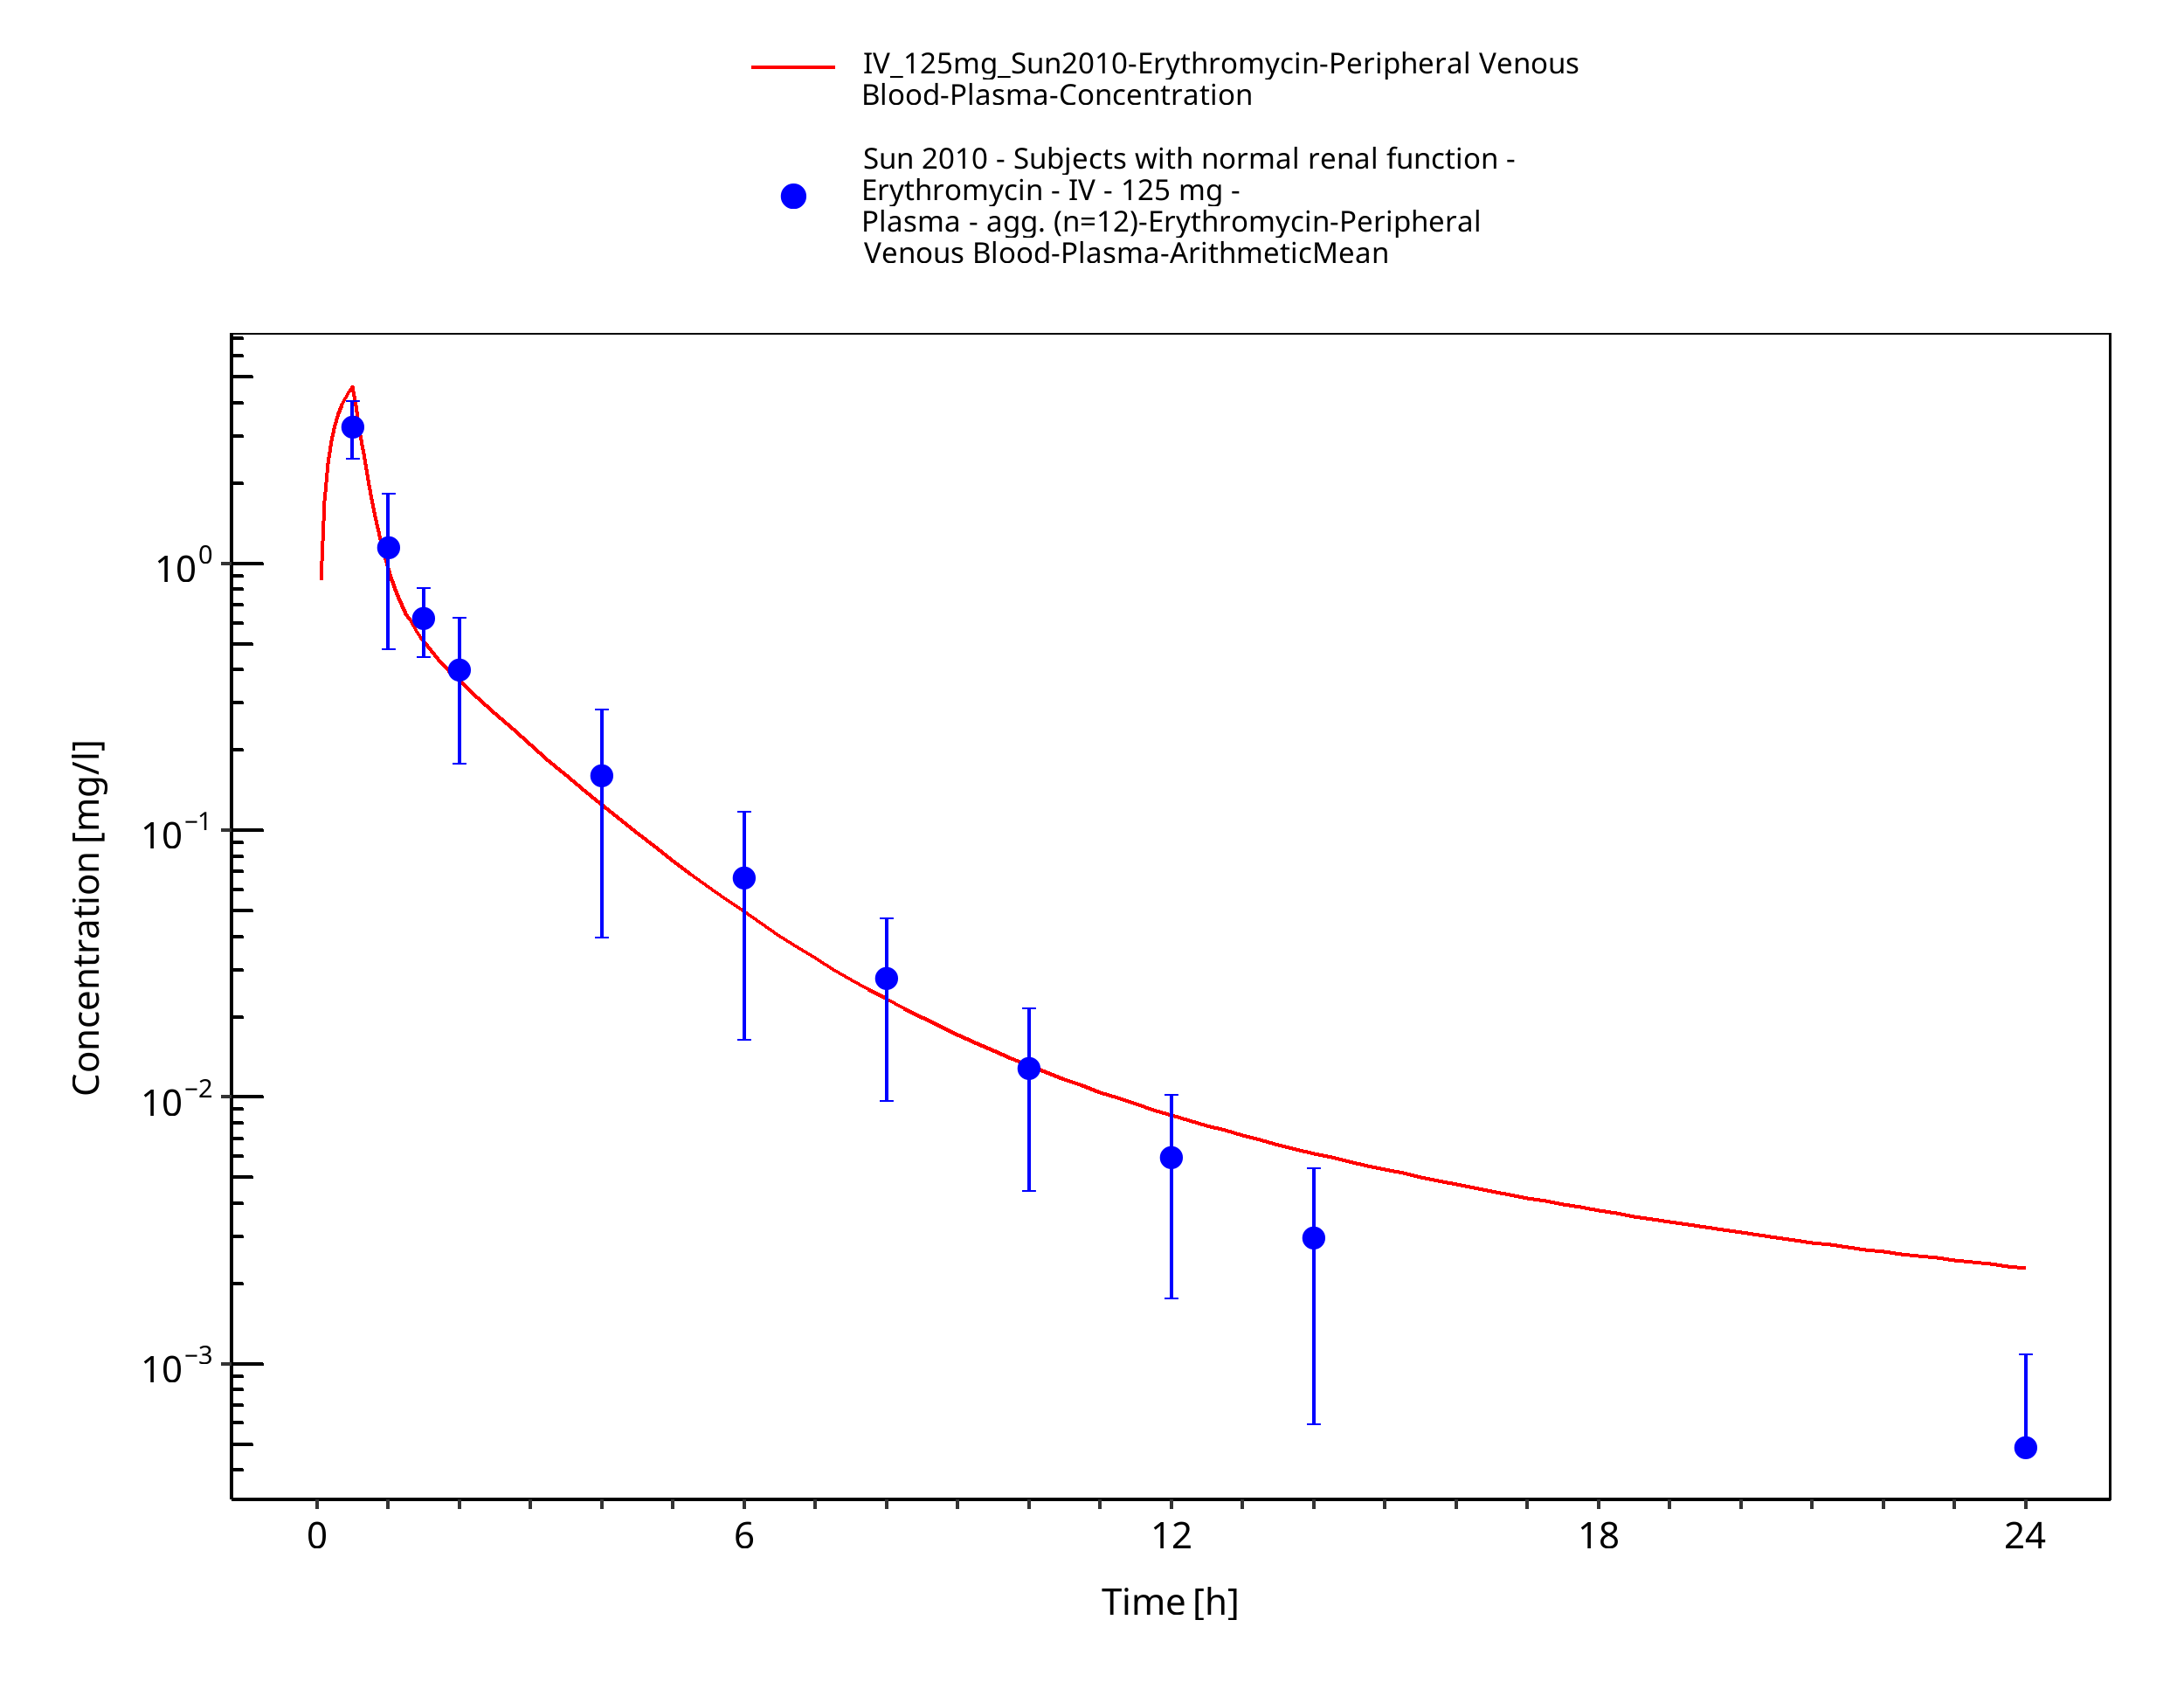
Figure 3-3: Time Profile Analysis
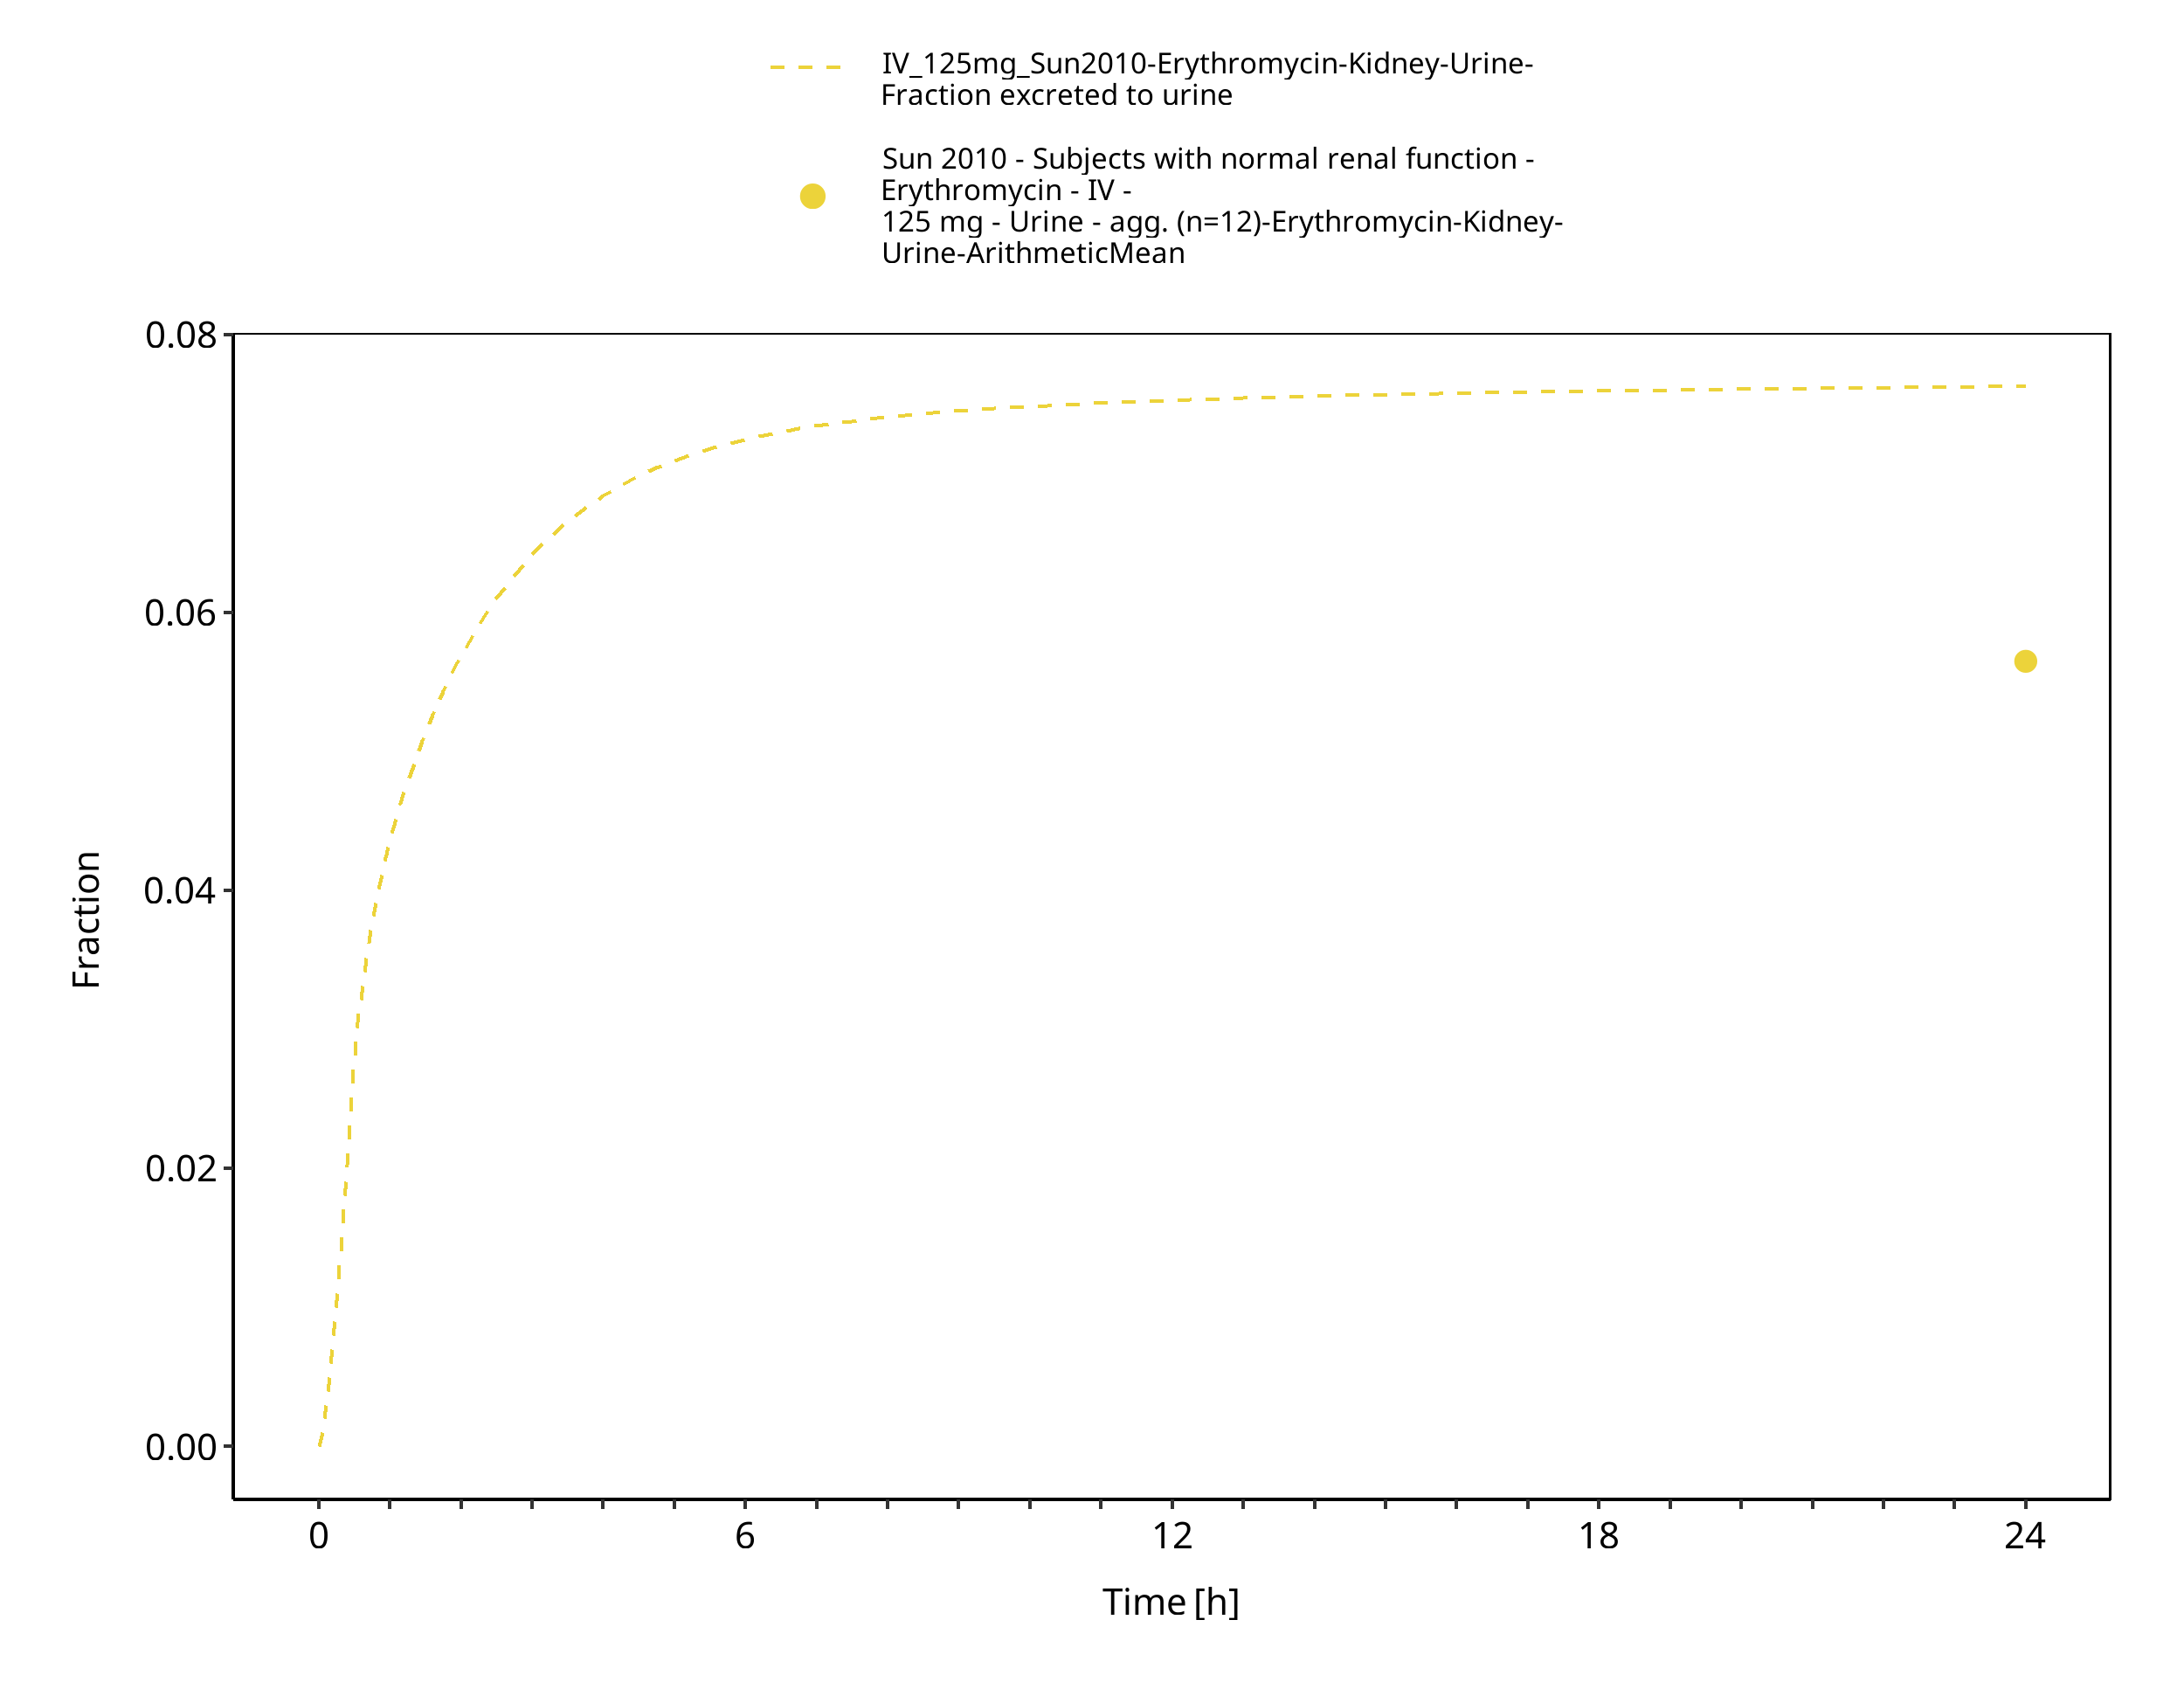
Figure 3-4: Time Profile Analysis 1
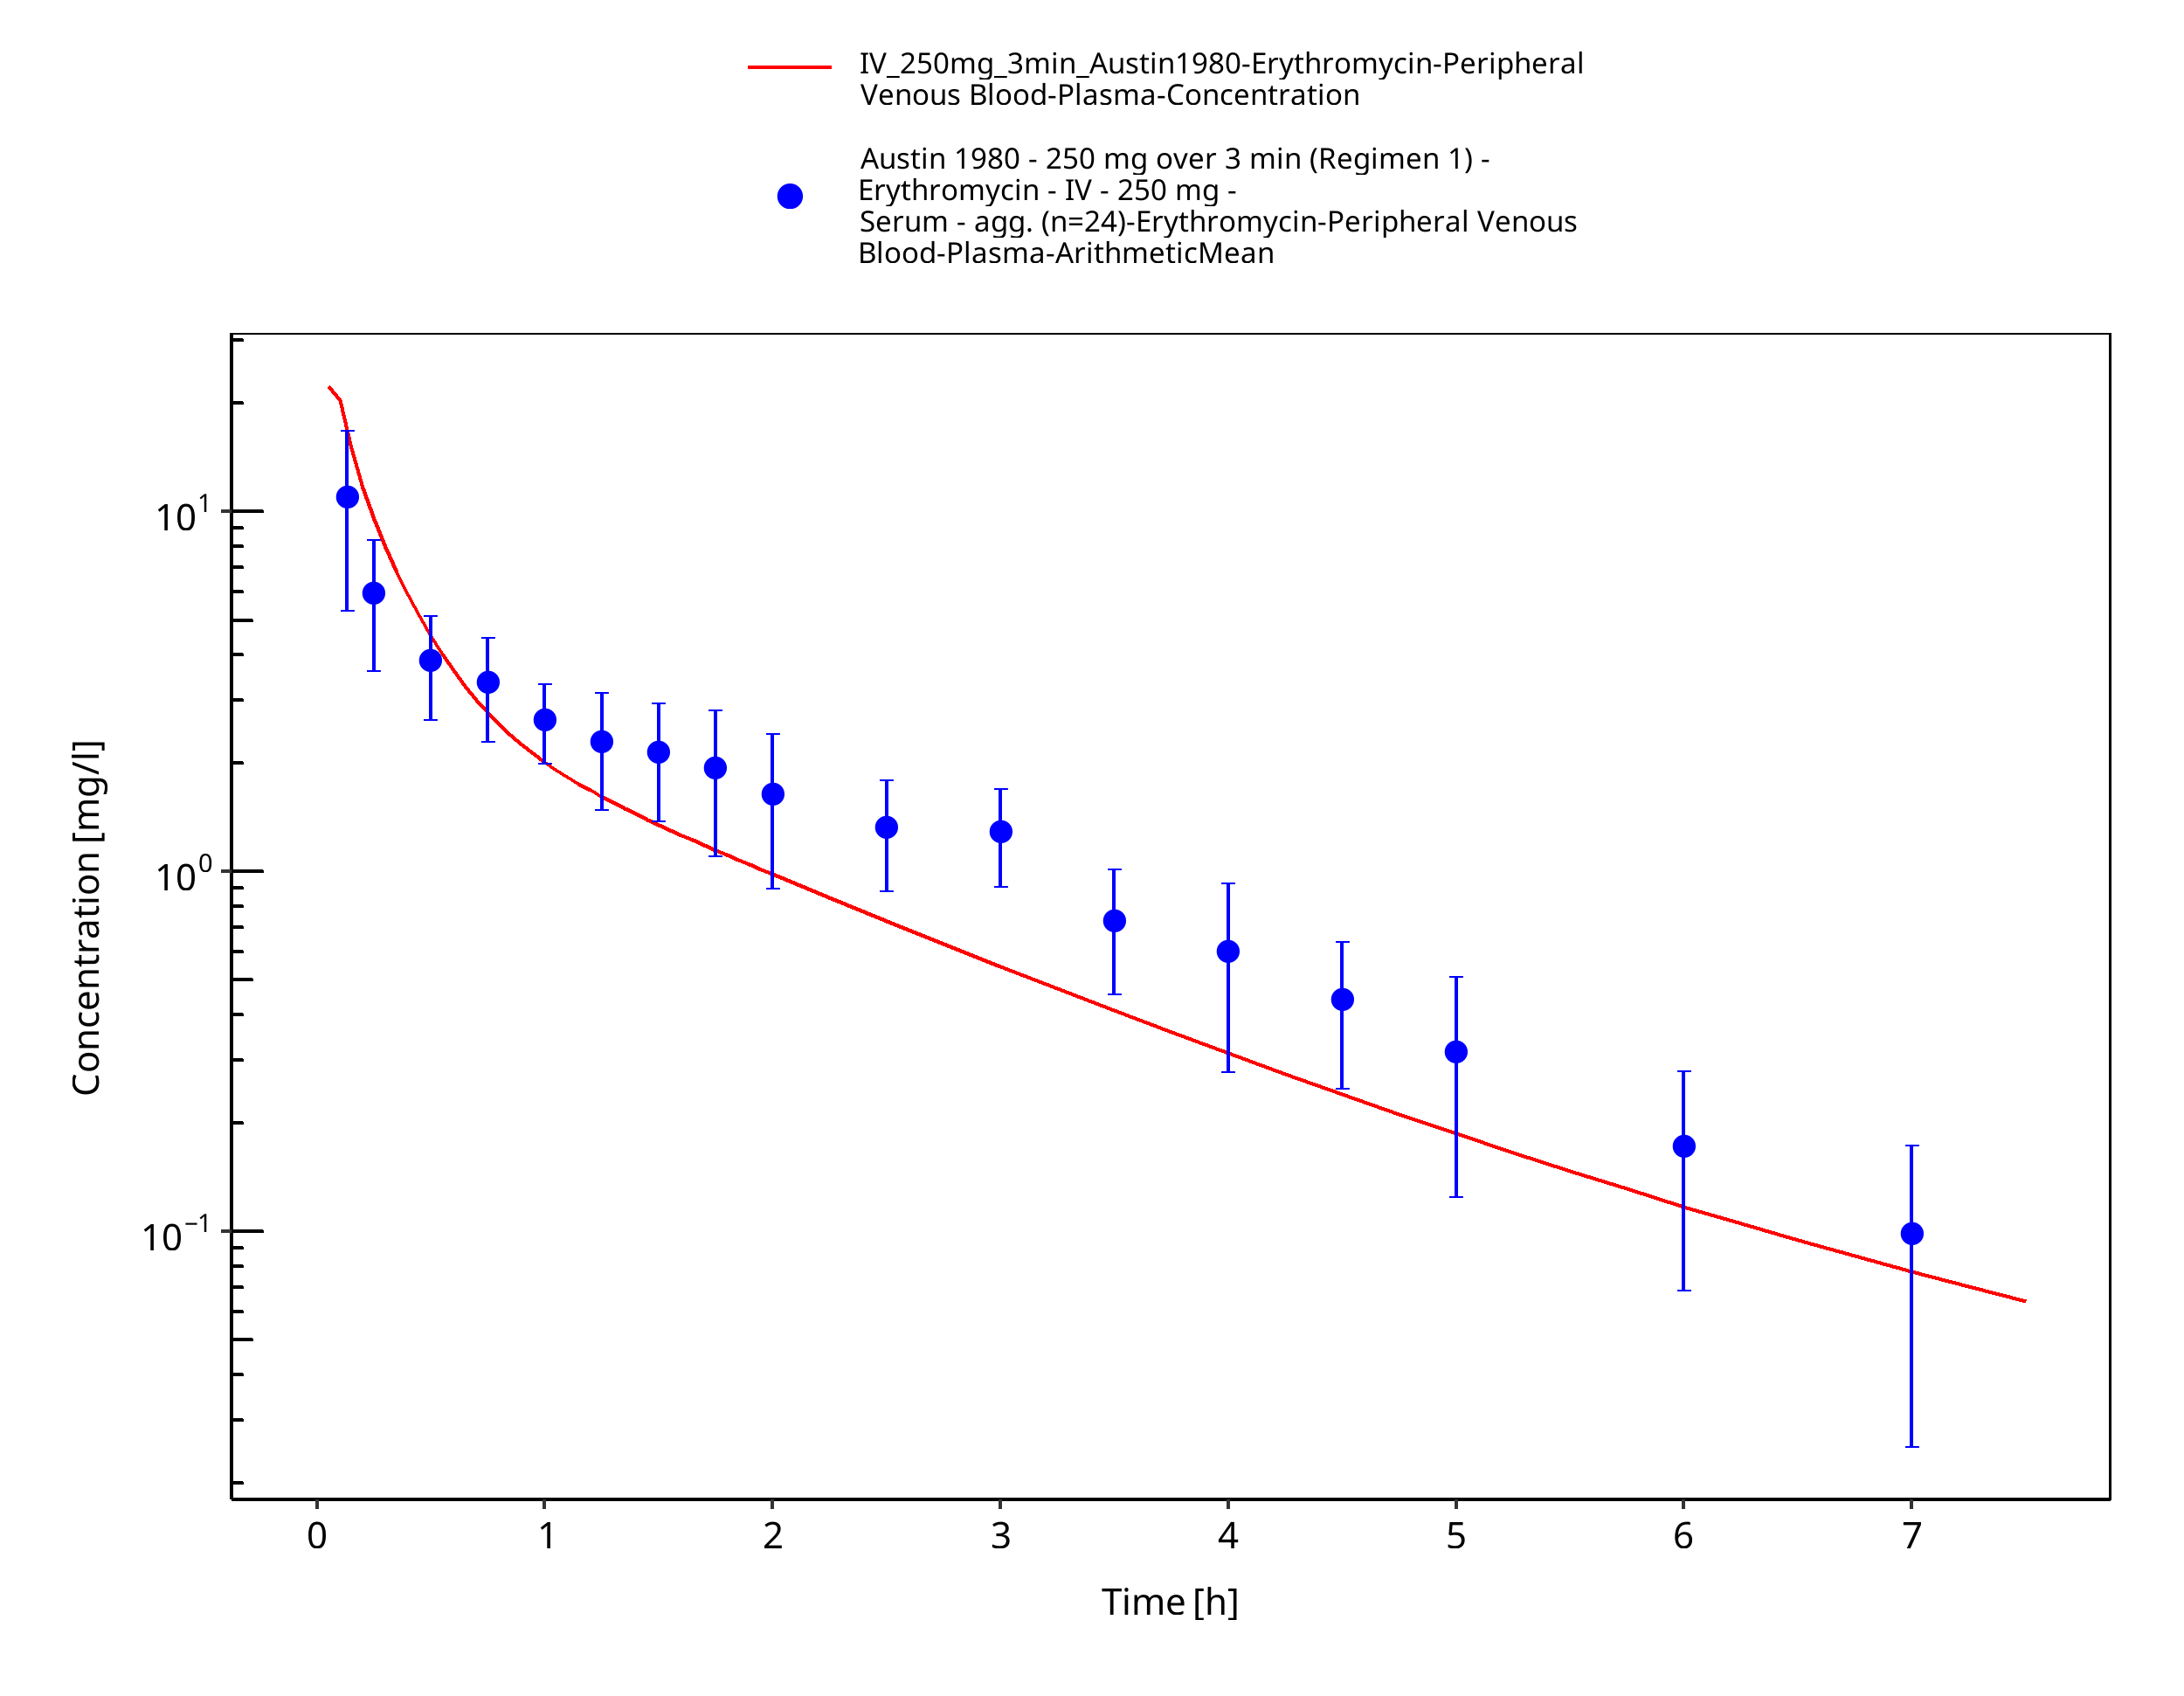
Figure 3-5: Time Profile Analysis
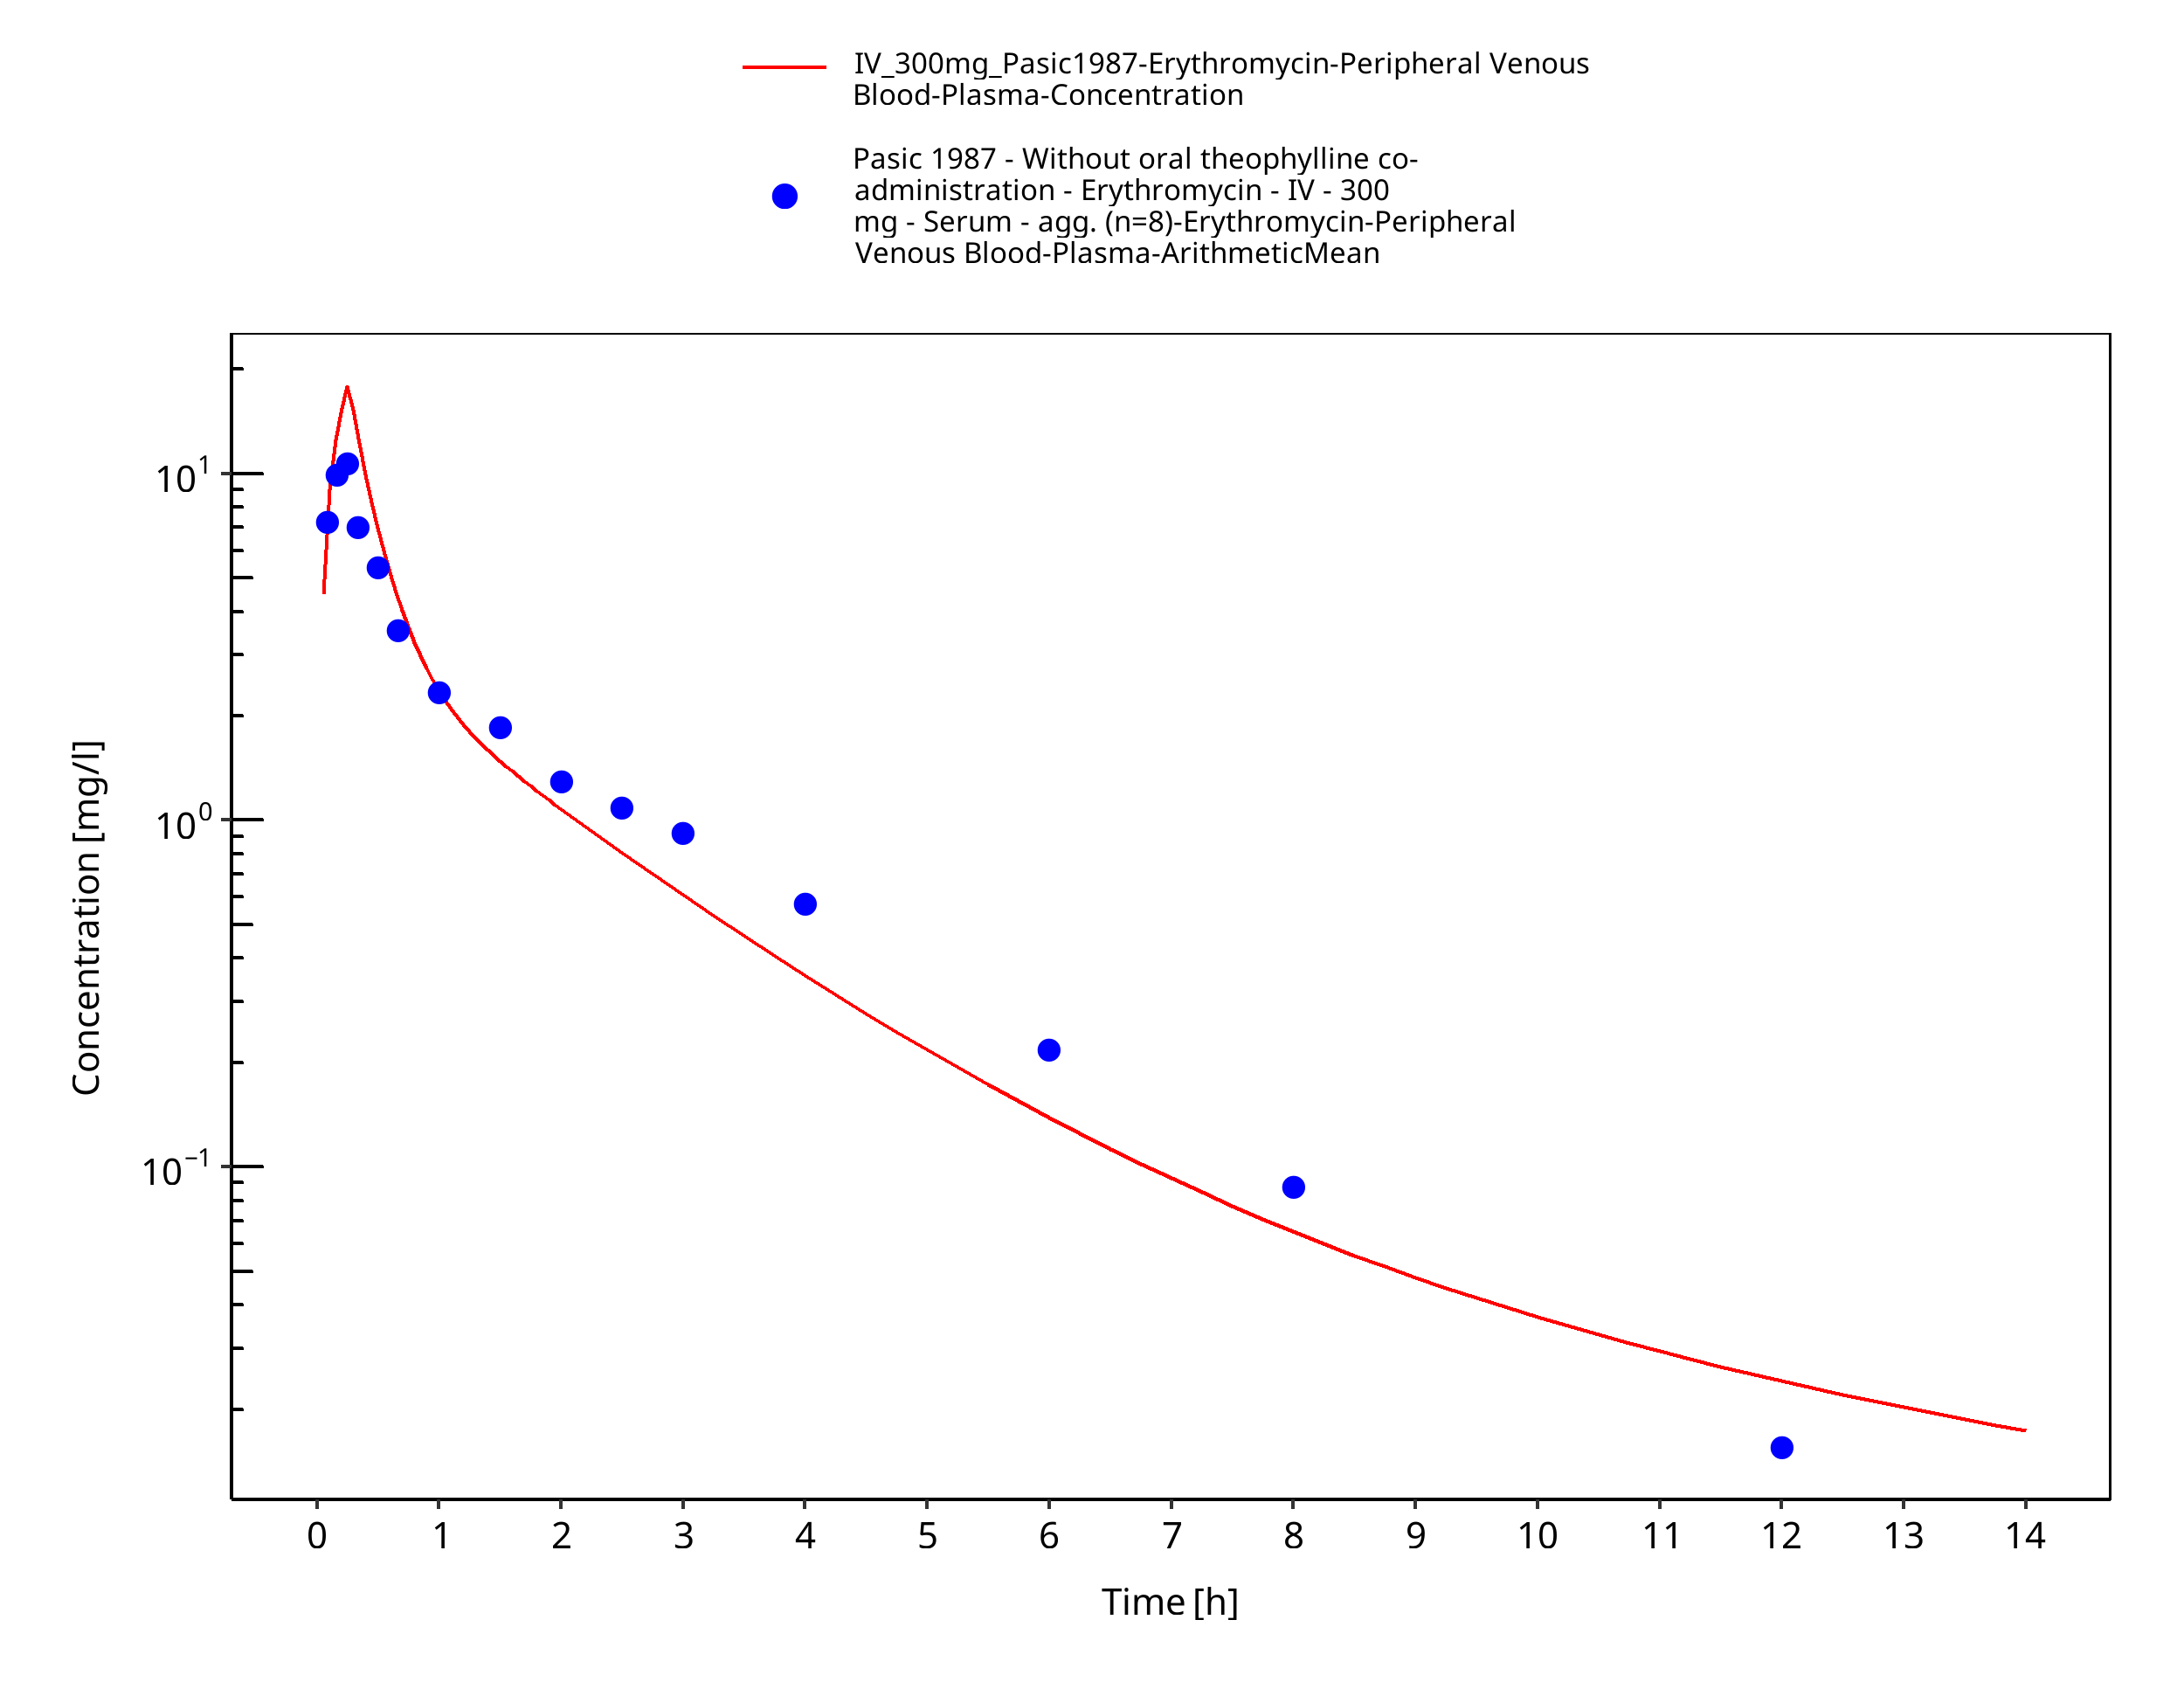
Figure 3-6: Time Profile Analysis
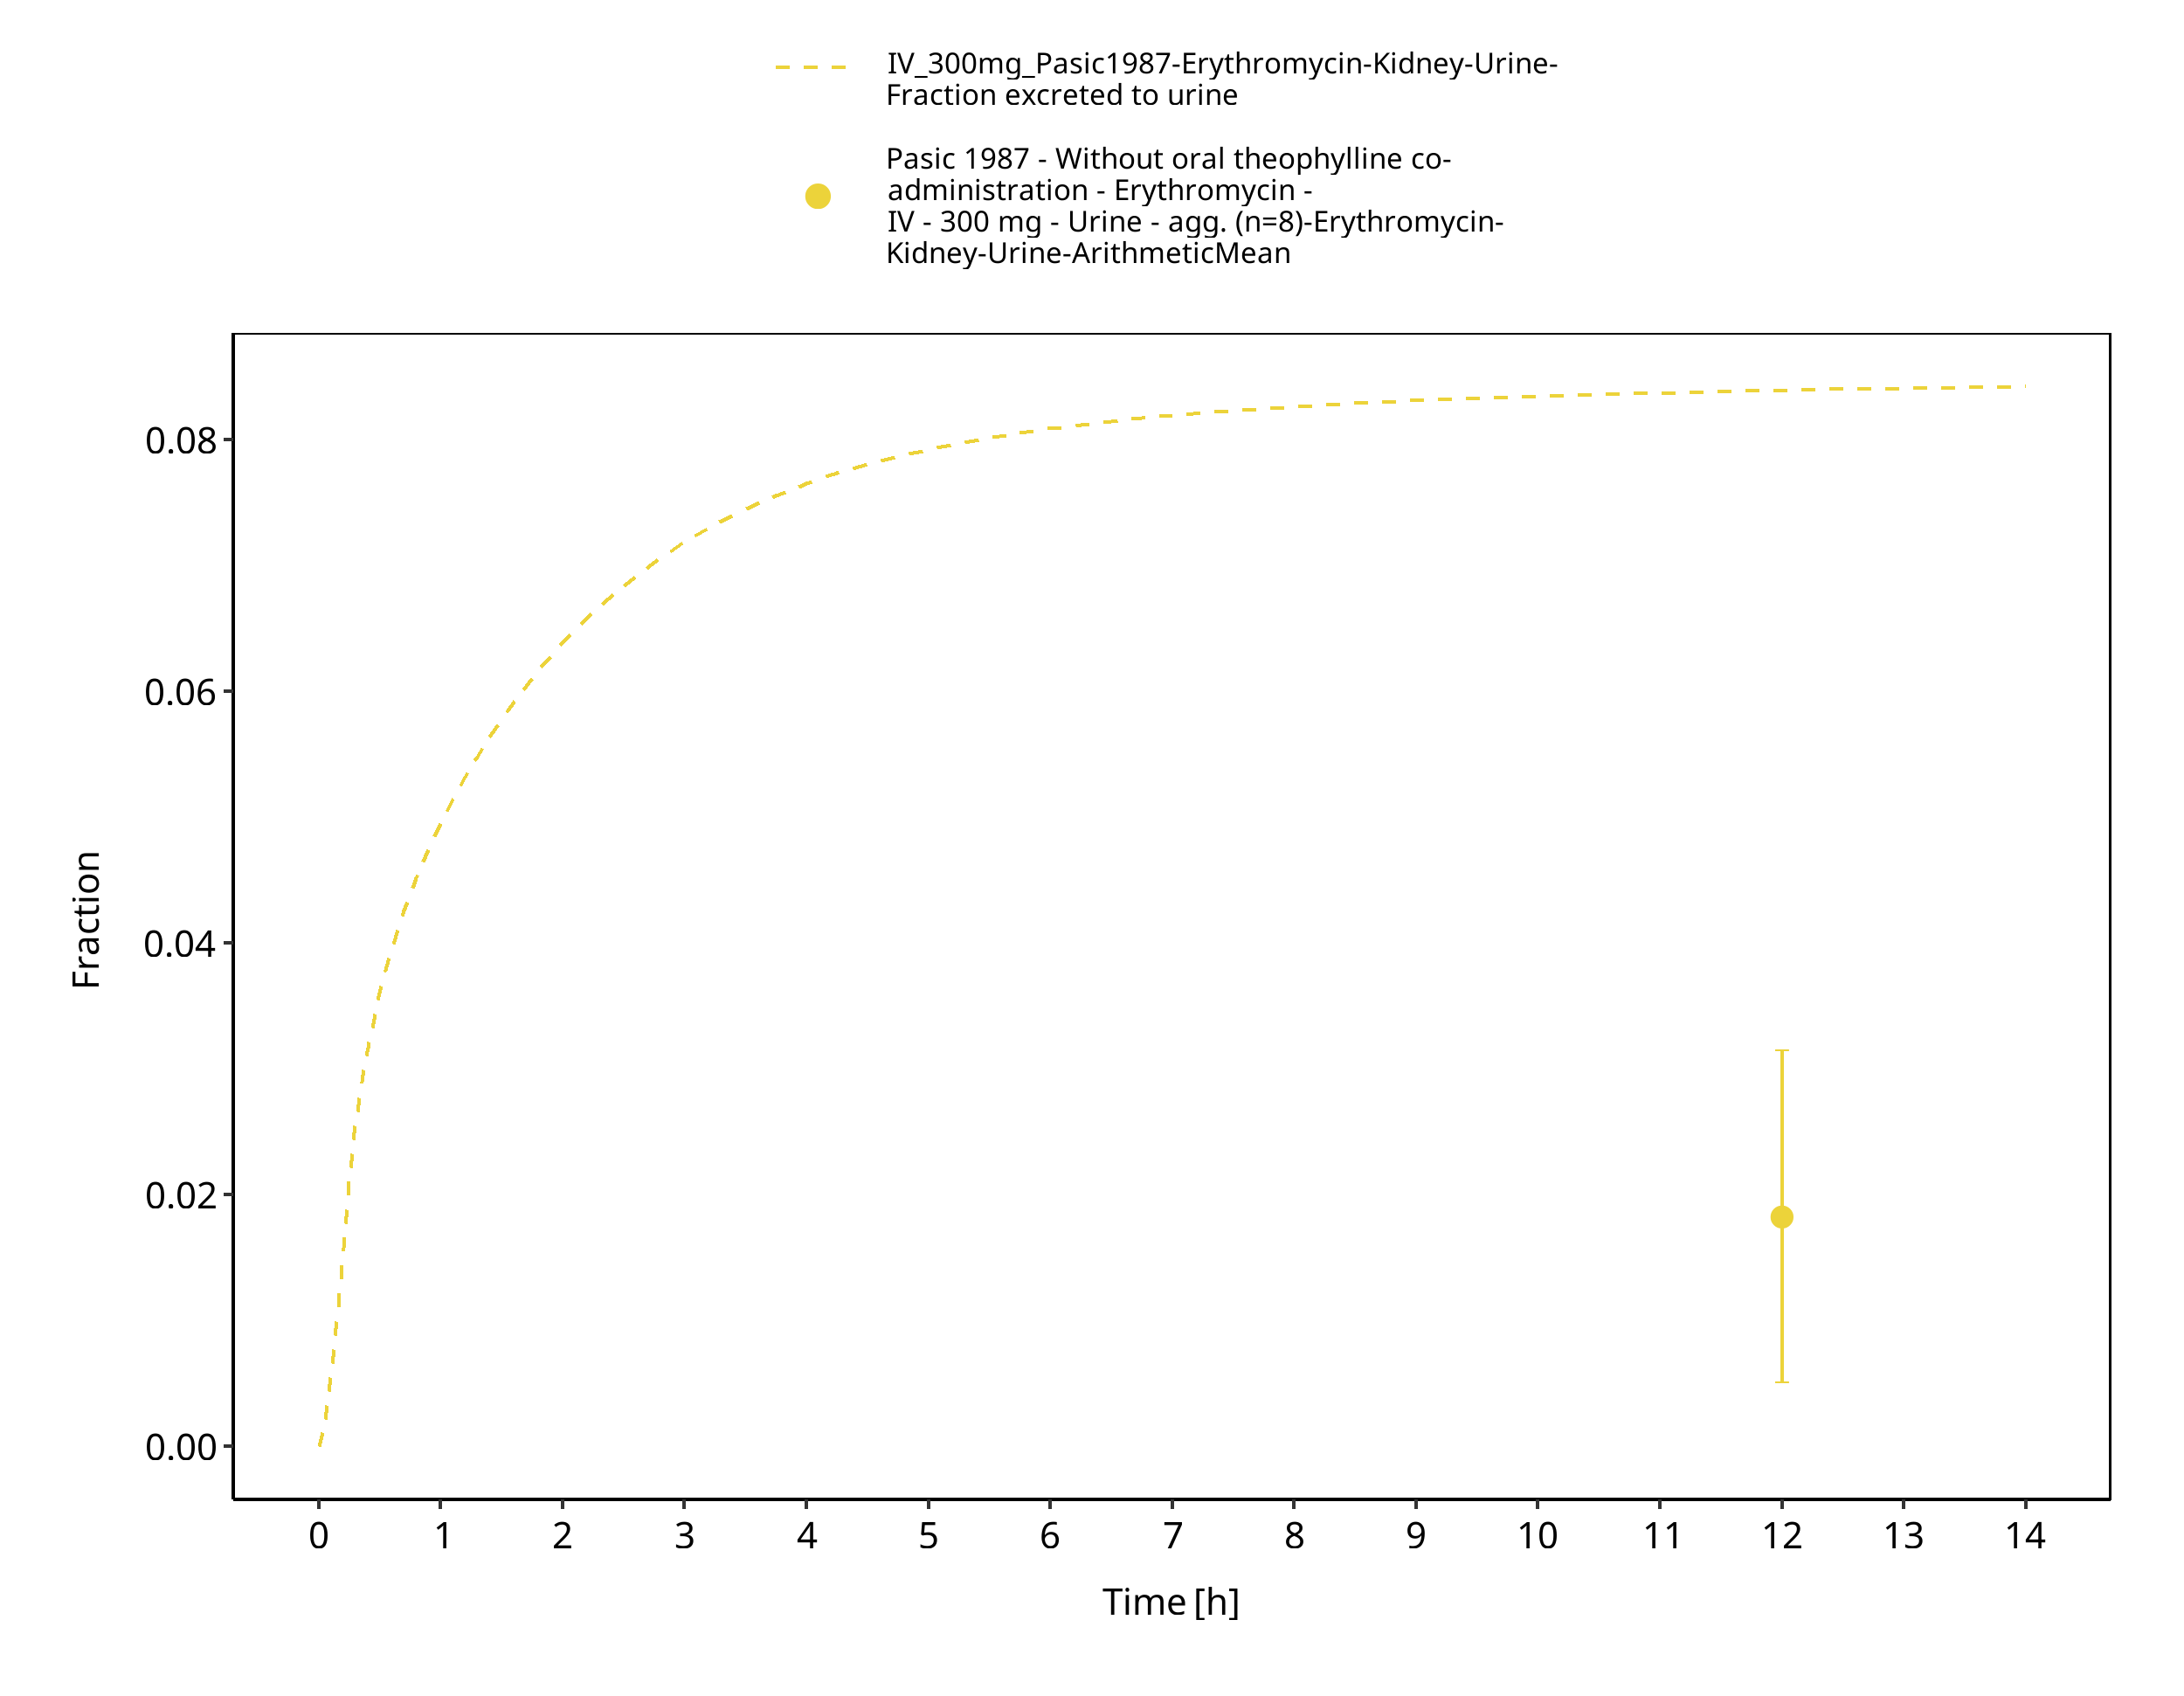
Figure 3-7: Time Profile Analysis 1
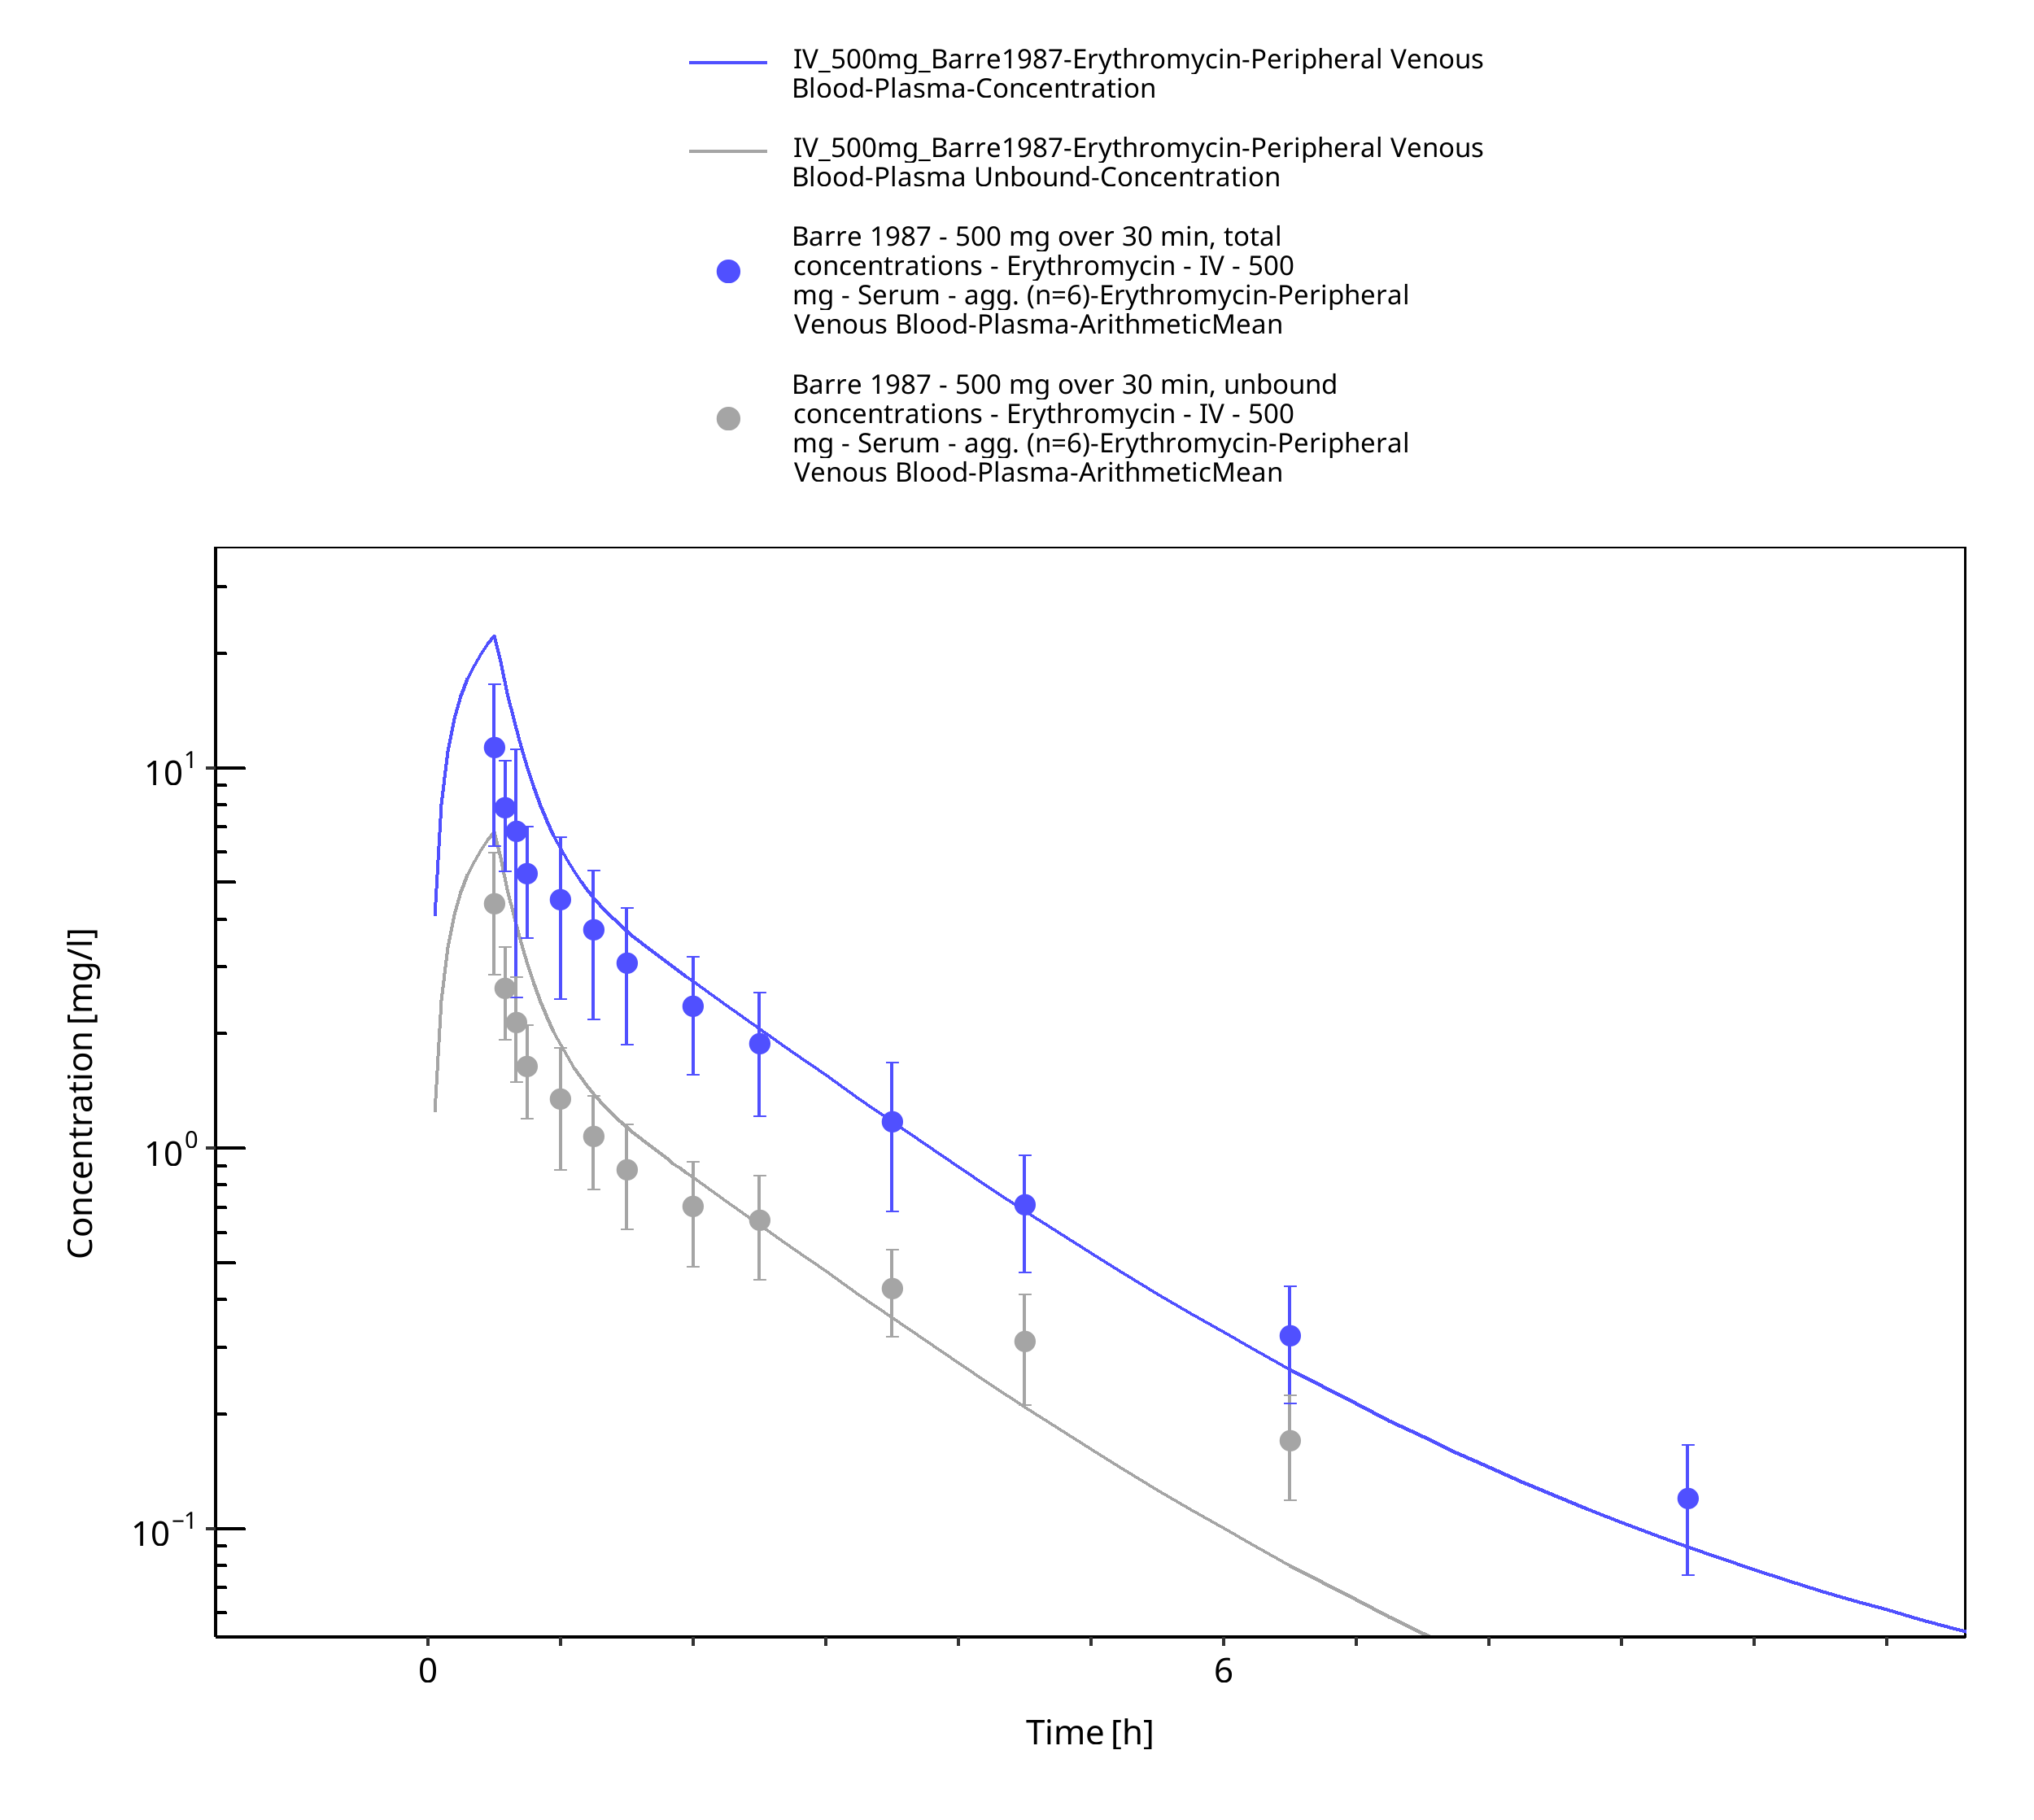
Figure 3-8: Time Profile Analysis
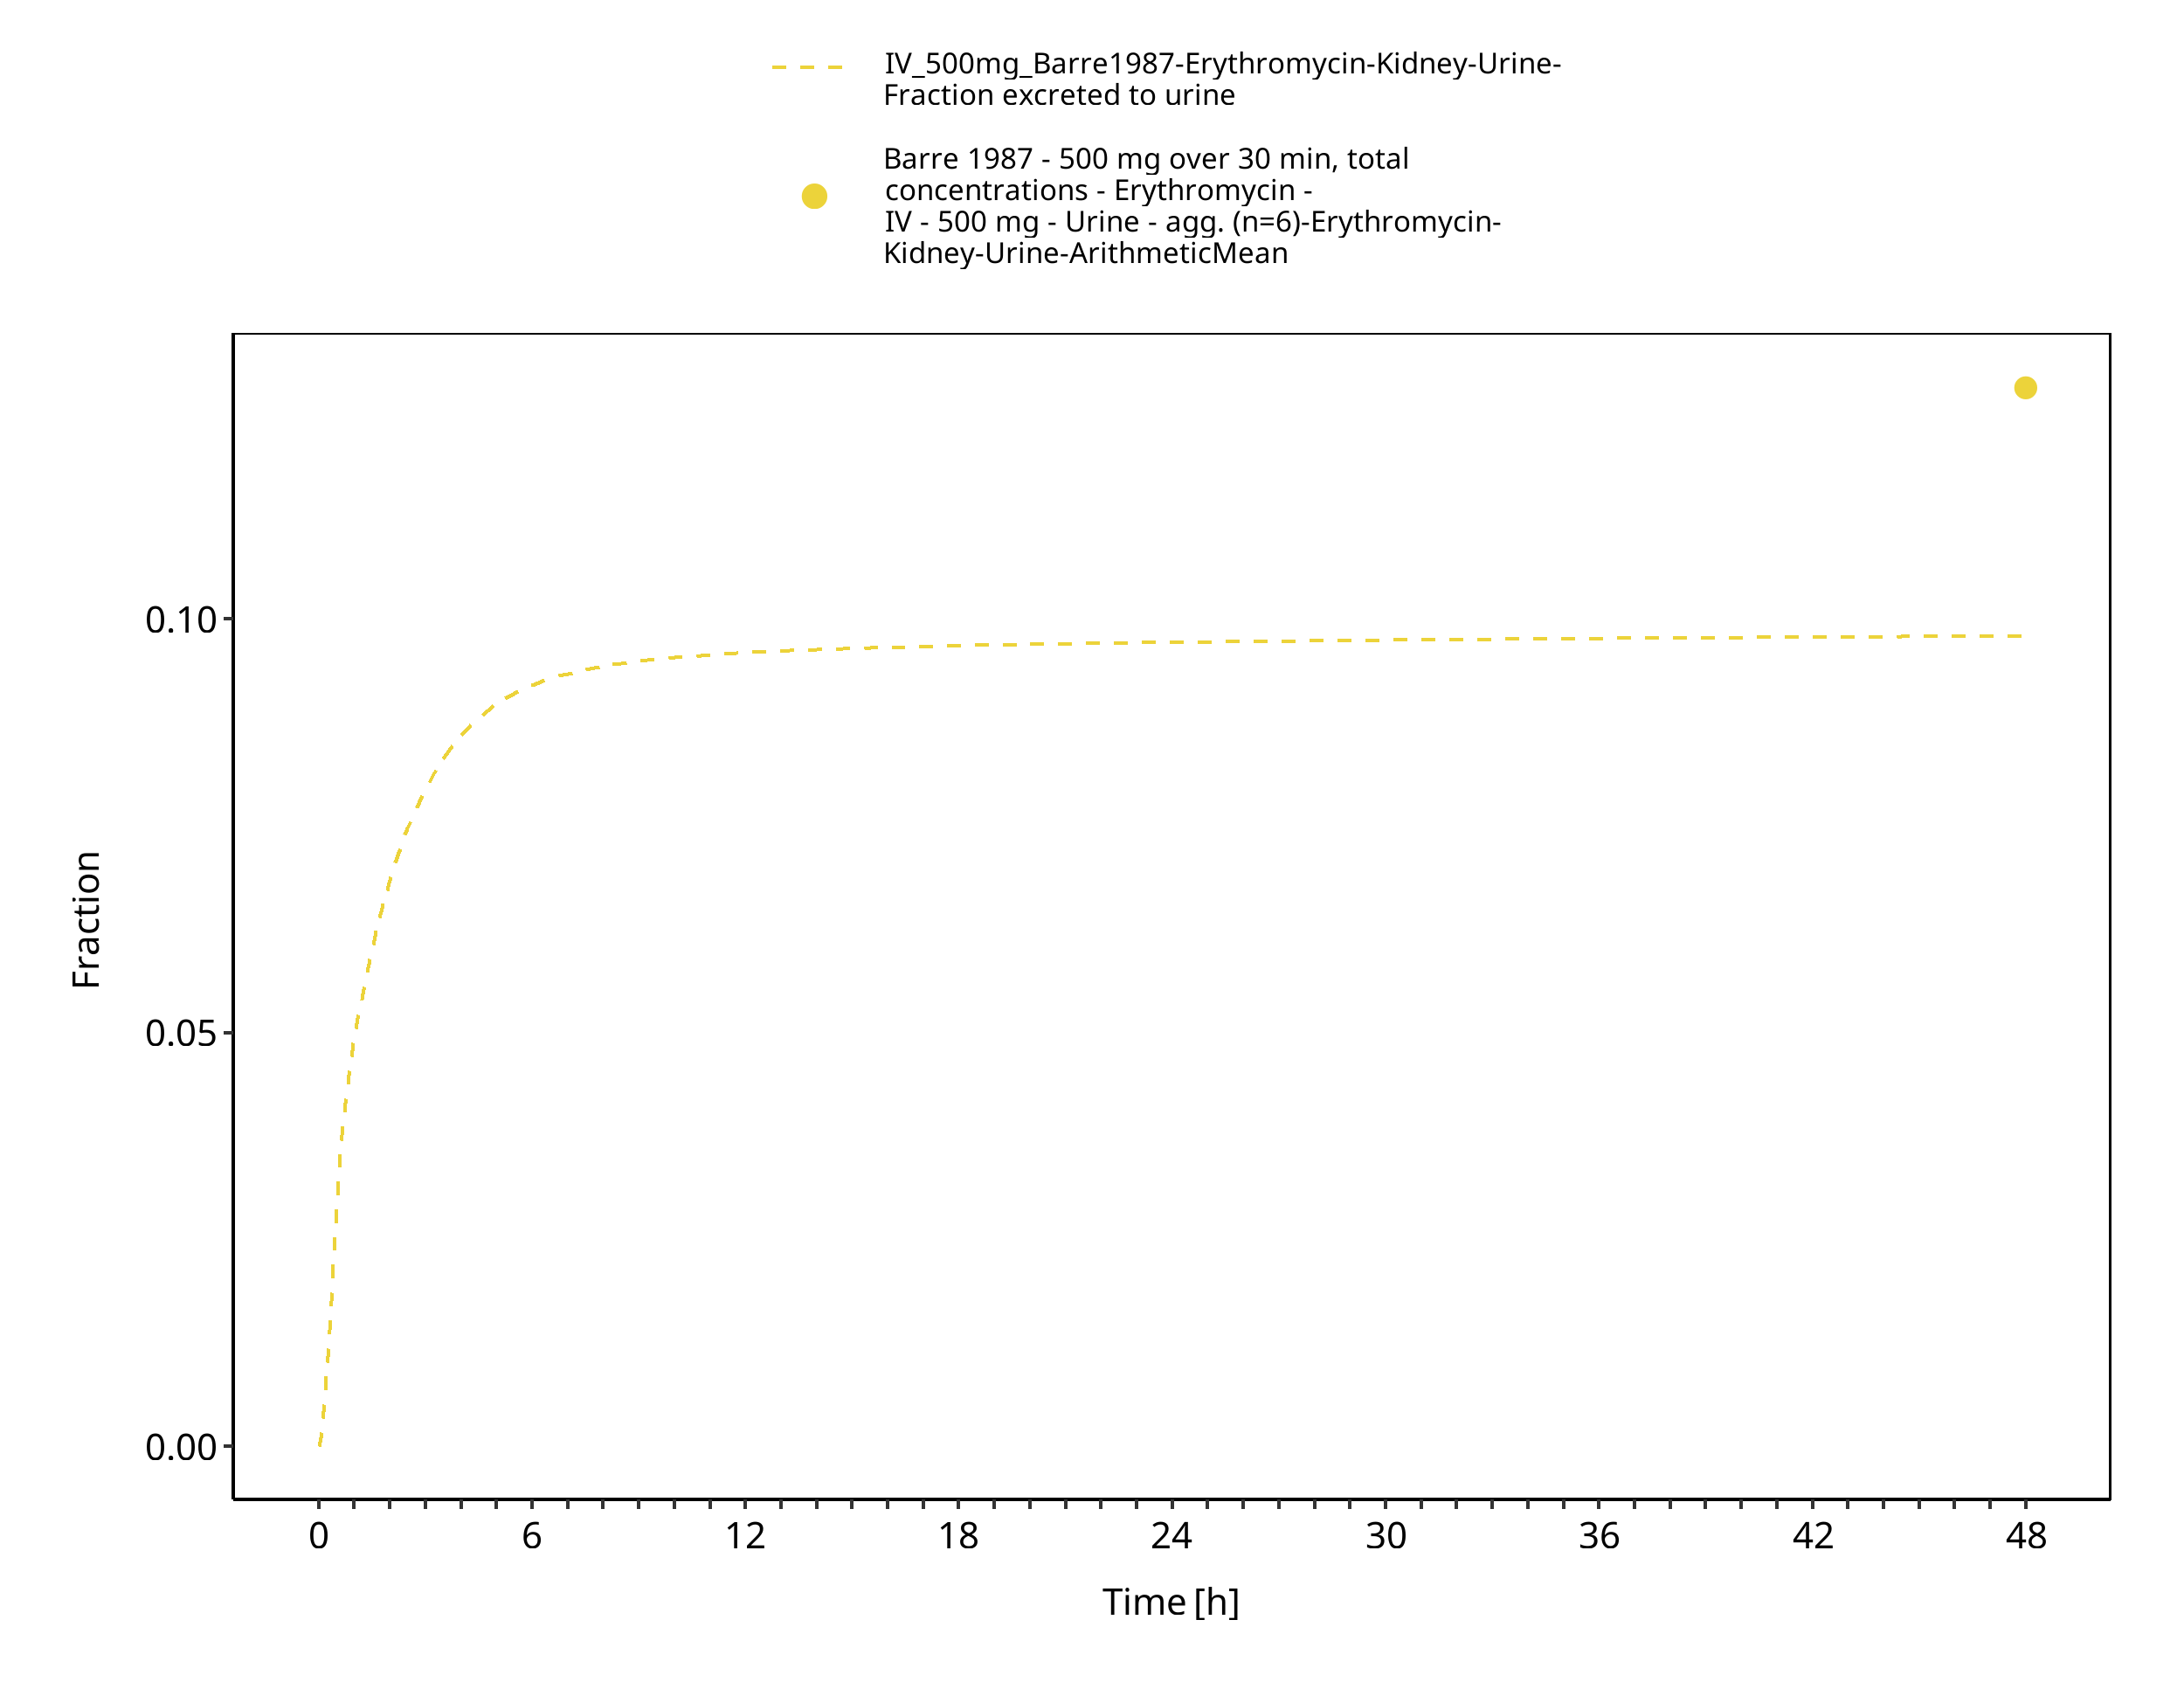
Figure 3-9: Time Profile Analysis 1
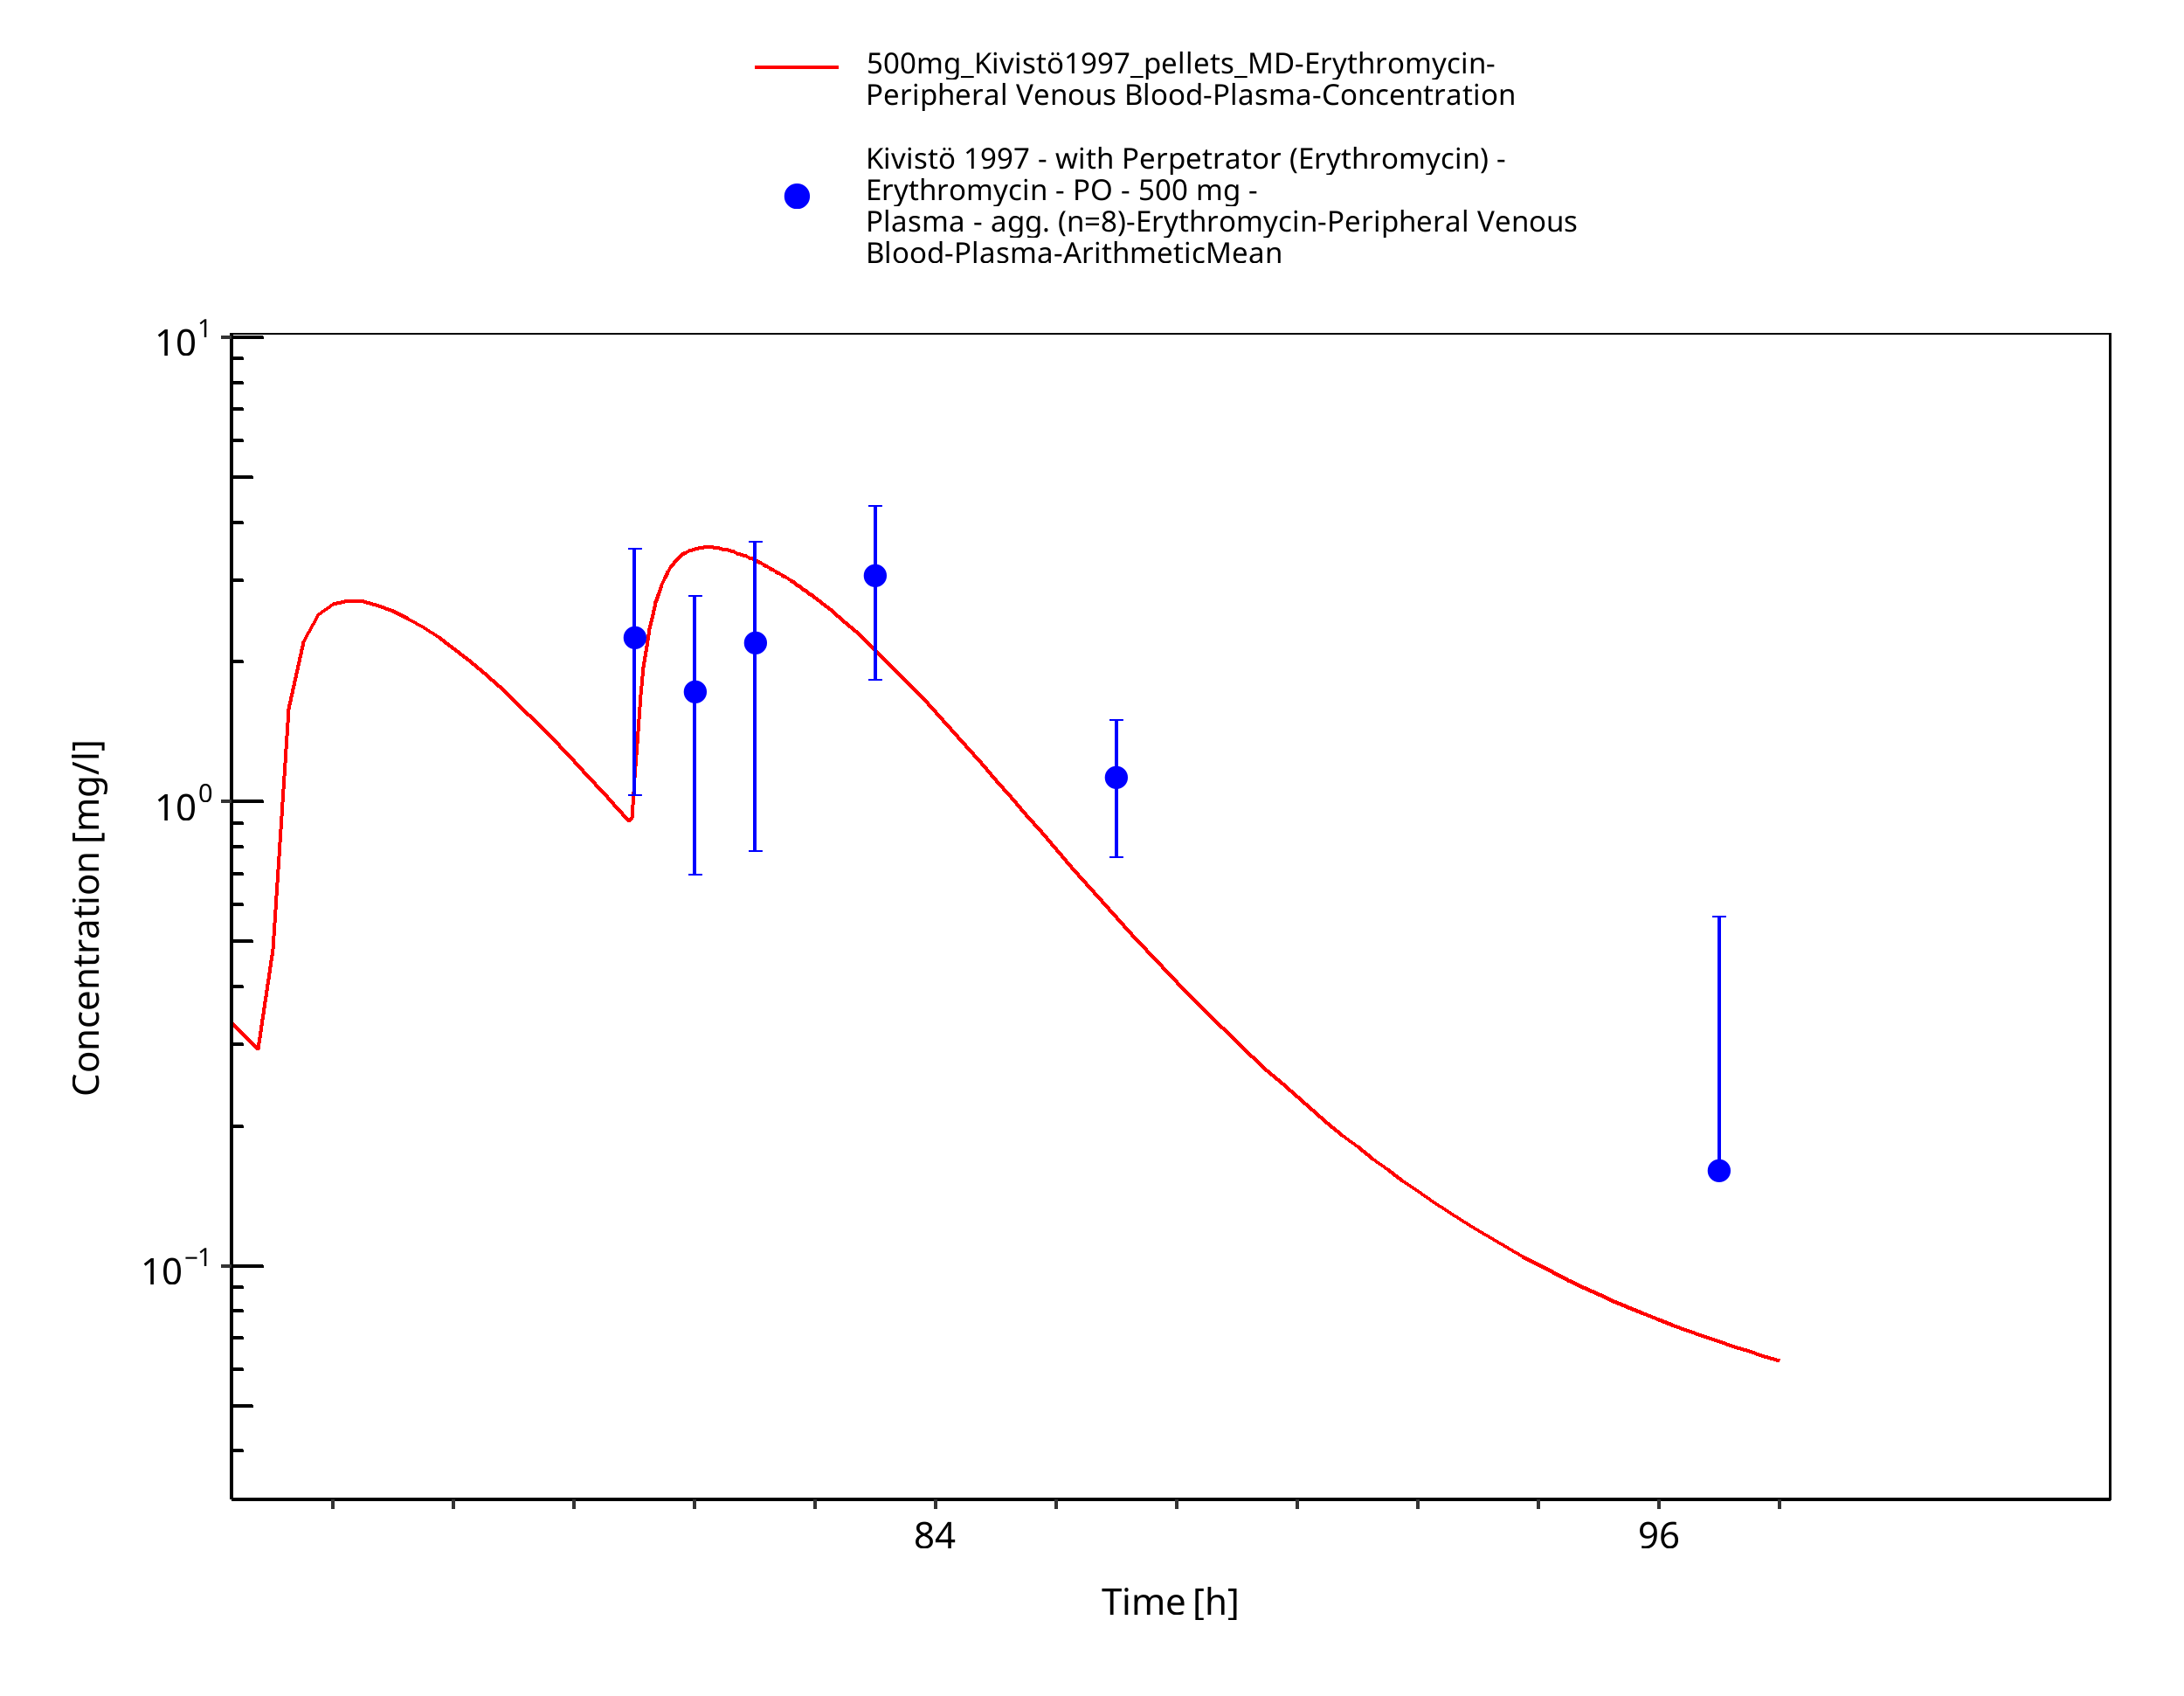
Figure 3-10: Time Profile Analysis
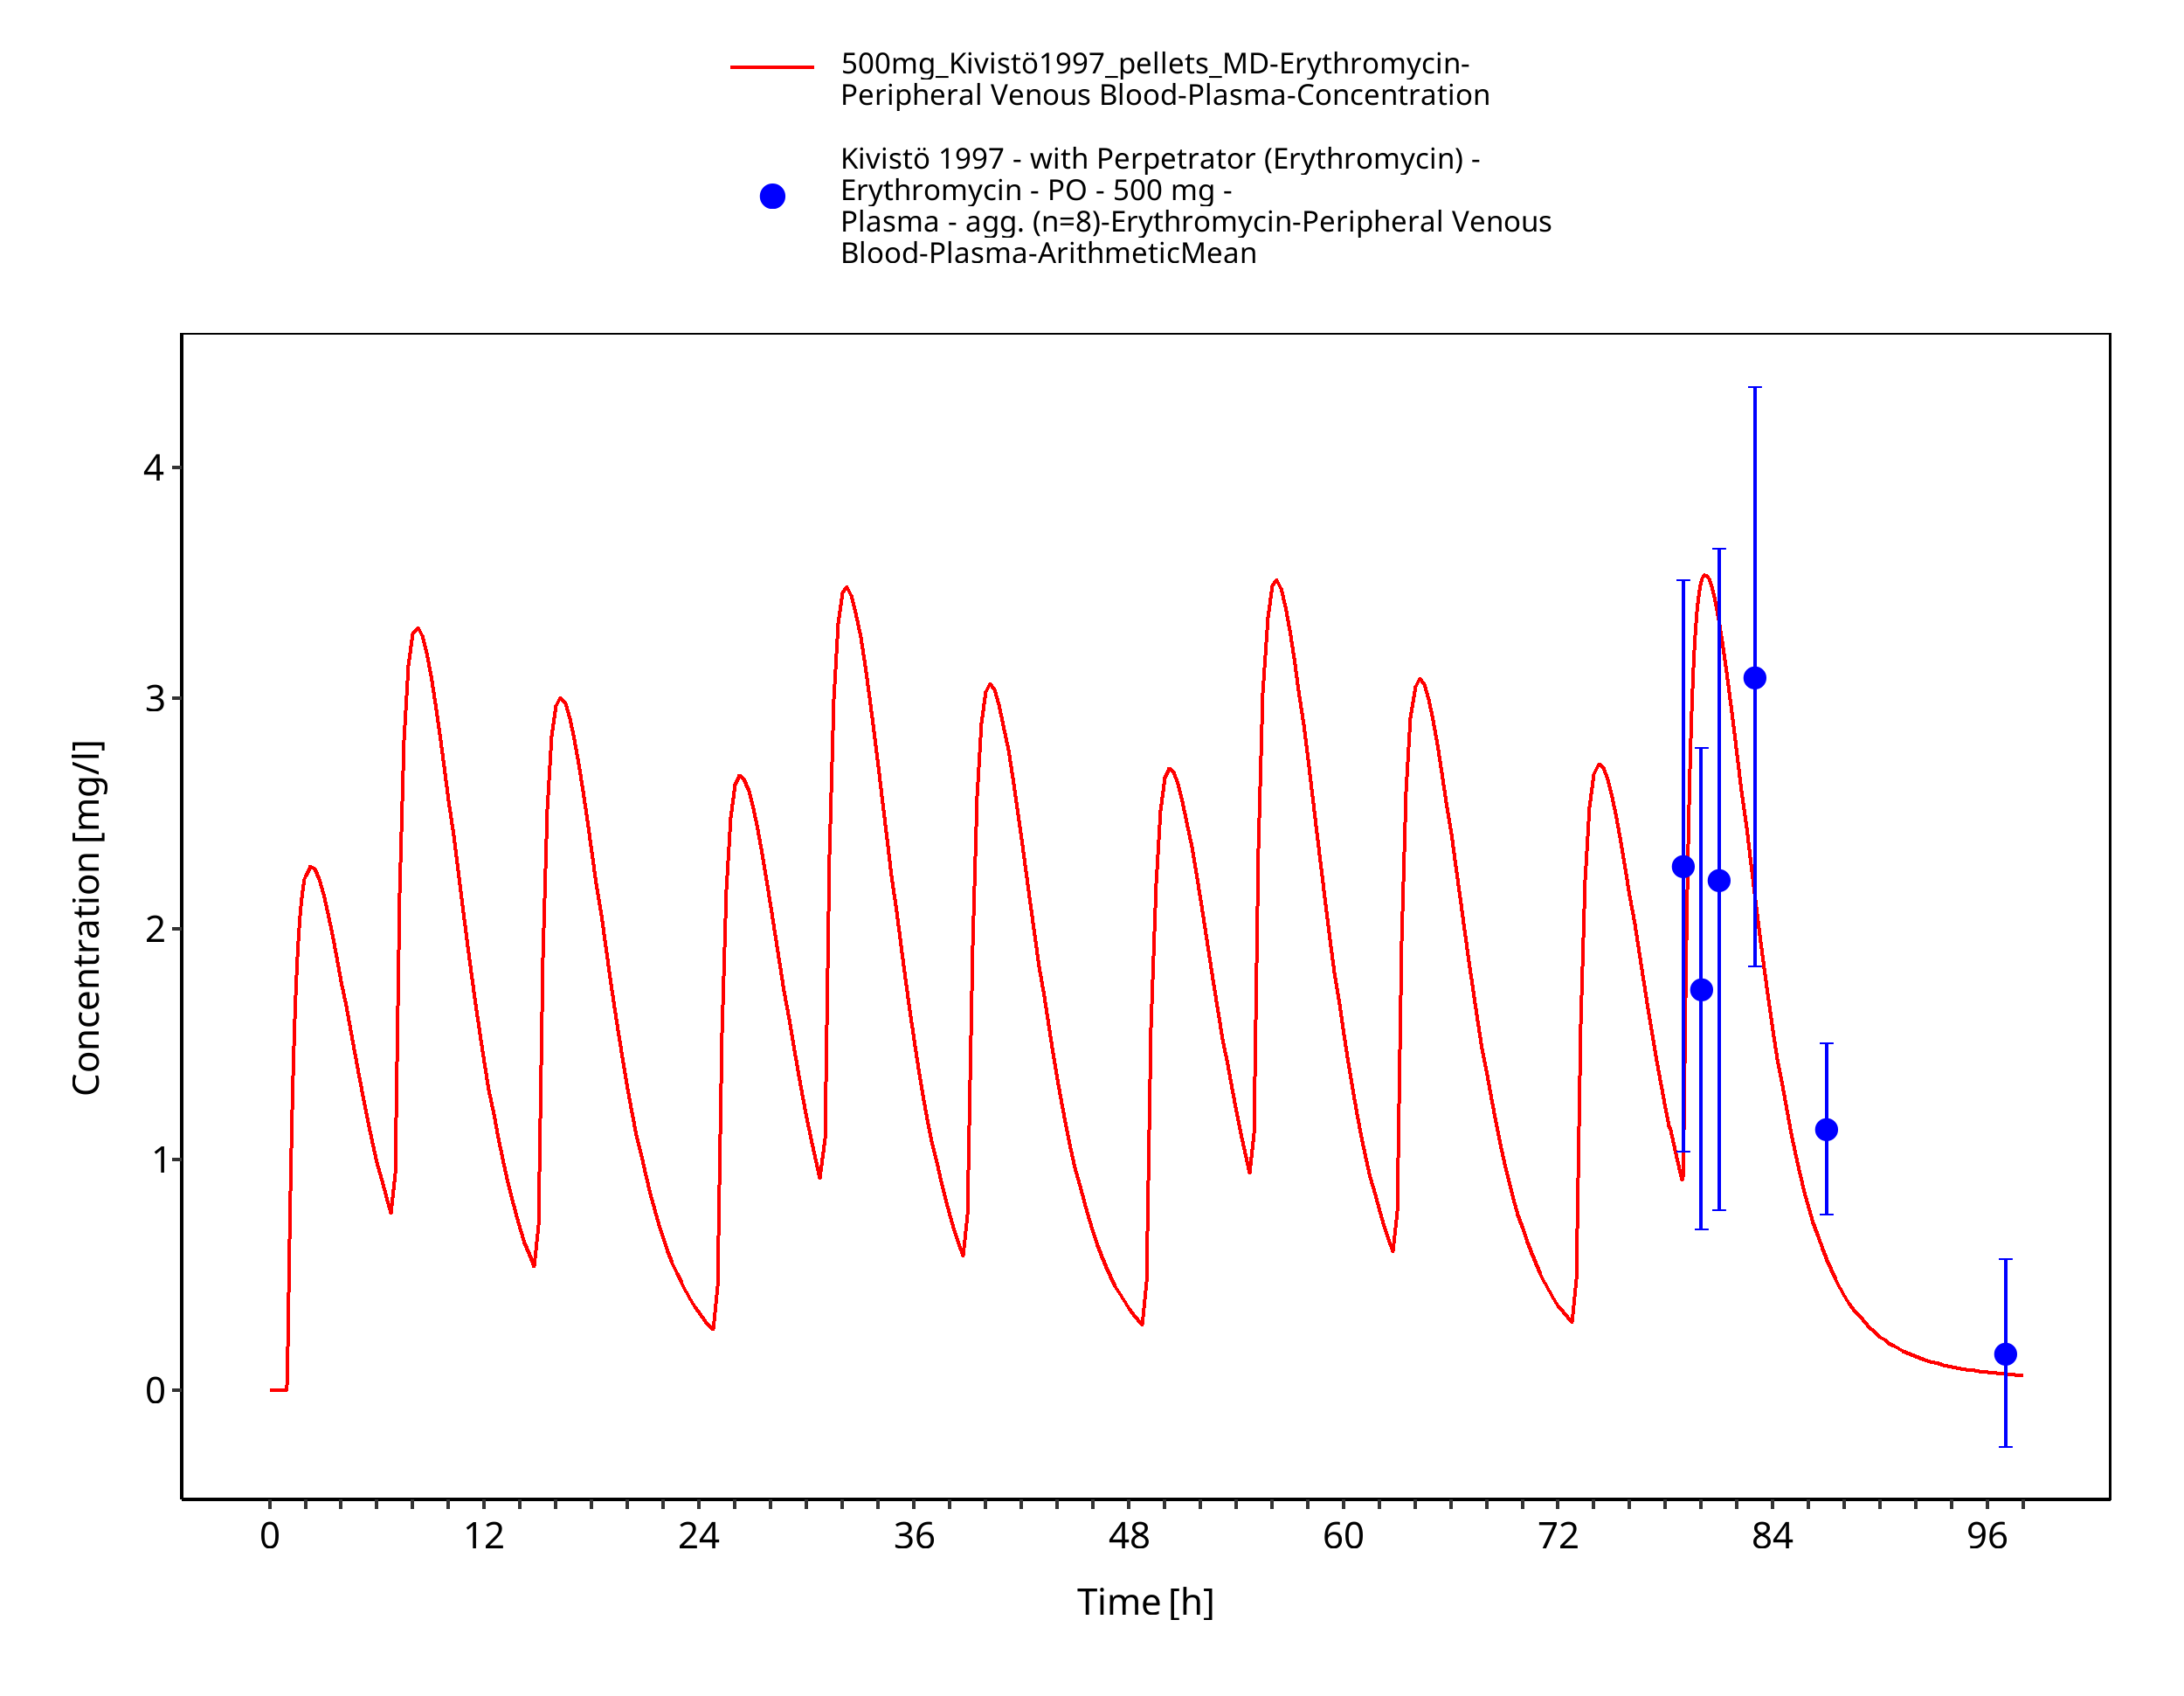
Figure 3-11: Time Profile Analysis 1
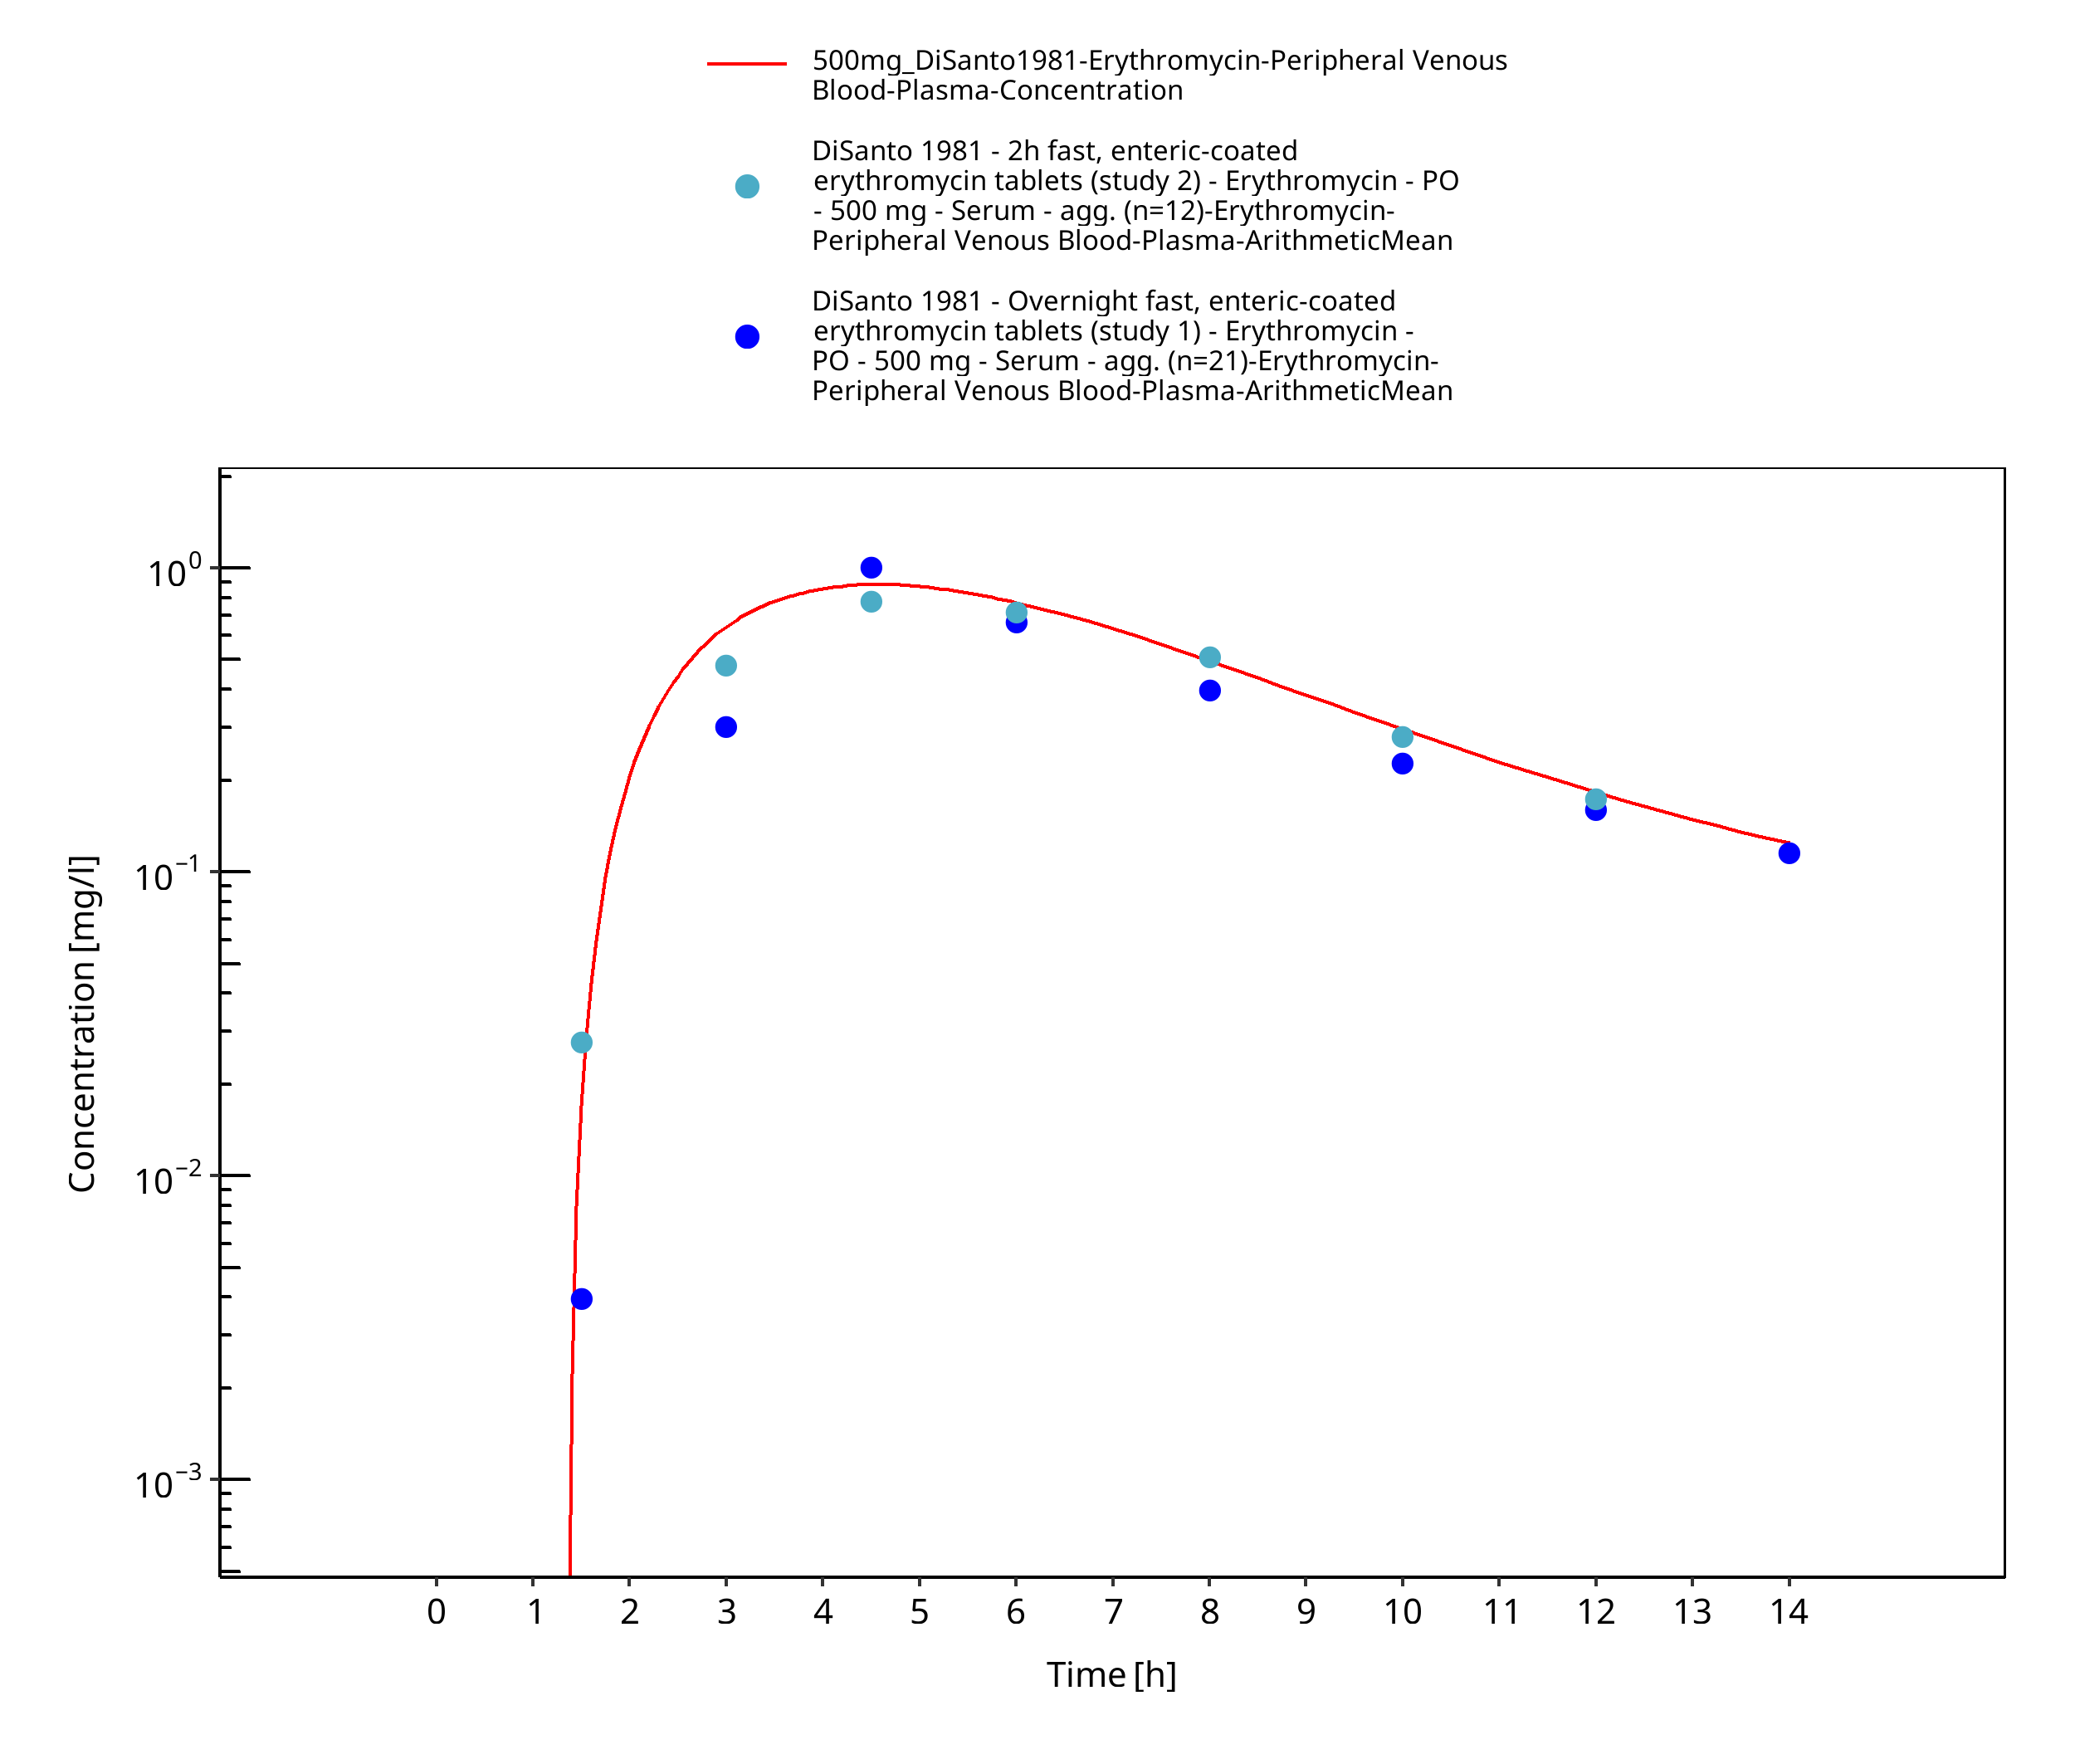
Figure 3-12: Time Profile Analysis
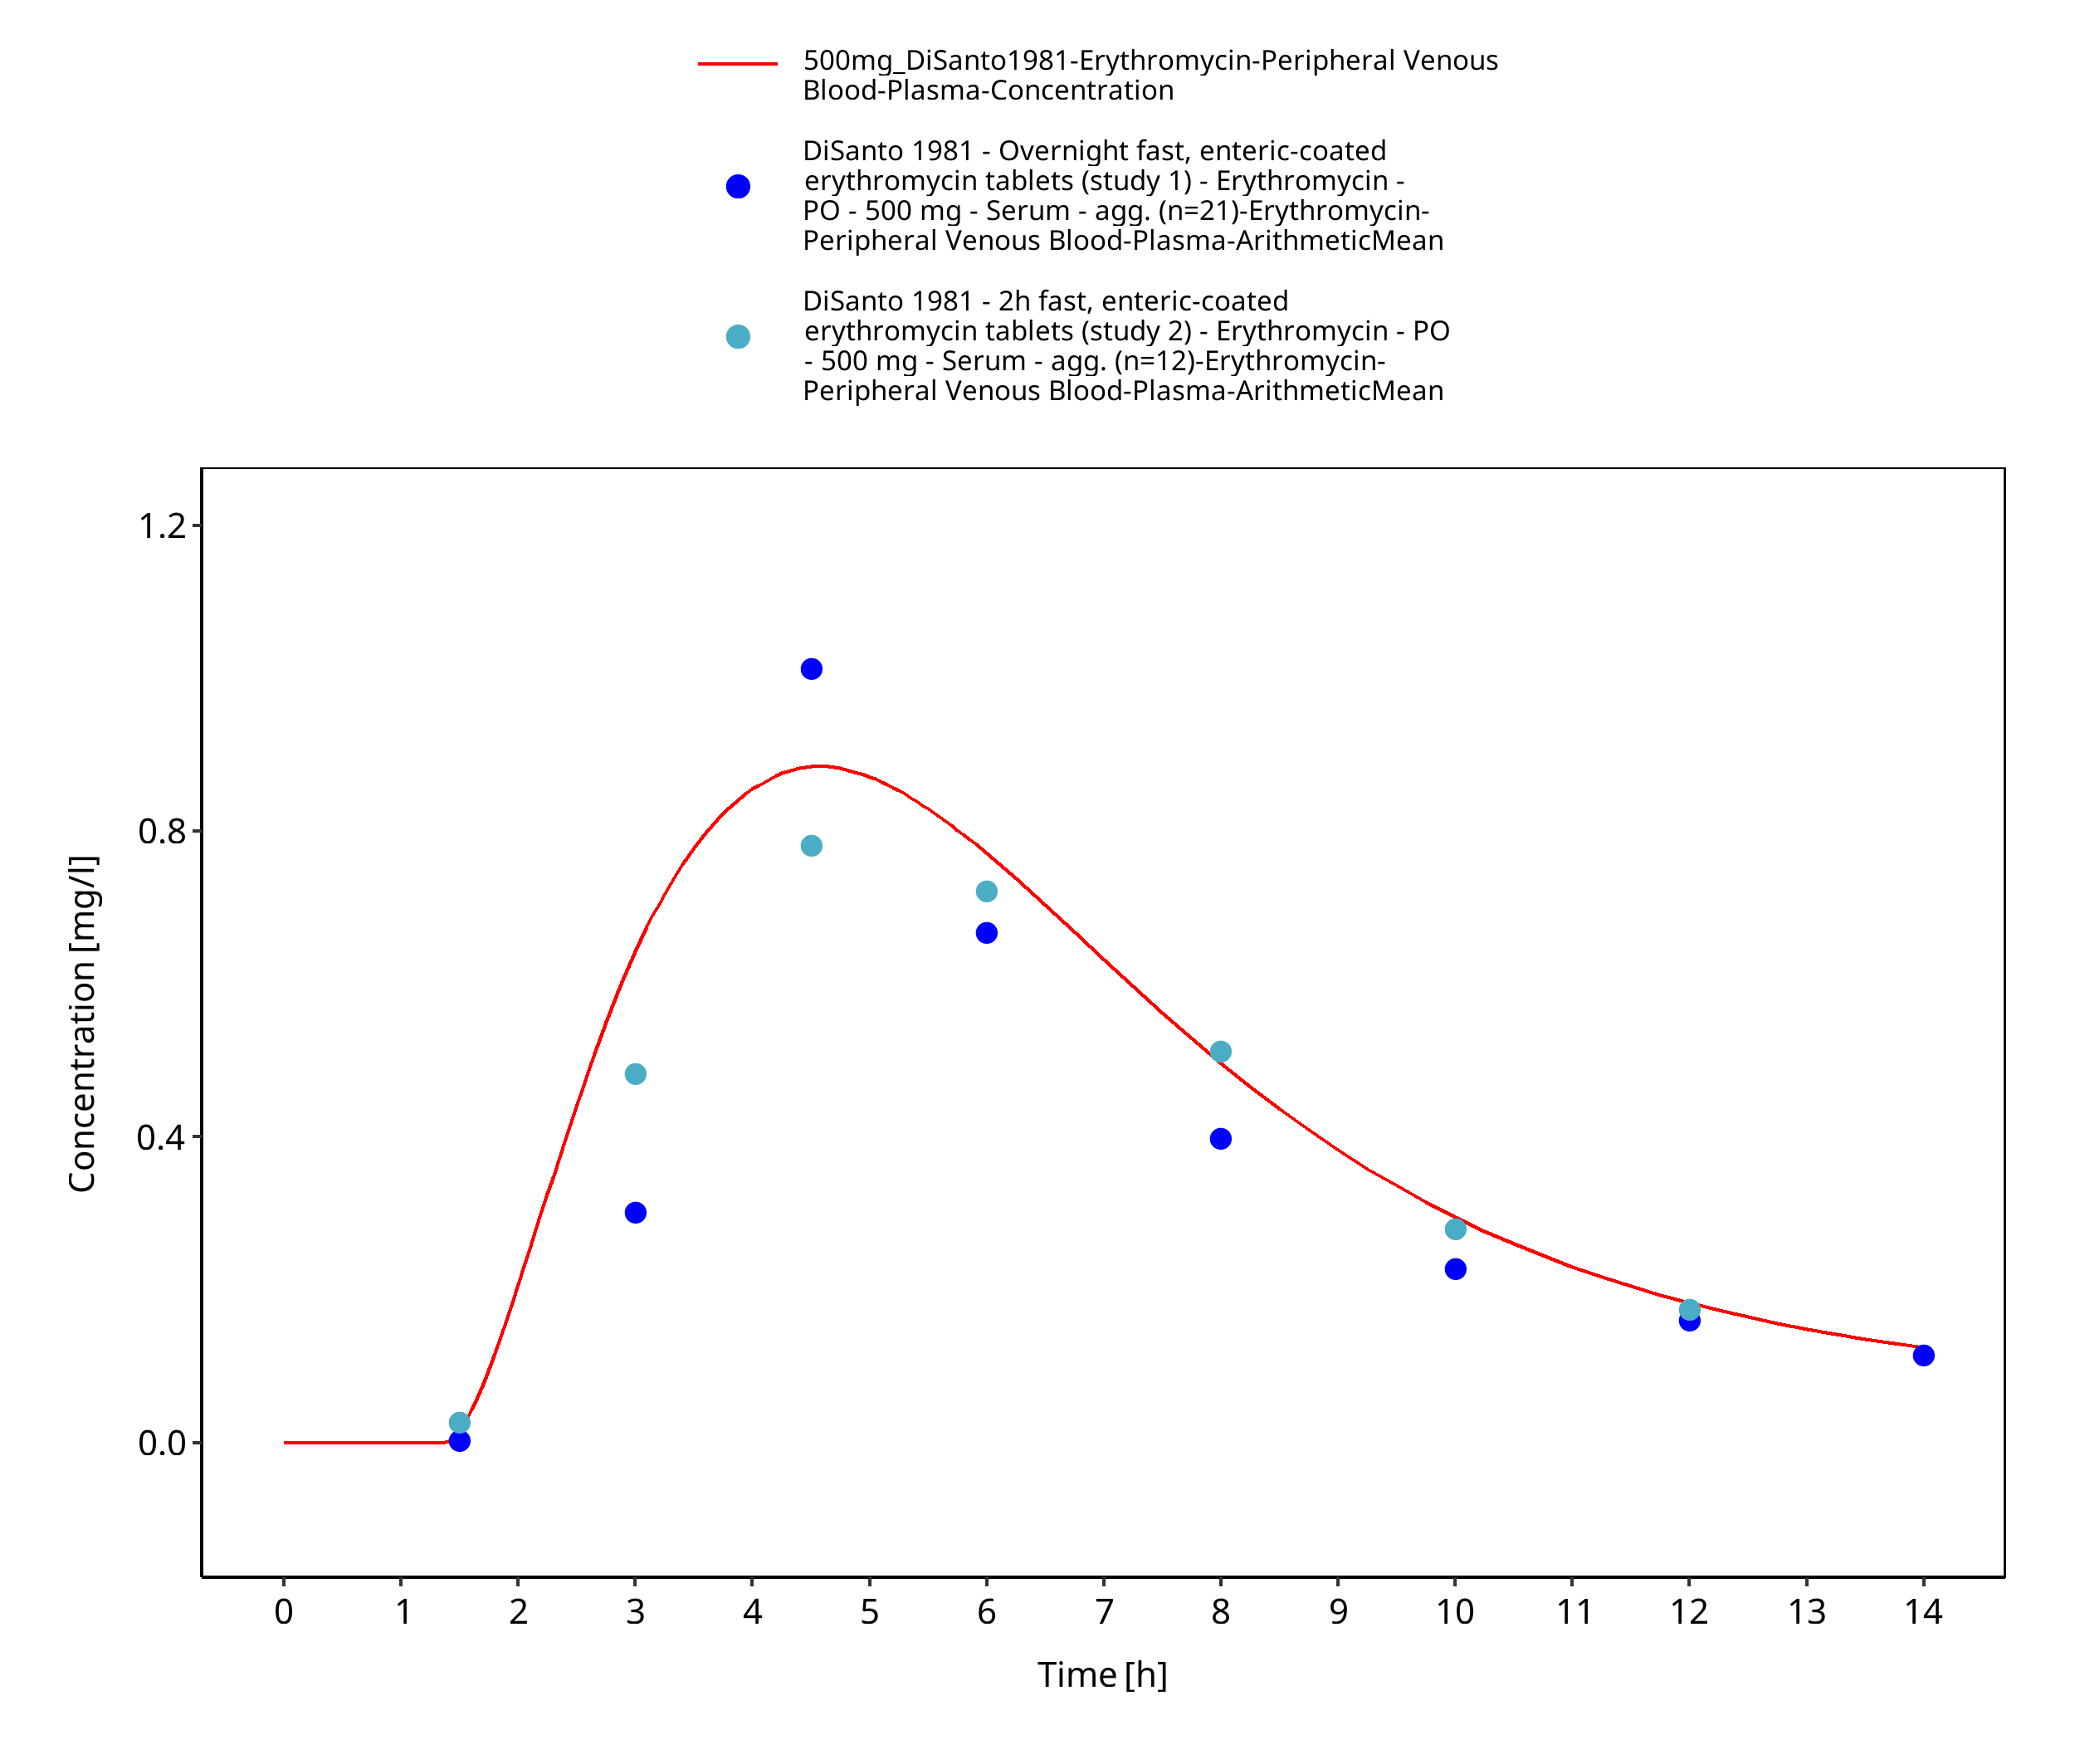
Figure 3-13: Time Profile Analysis 1
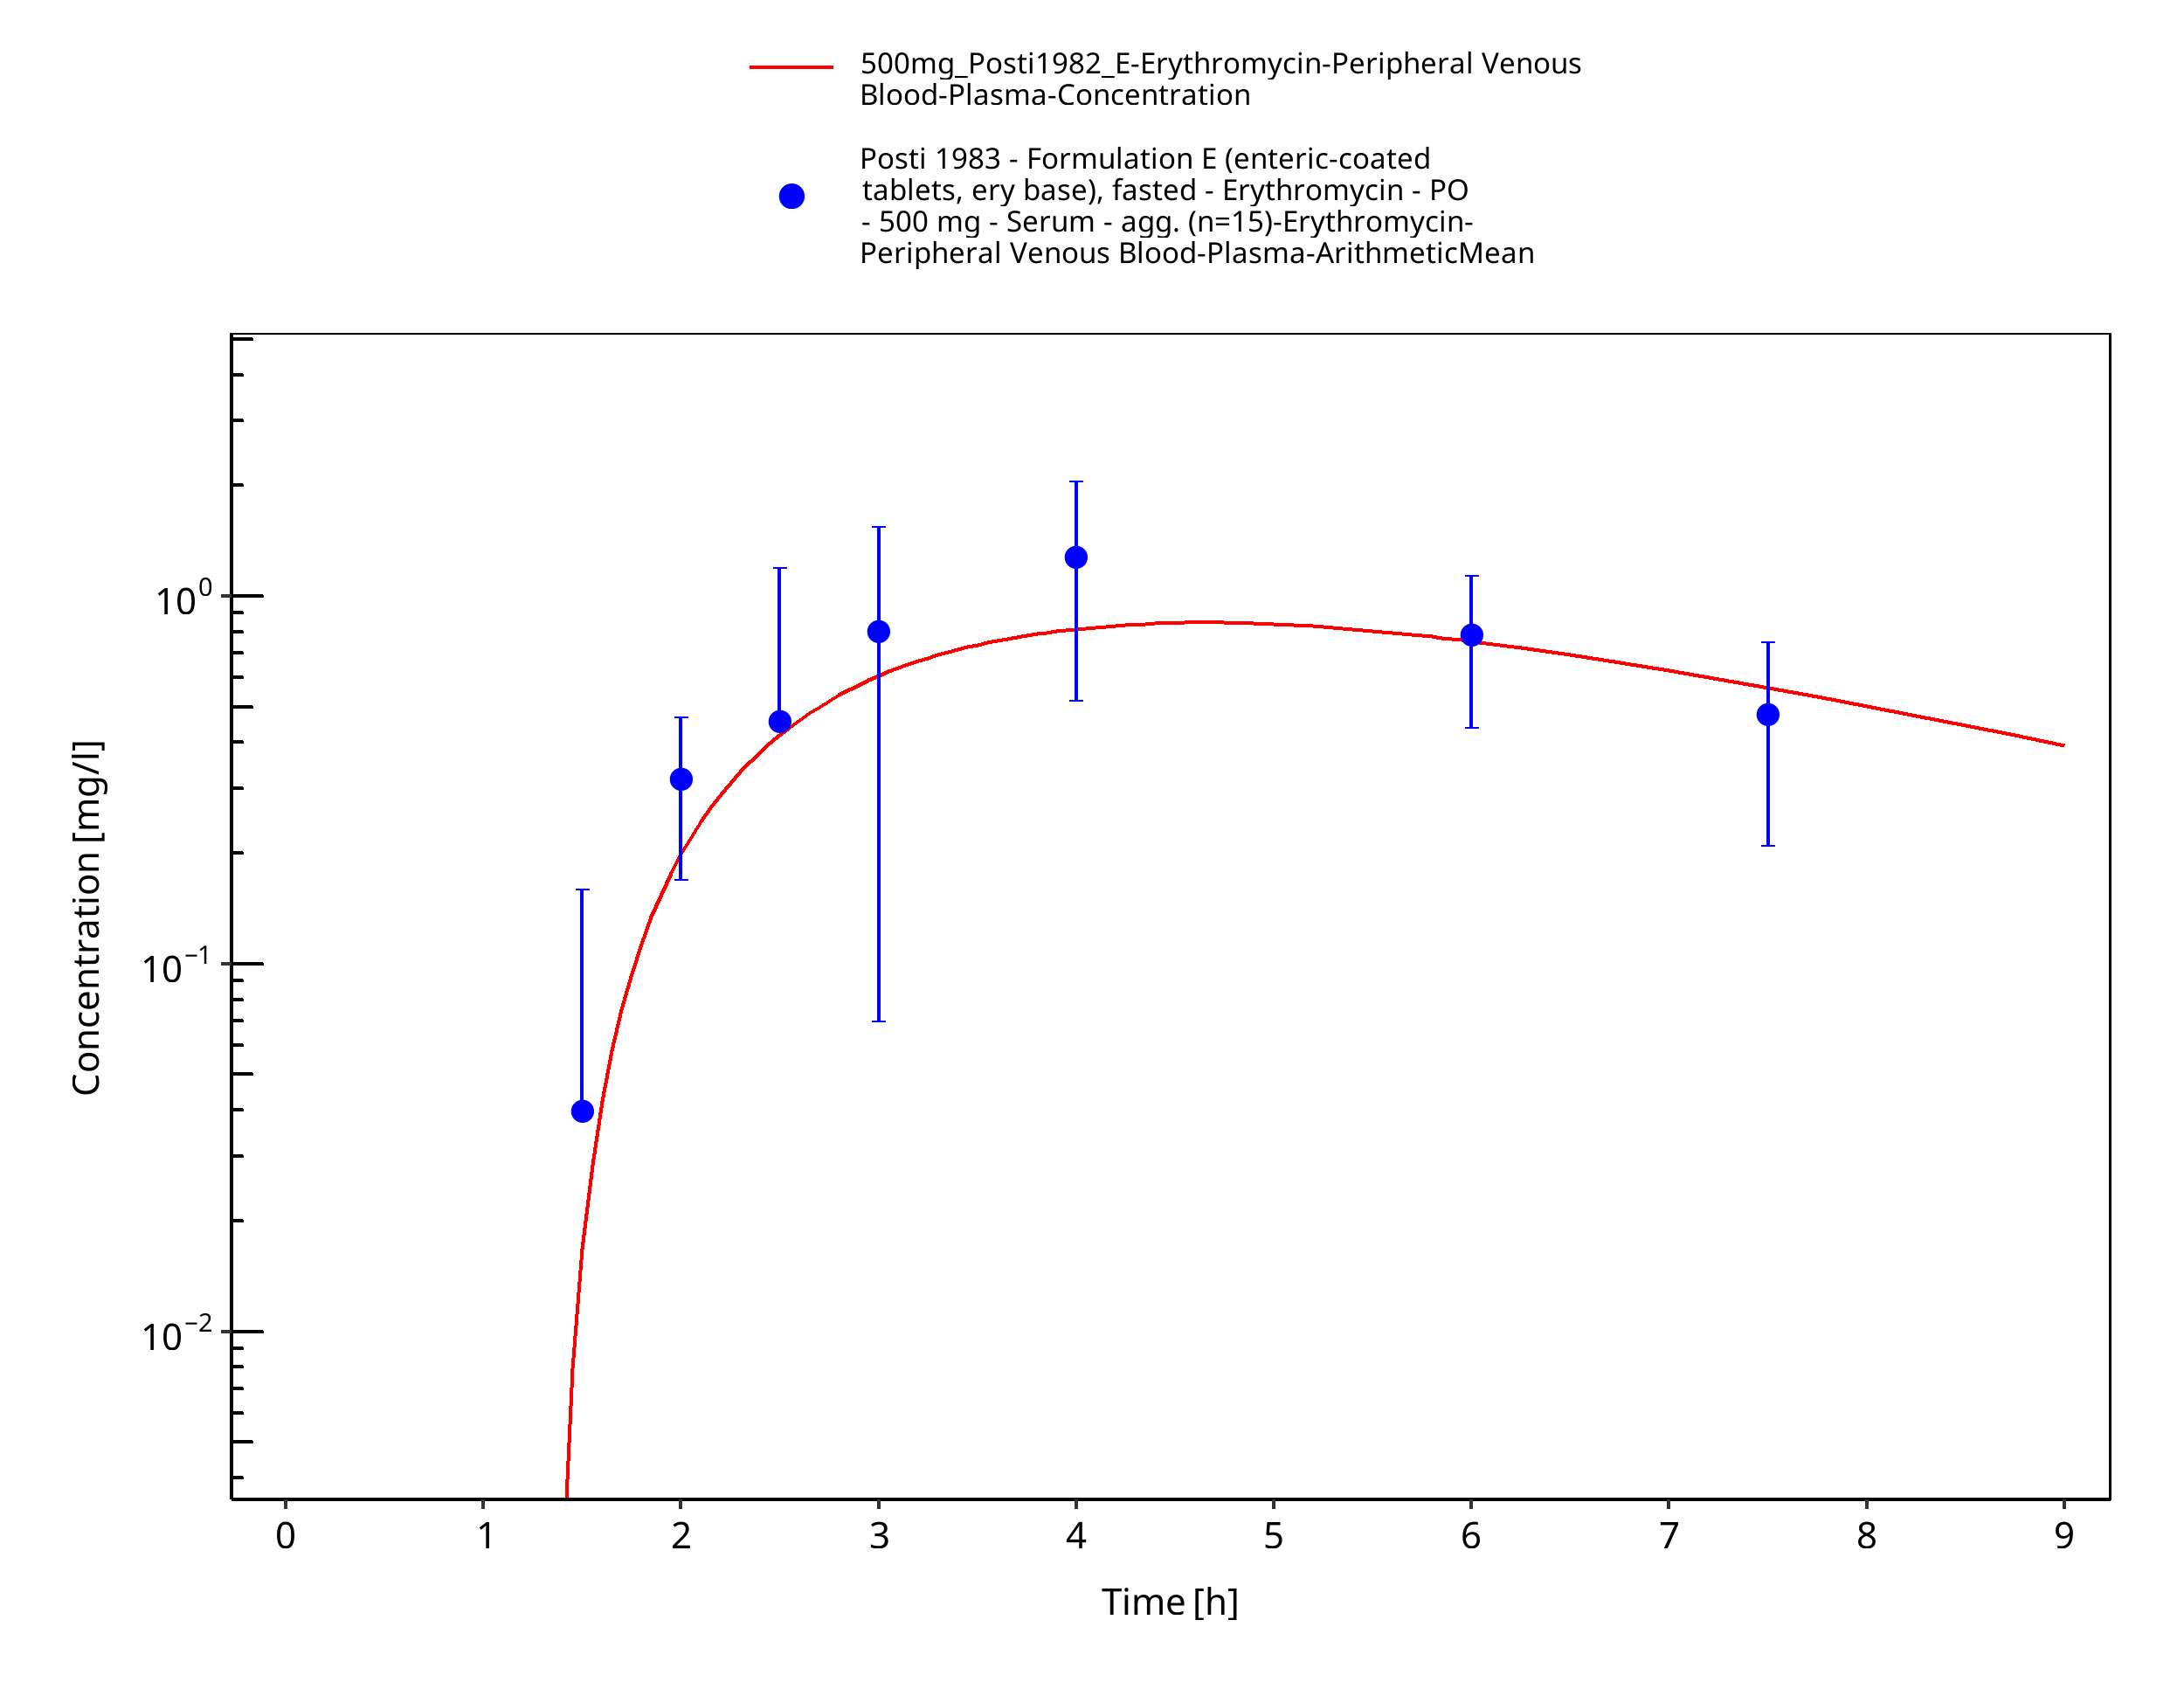
Figure 3-14: Time Profile Analysis
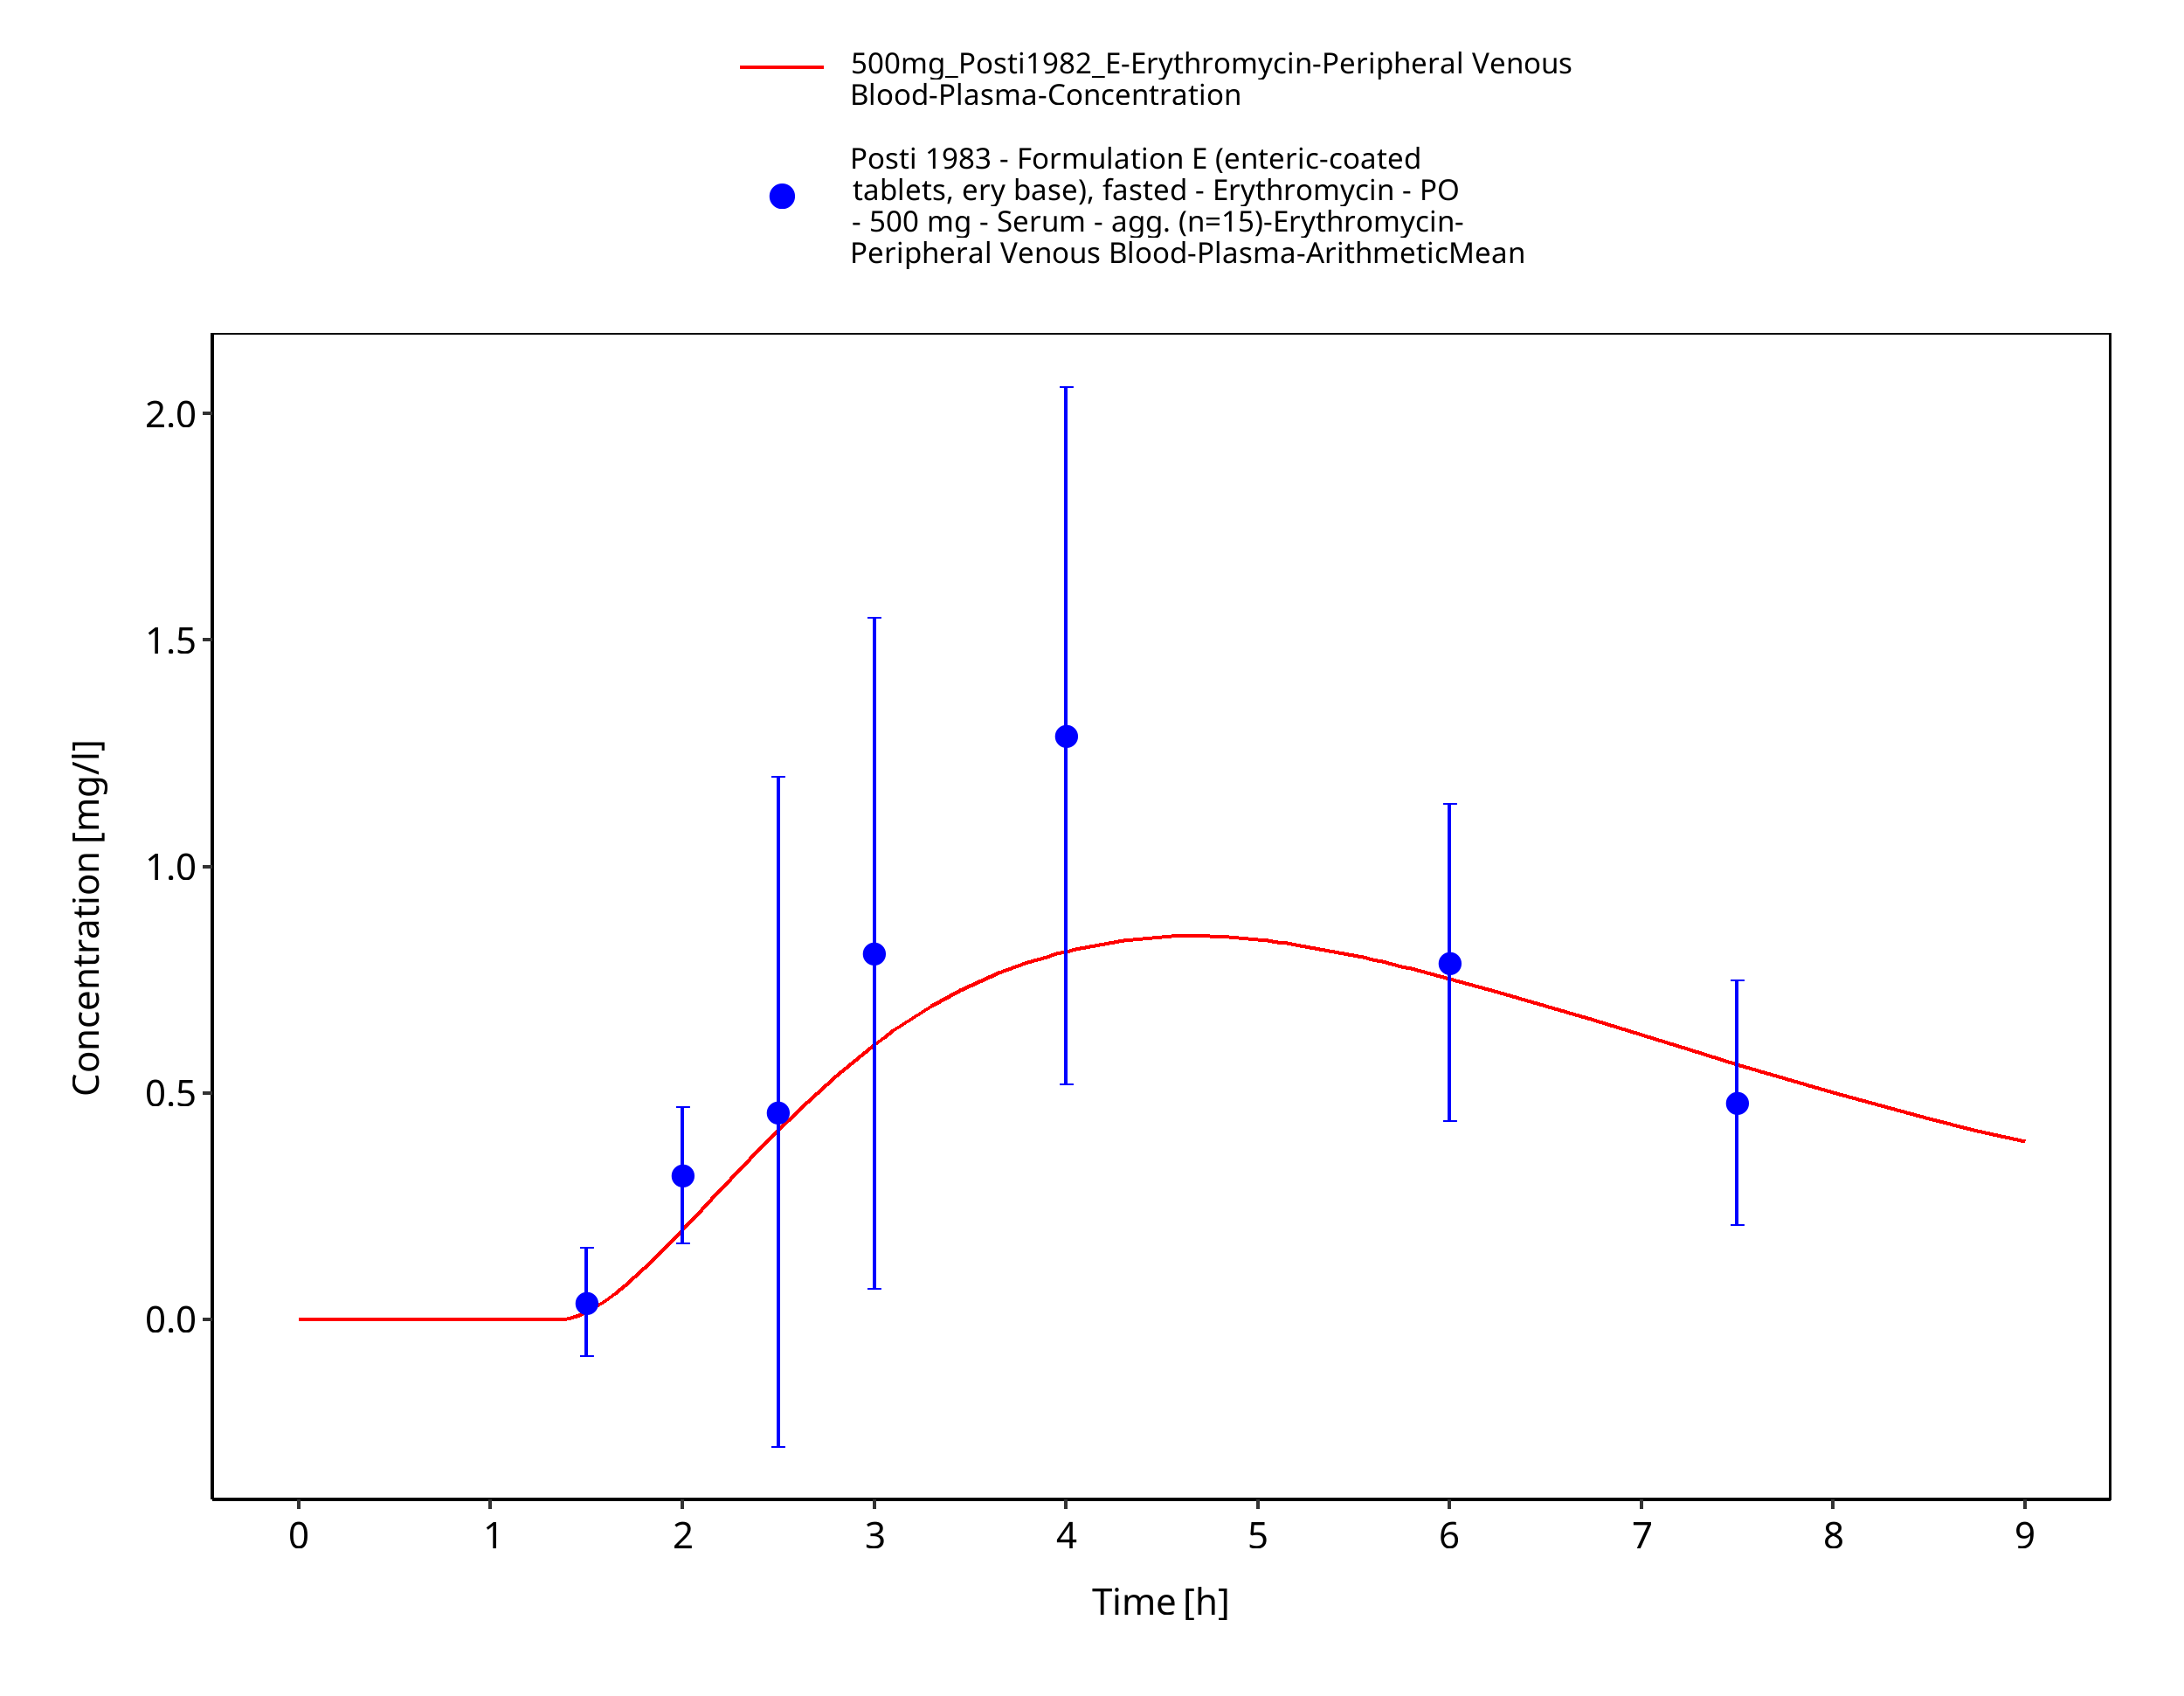
Figure 3-15: Time Profile Analysis 1
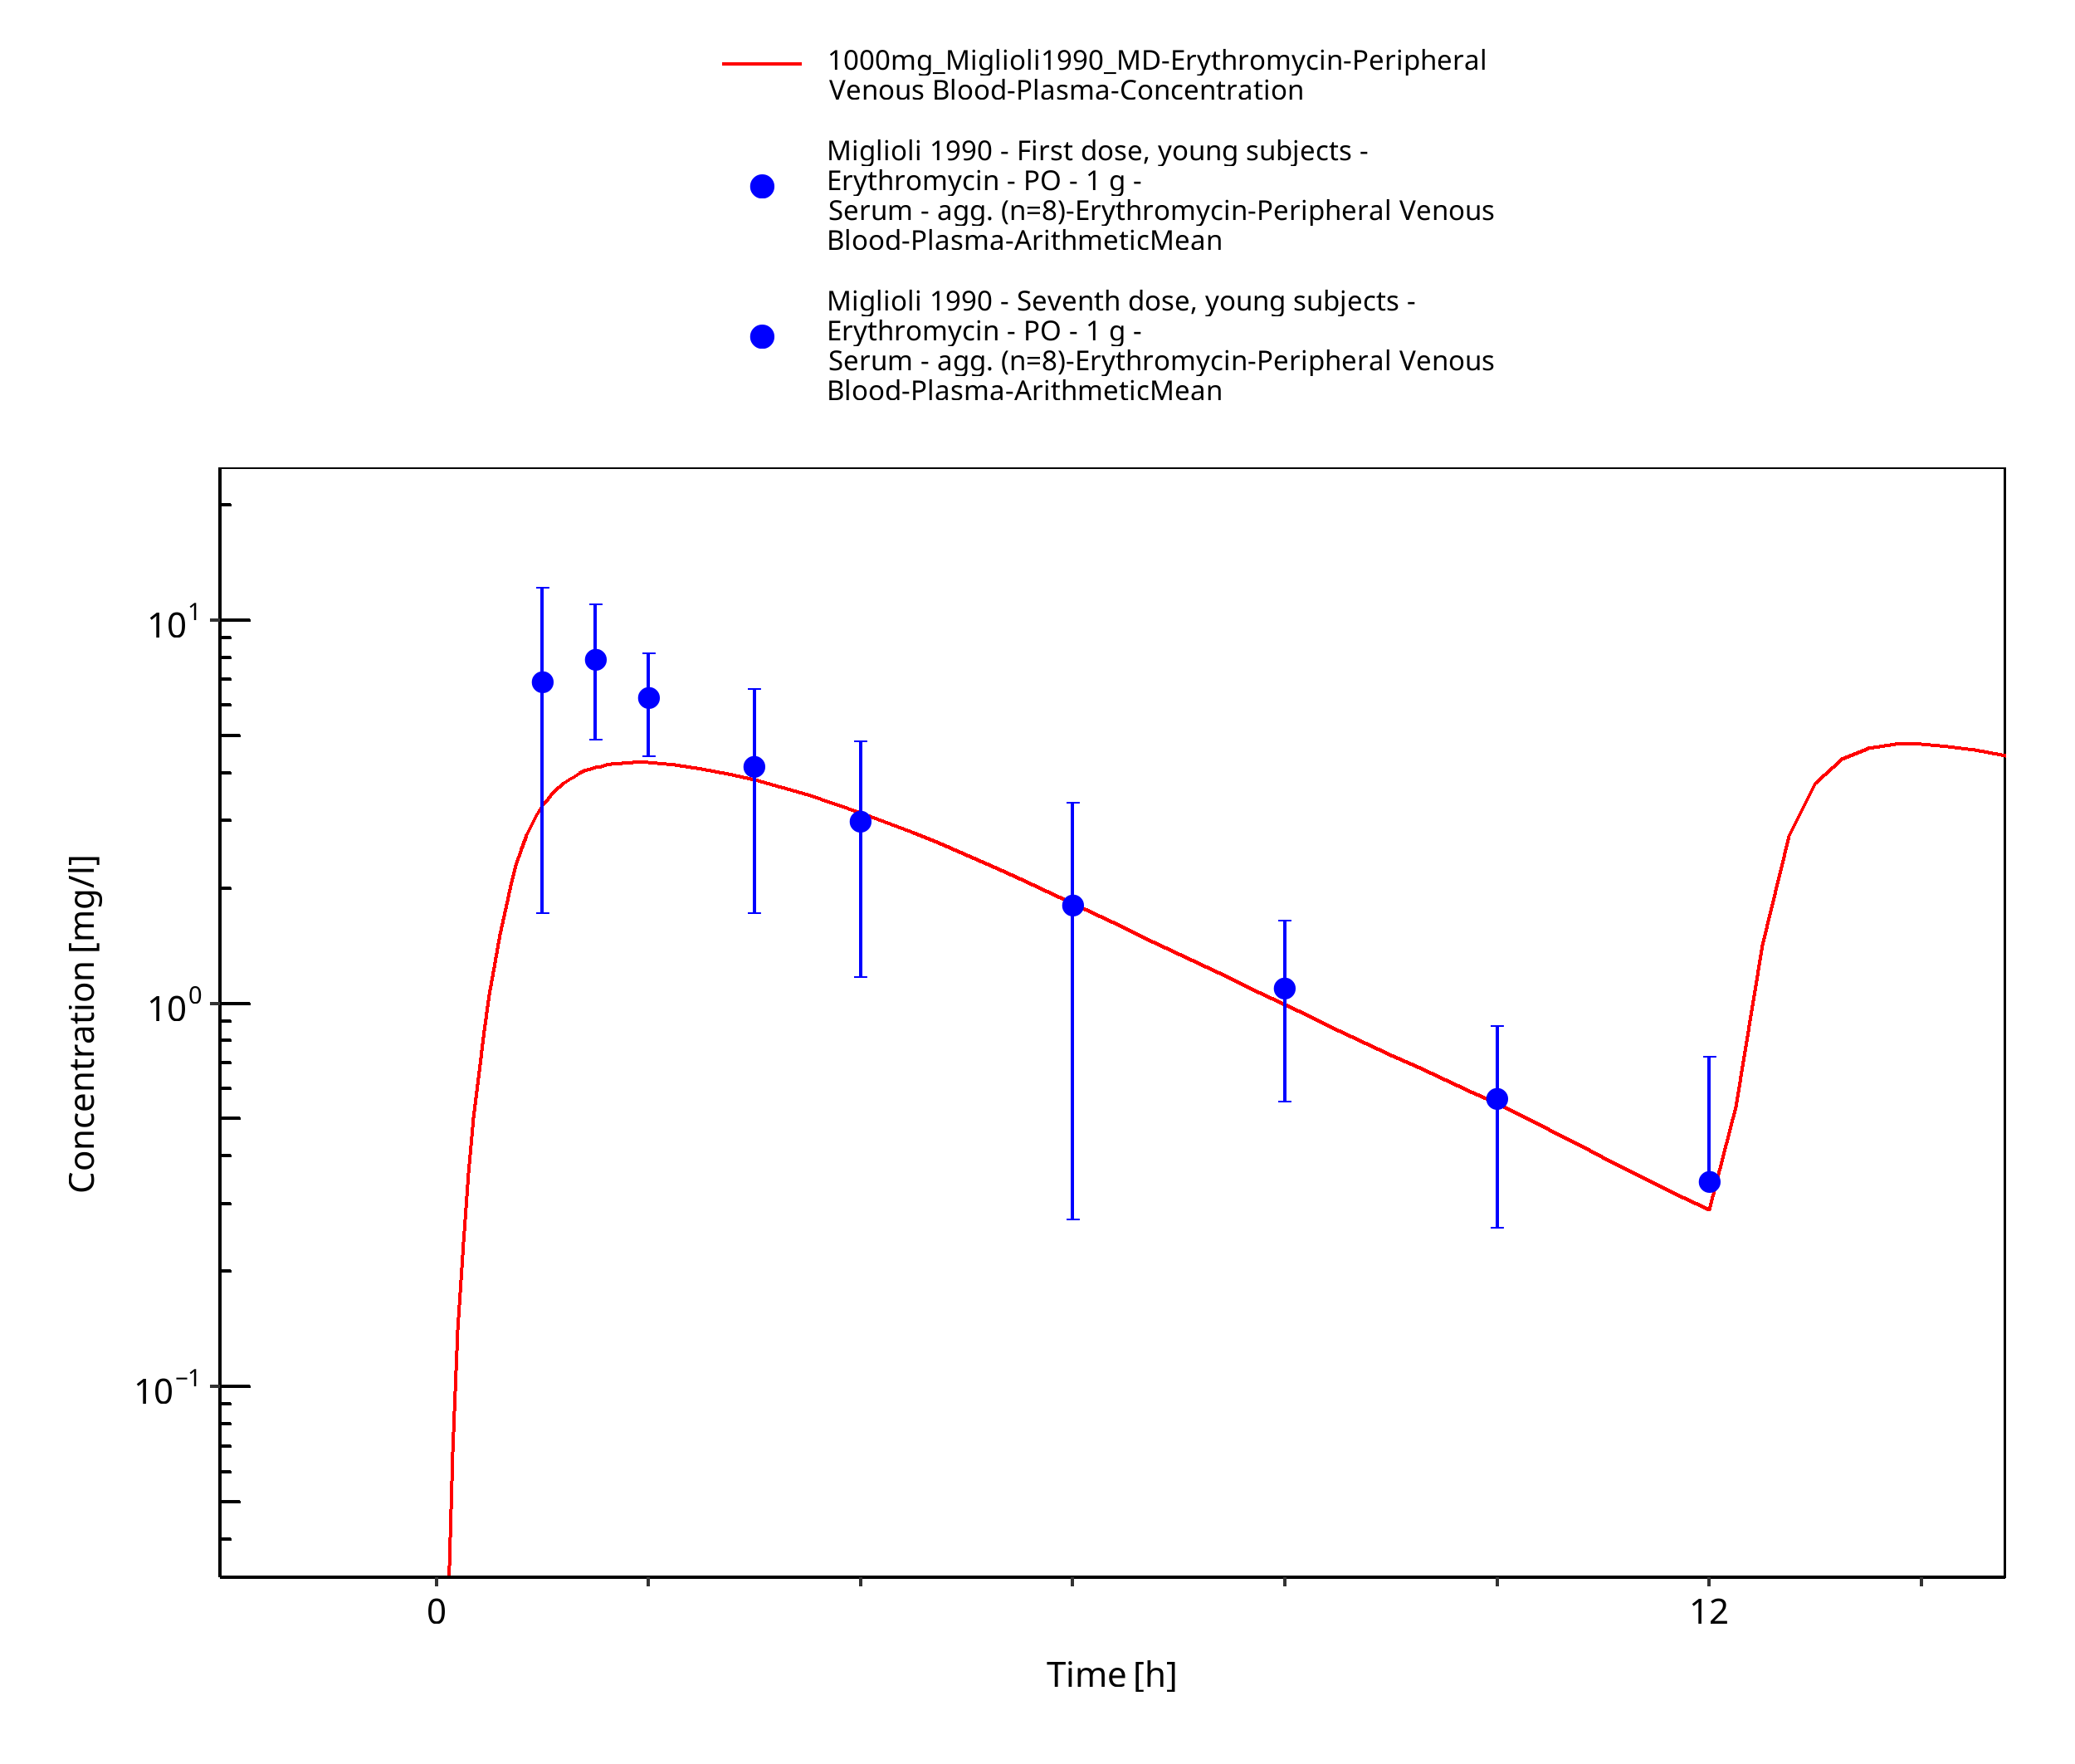
Figure 3-16: Time Profile Analysis
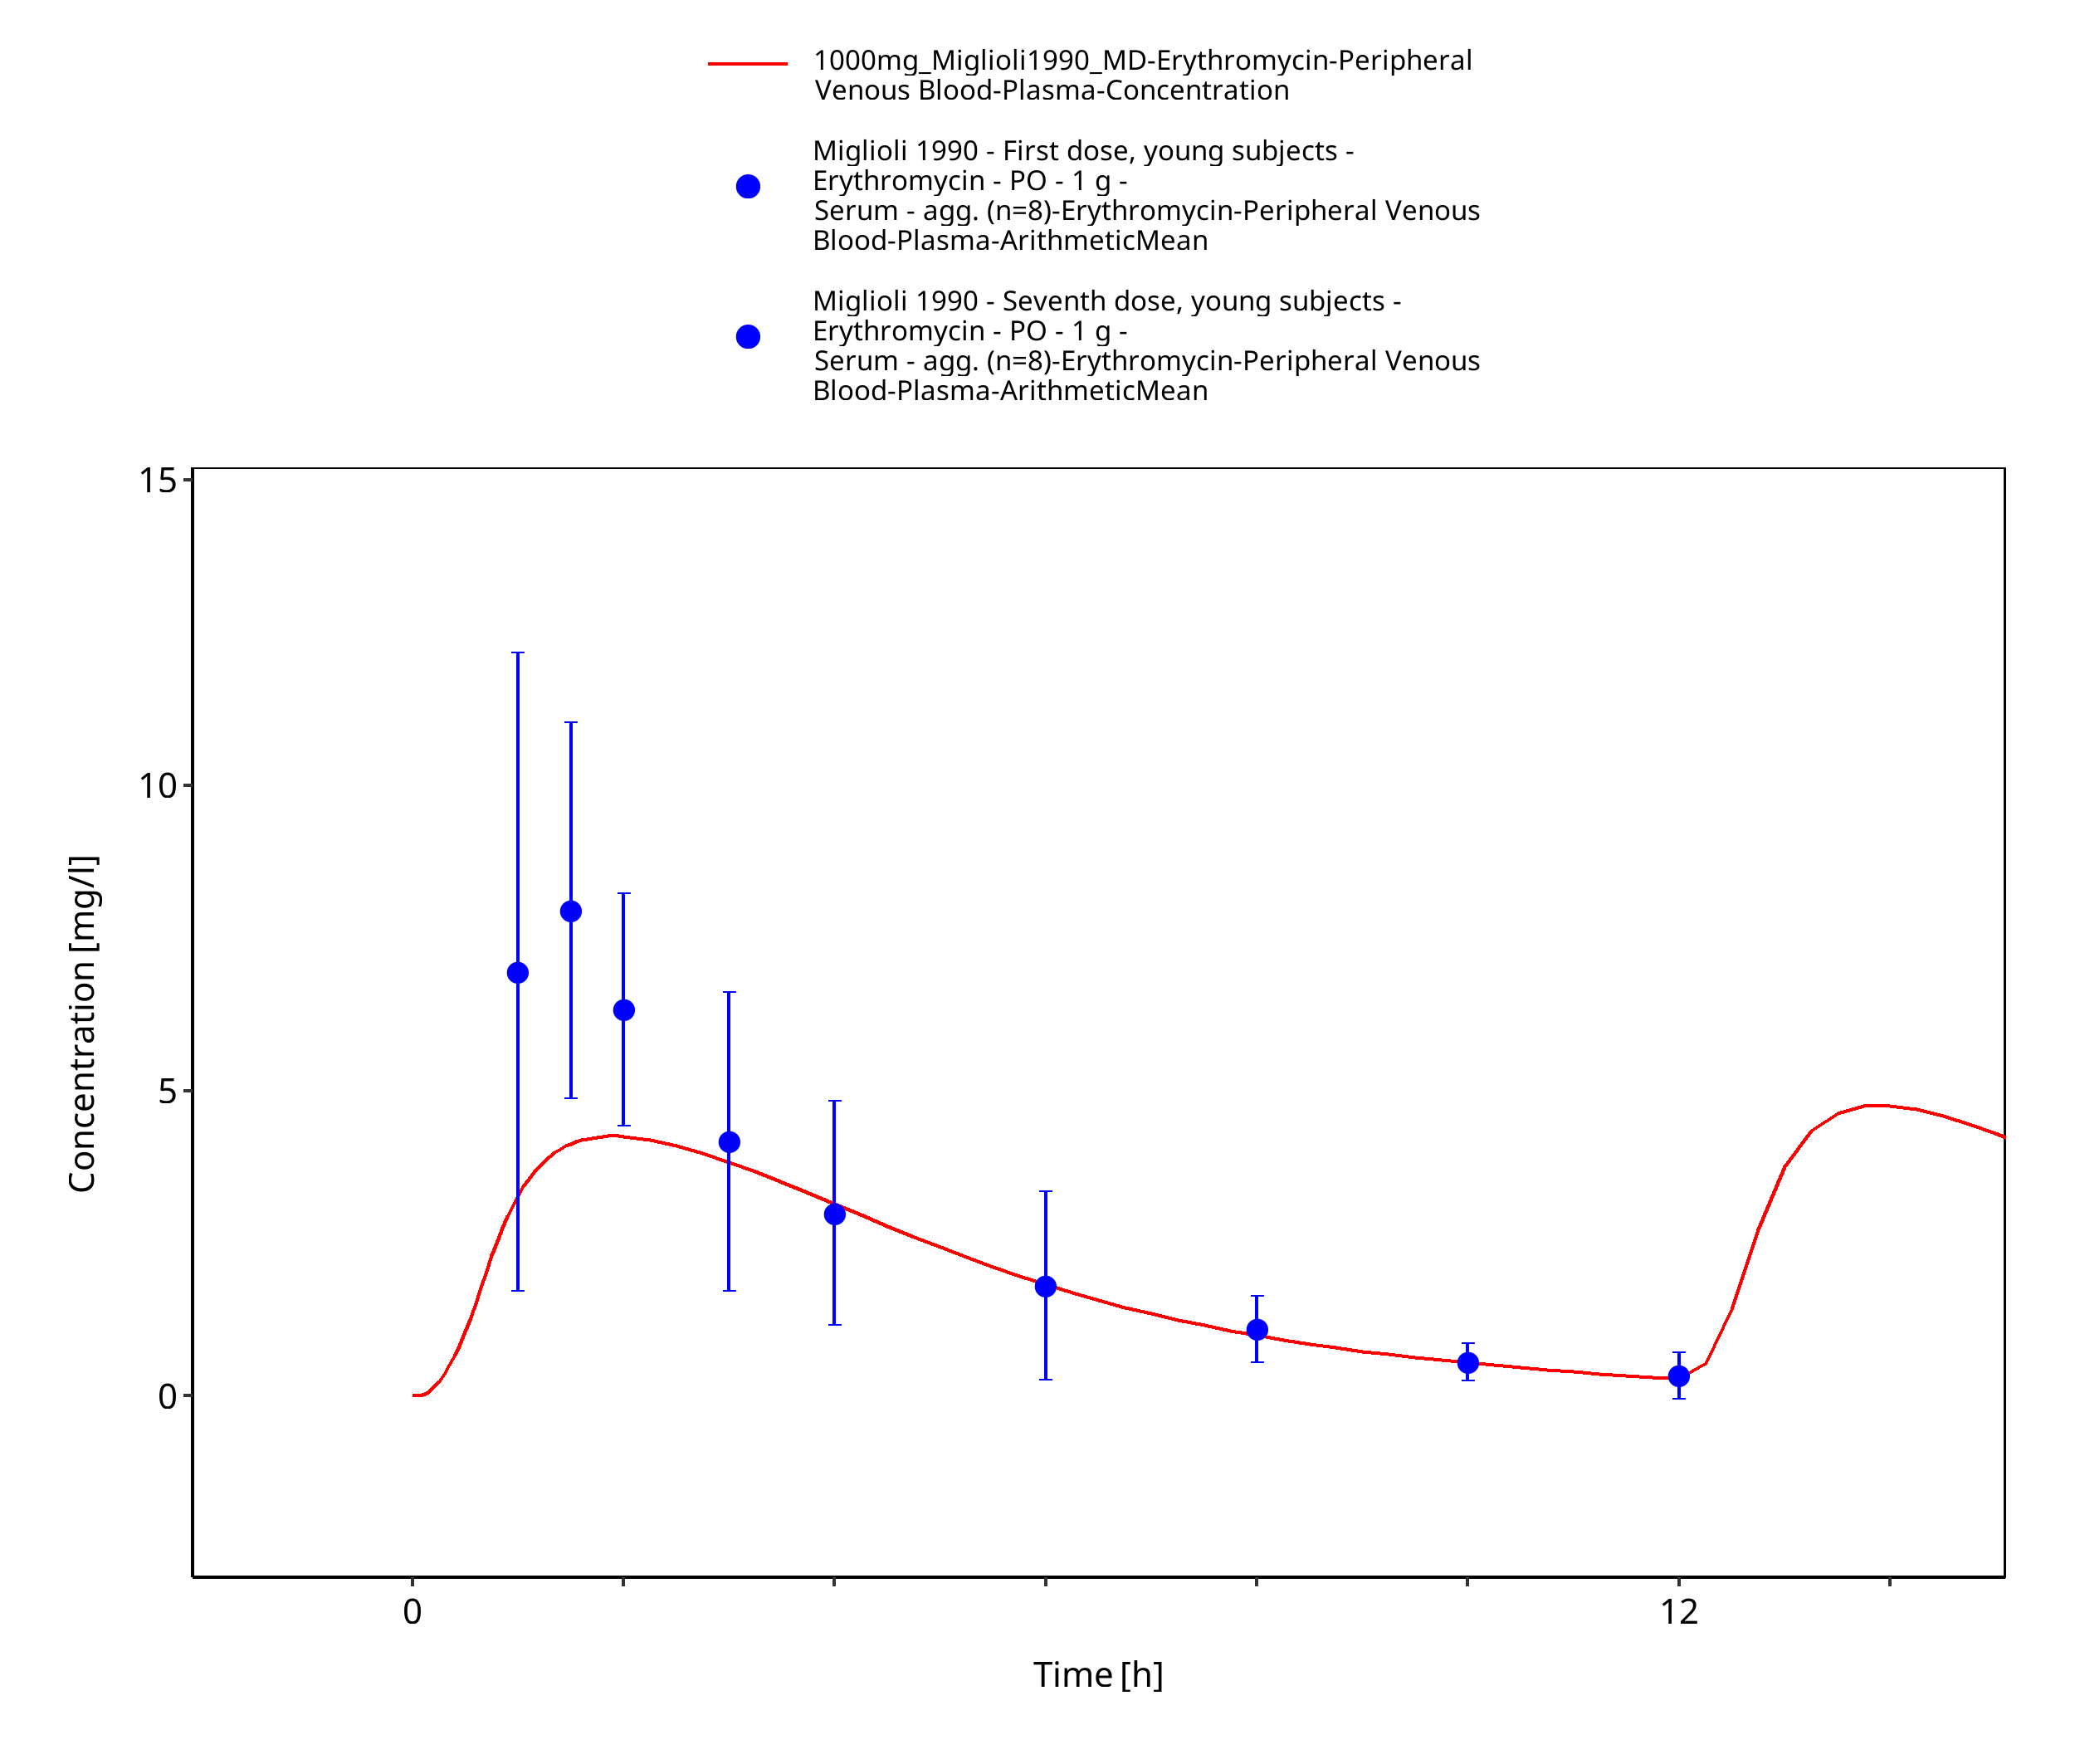
Figure 3-17: Time Profile Analysis 1
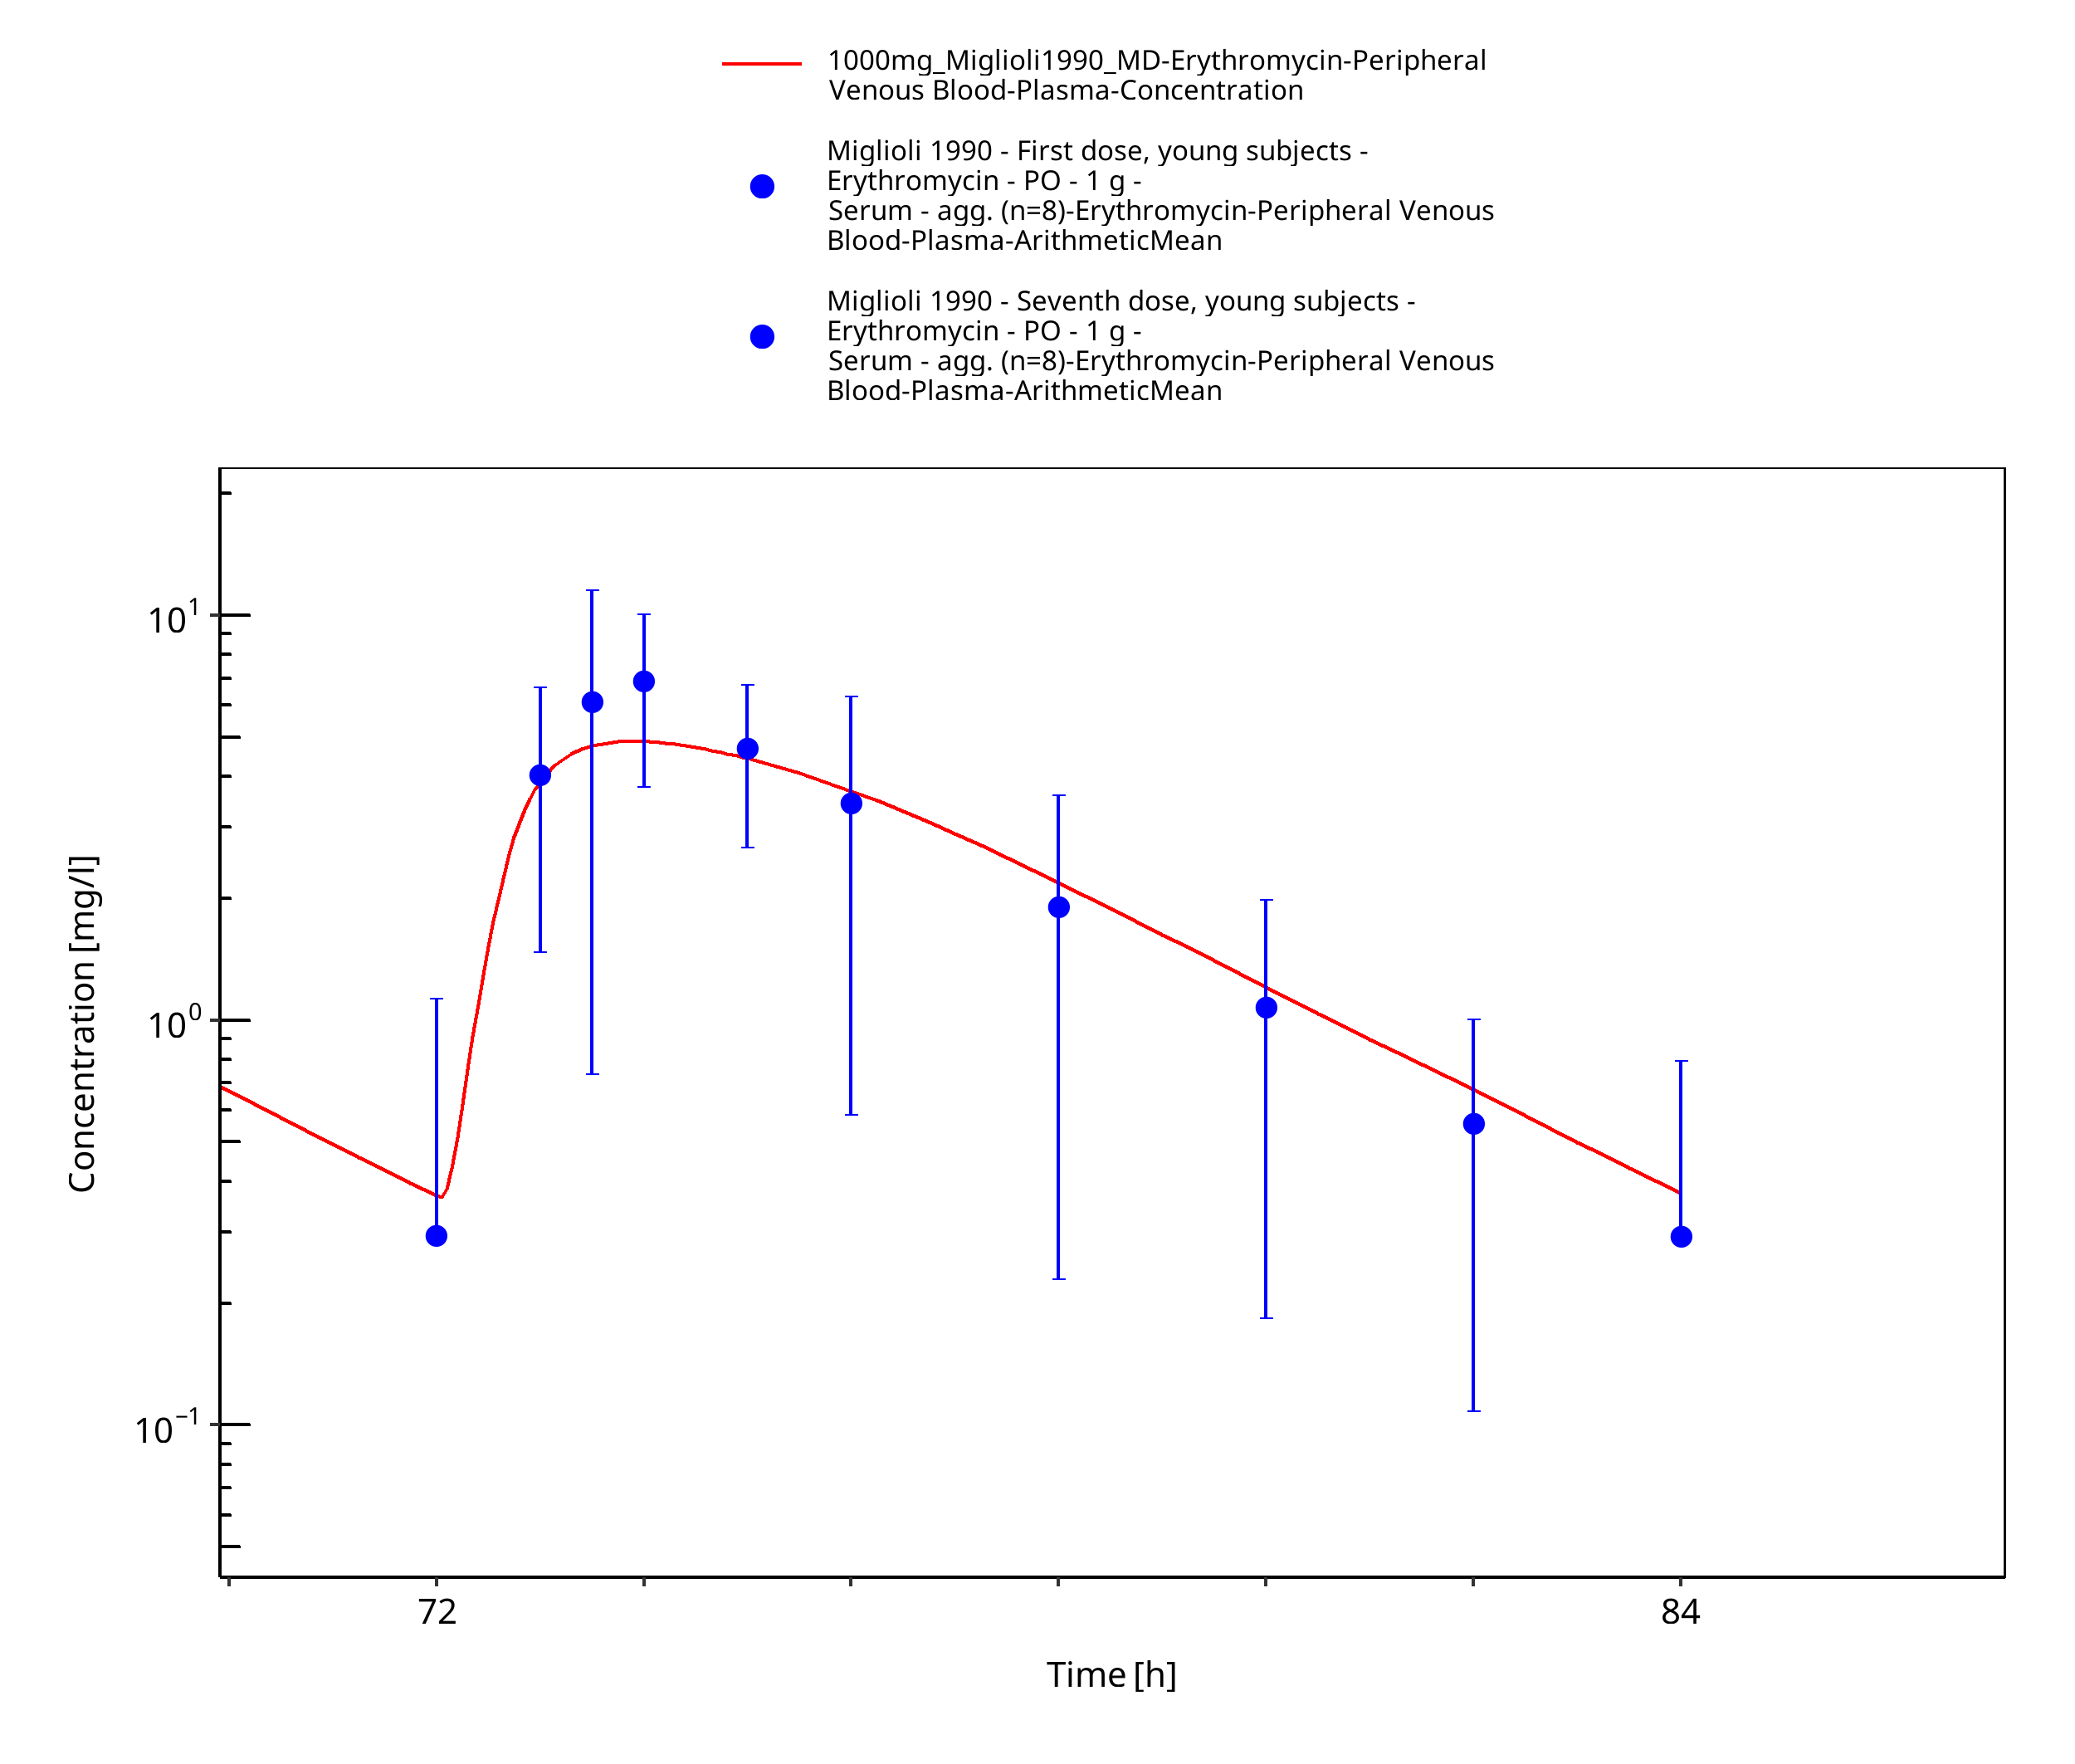
Figure 3-18: Time Profile Analysis 2
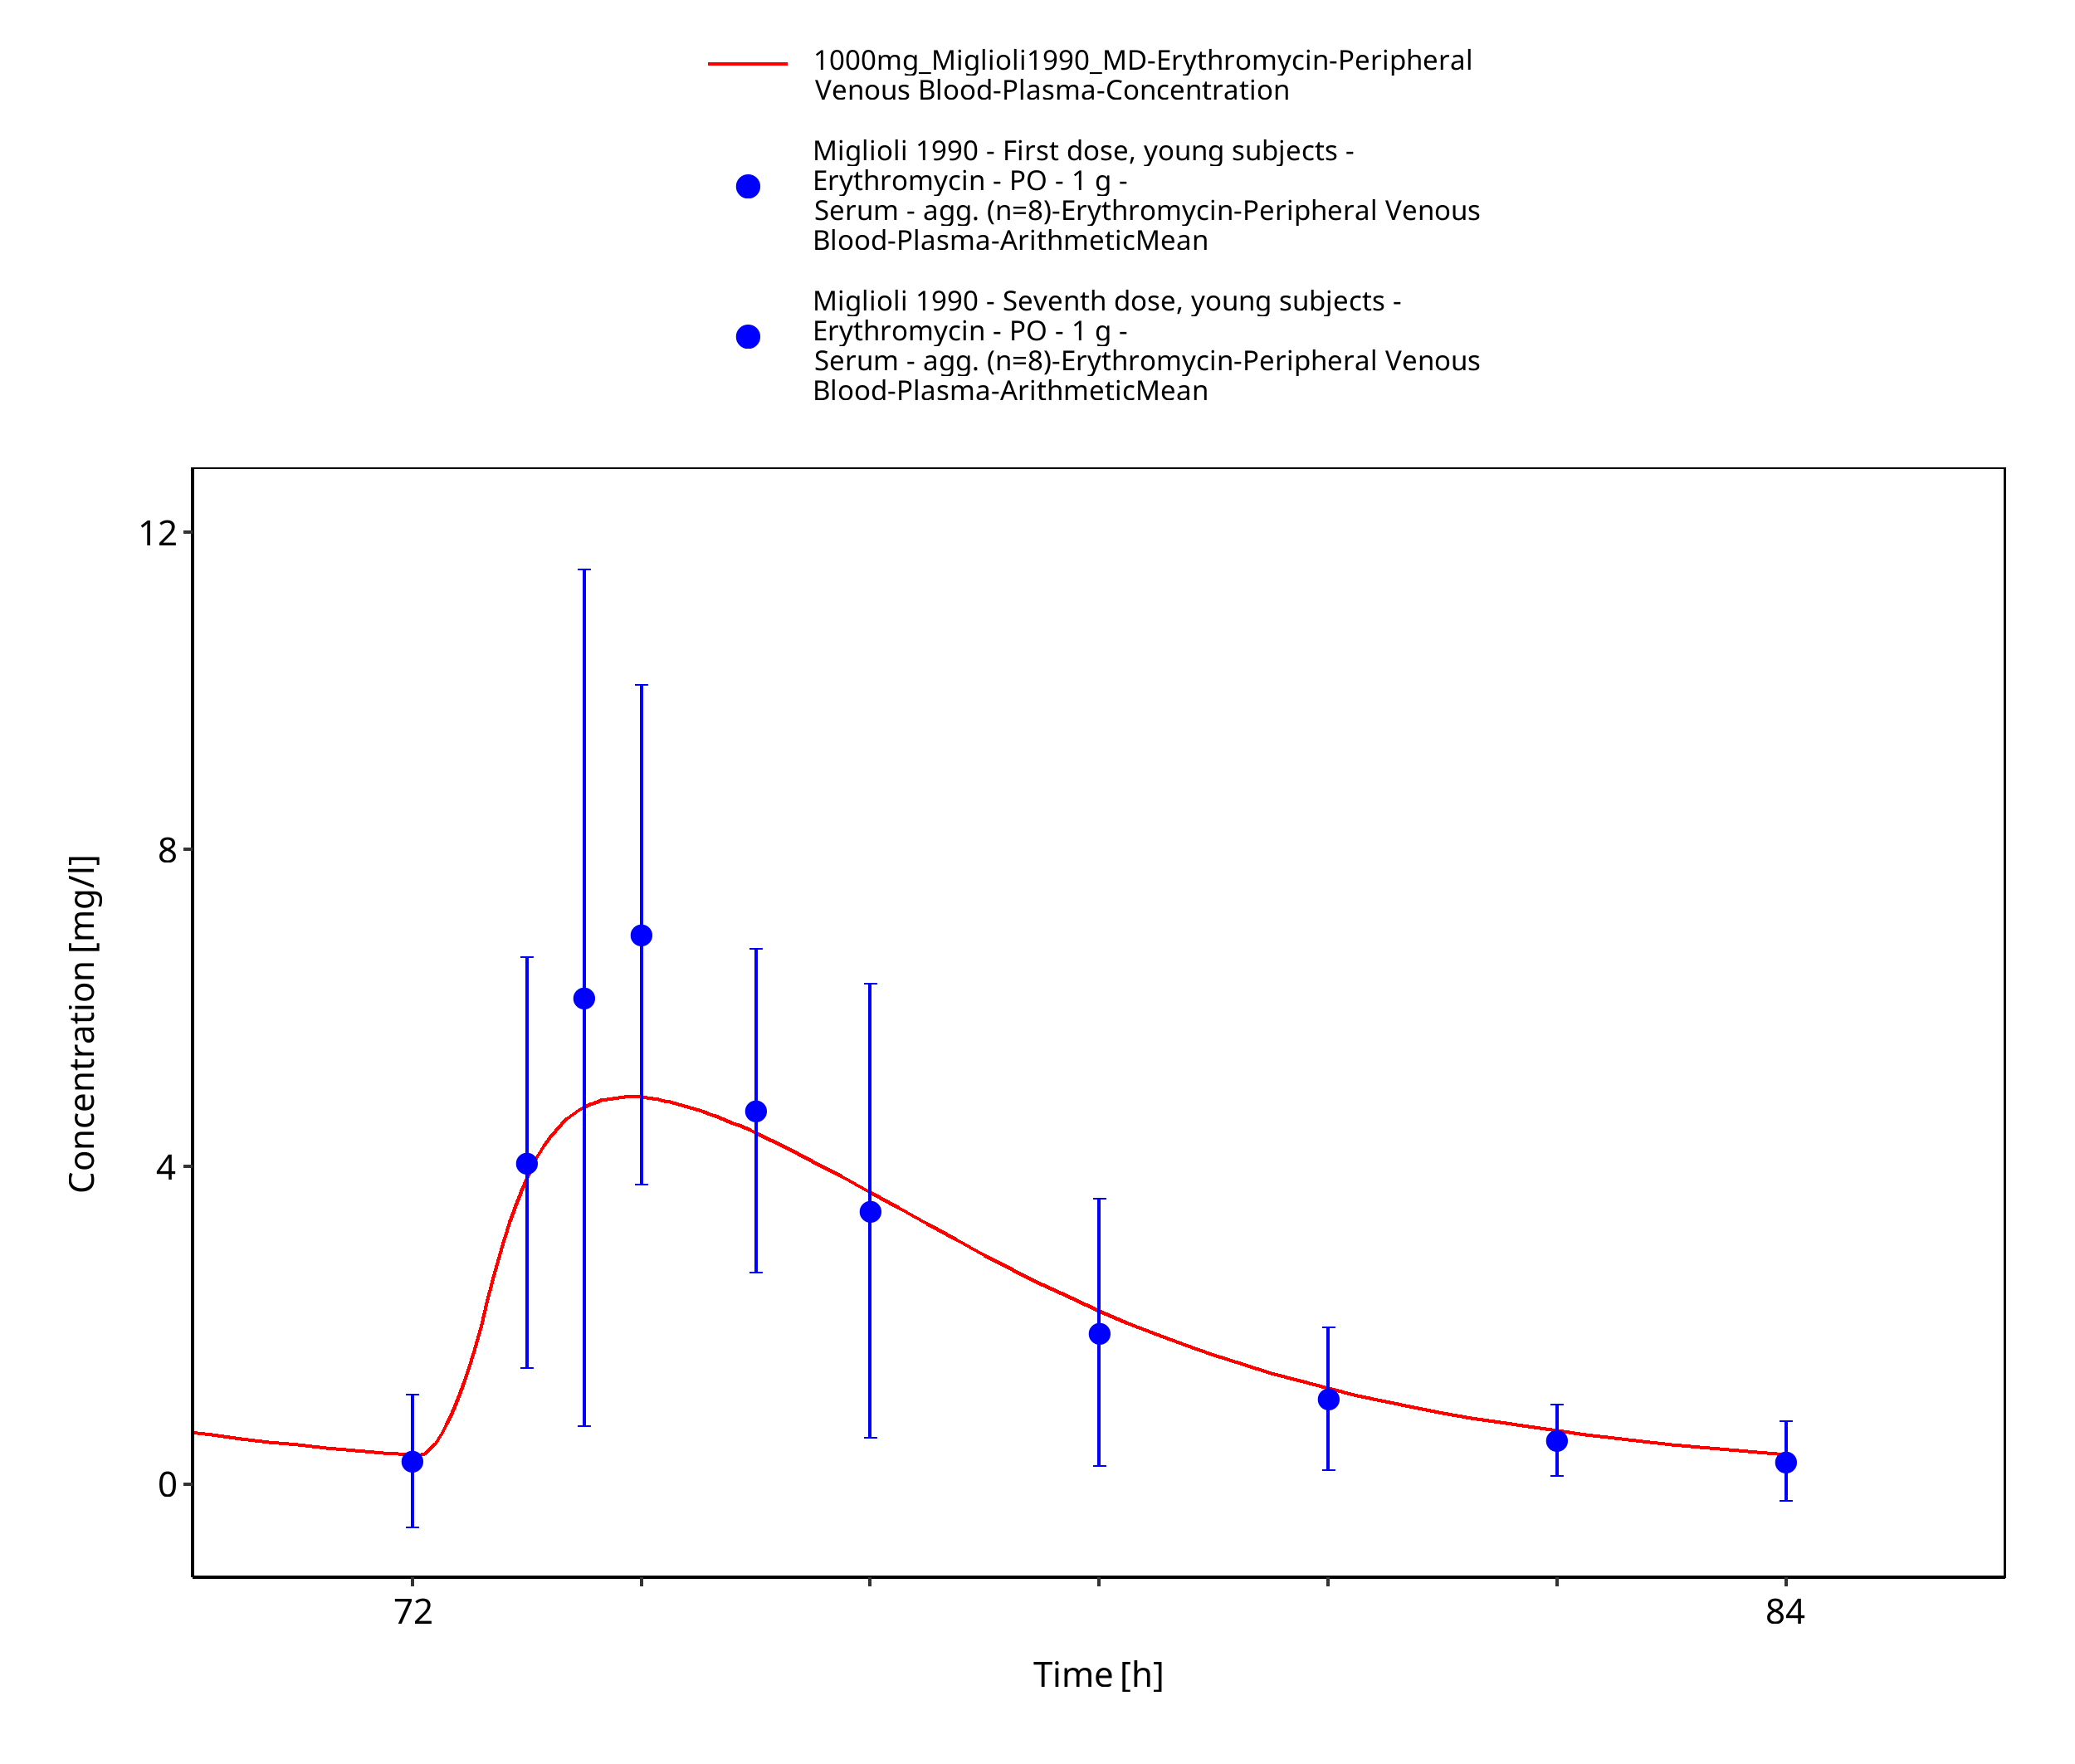
Figure 3-19: Time Profile Analysis 3
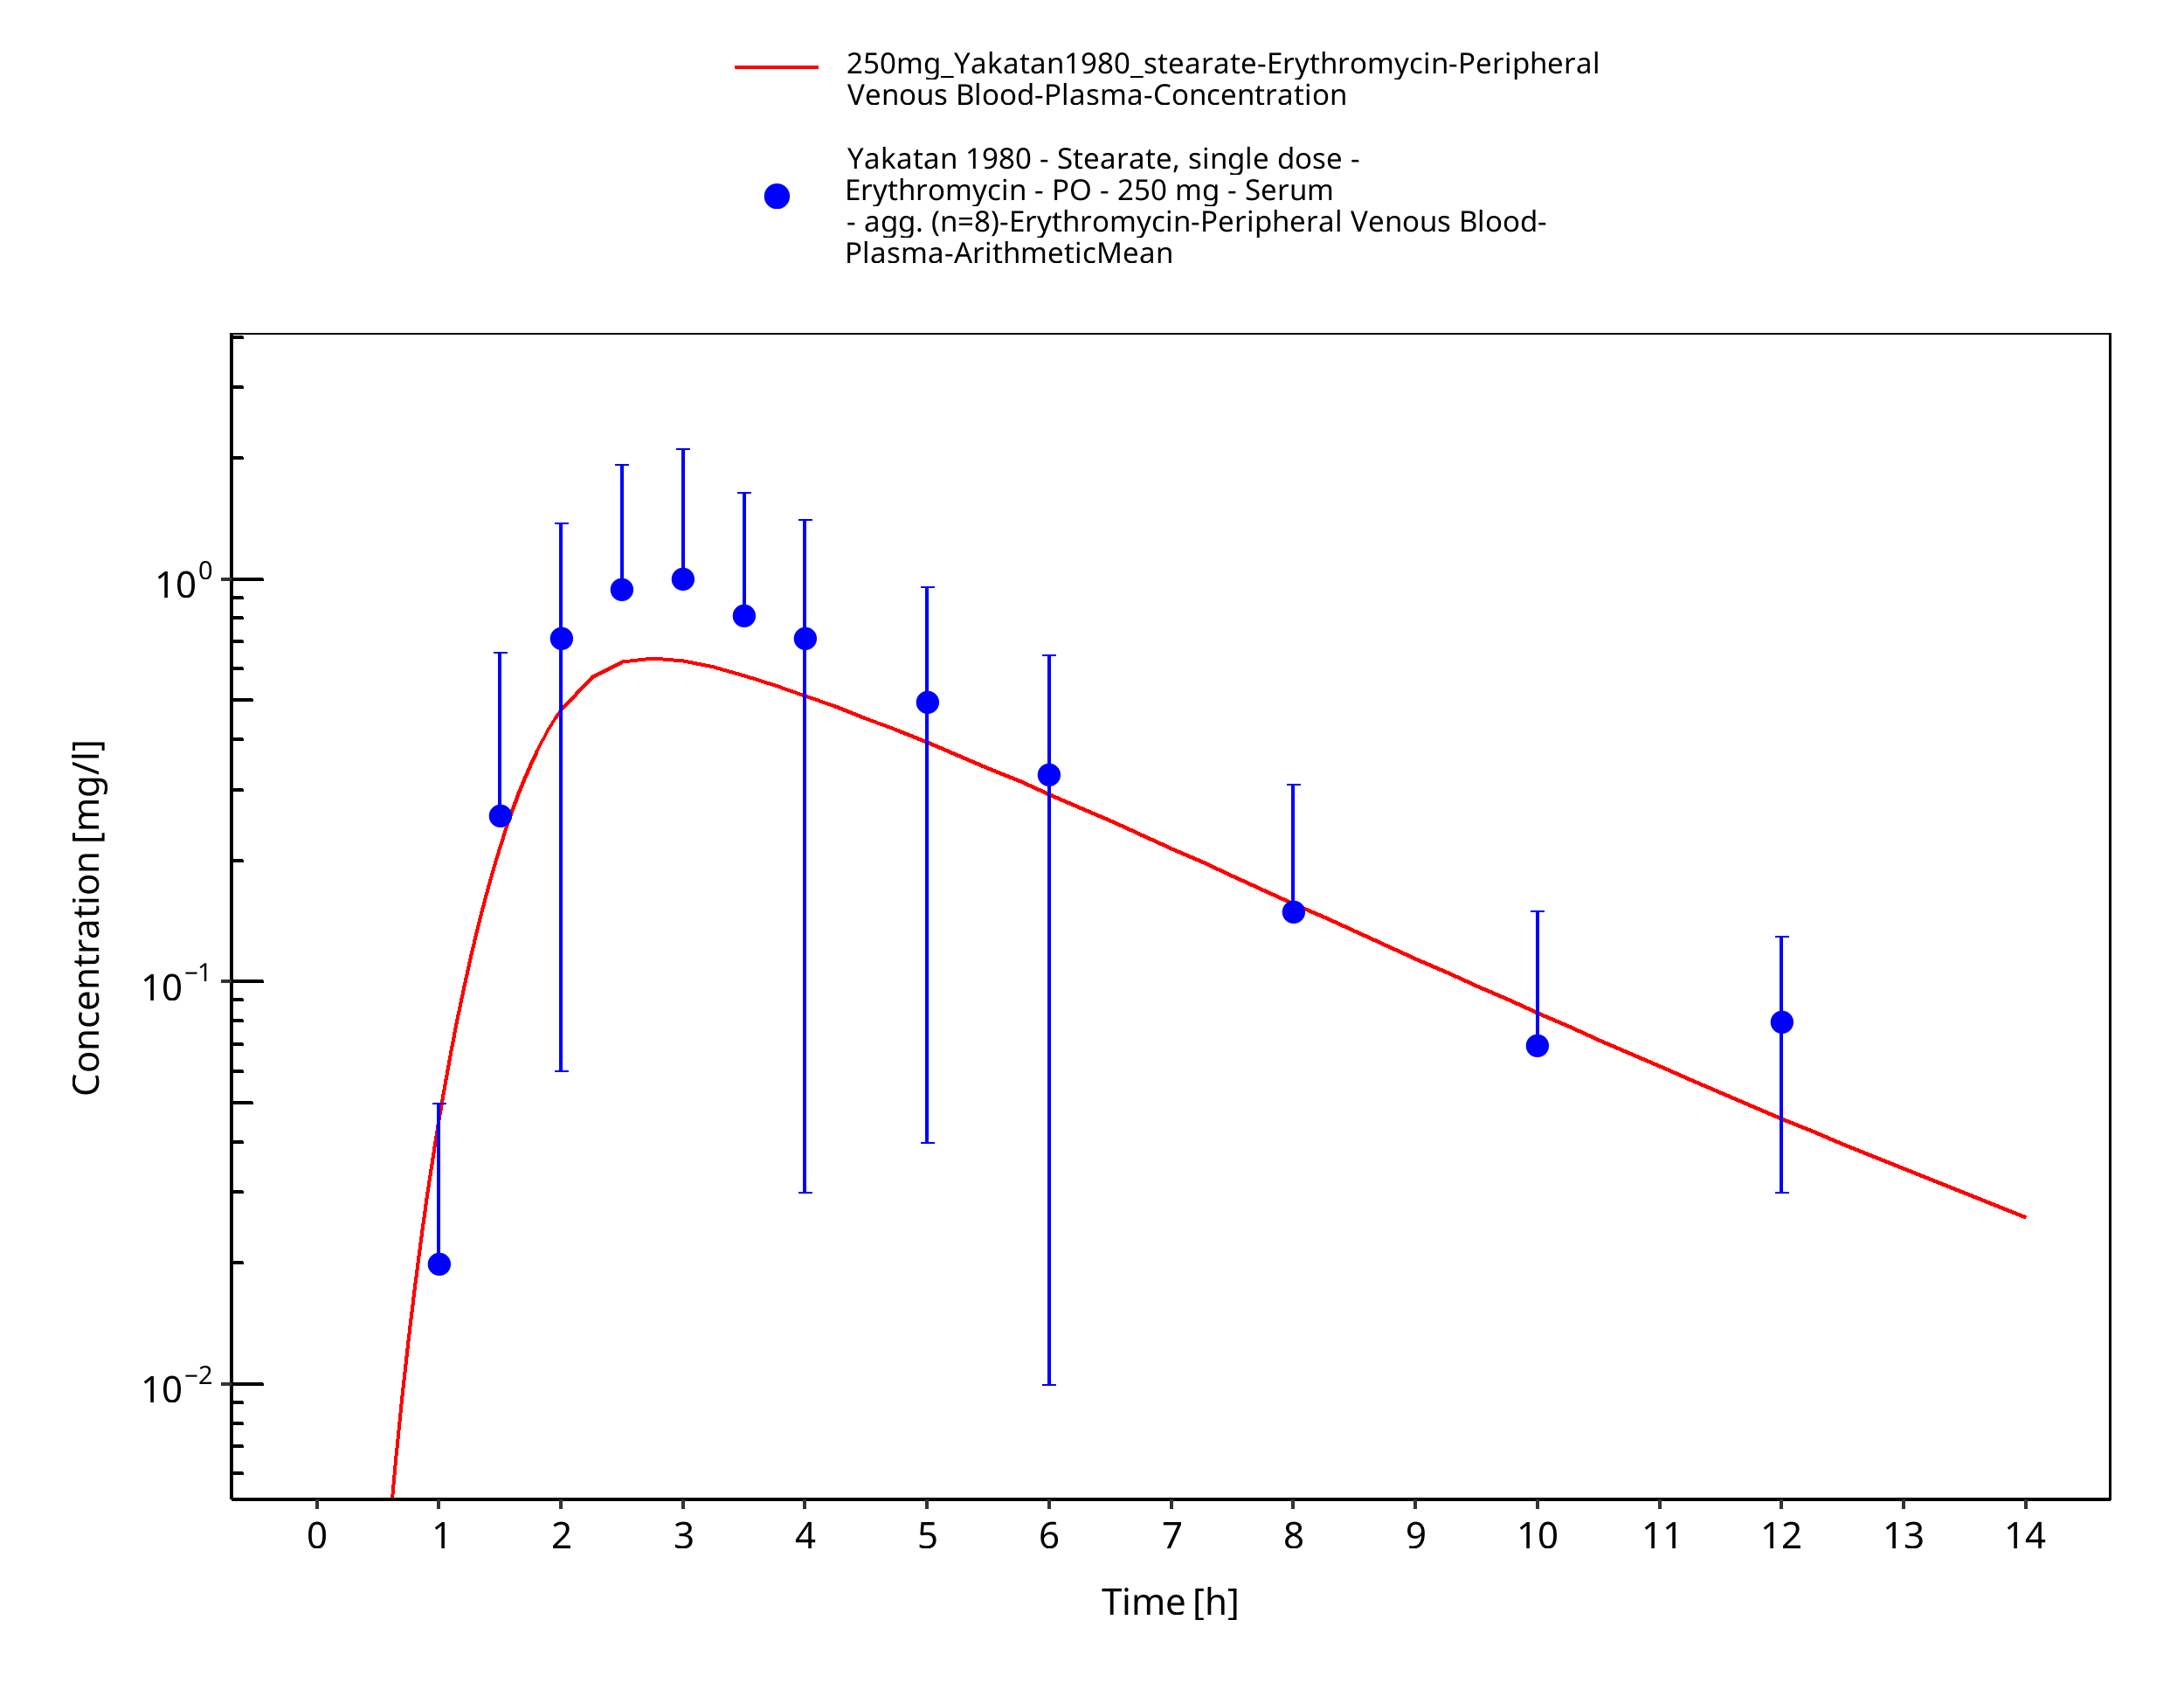
Figure 3-20: Time Profile Analysis
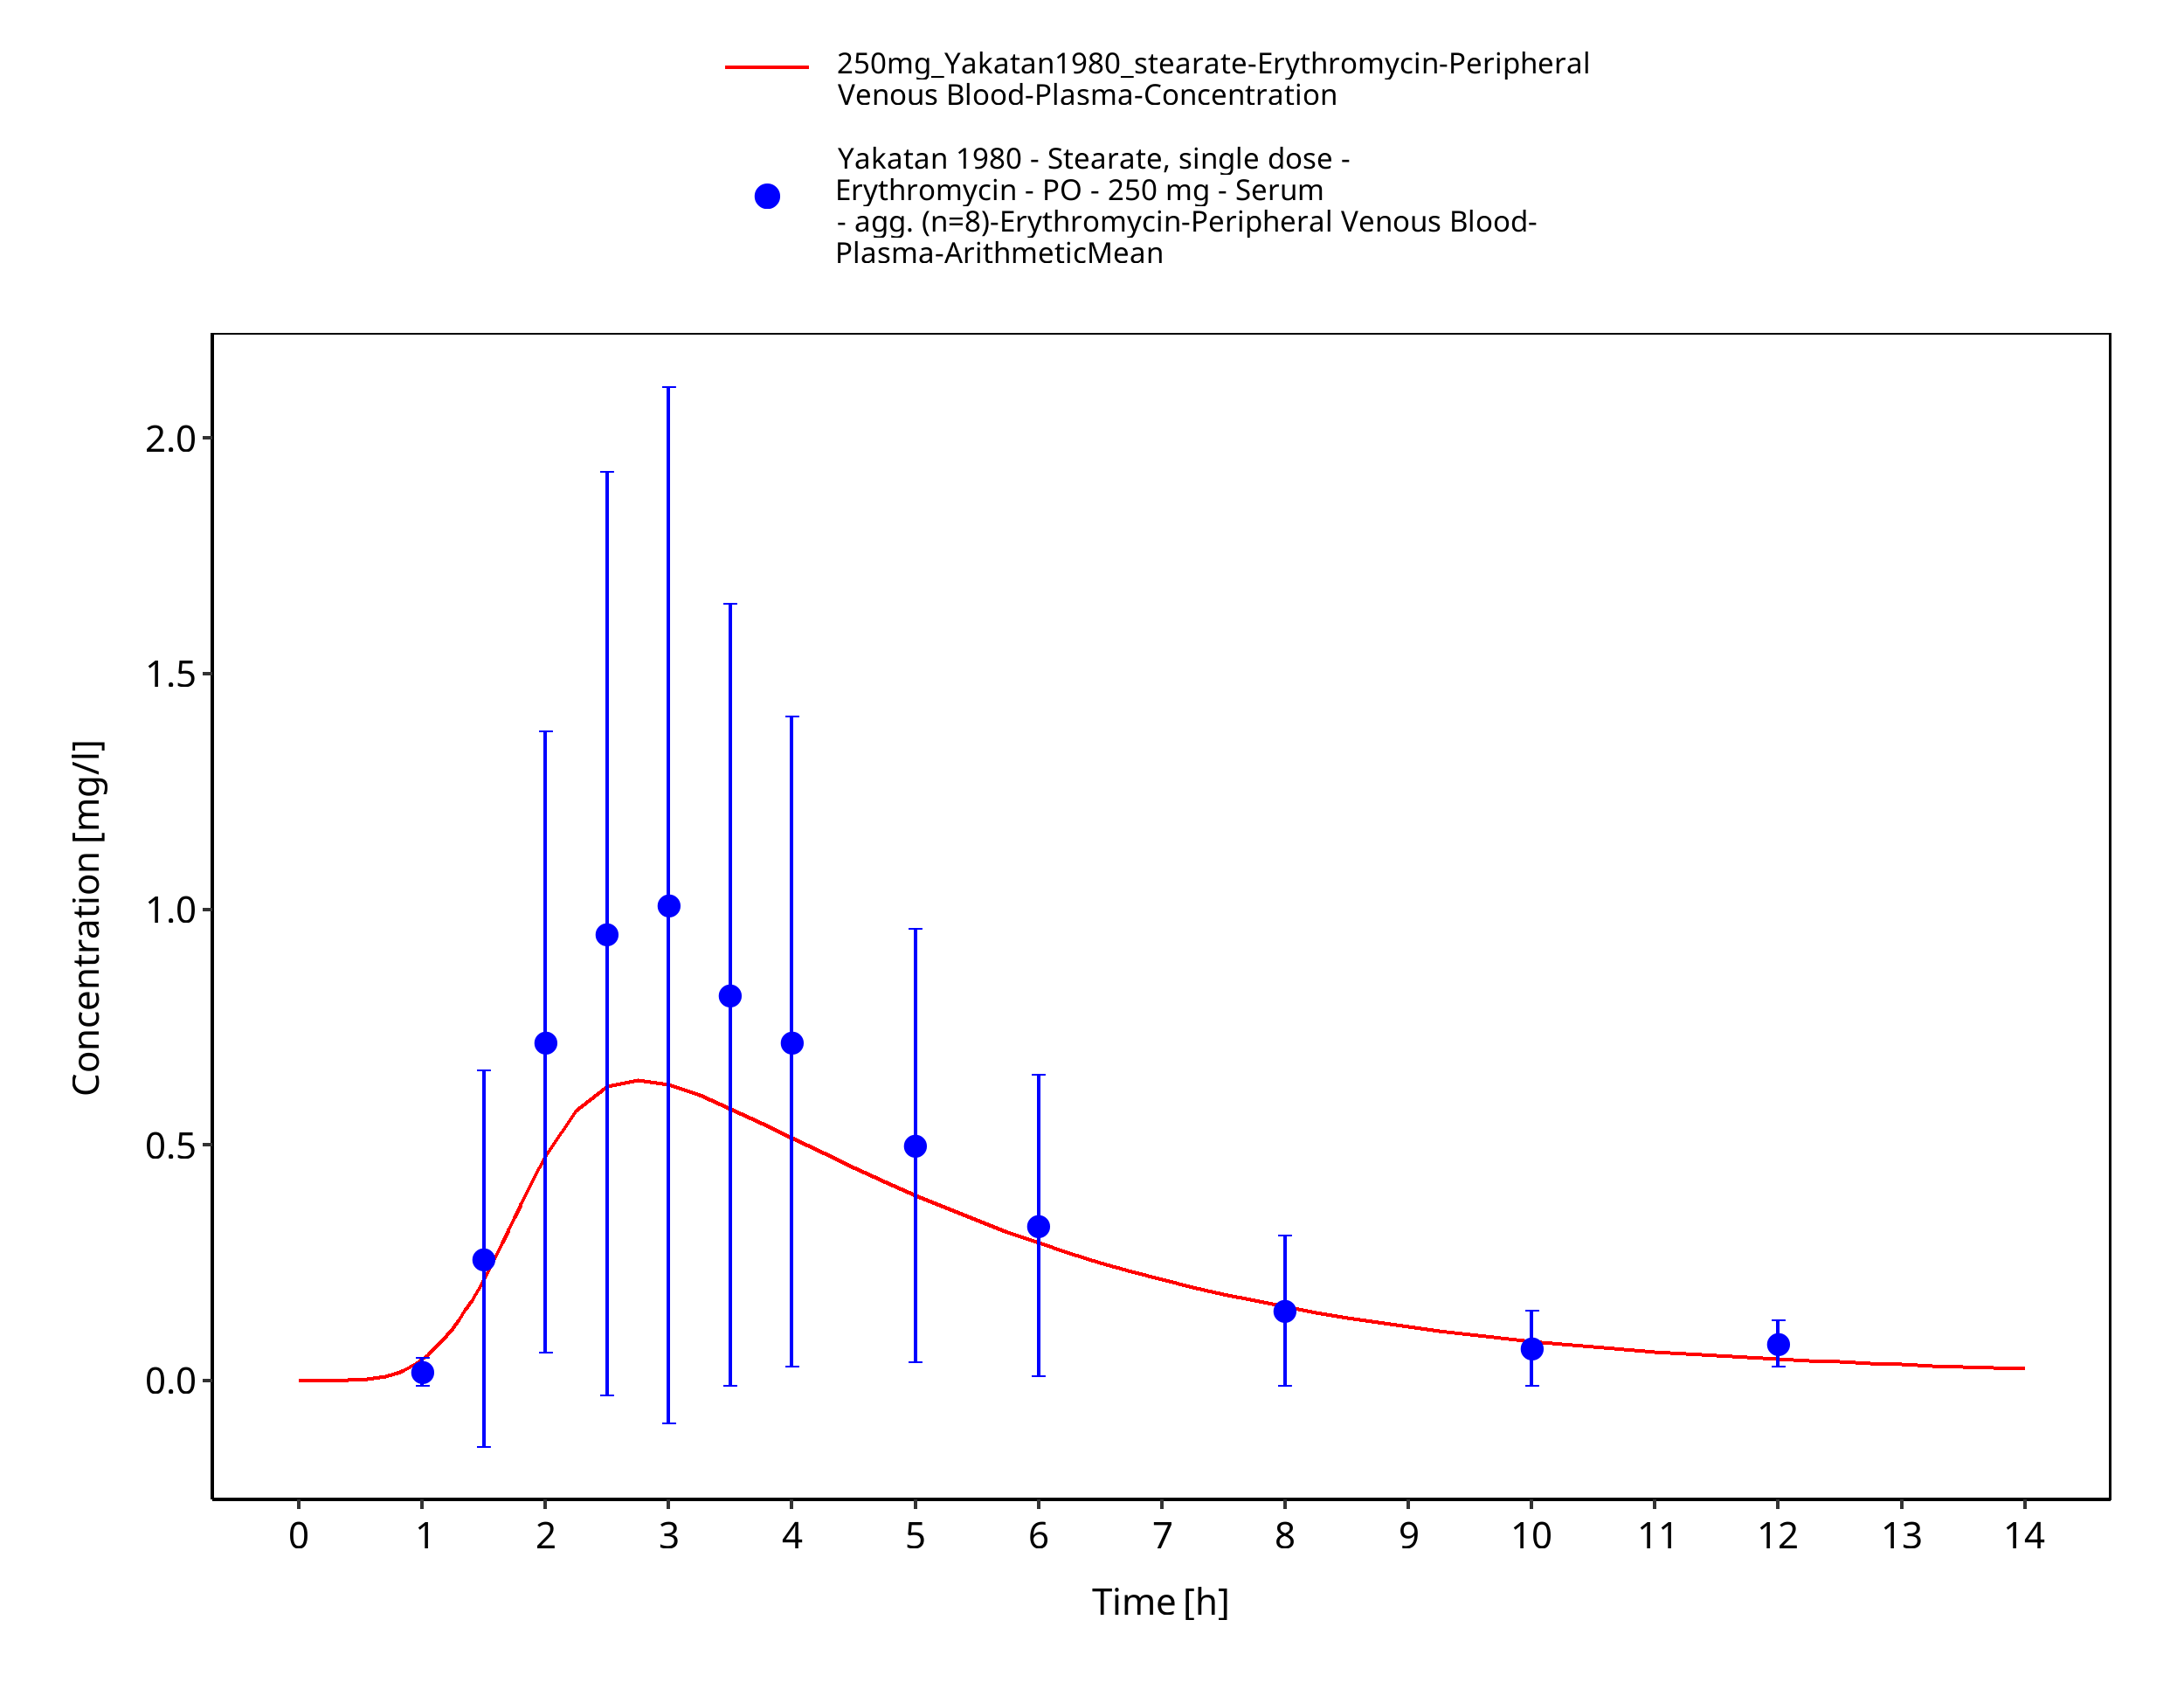
Figure 3-21: Time Profile Analysis 1
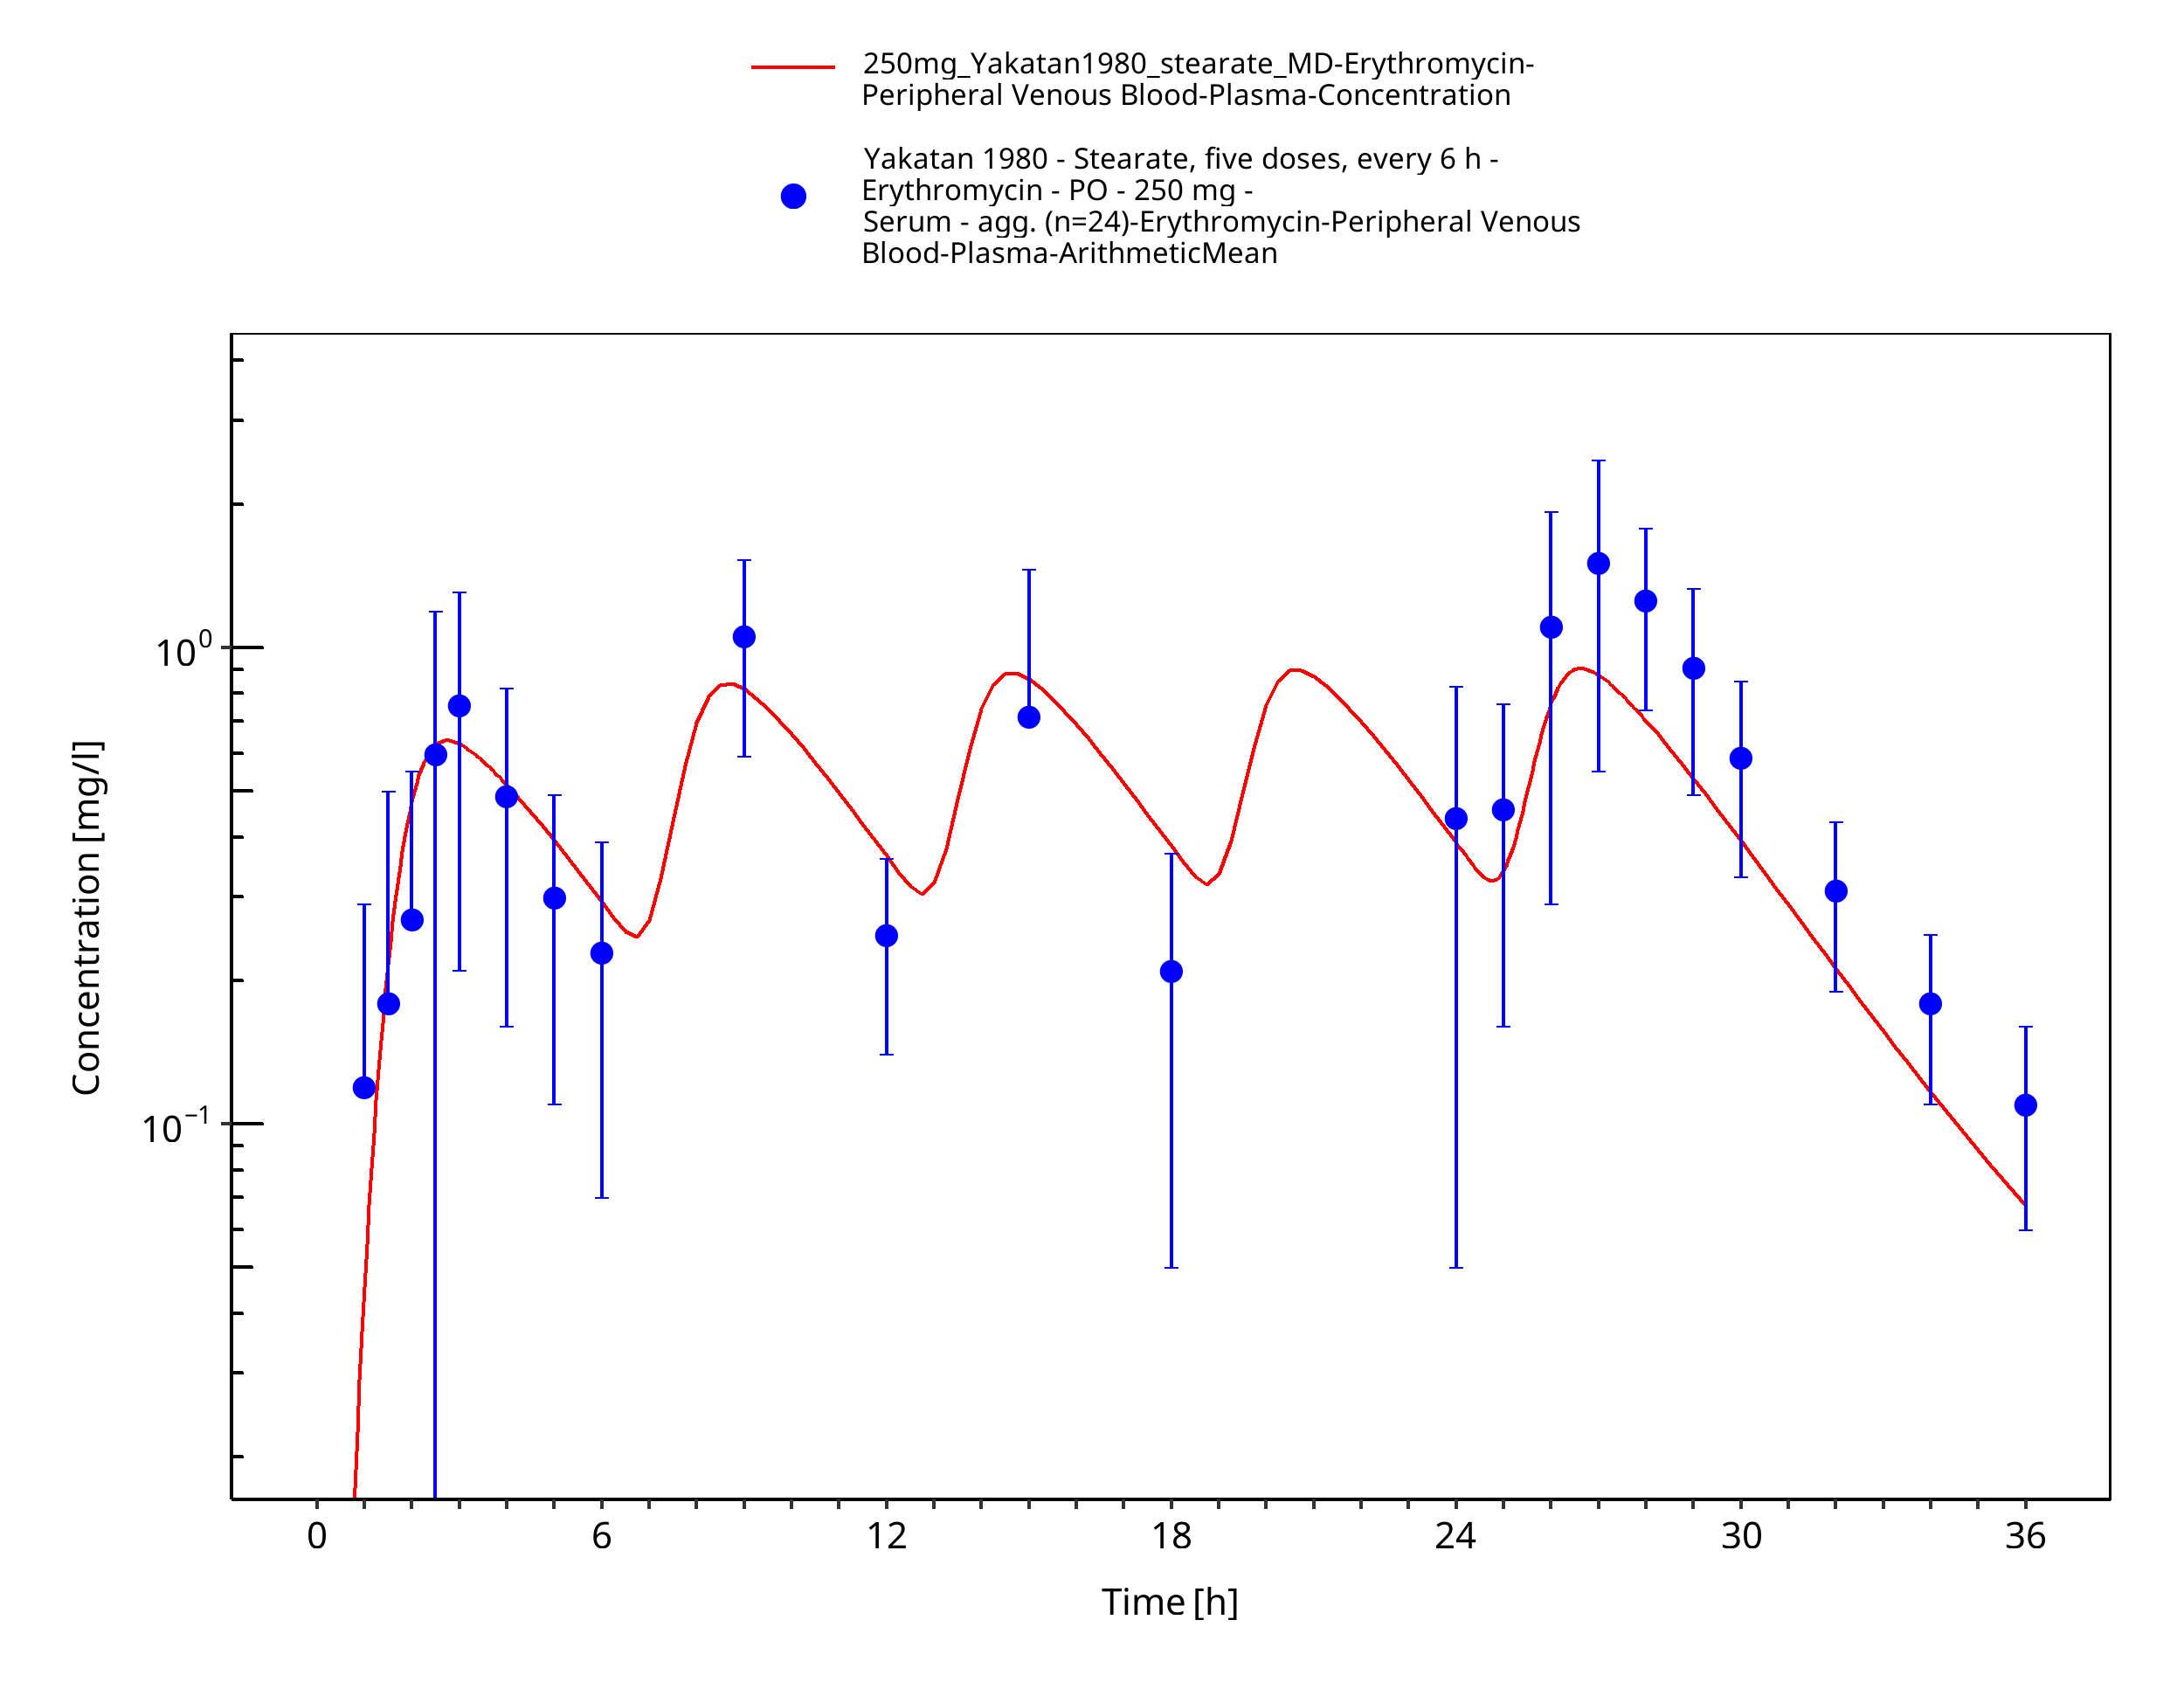
Figure 3-22: Time Profile Analysis
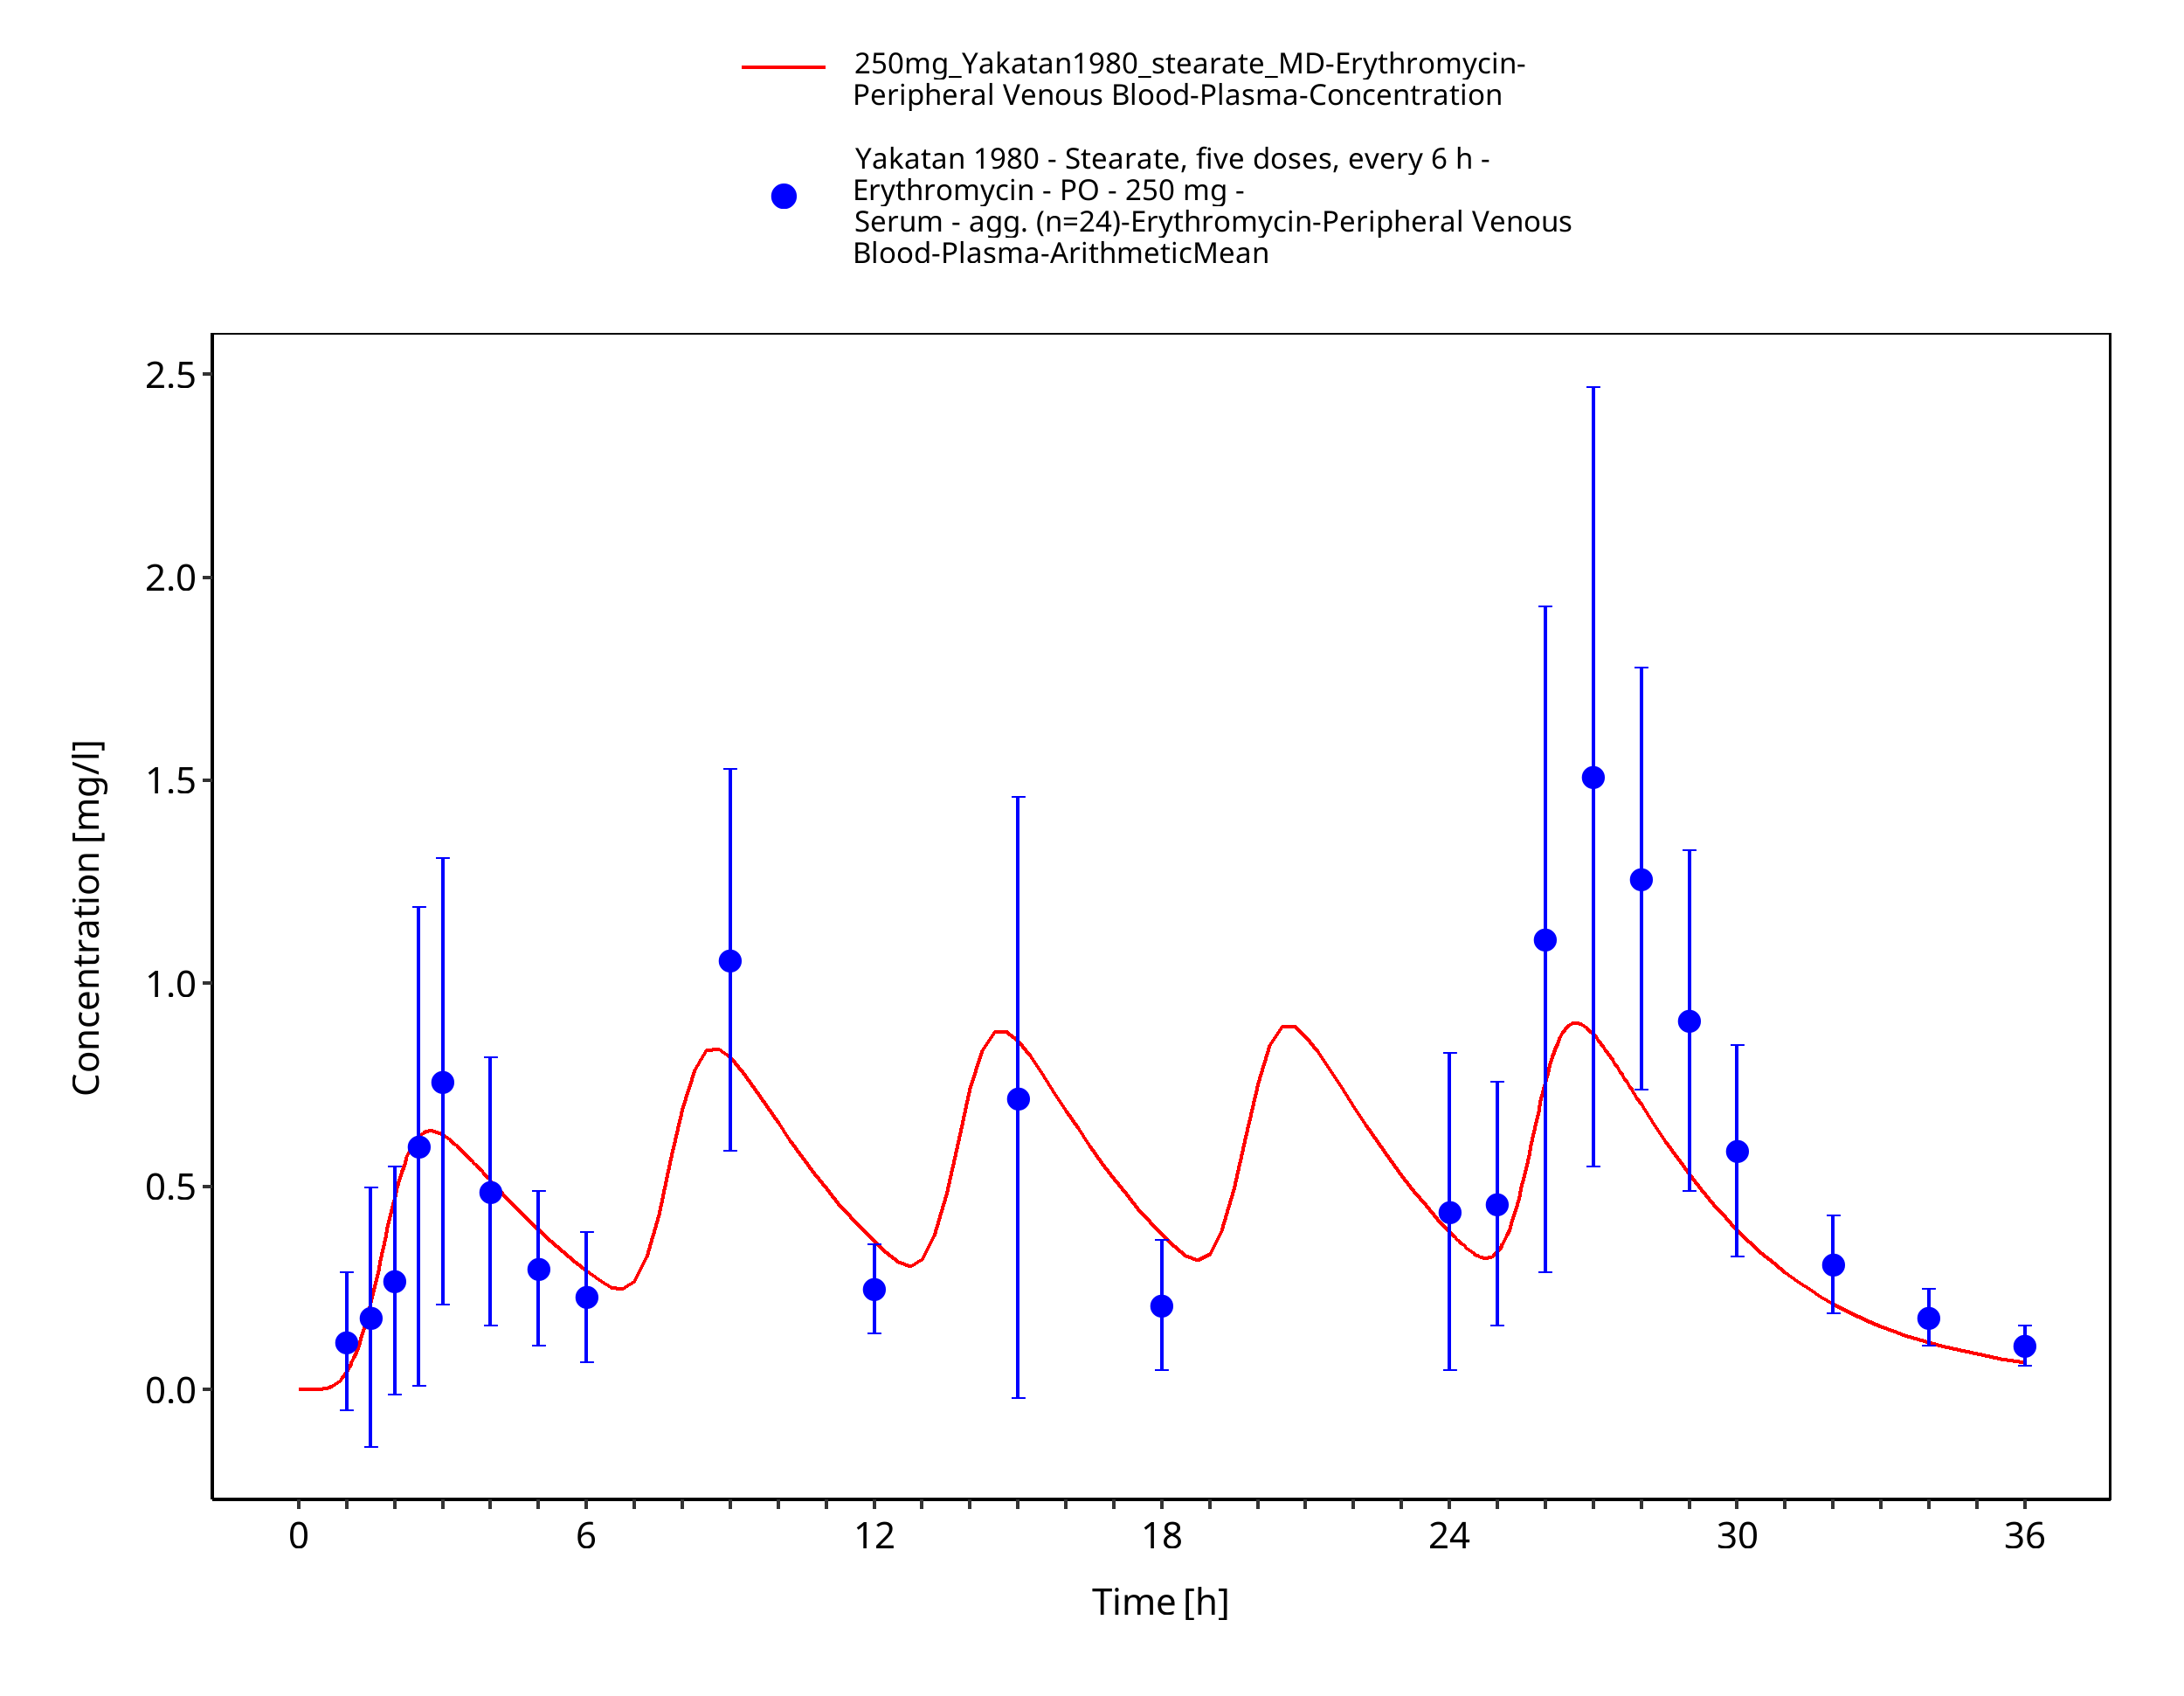
Figure 3-23: Time Profile Analysis 1
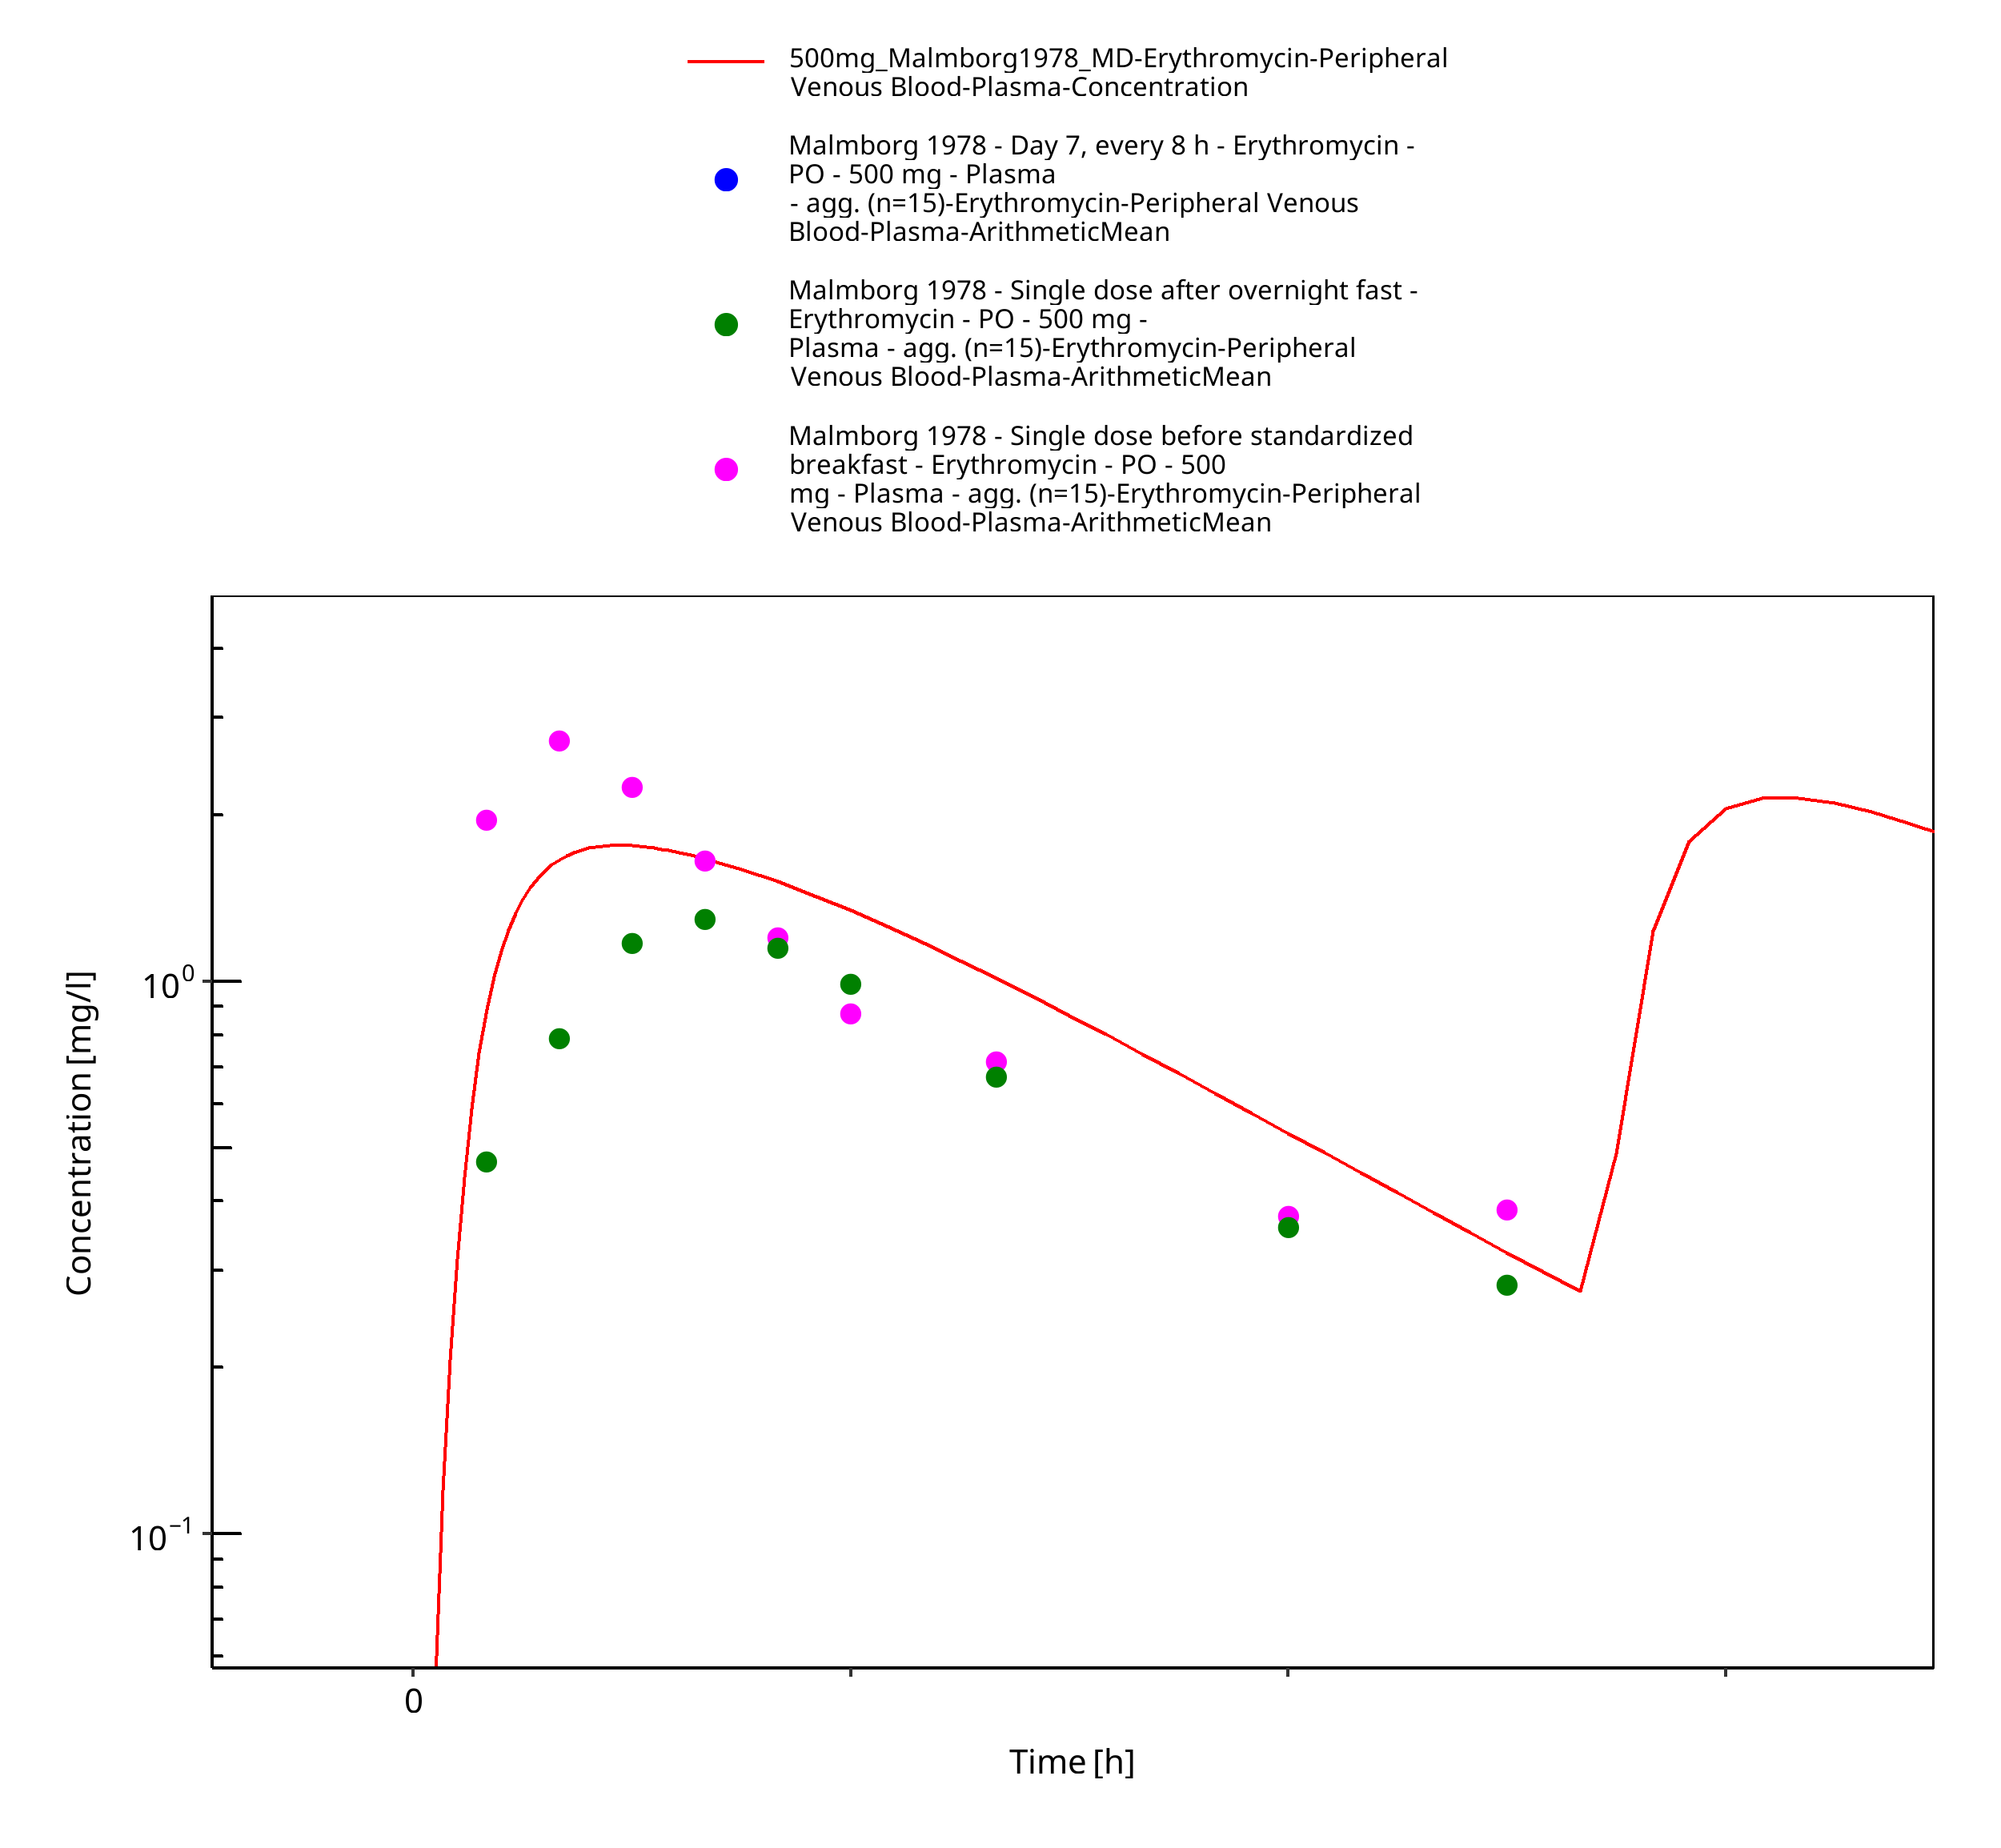
Figure 3-24: Time Profile Analysis
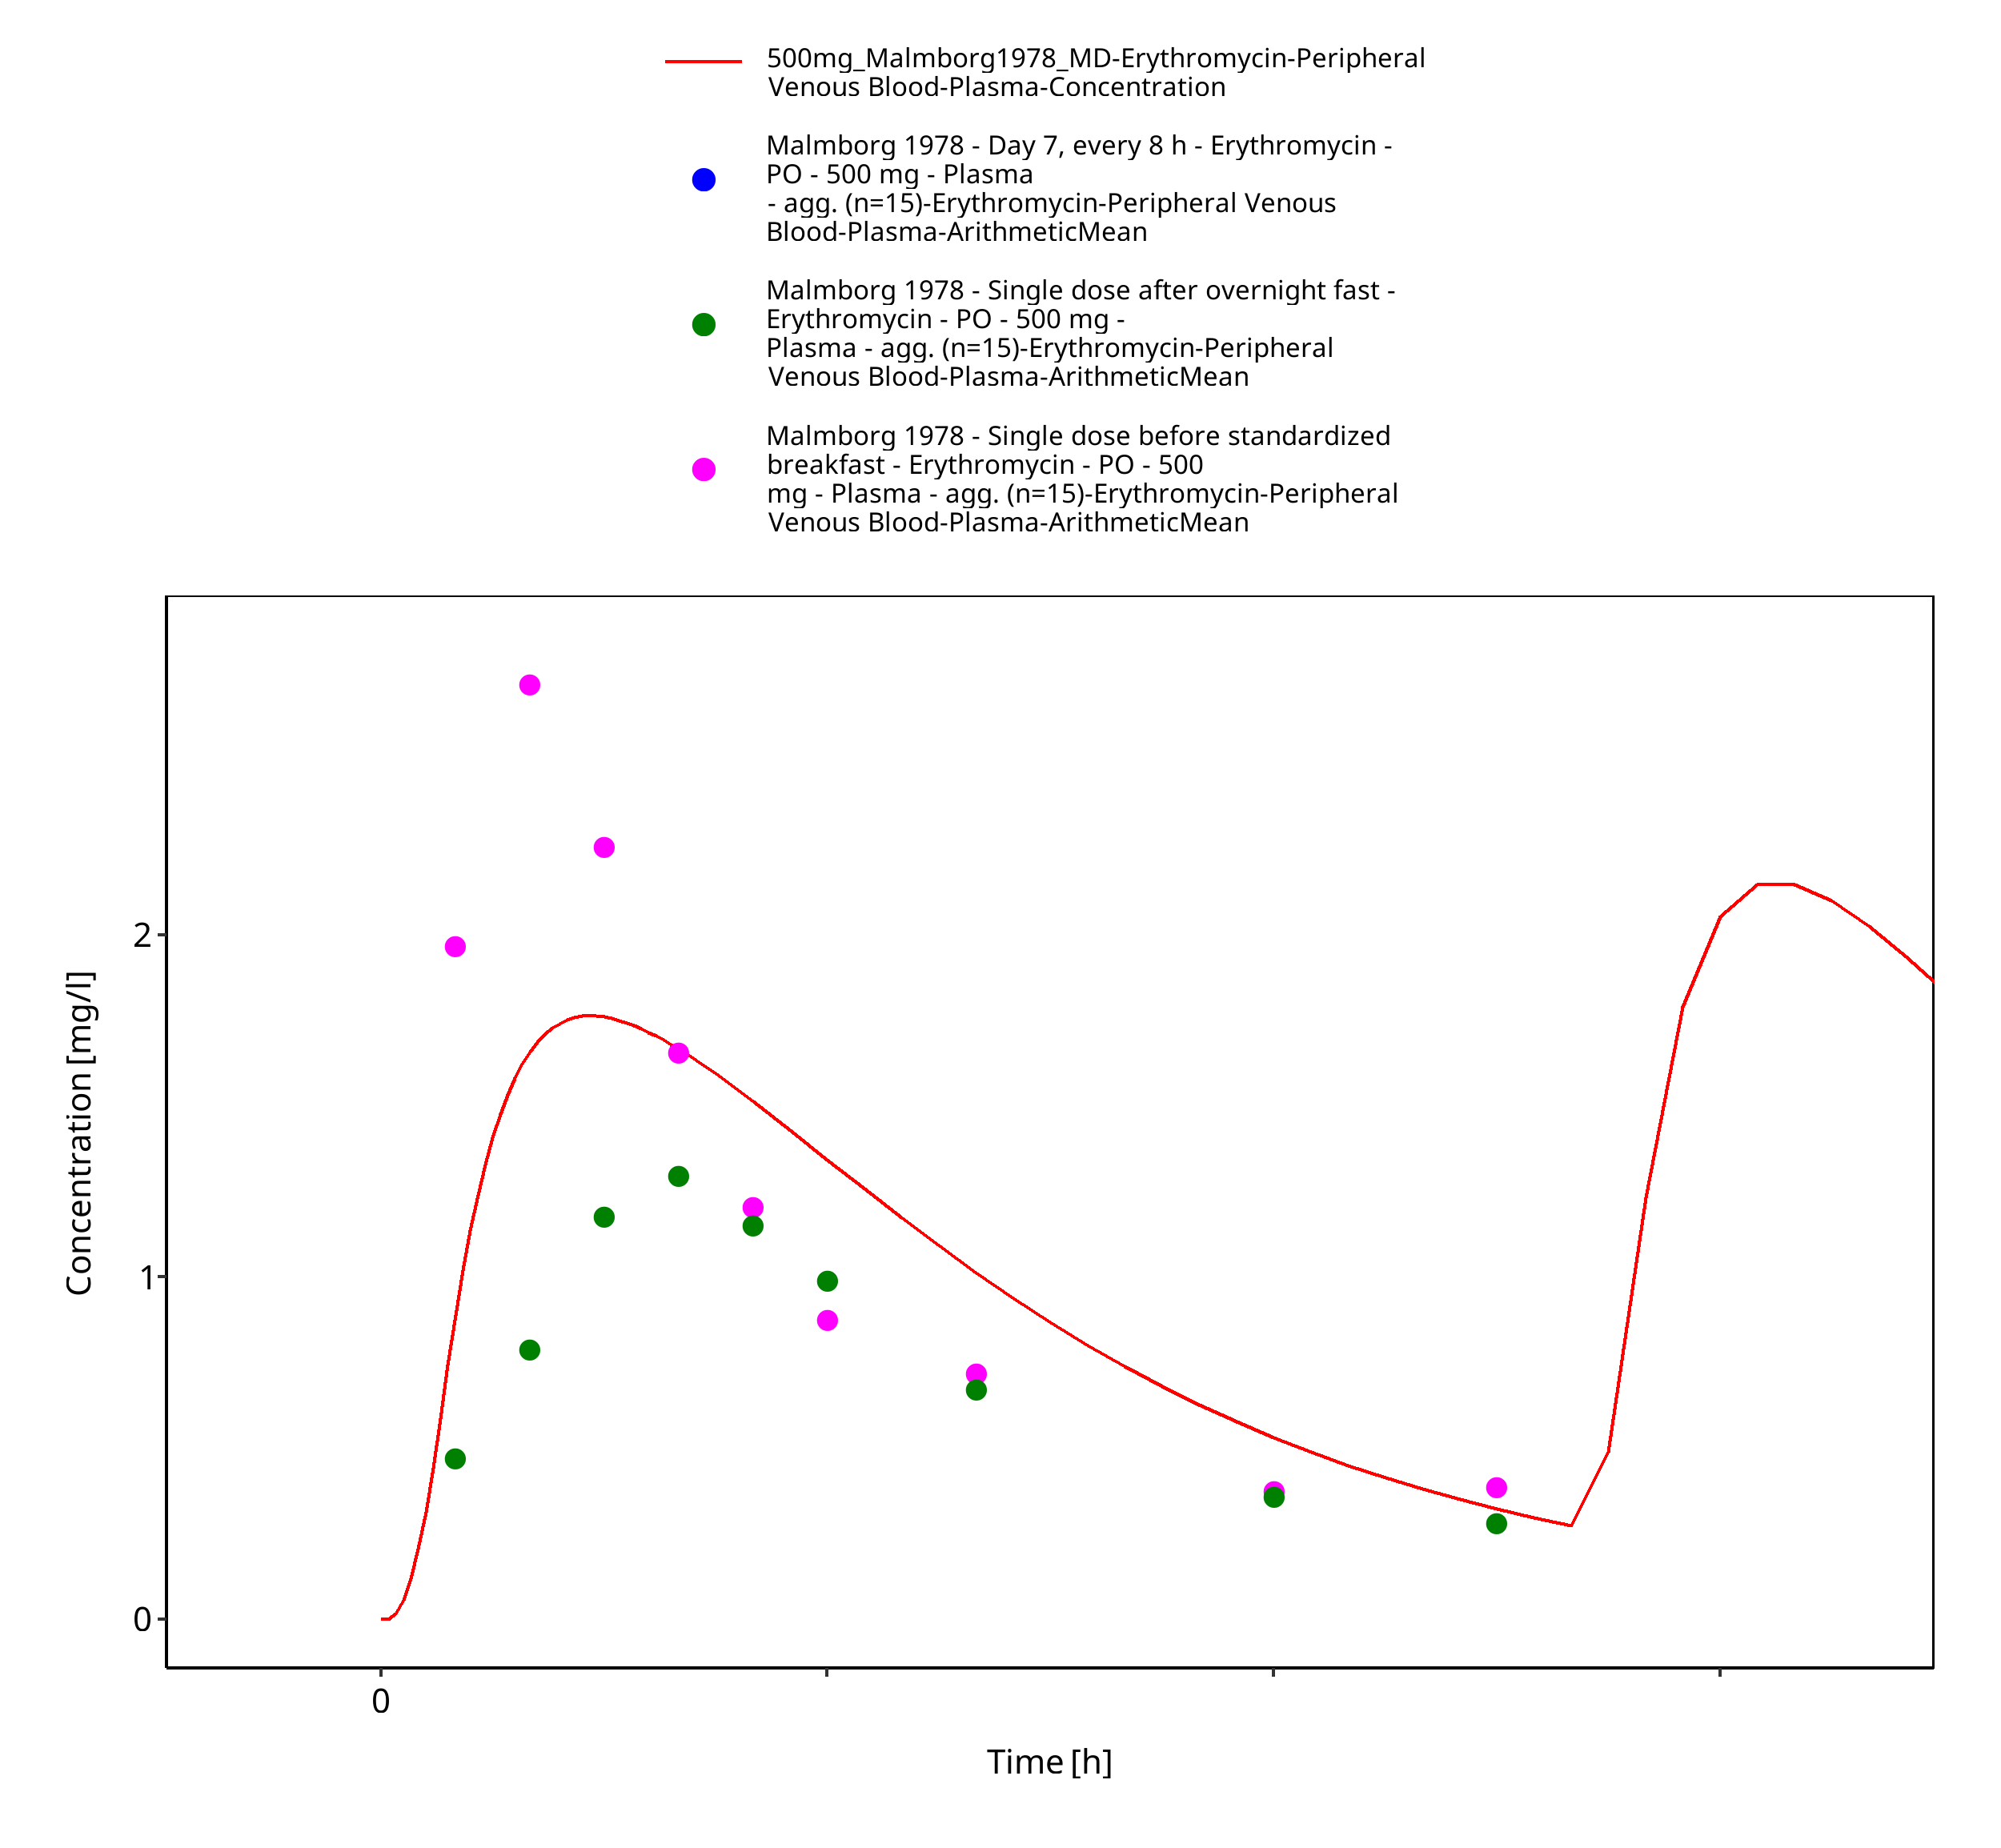
Figure 3-25: Time Profile Analysis 1
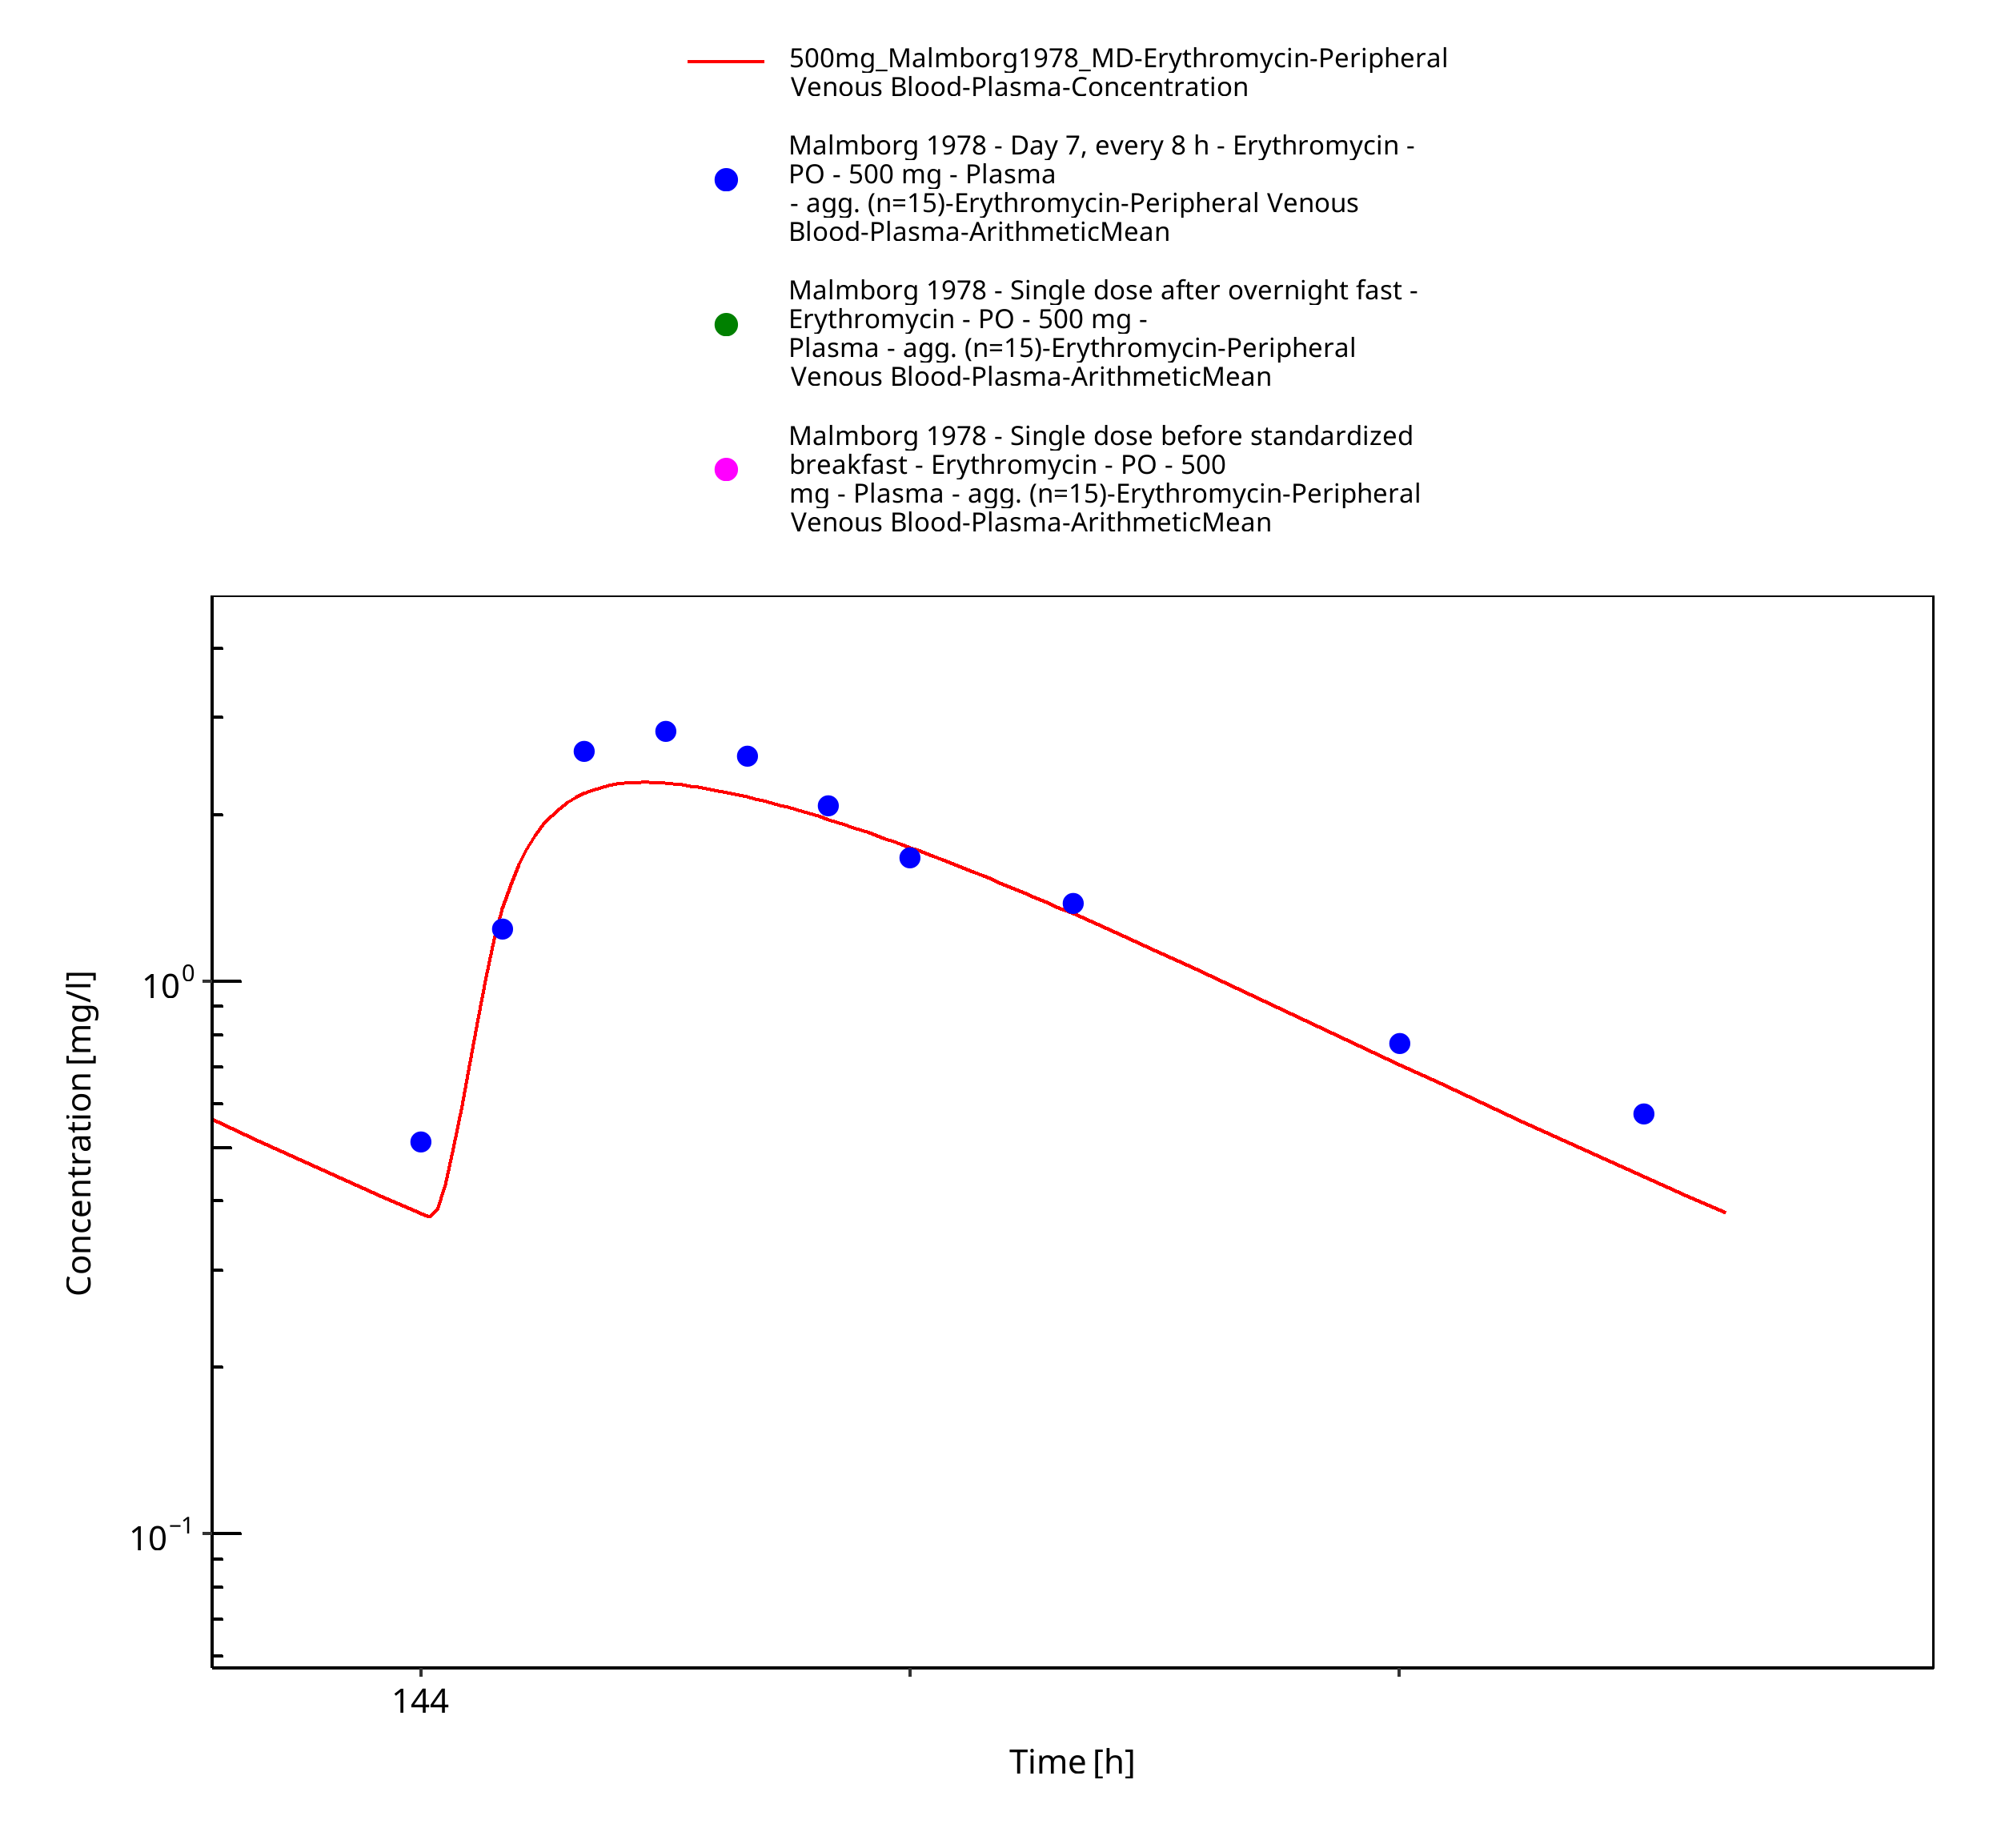
Figure 3-26: Time Profile Analysis 2
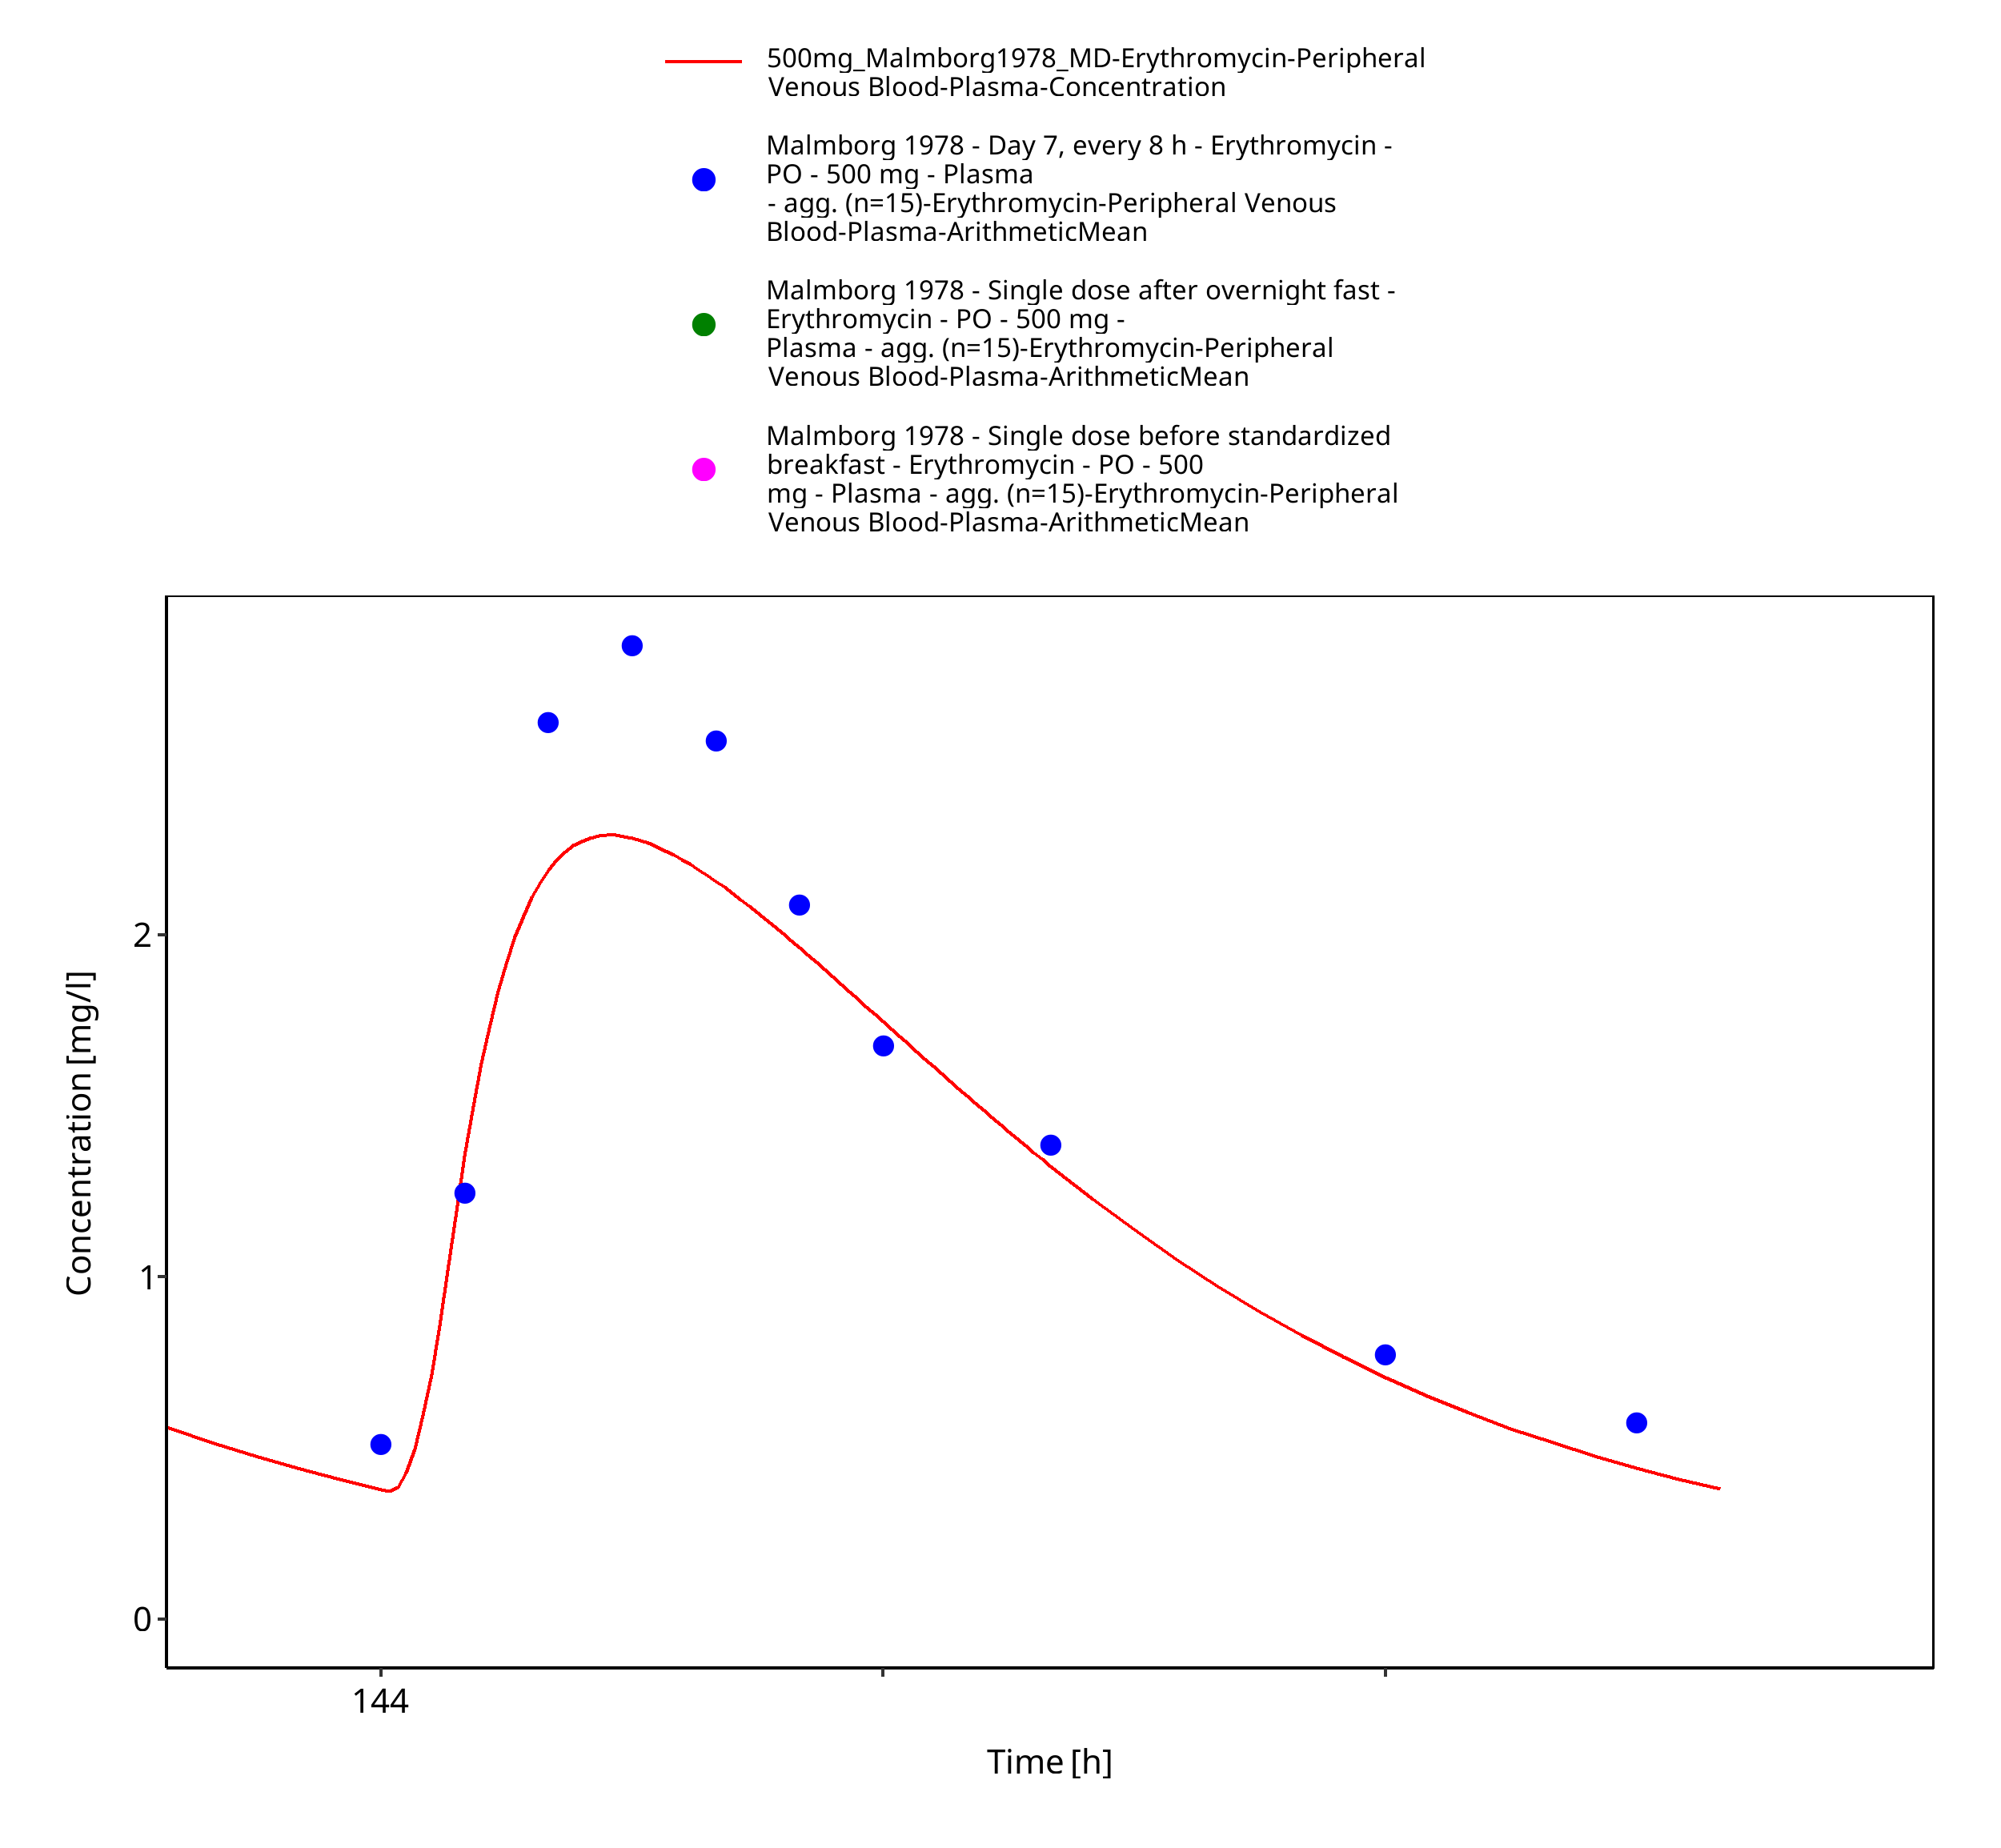
Figure 3-27: Time Profile Analysis 3
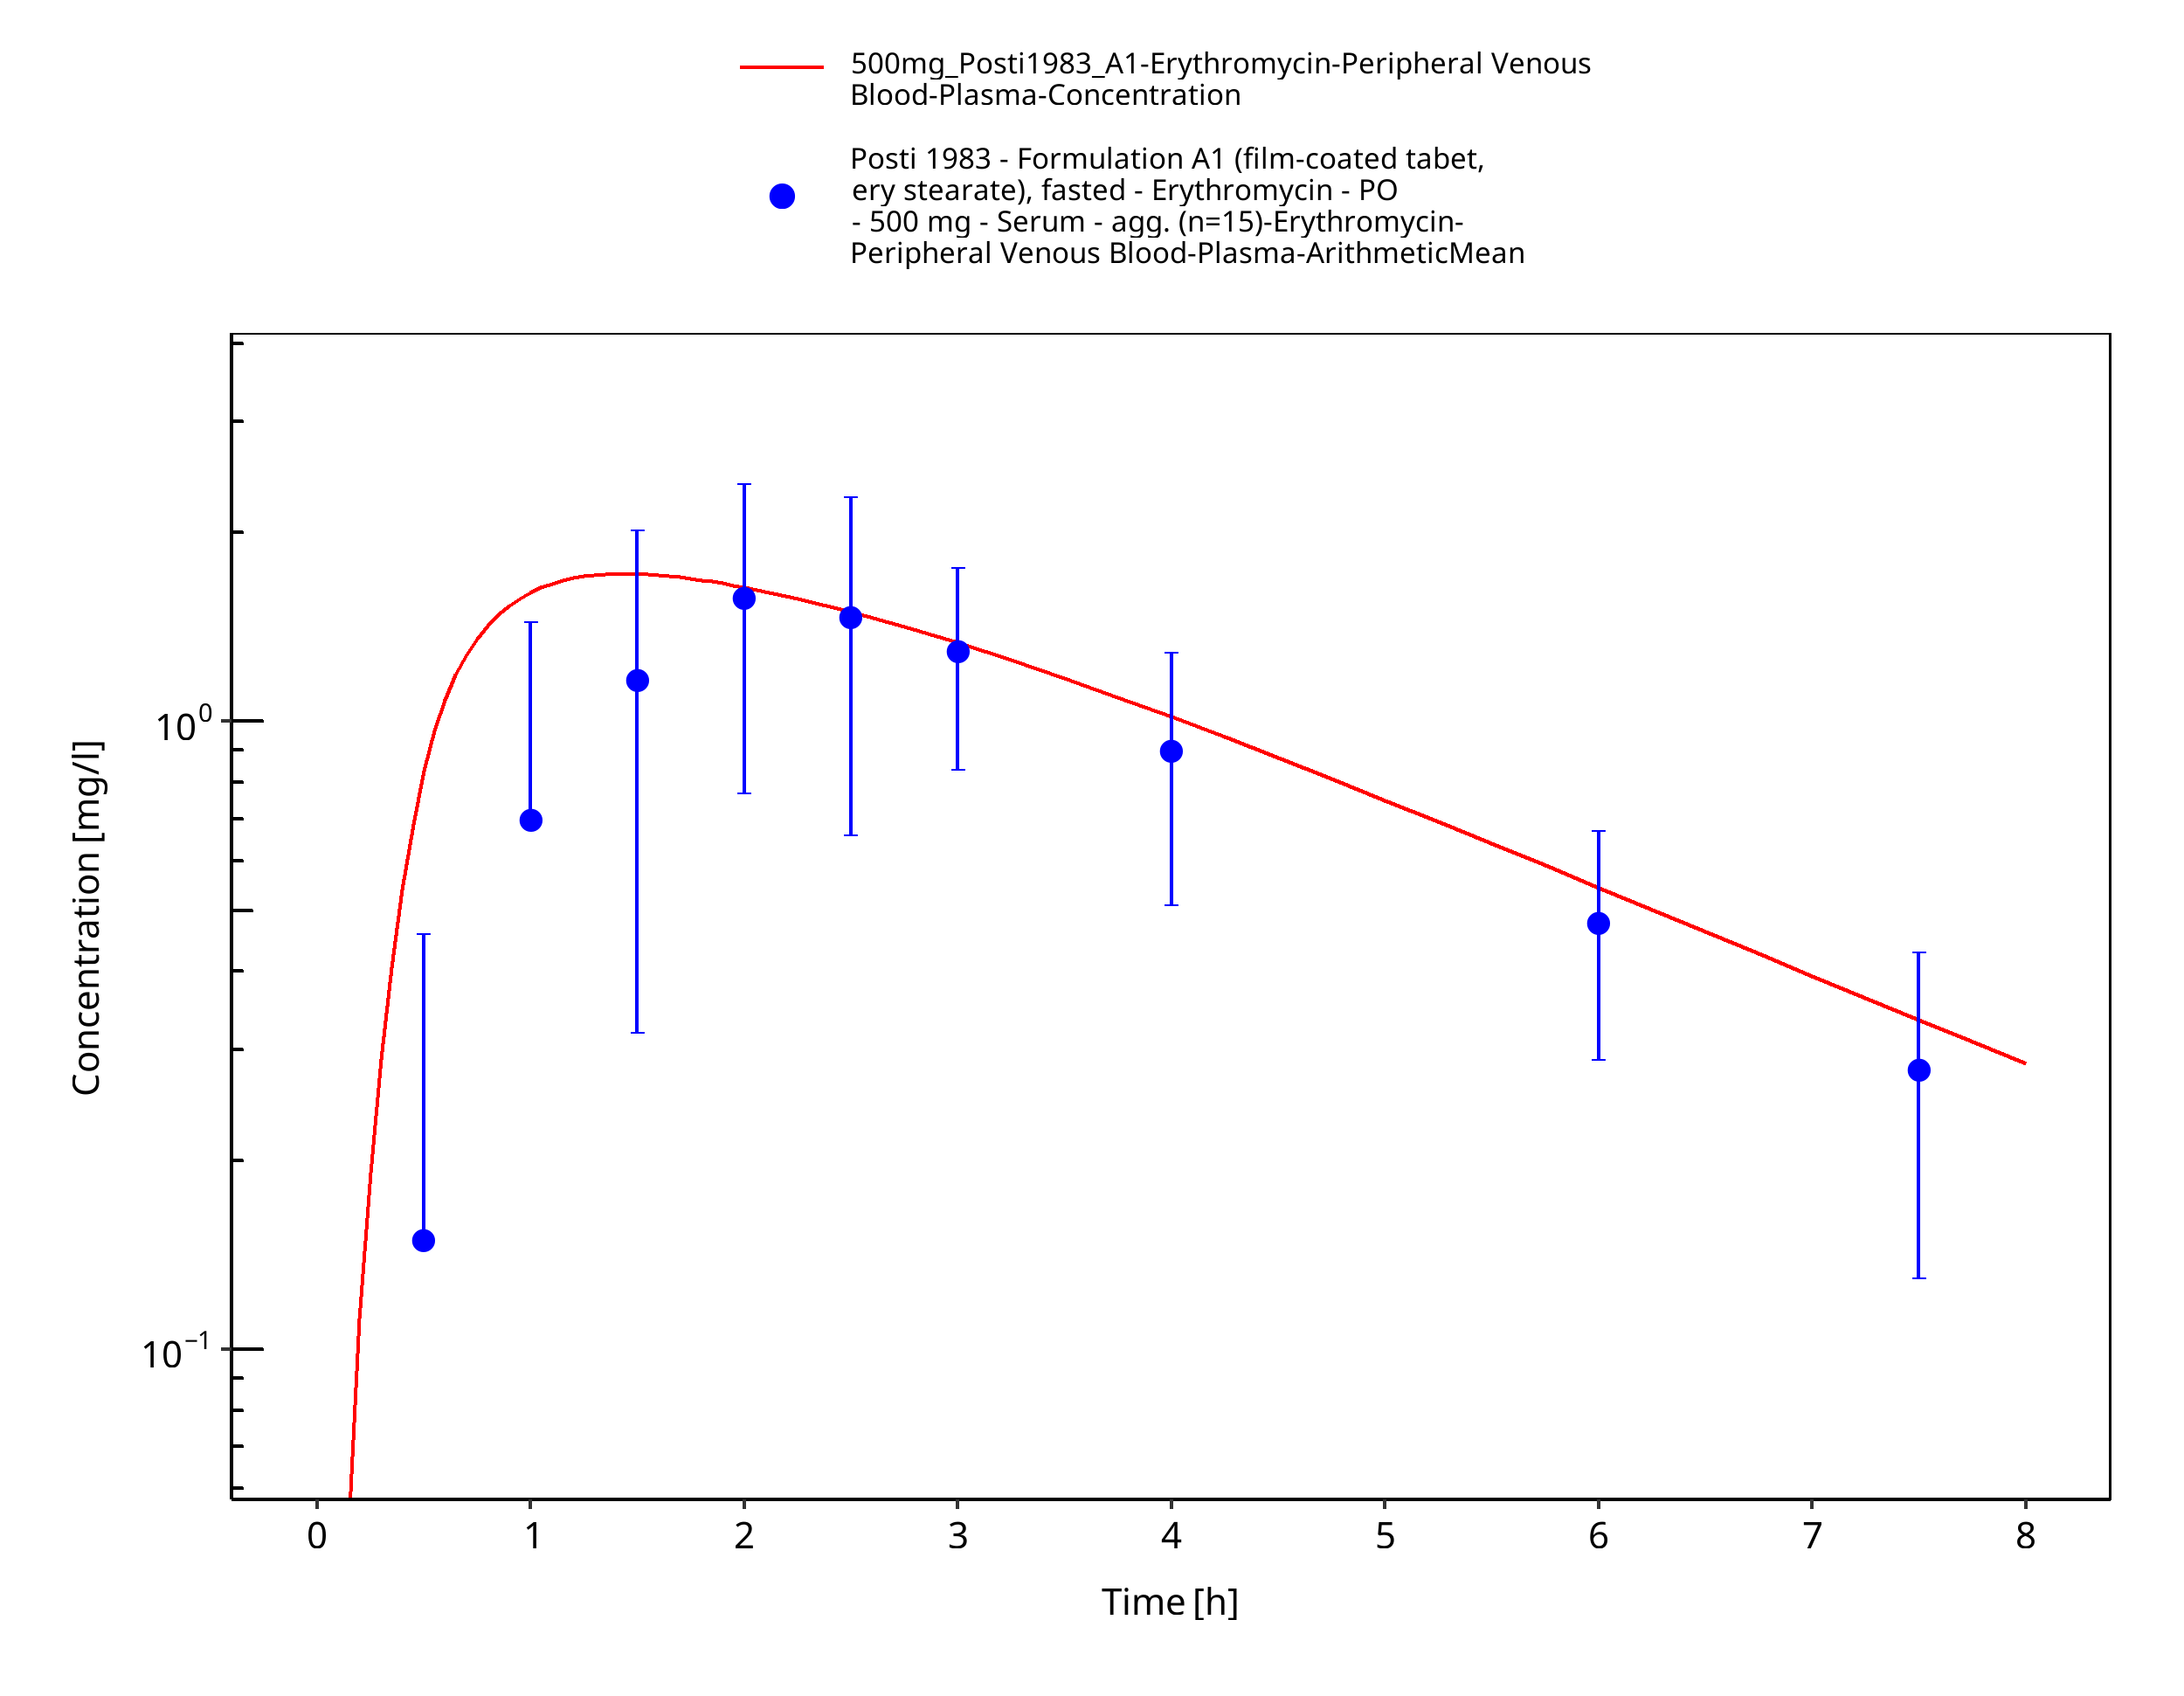
Figure 3-28: Time Profile Analysis
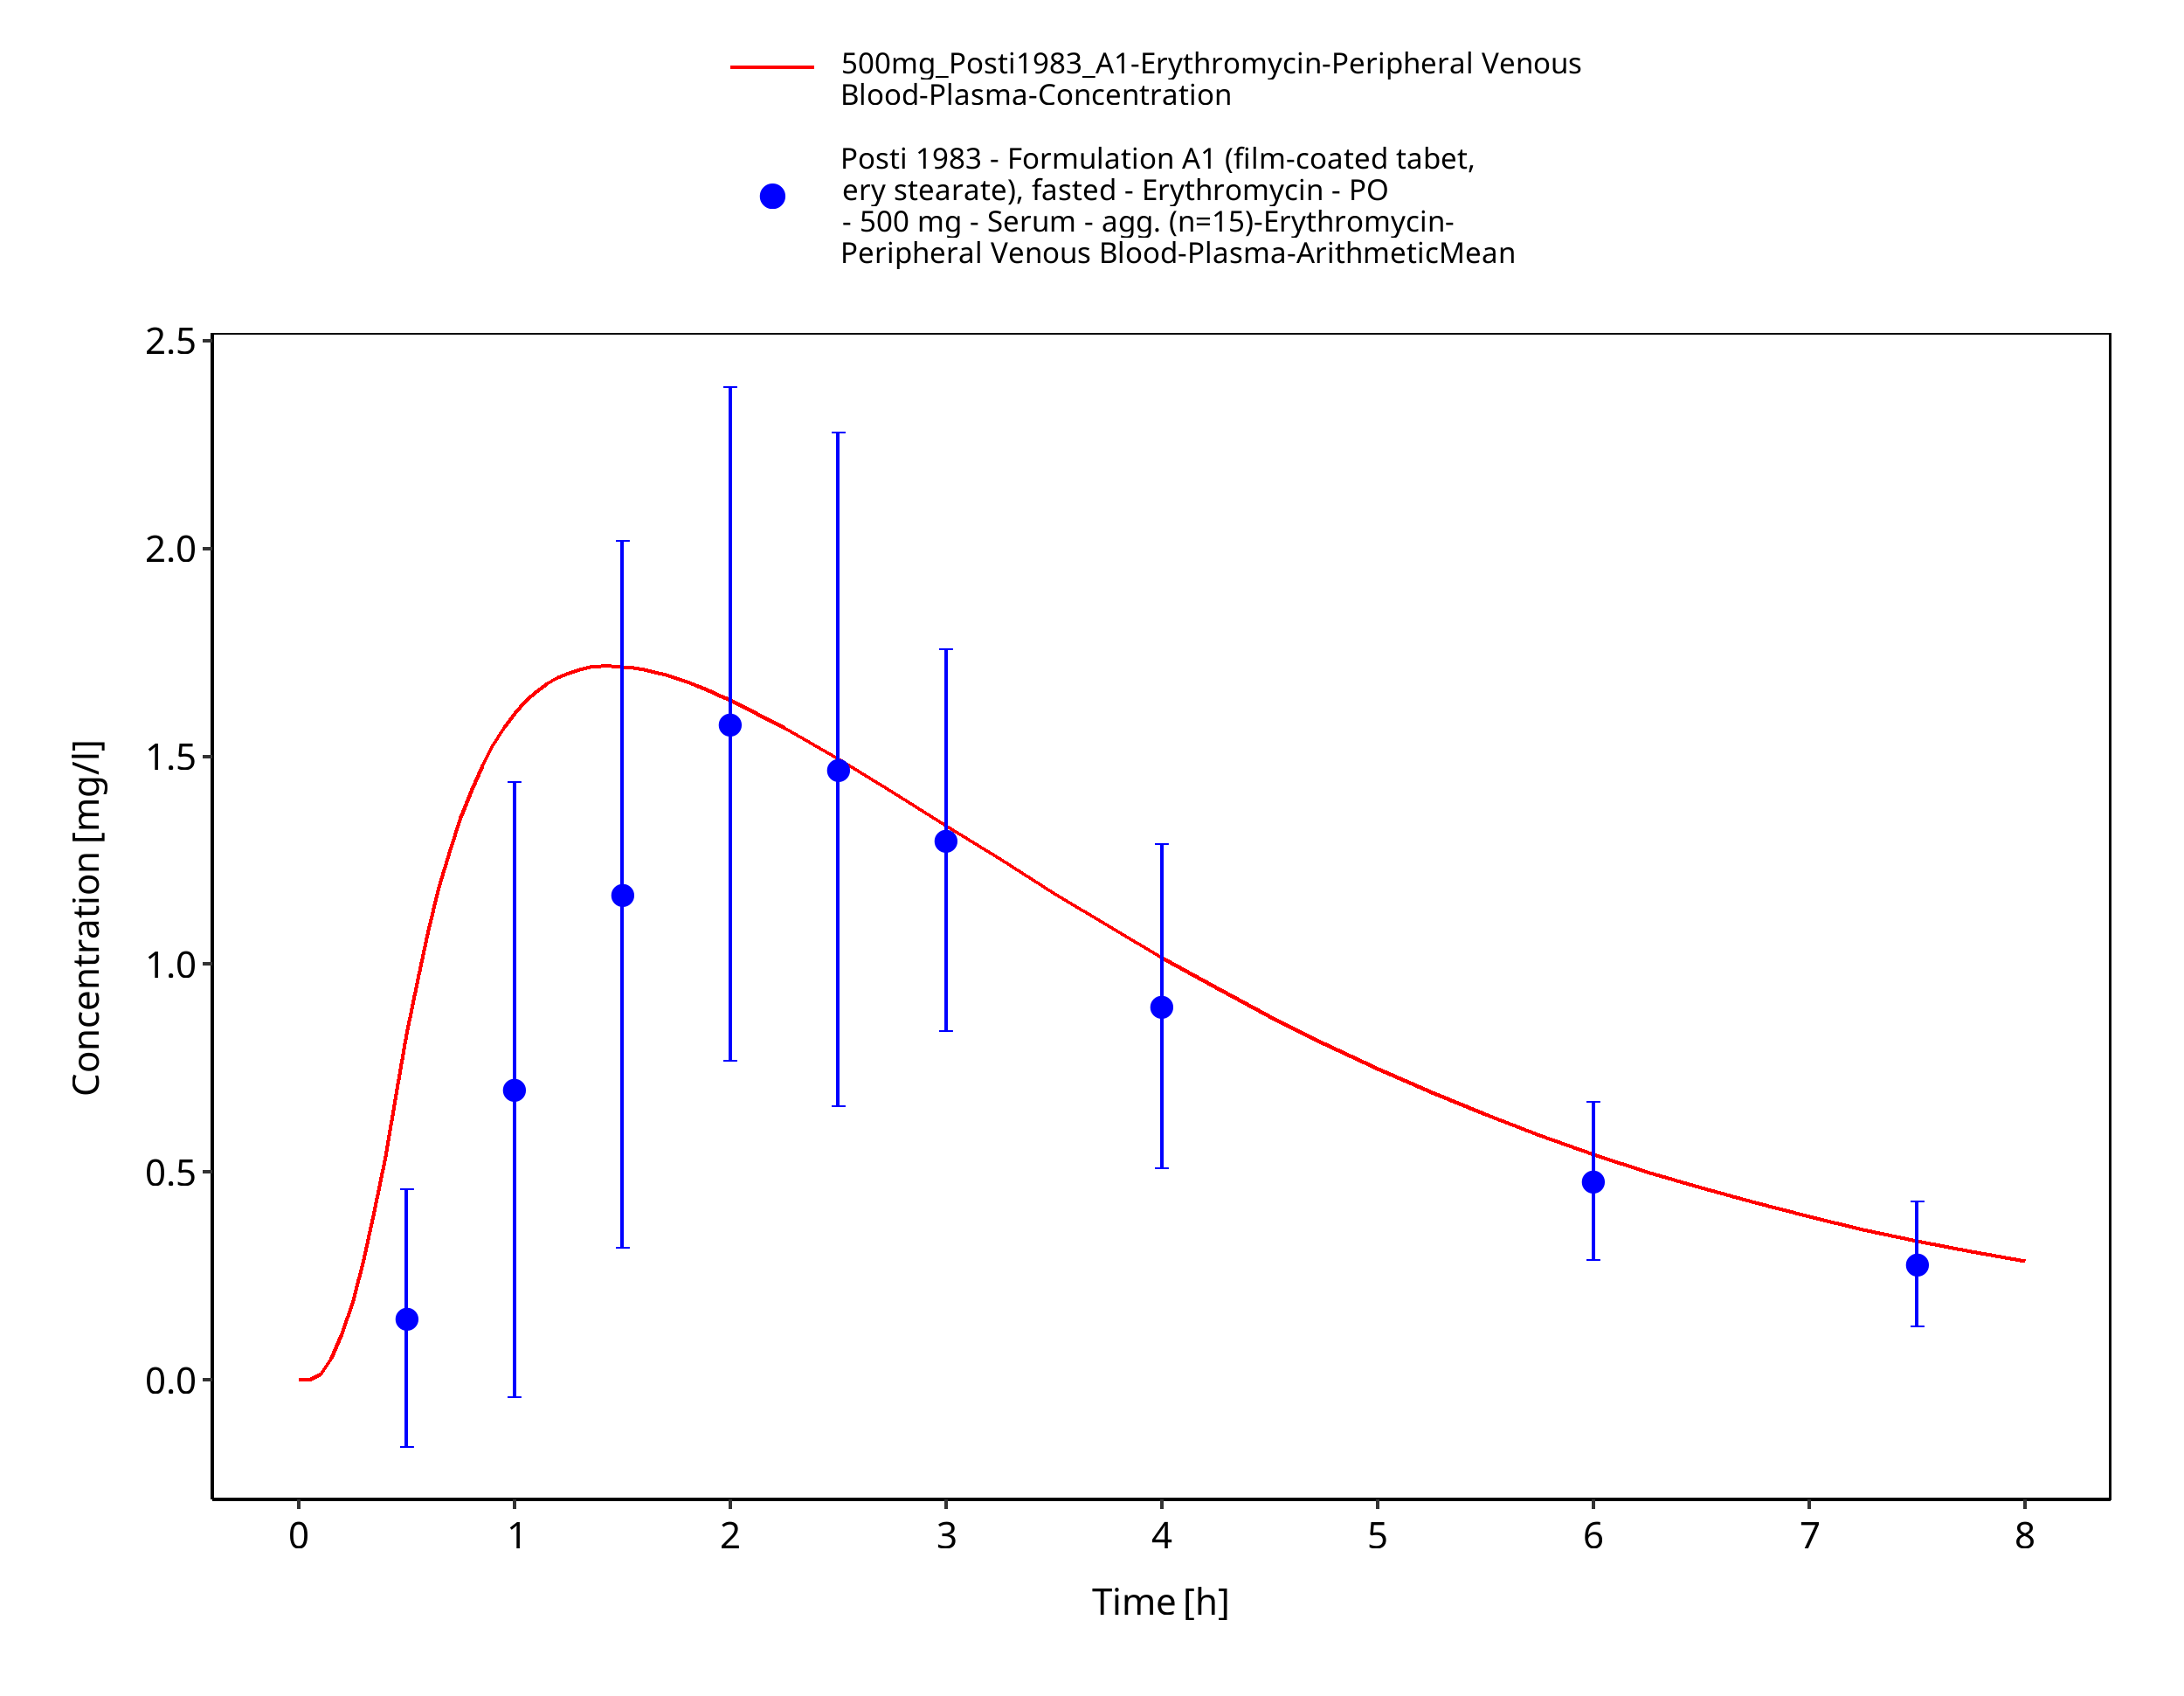
Figure 3-29: Time Profile Analysis 1
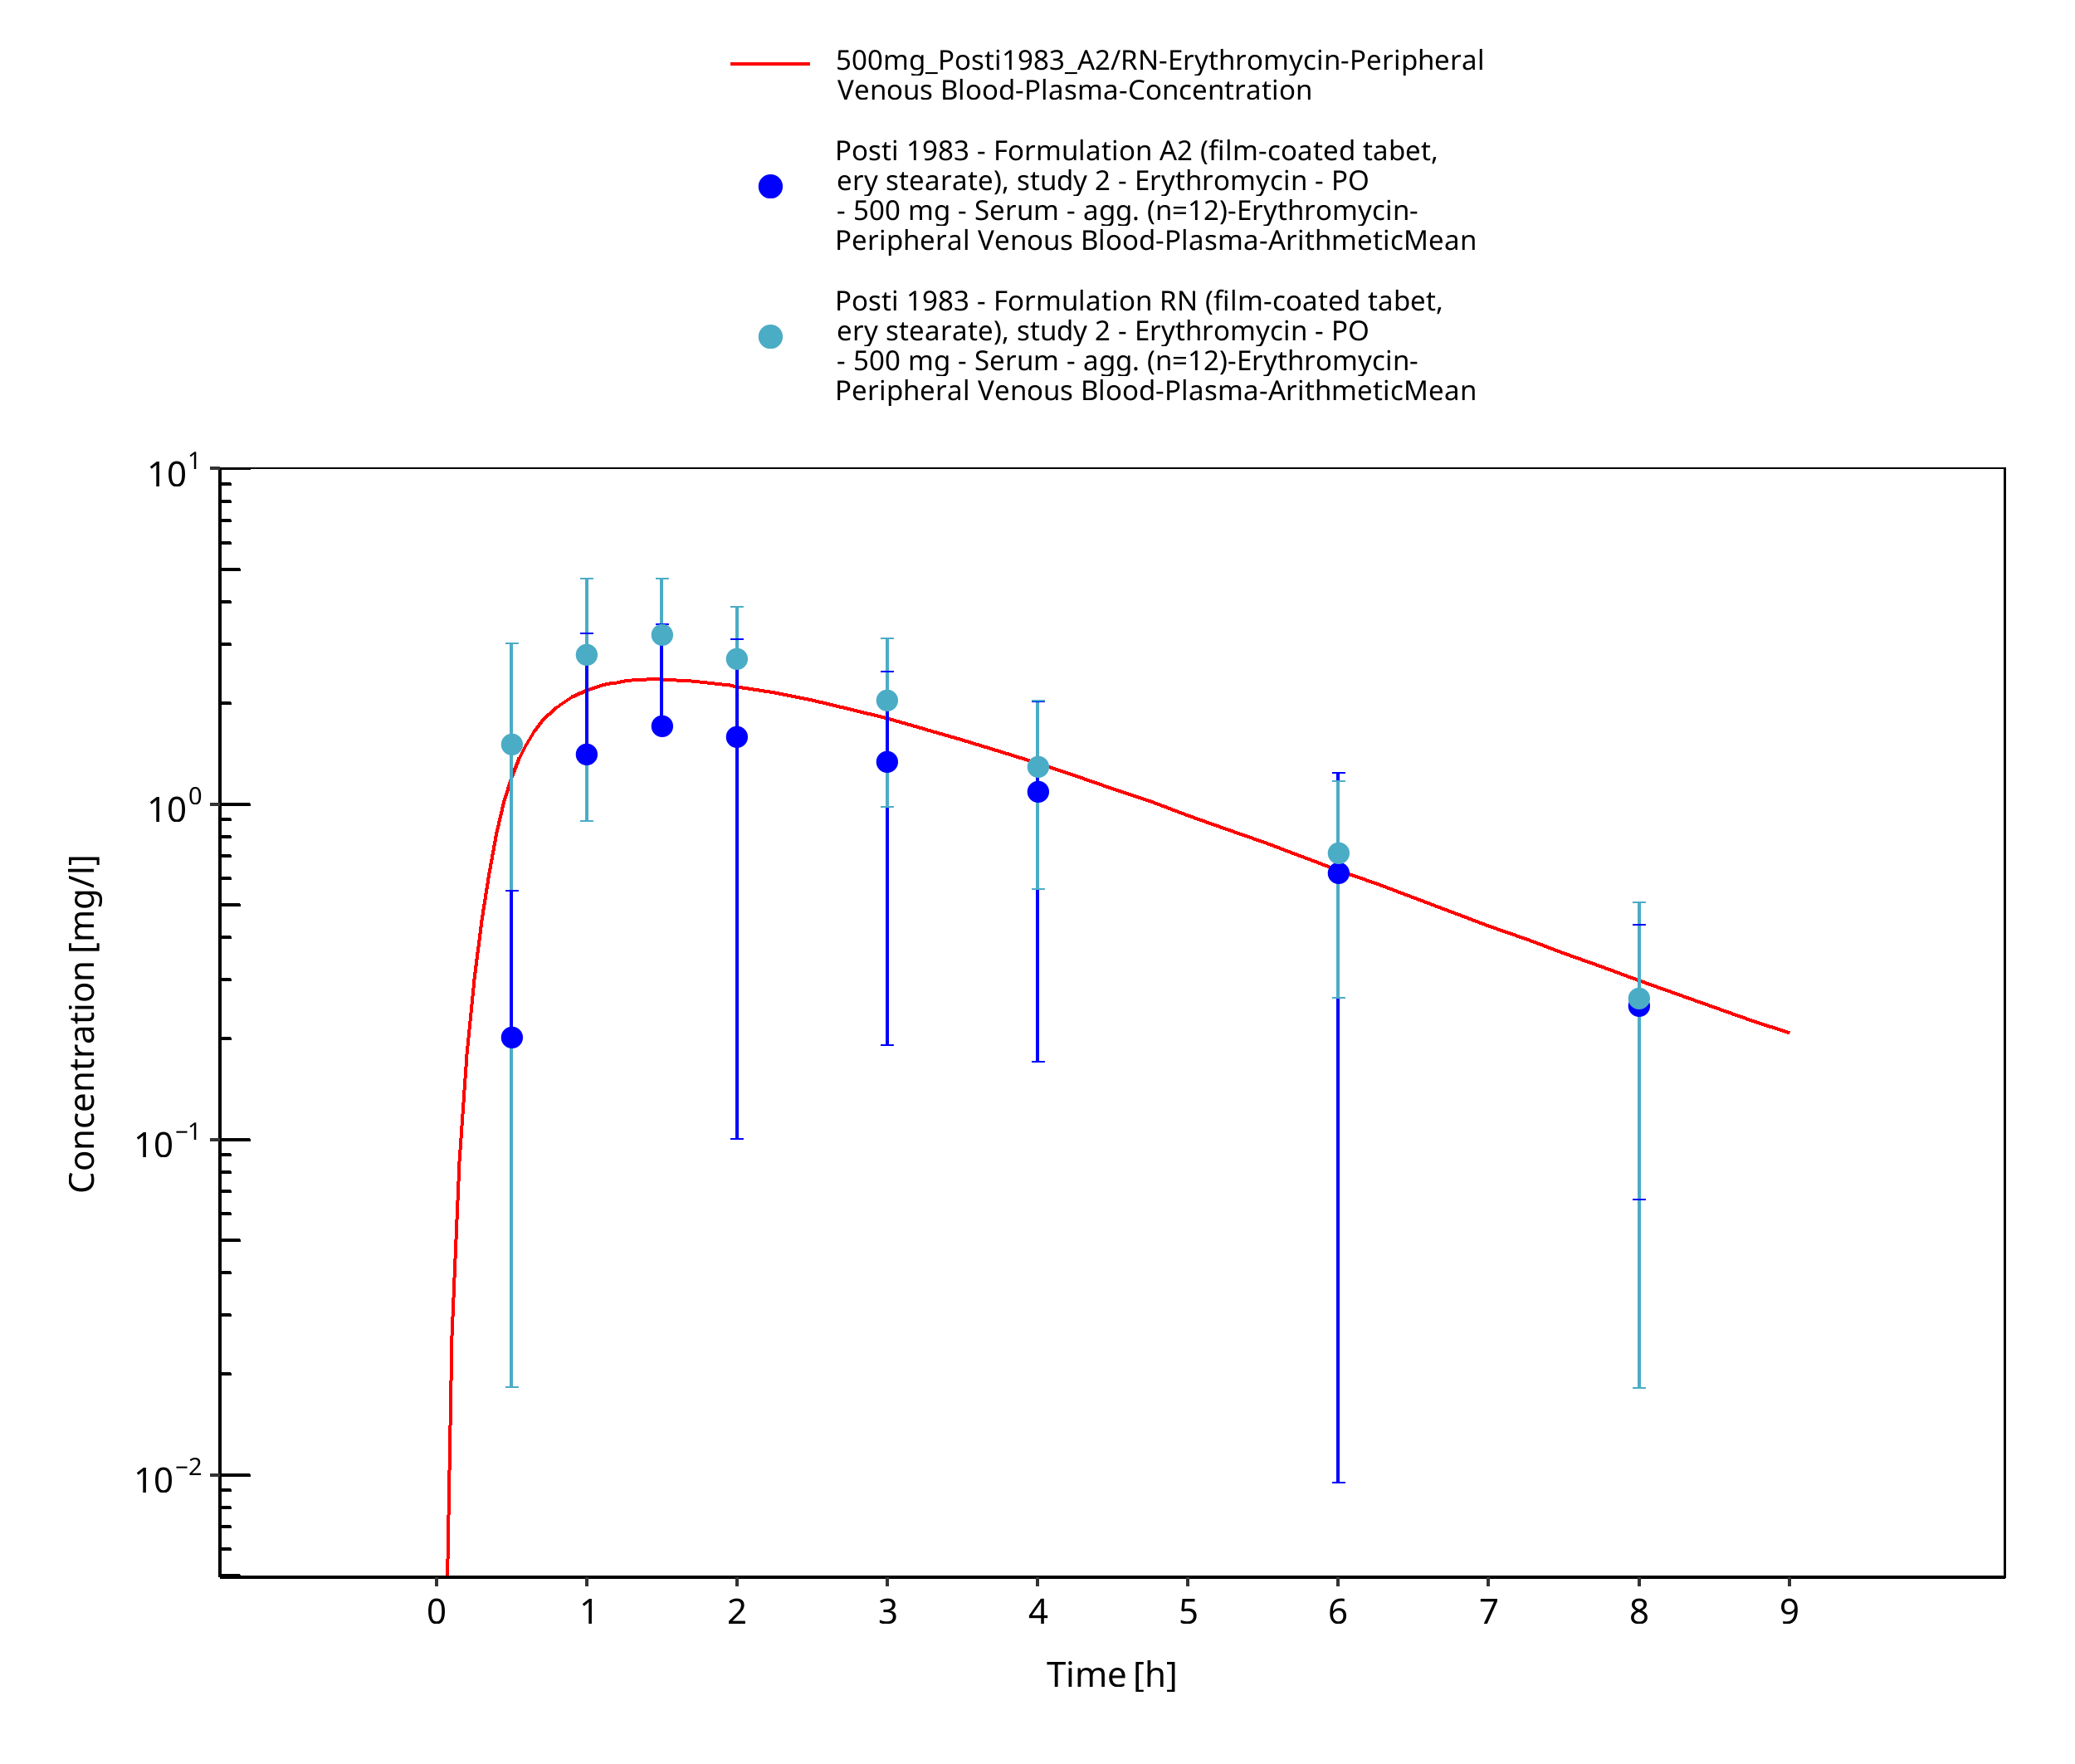
Figure 3-30: Time Profile Analysis
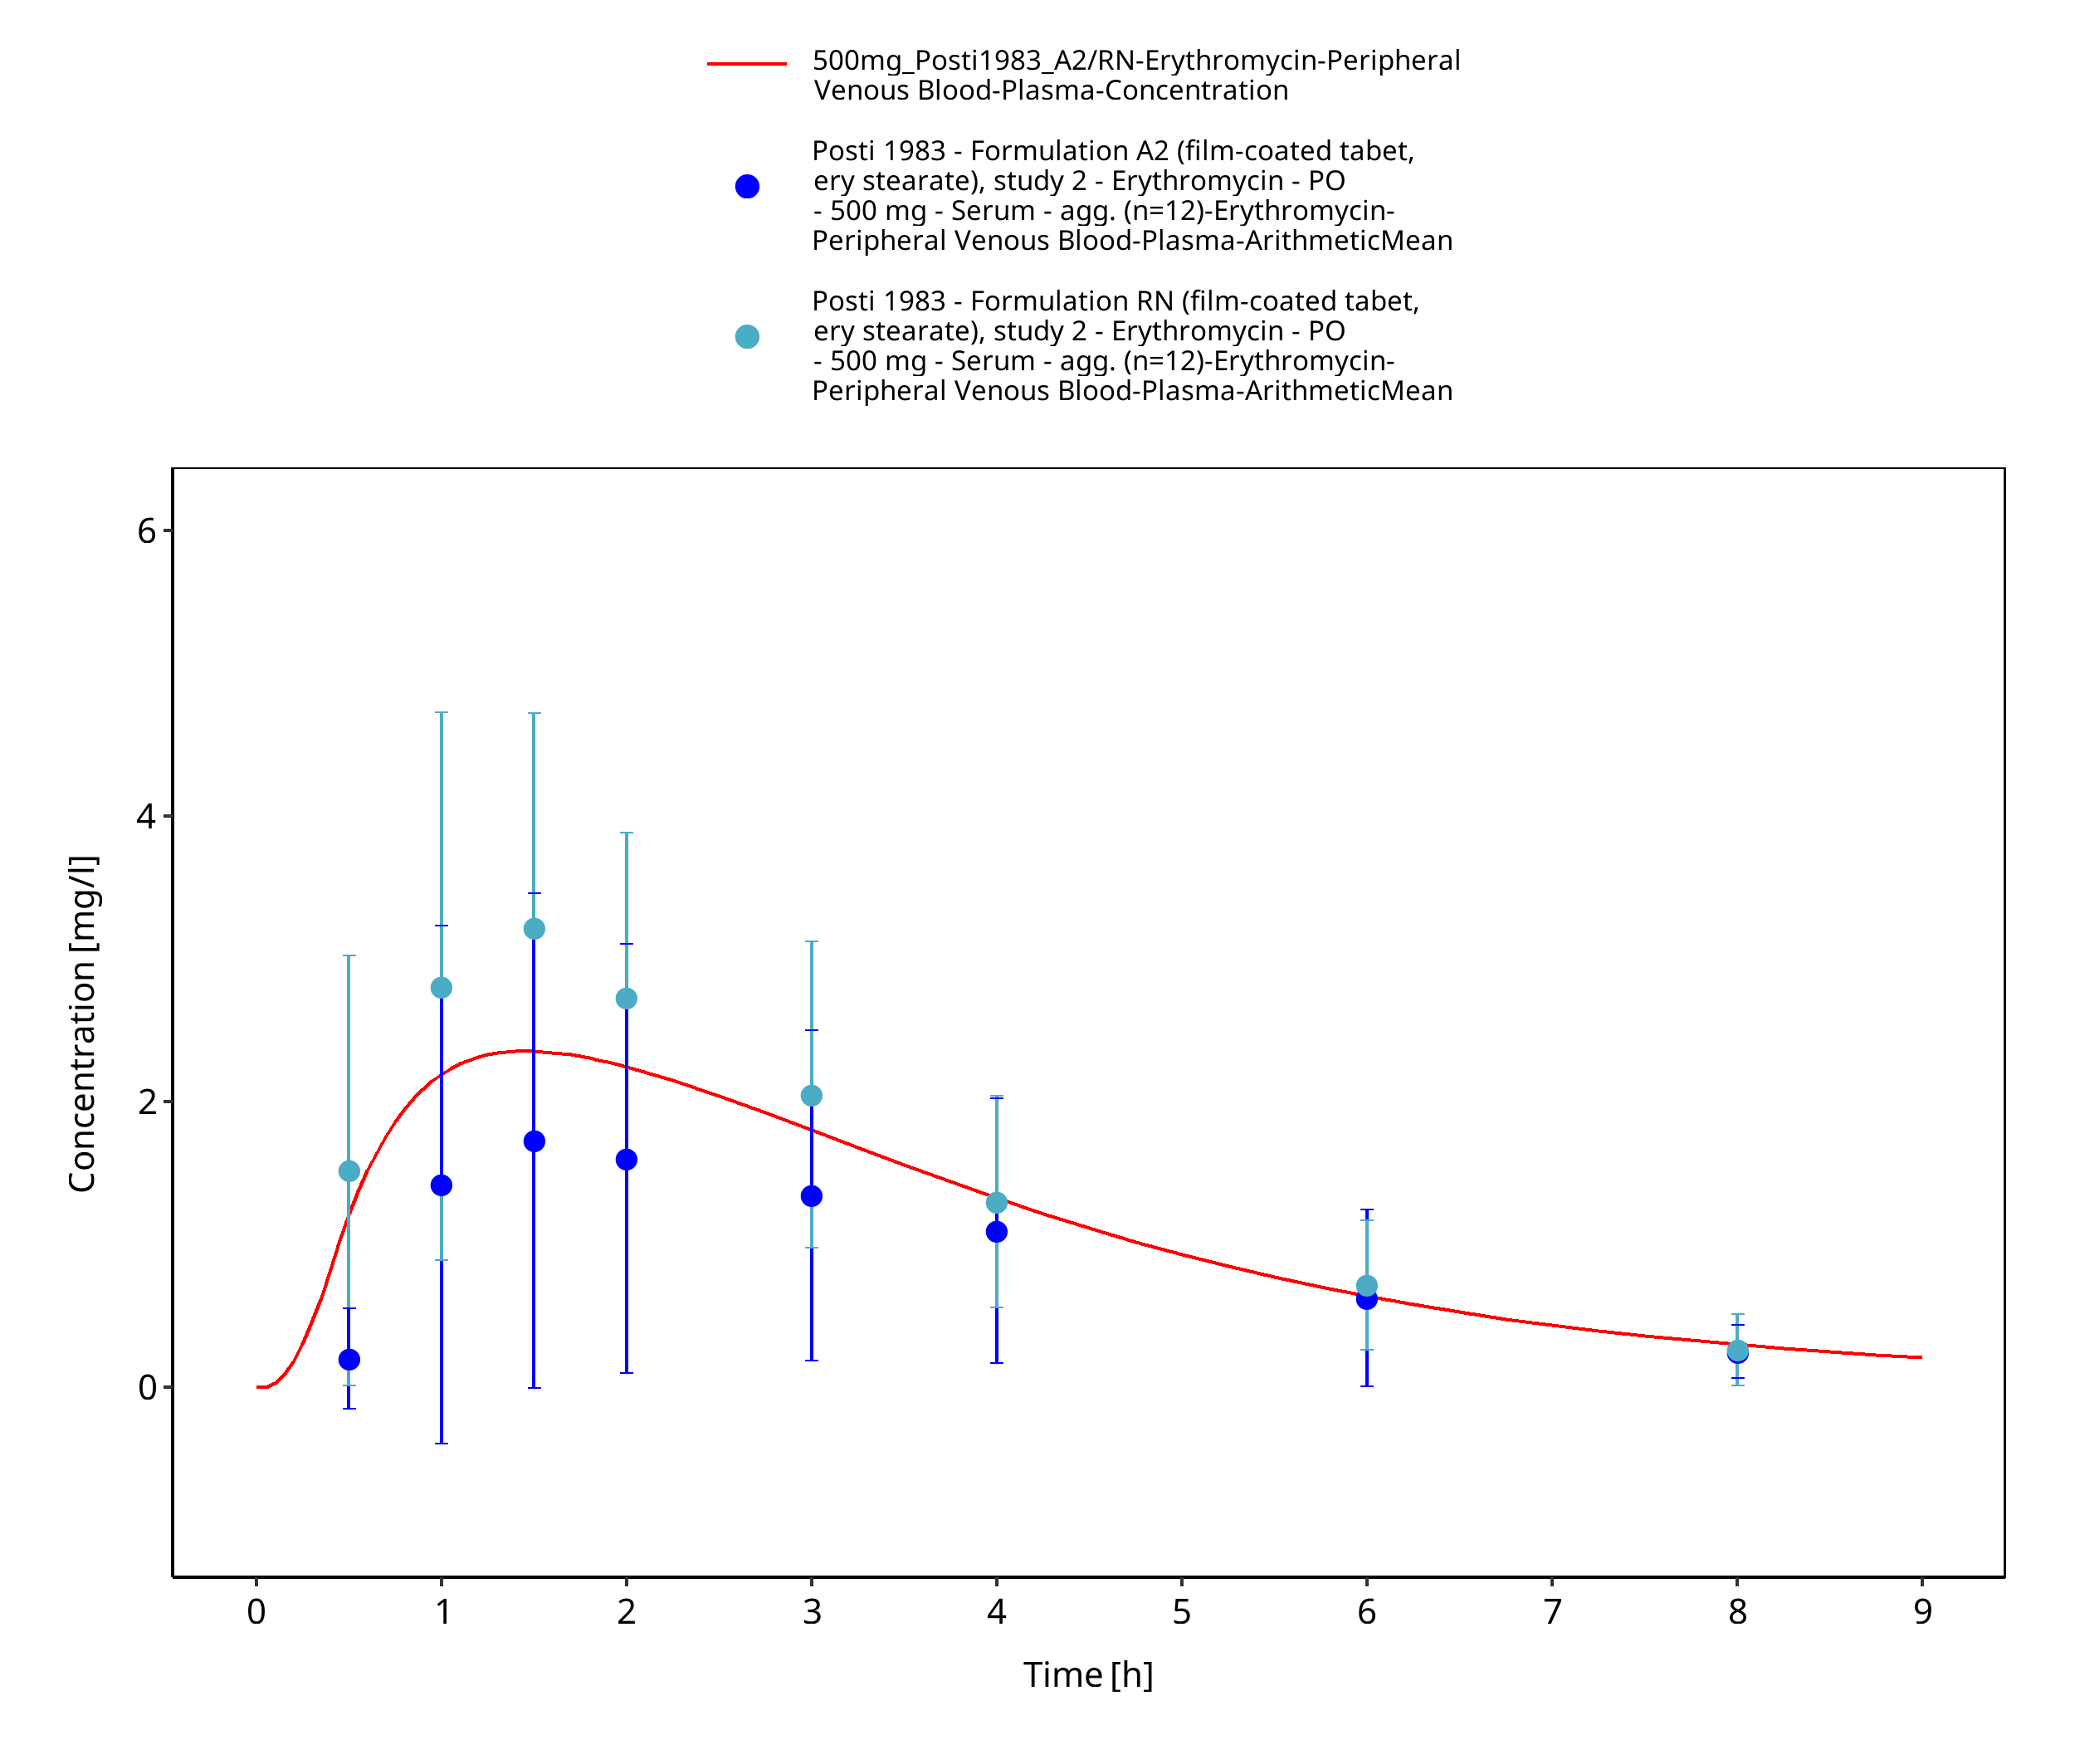
Figure 3-31: Time Profile Analysis 1
3.3.2 Model Verification
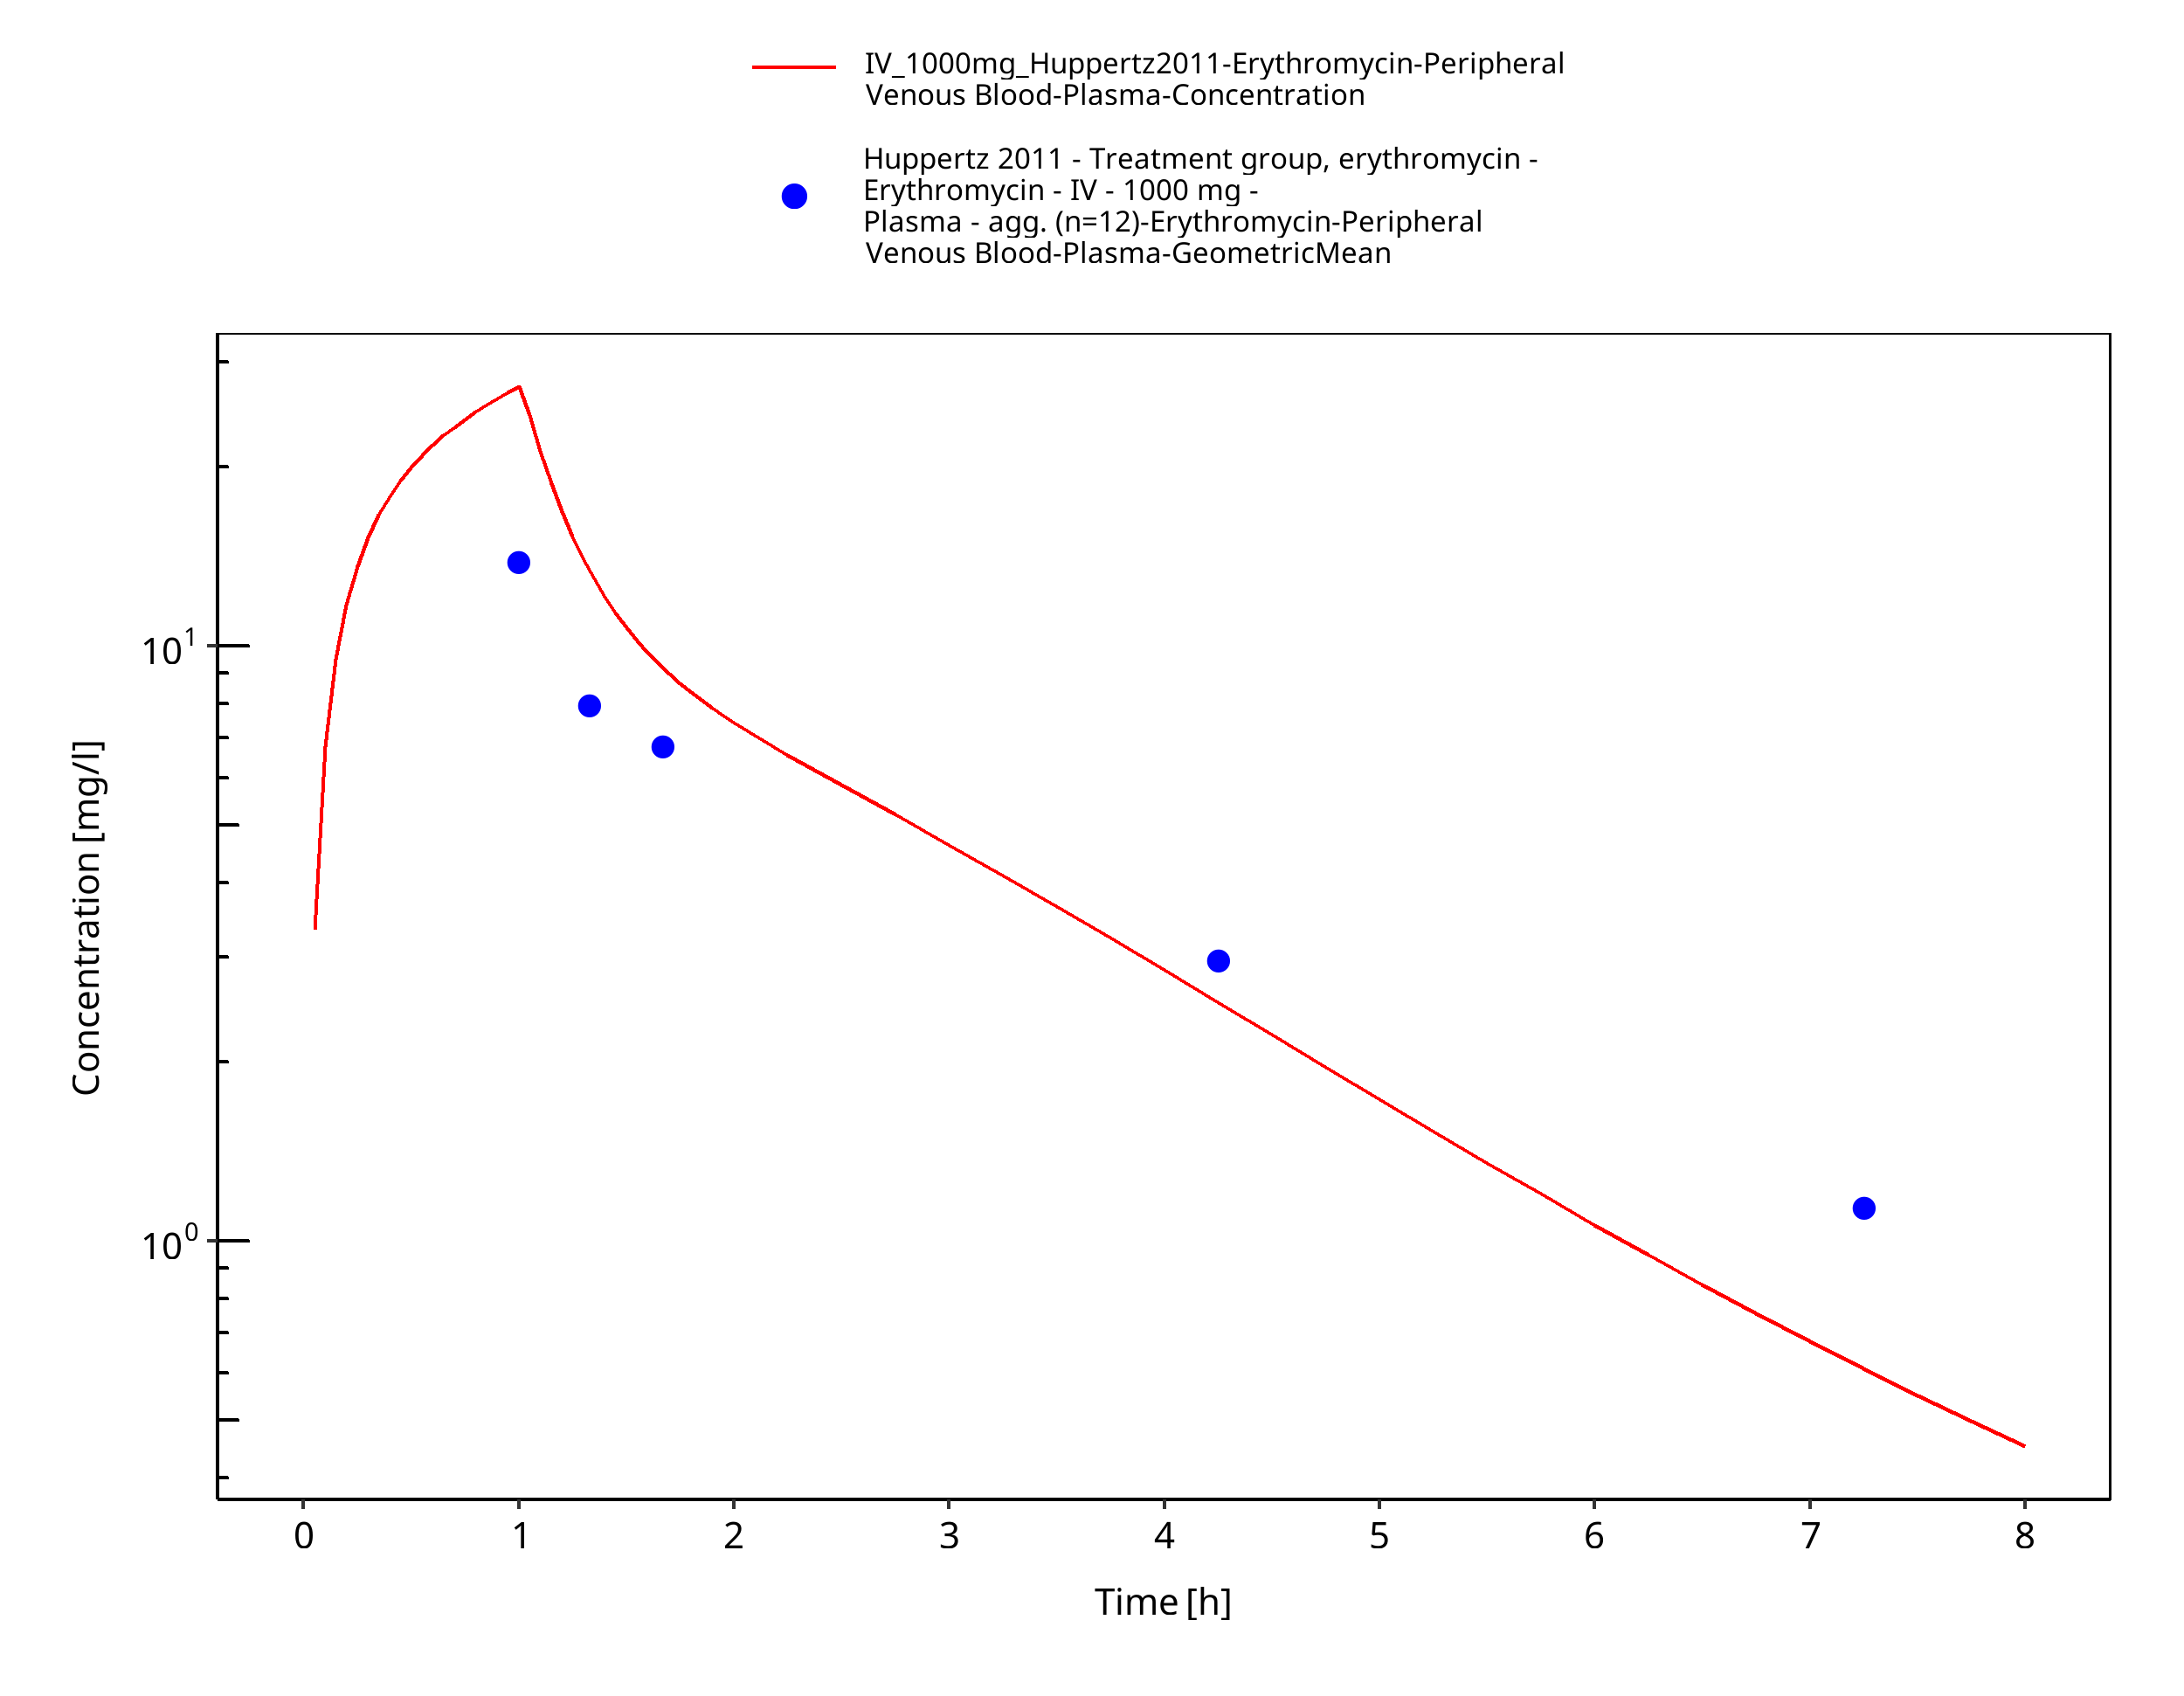
Figure 3-32: Time Profile Analysis
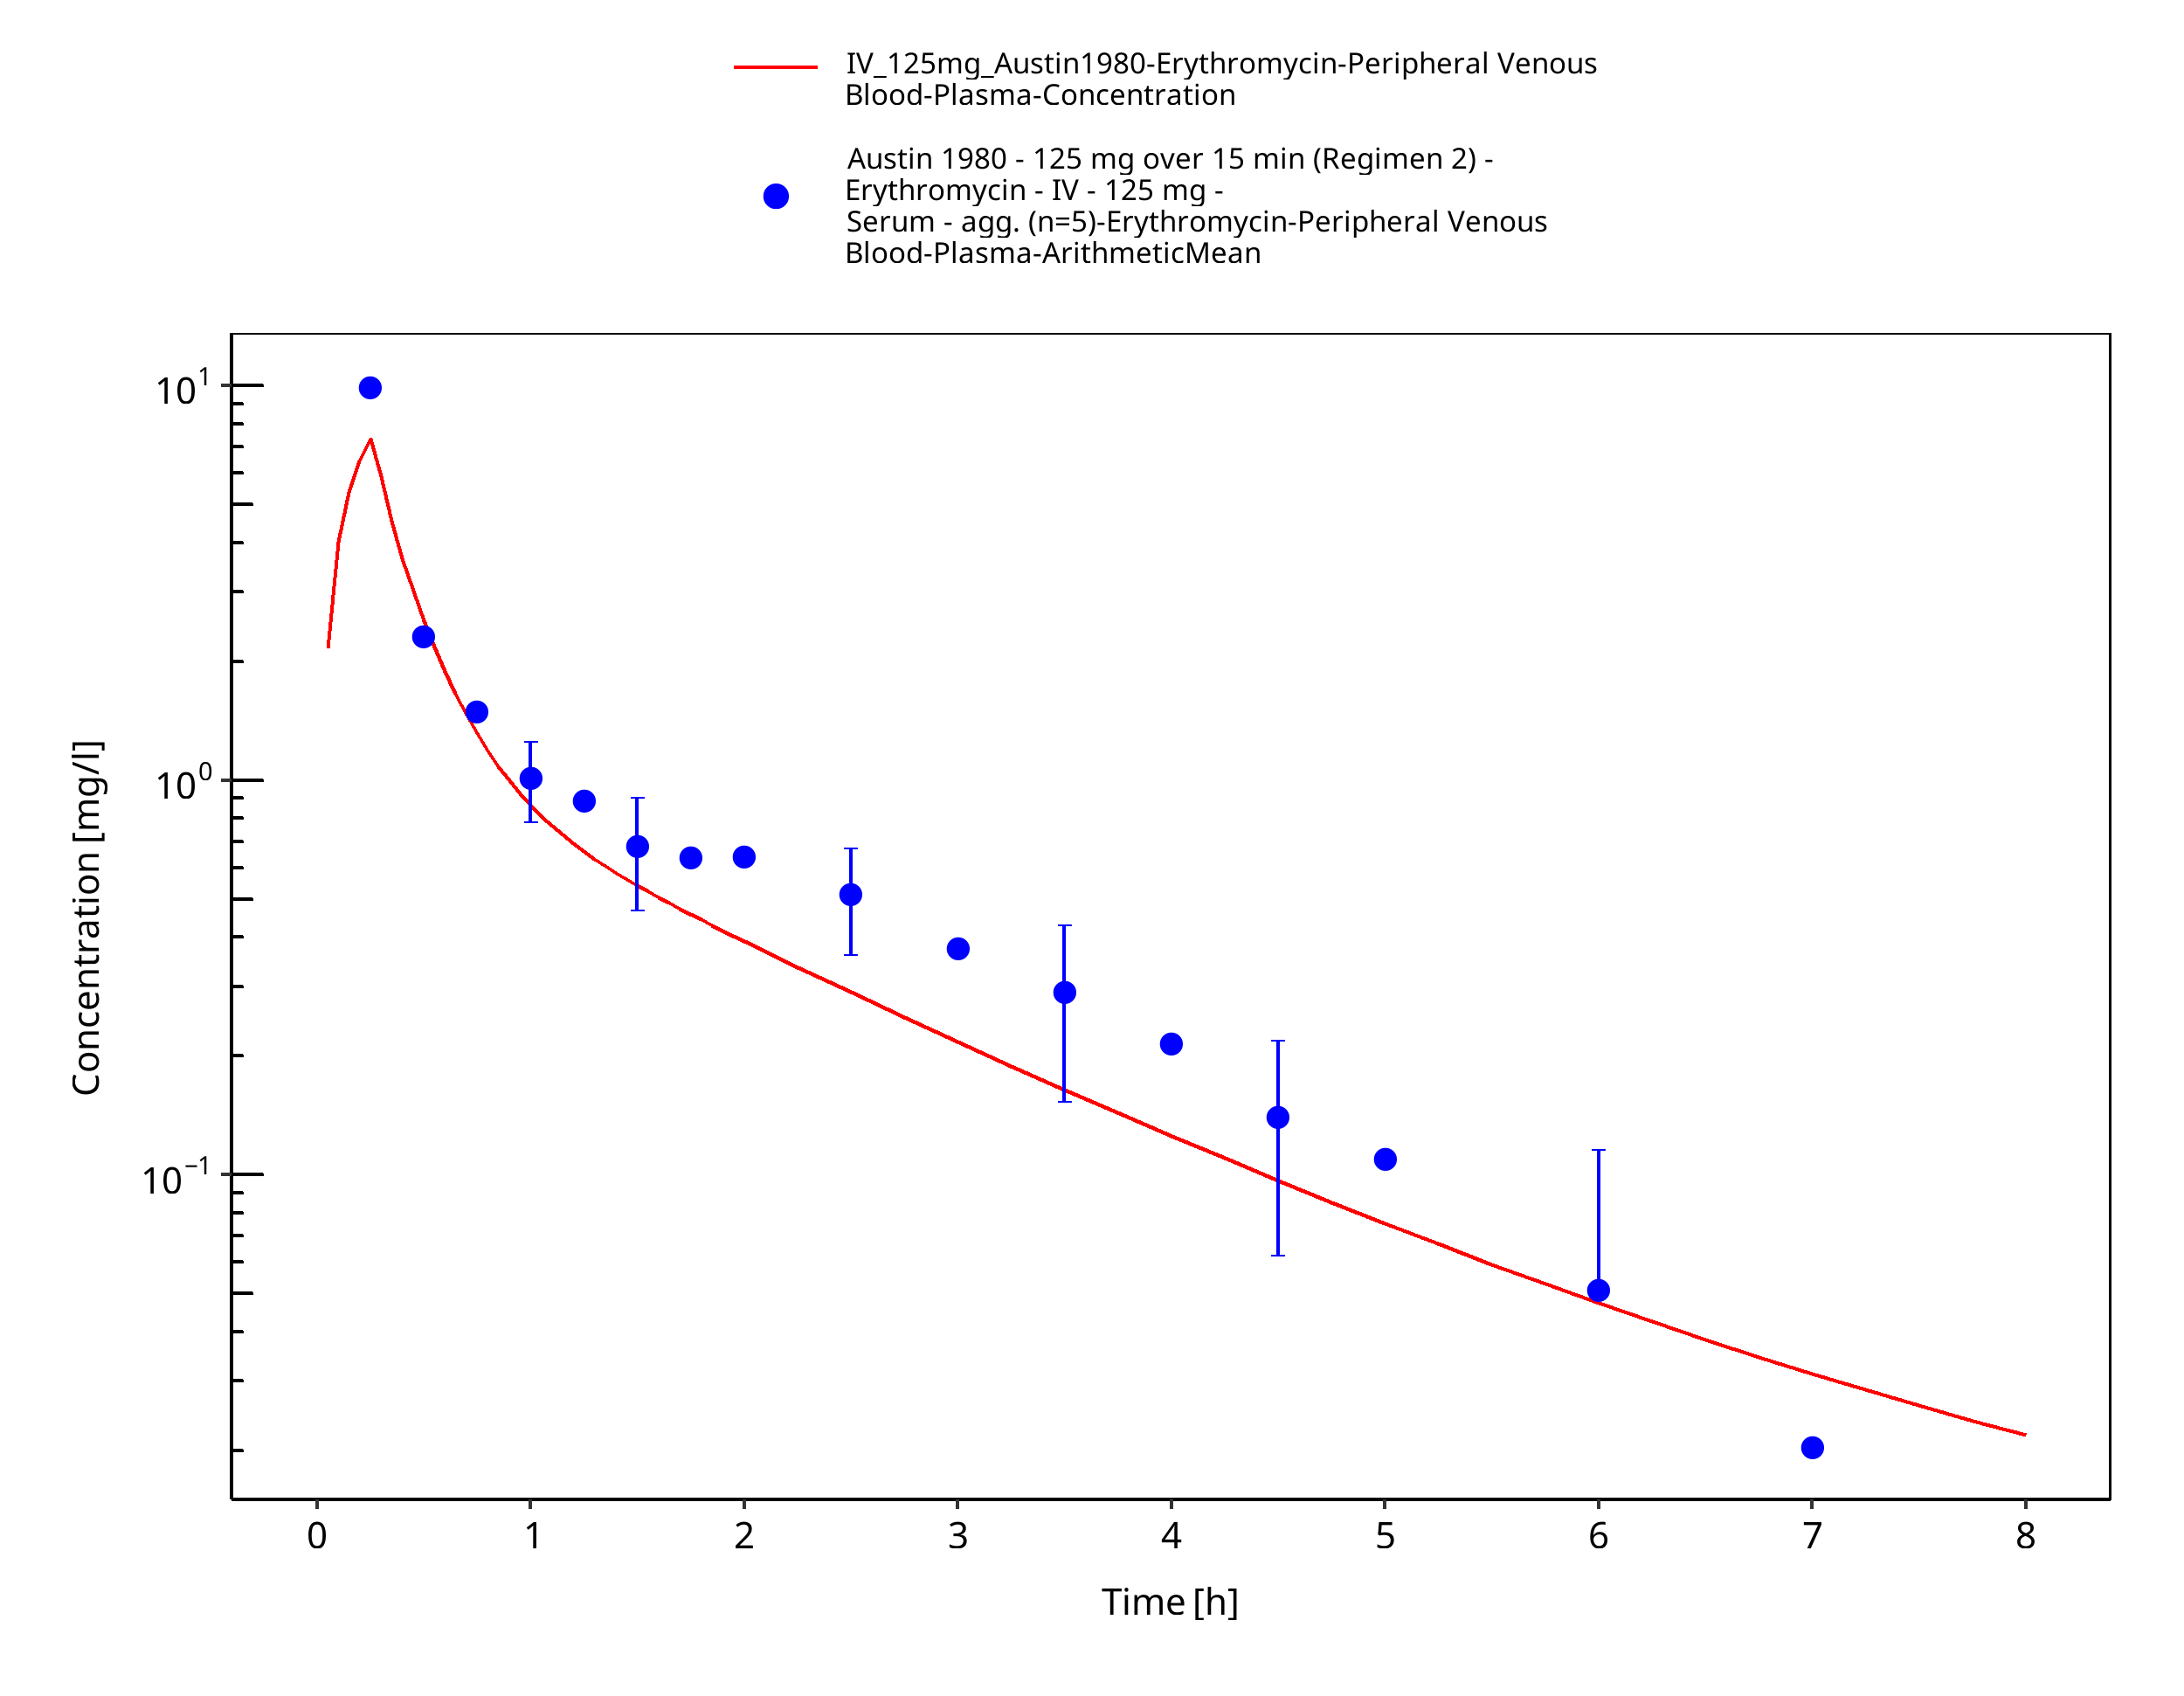
Figure 3-33: Time Profile Analysis
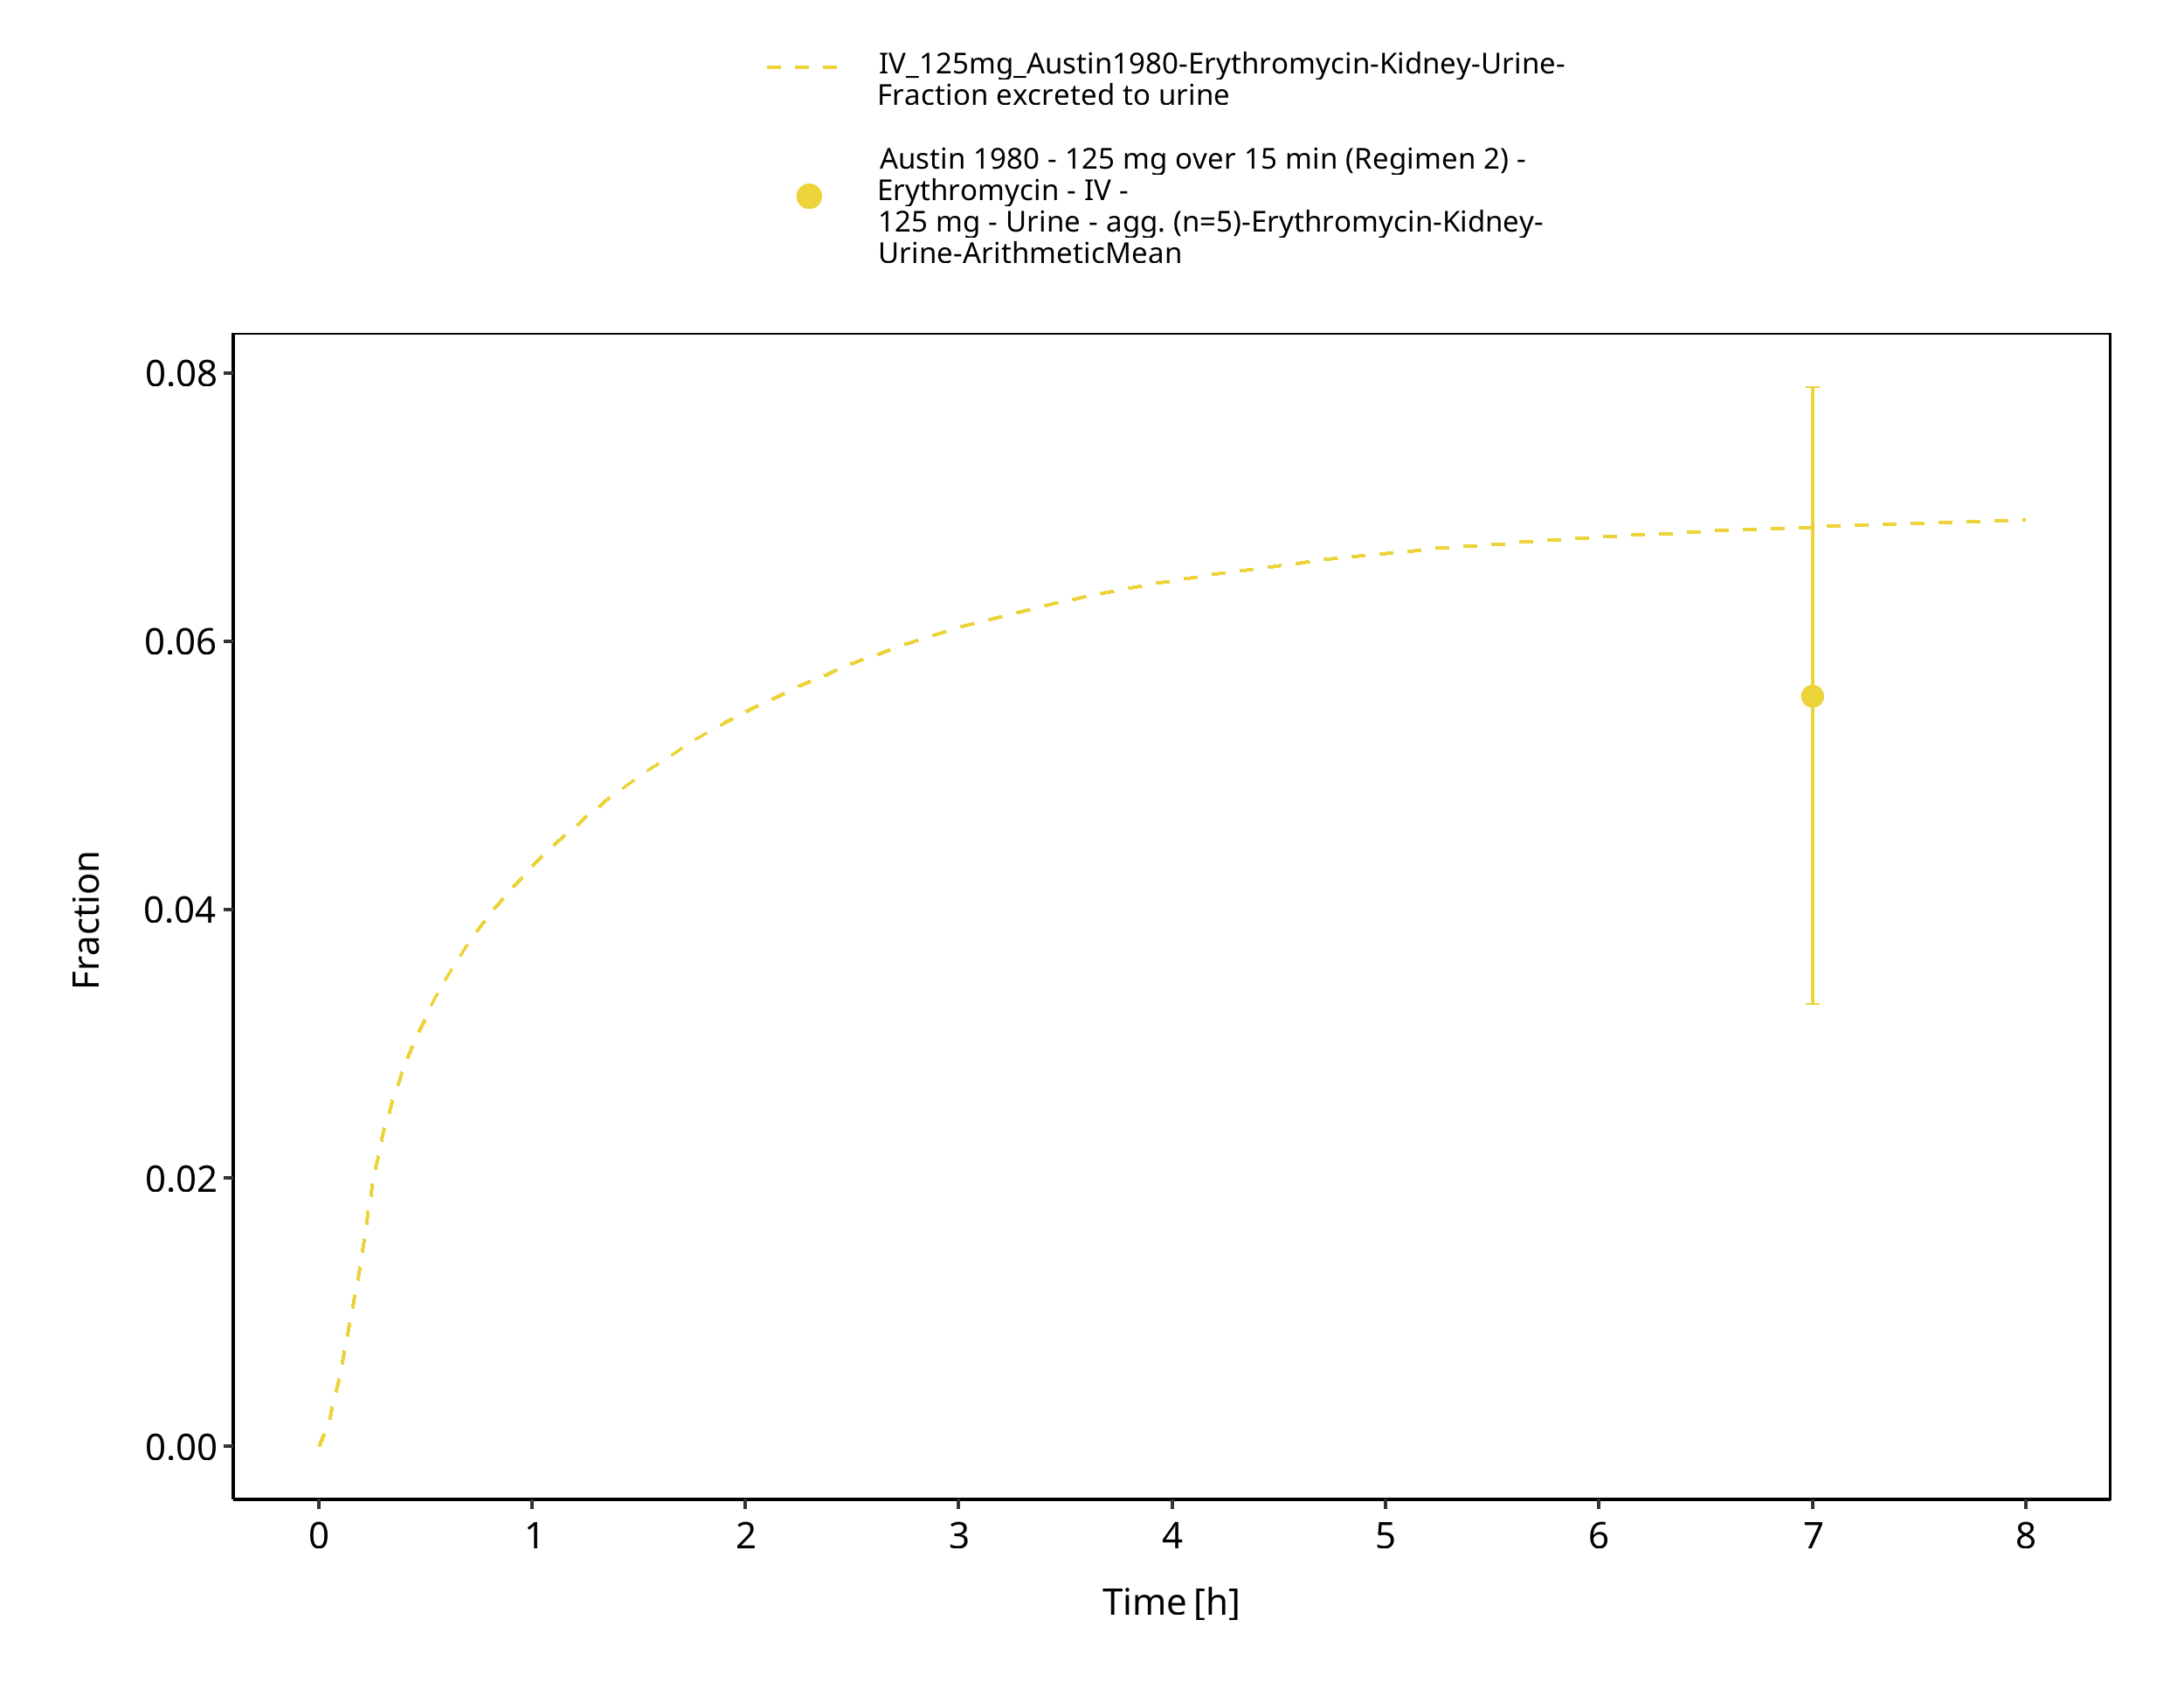
Figure 3-34: Time Profile Analysis 1
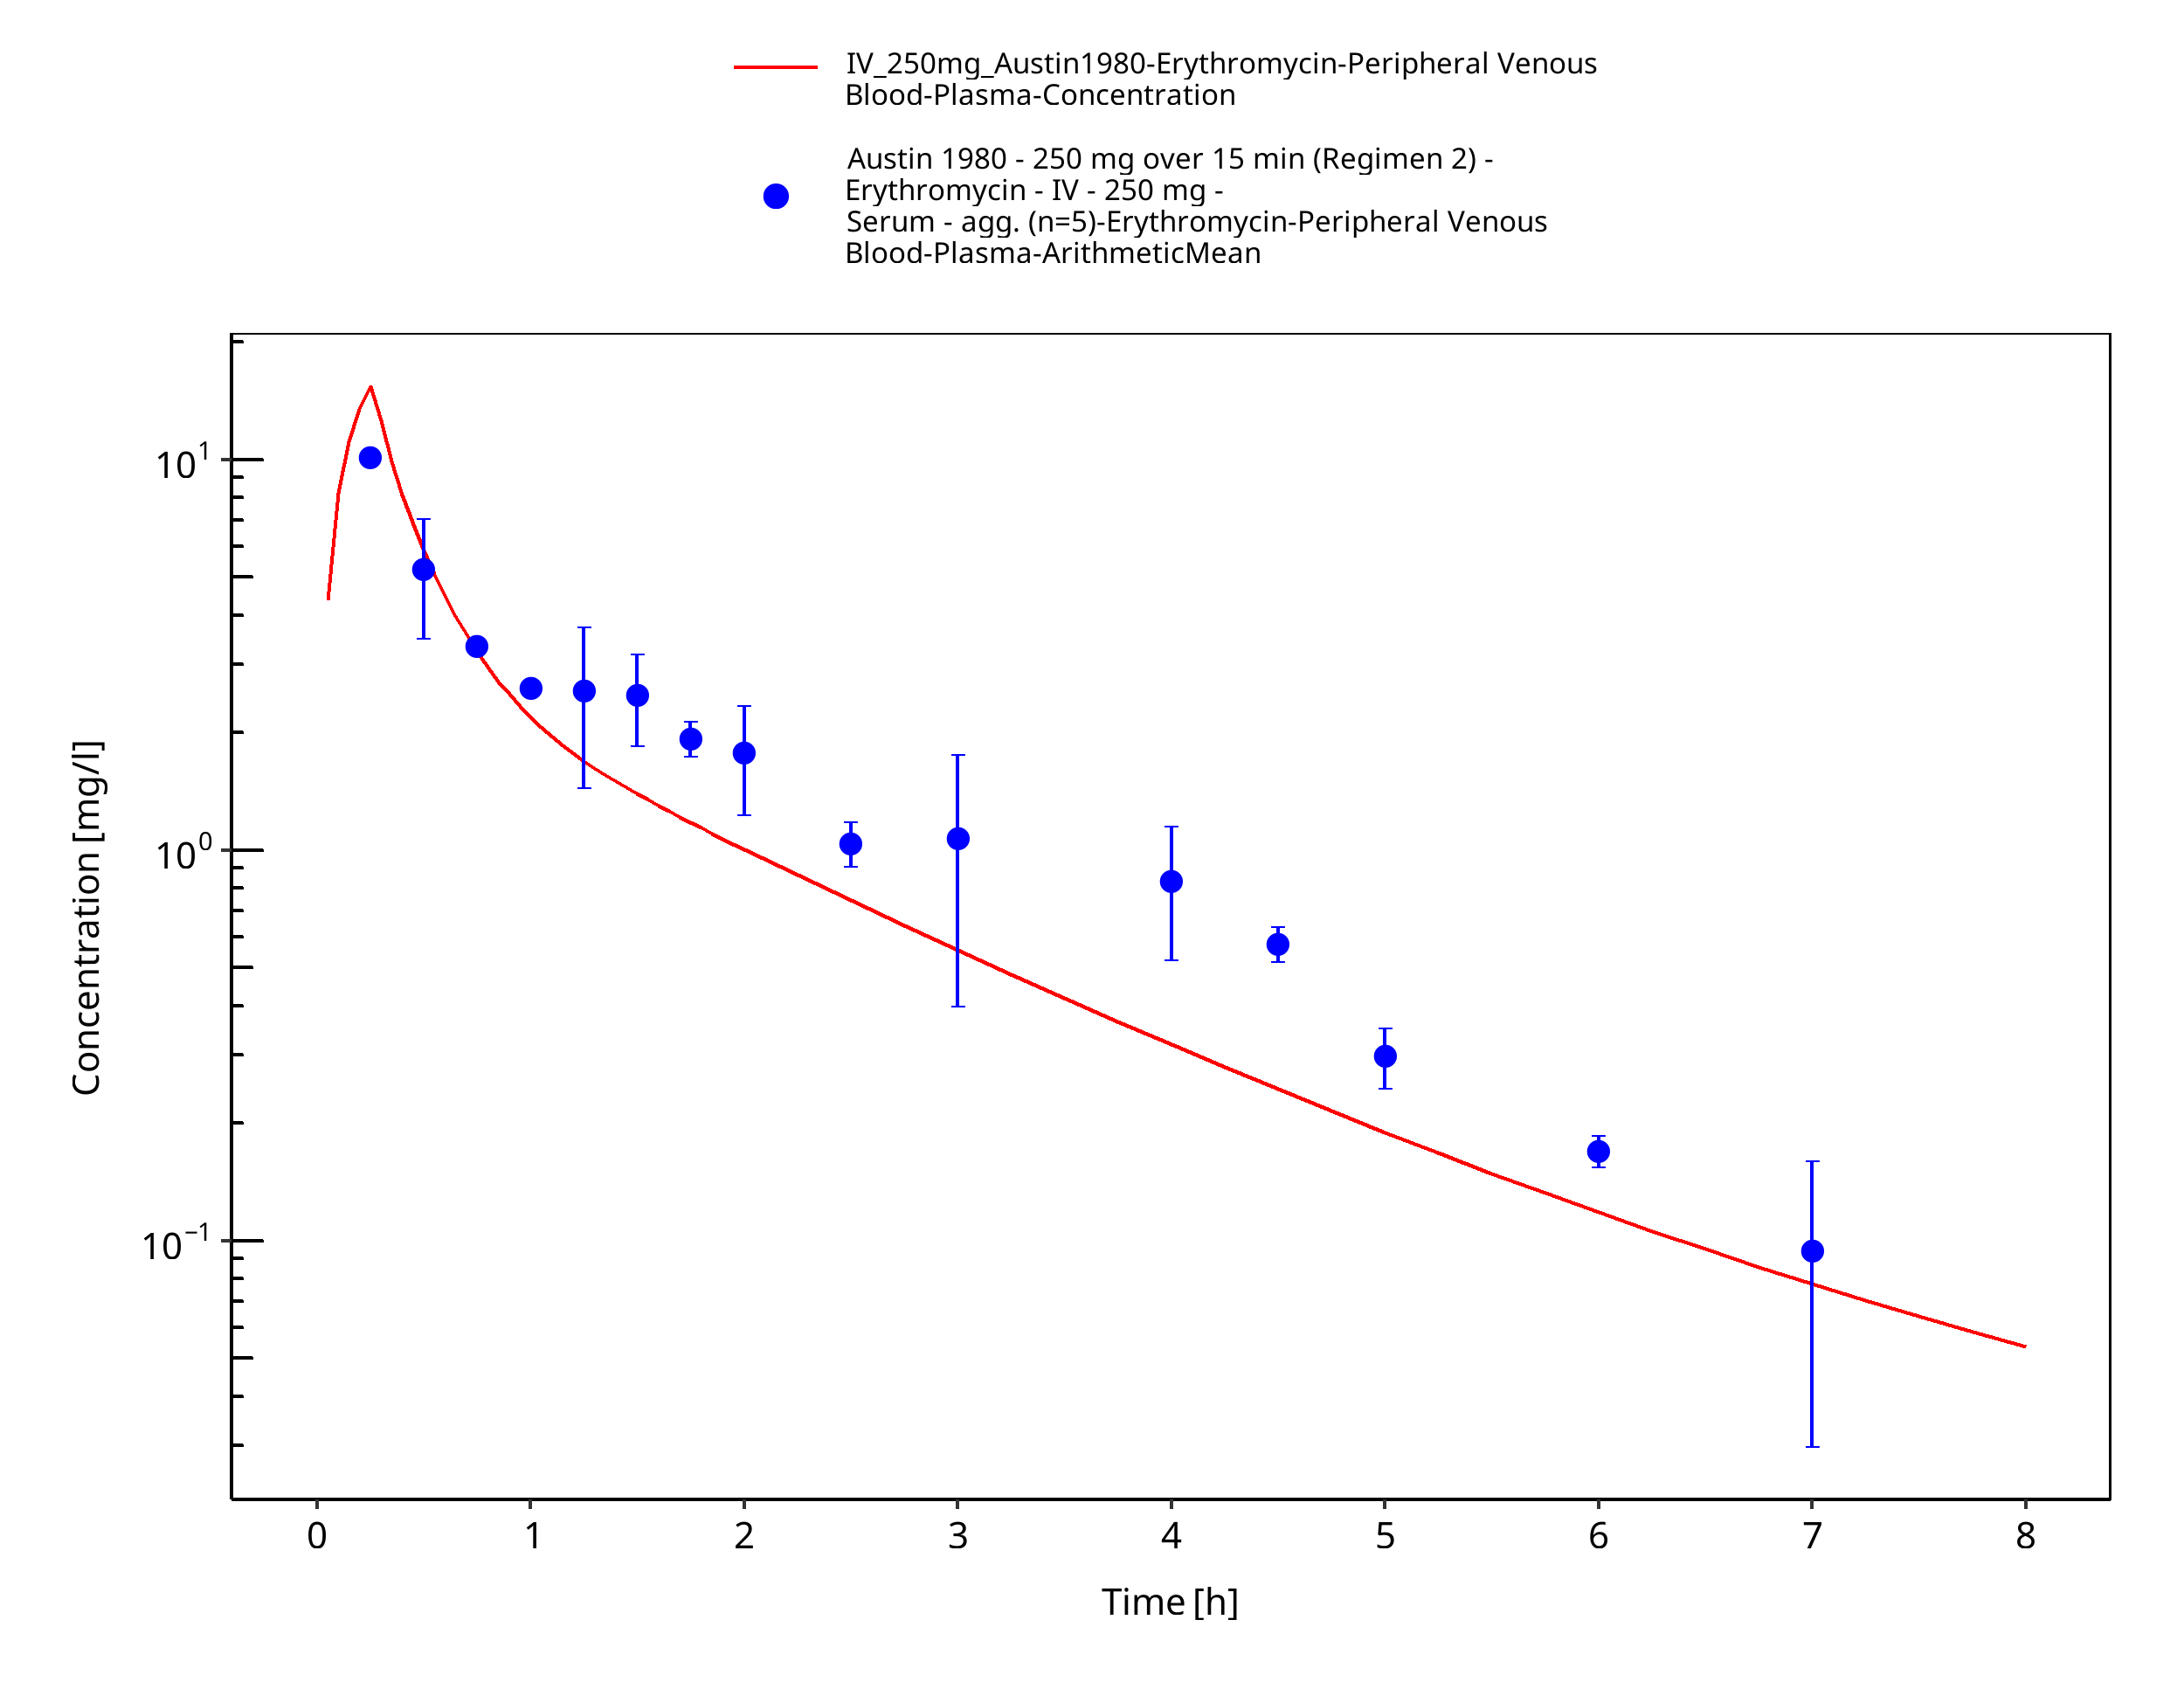
Figure 3-35: Time Profile Analysis
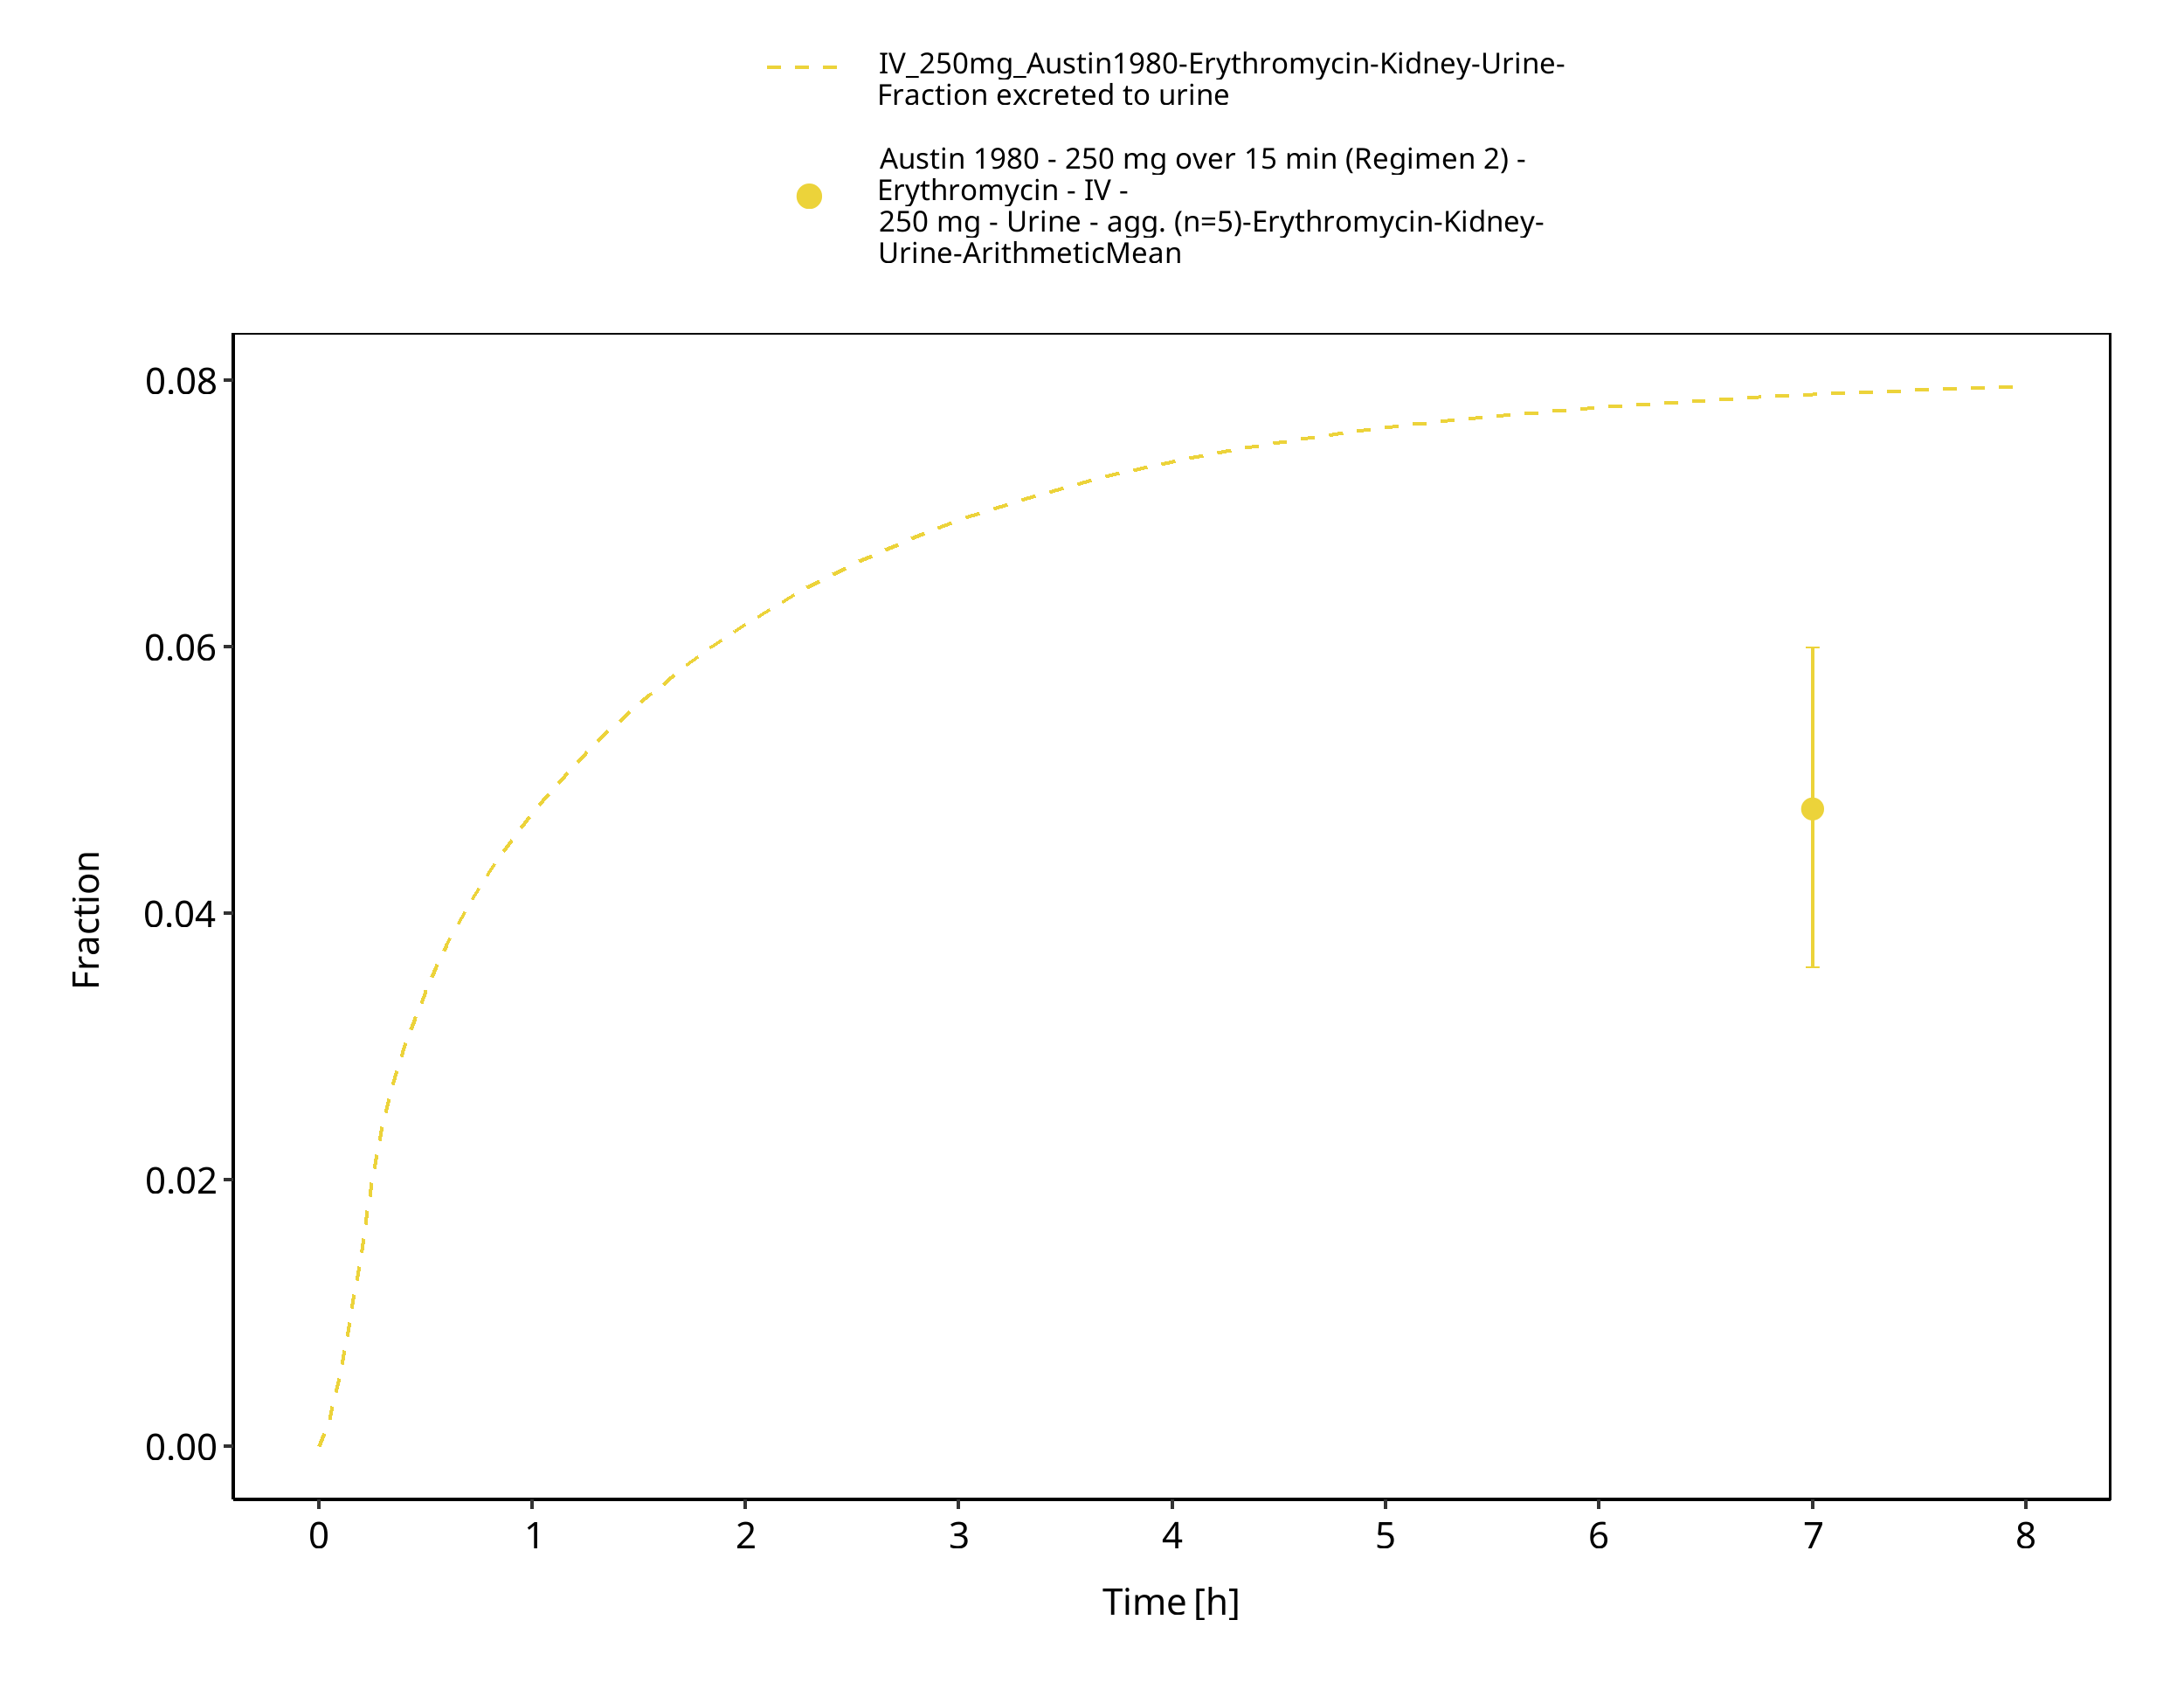
Figure 3-36: Time Profile Analysis 1
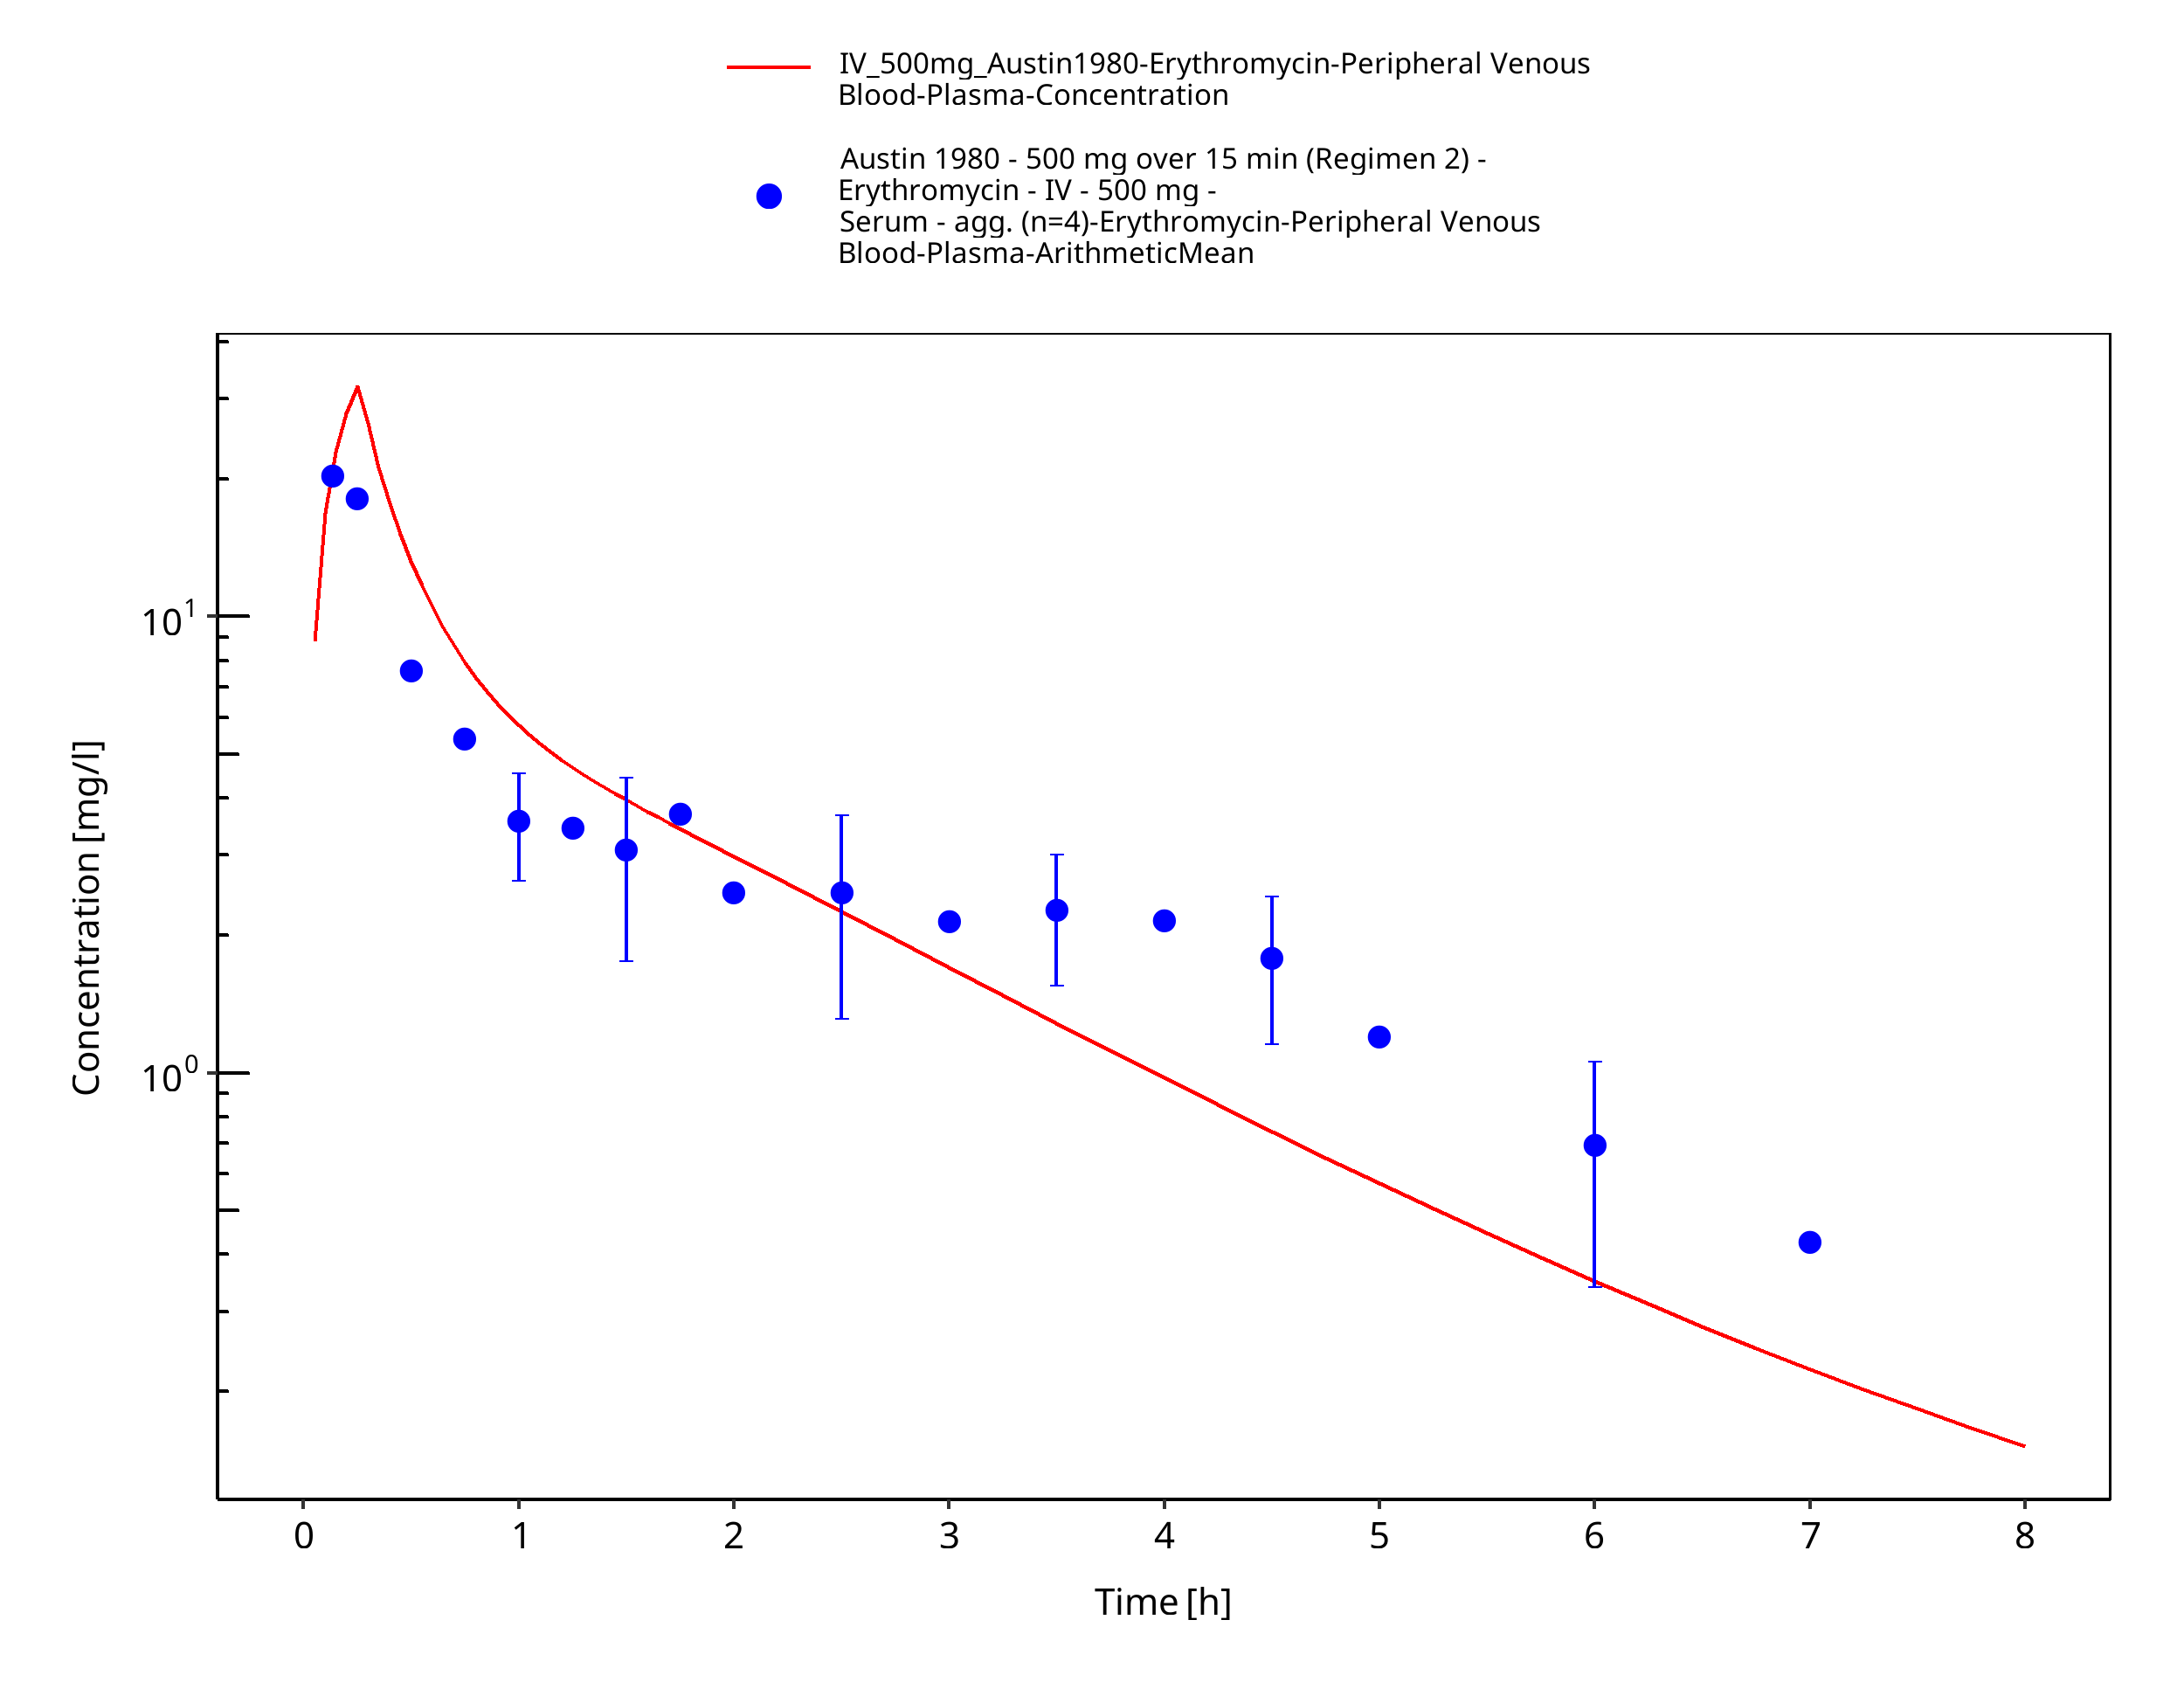
Figure 3-37: Time Profile Analysis
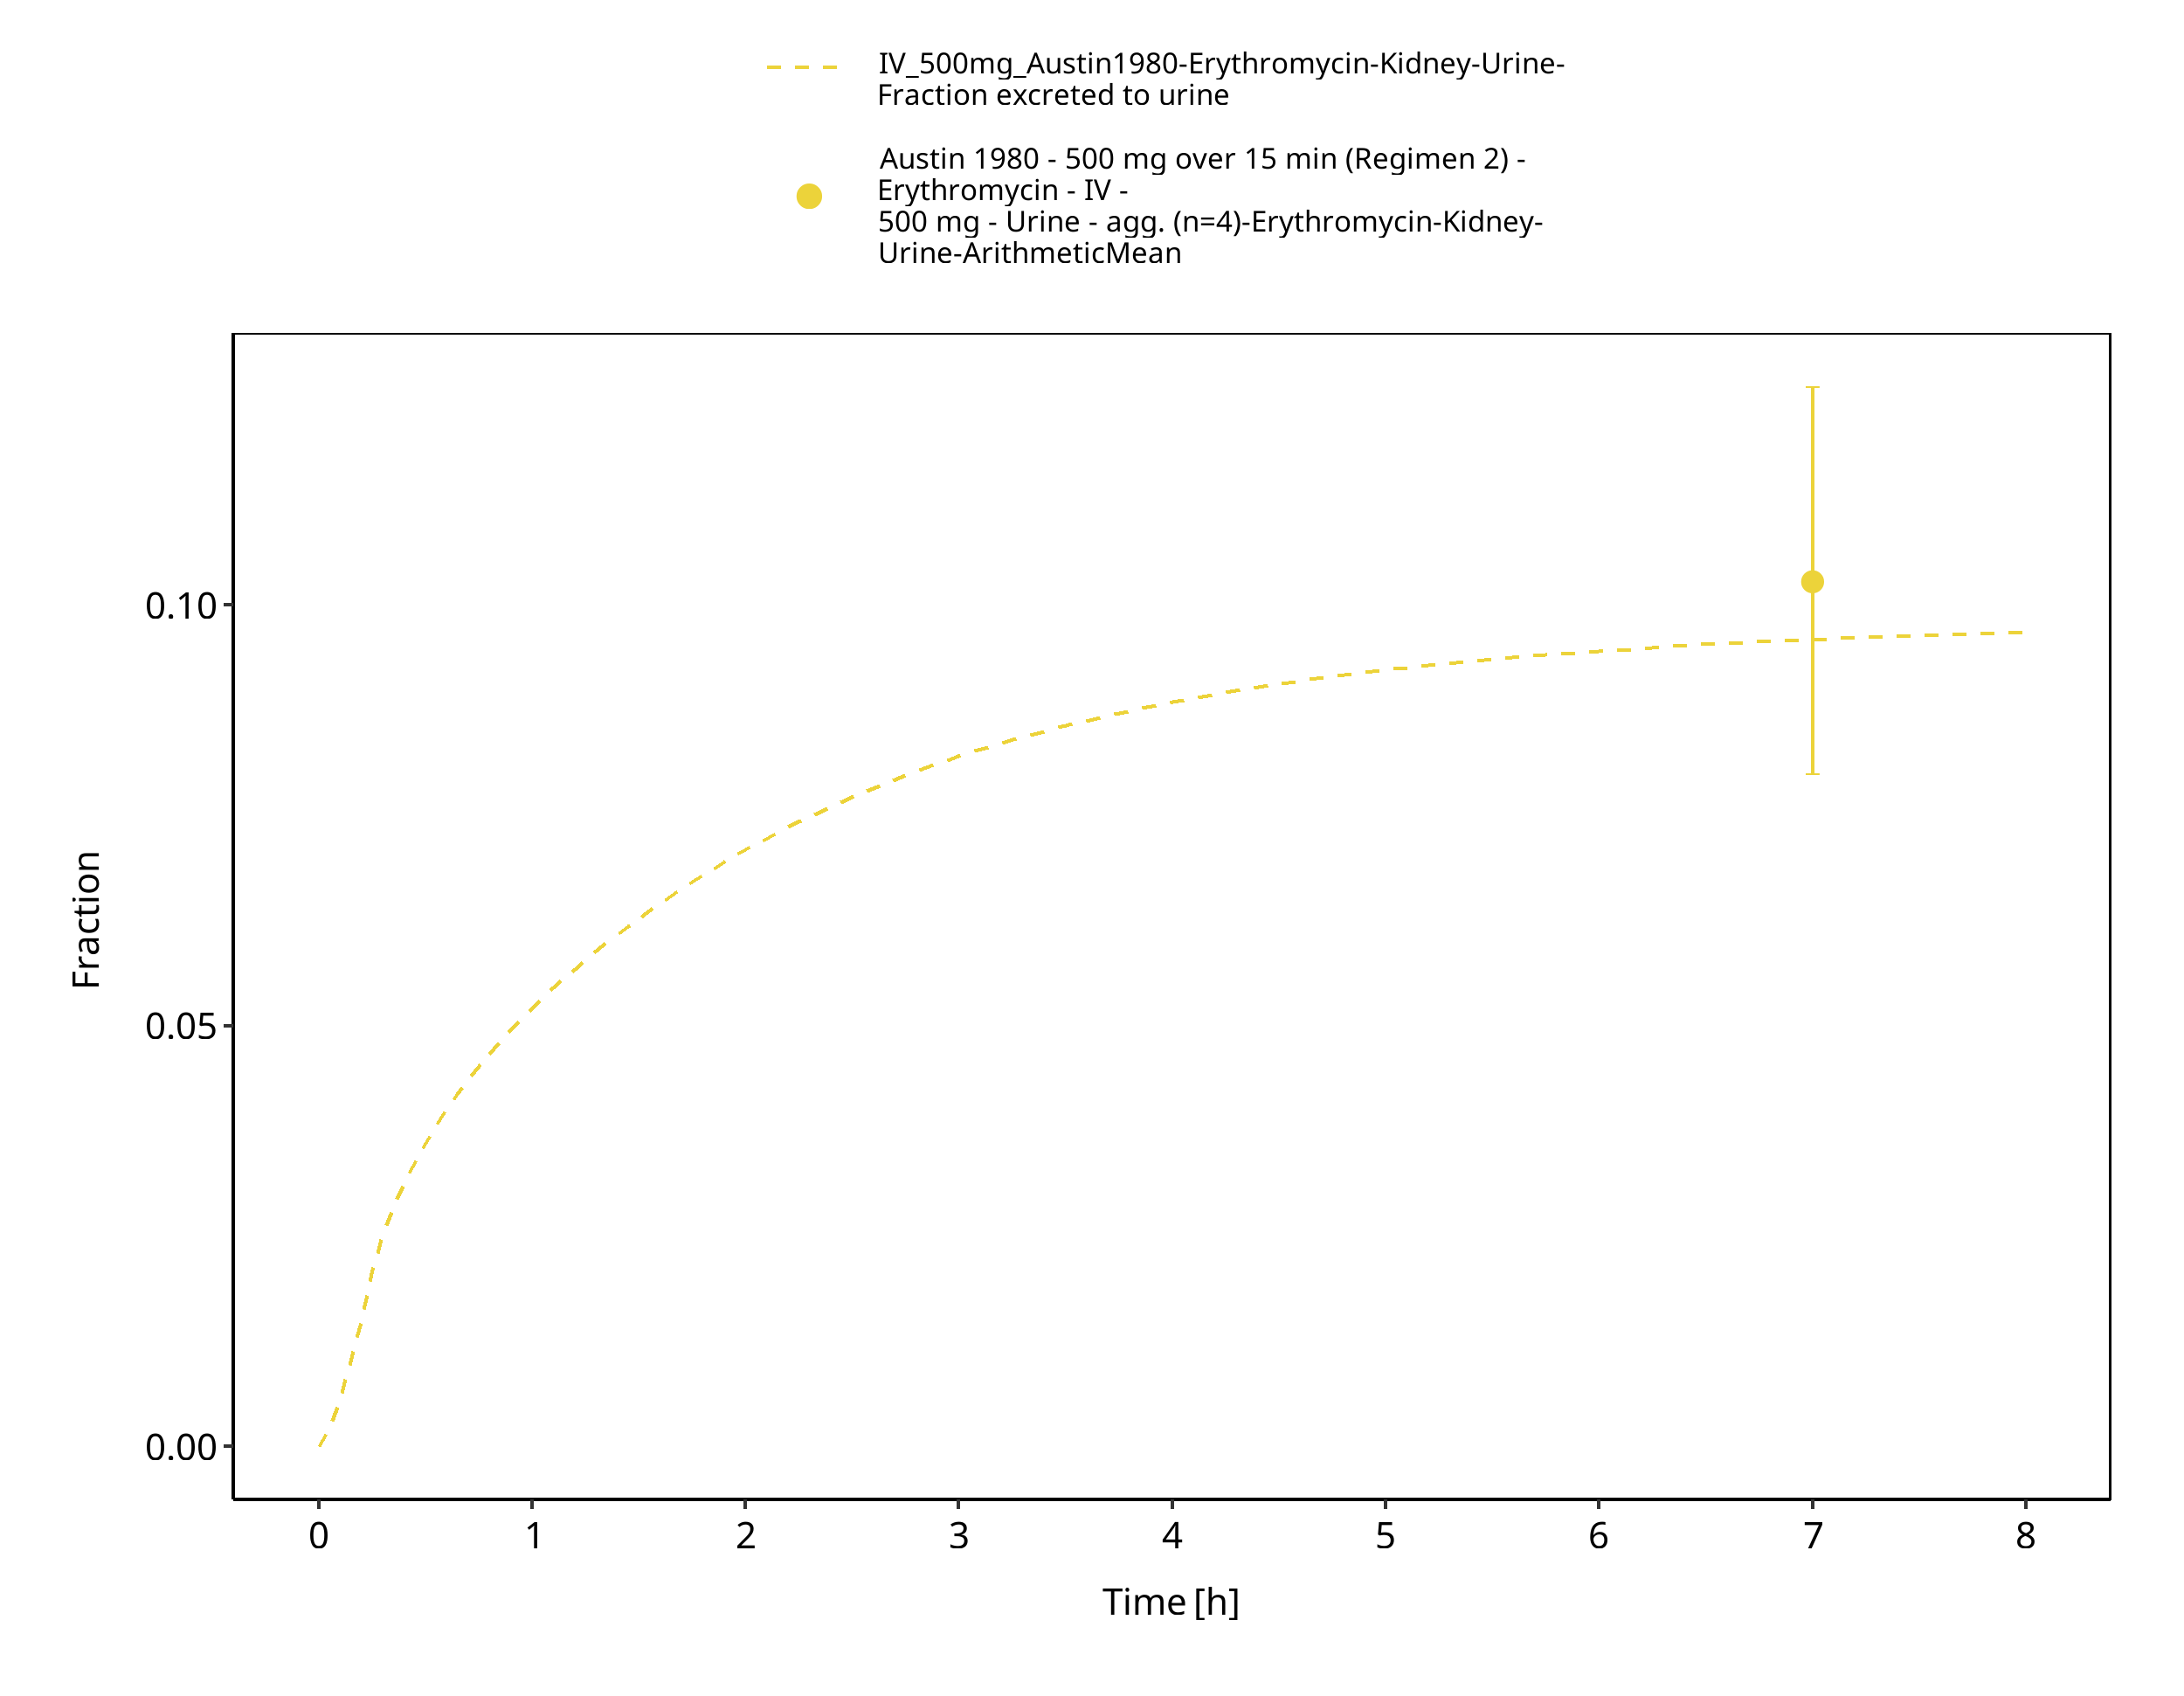
Figure 3-38: Time Profile Analysis 1
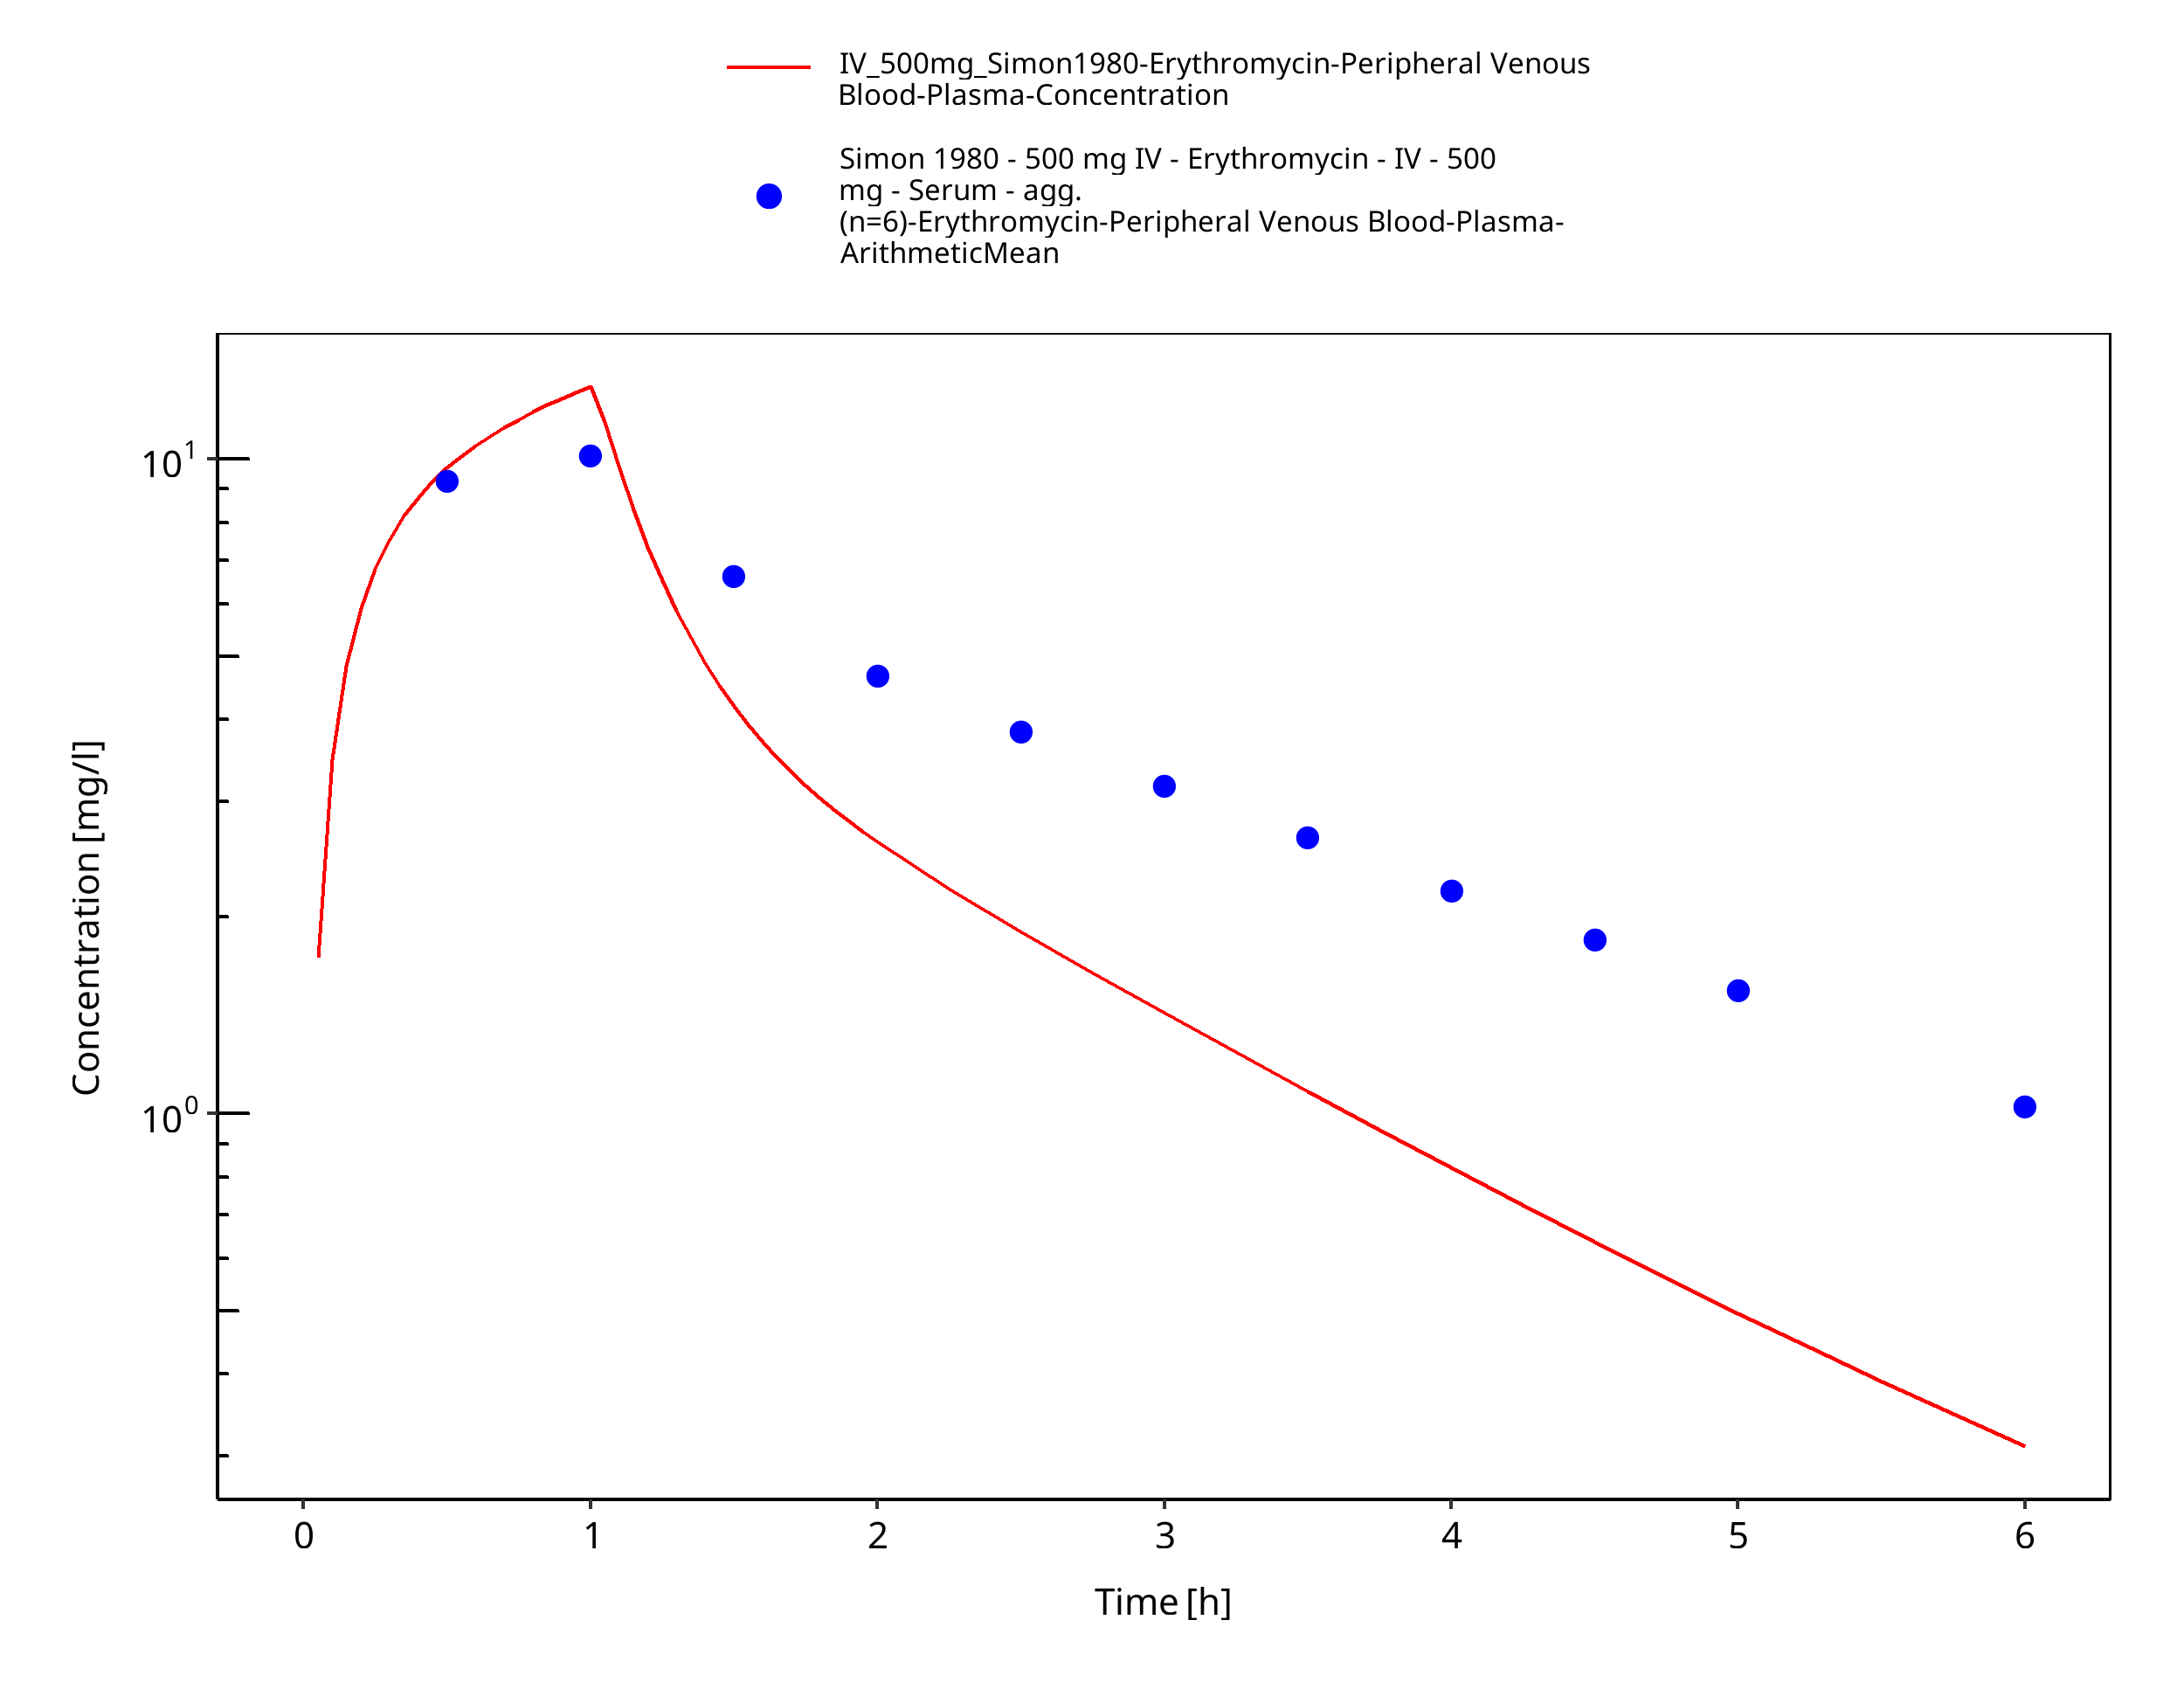
Figure 3-39: Time Profile Analysis
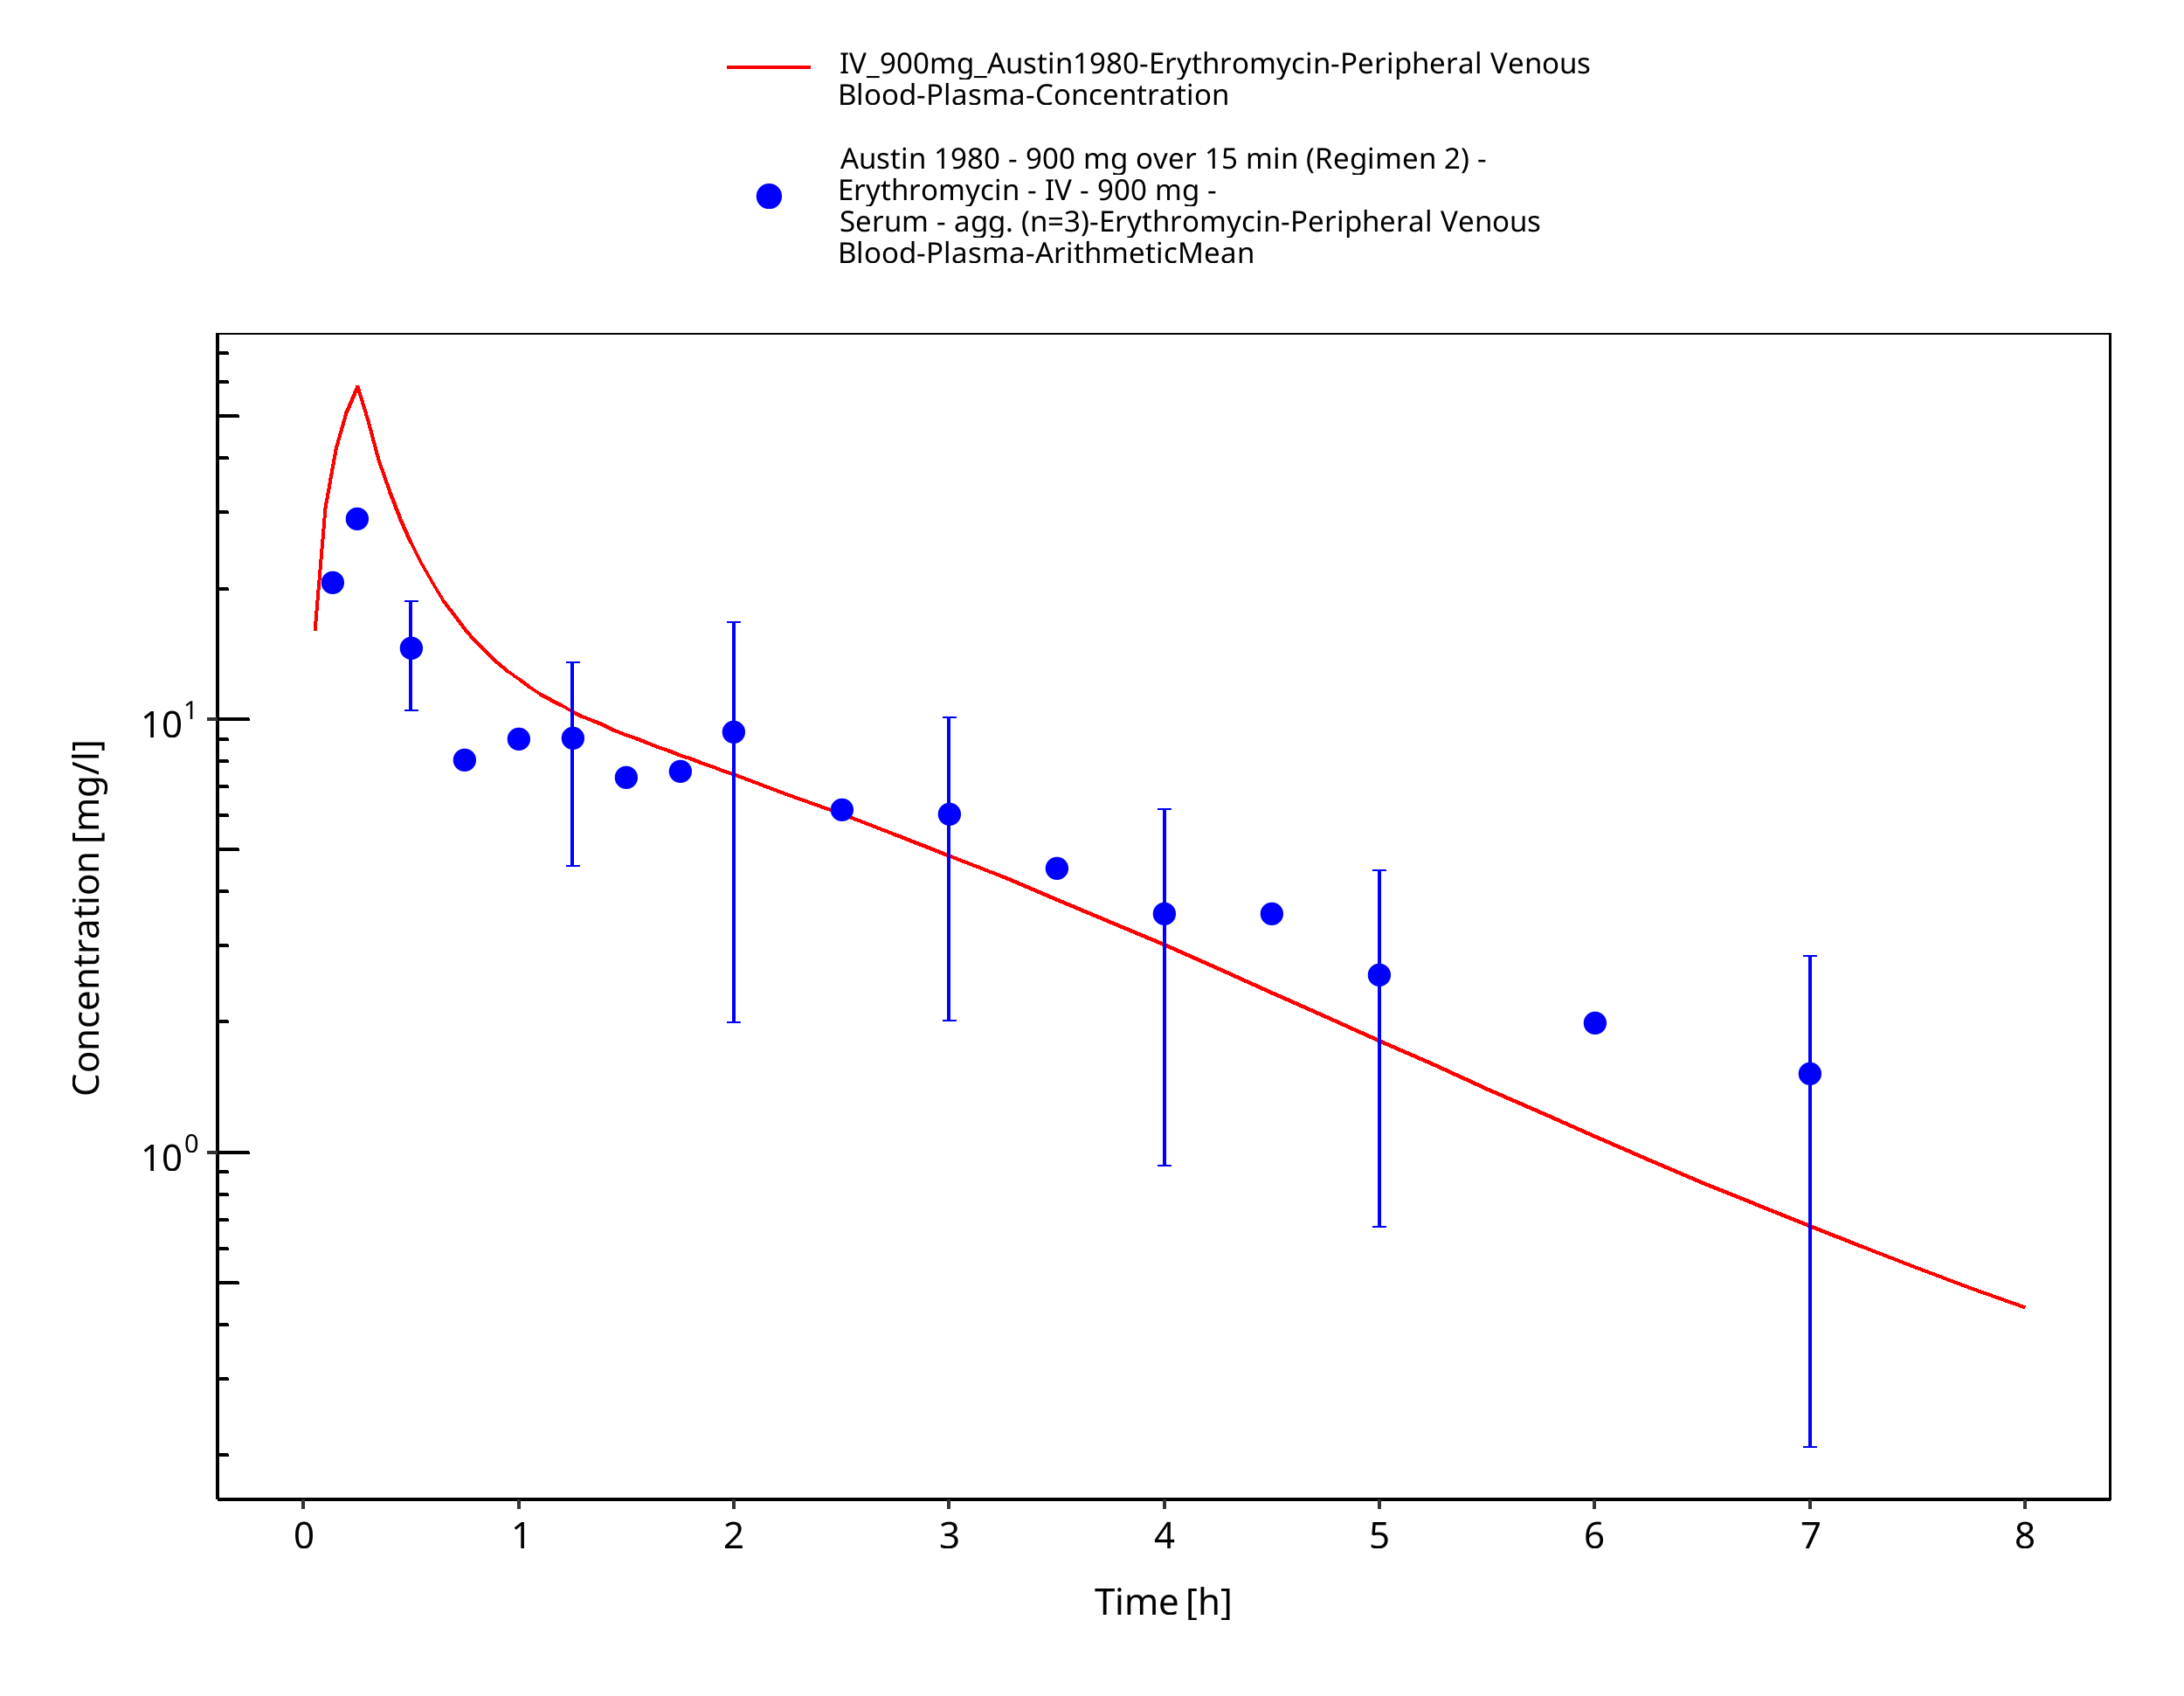
Figure 3-40: Time Profile Analysis
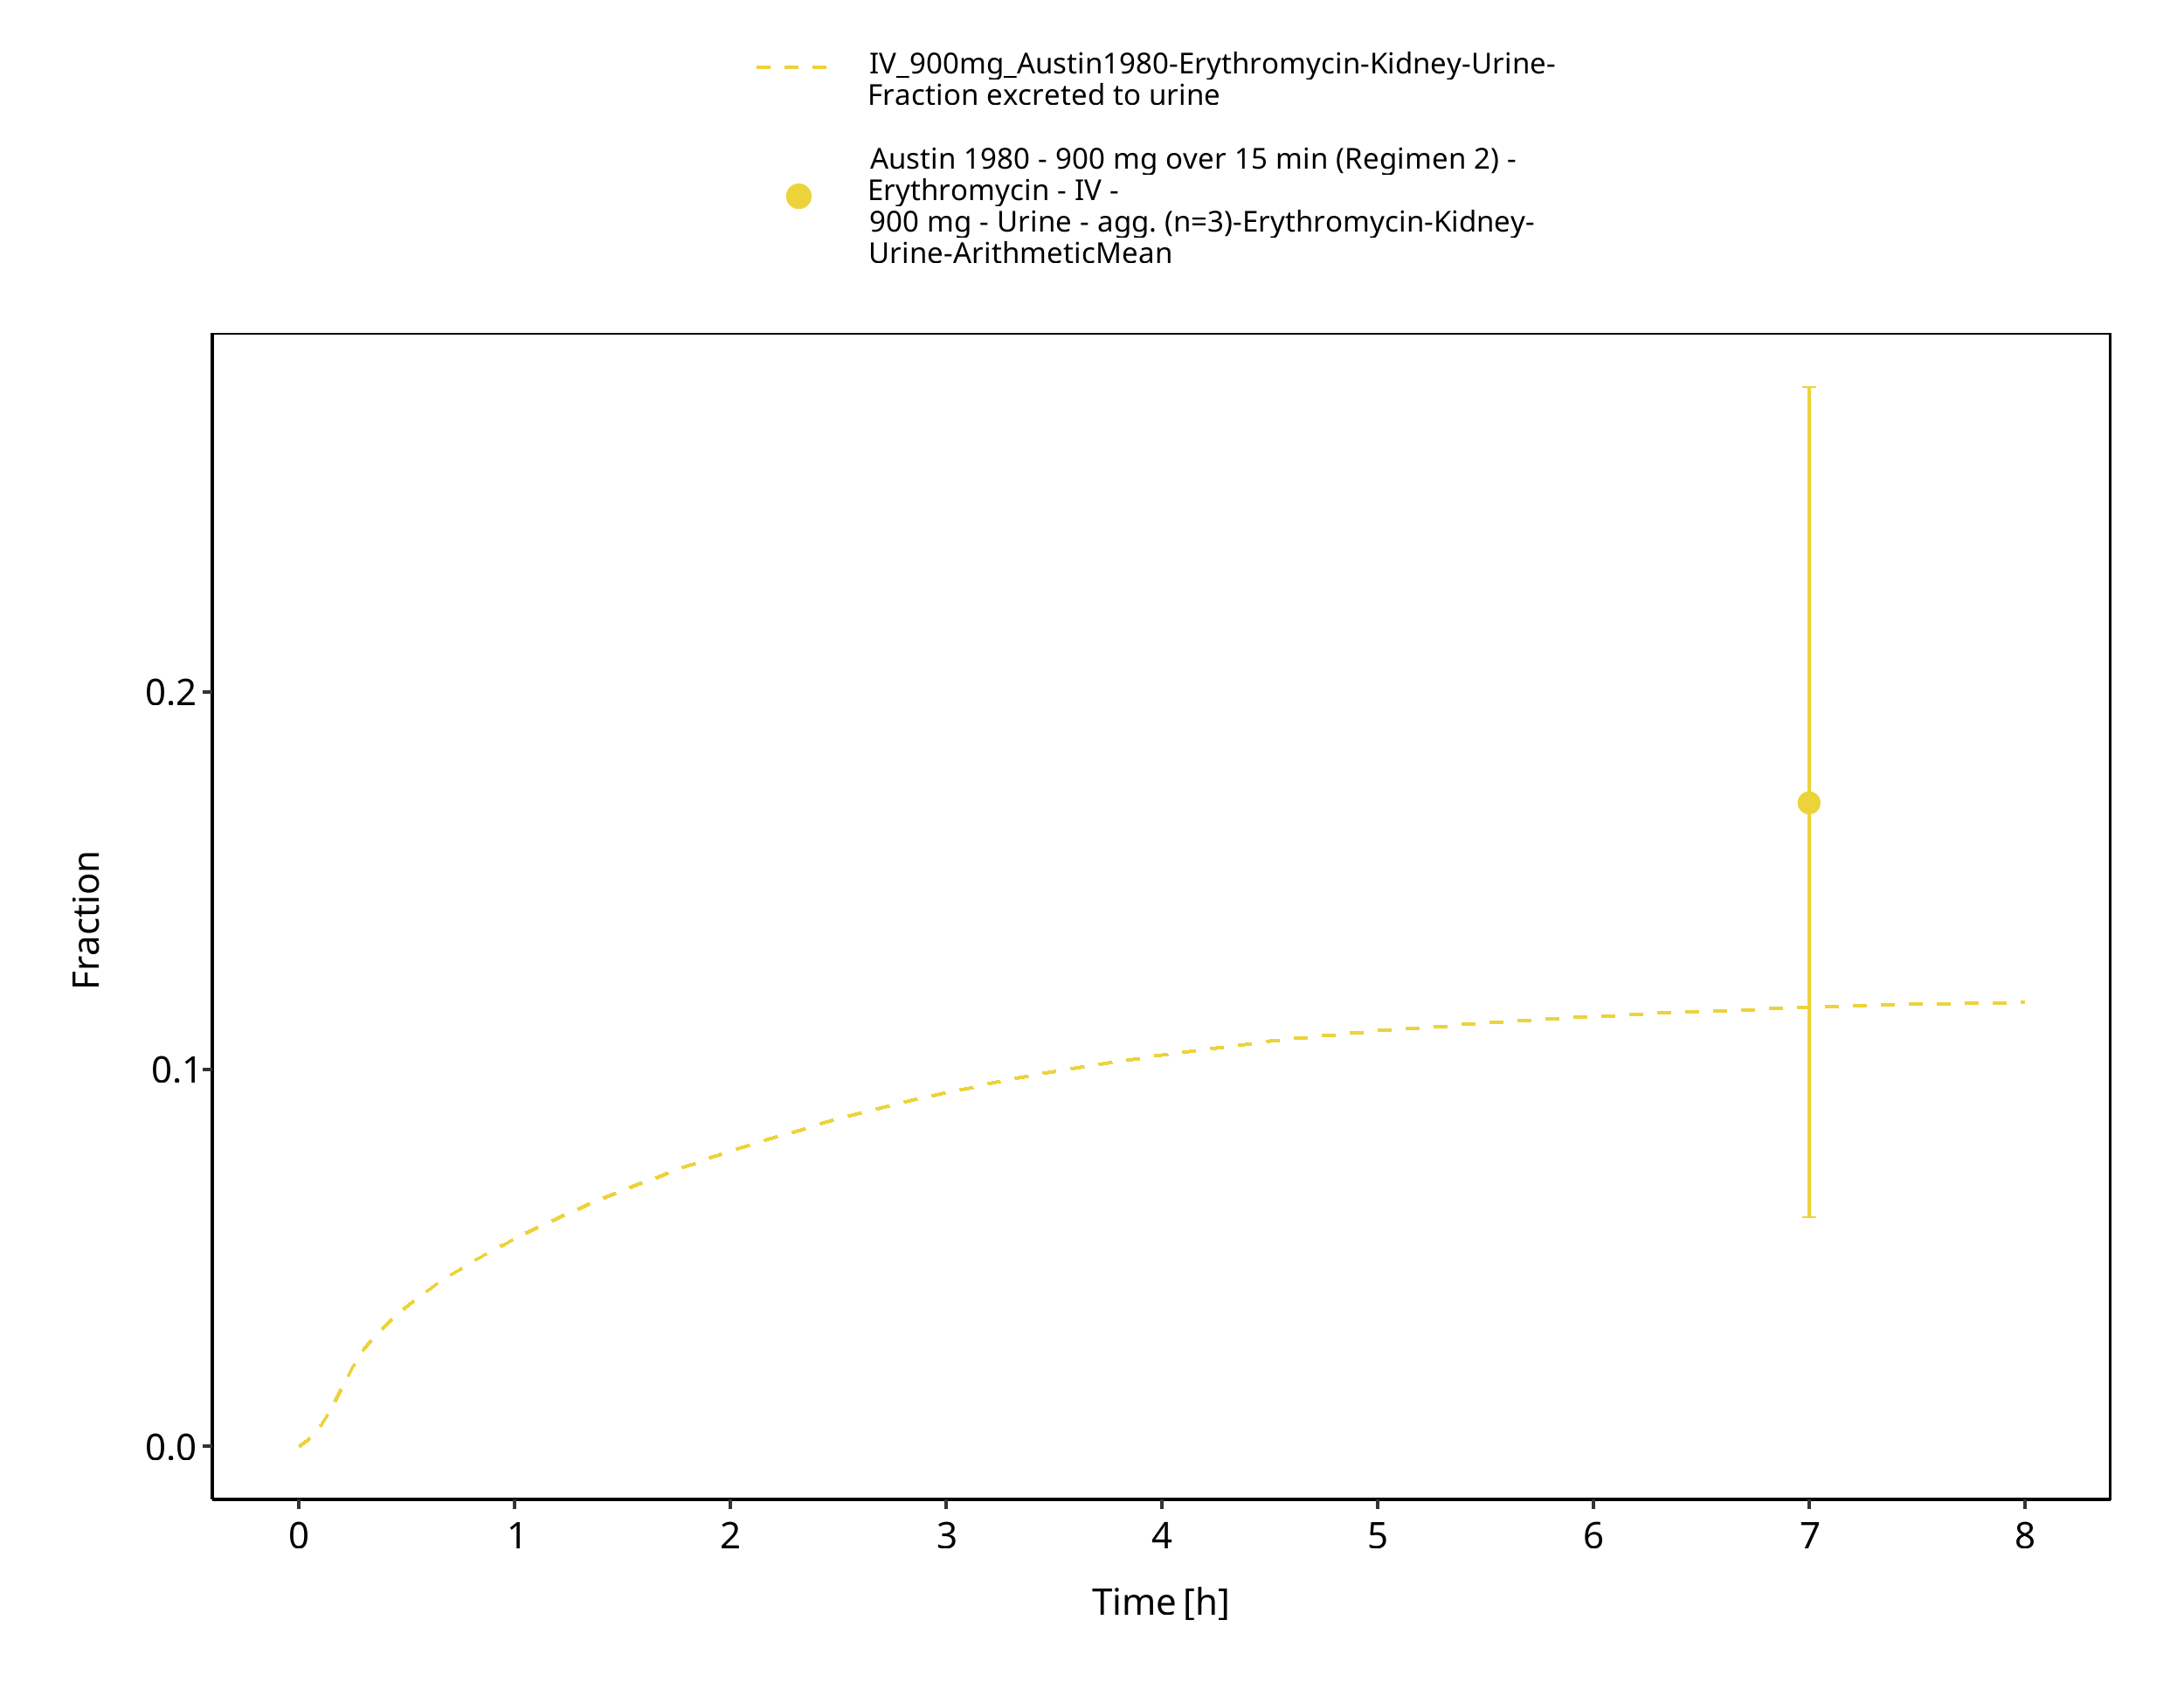
Figure 3-41: Time Profile Analysis 1
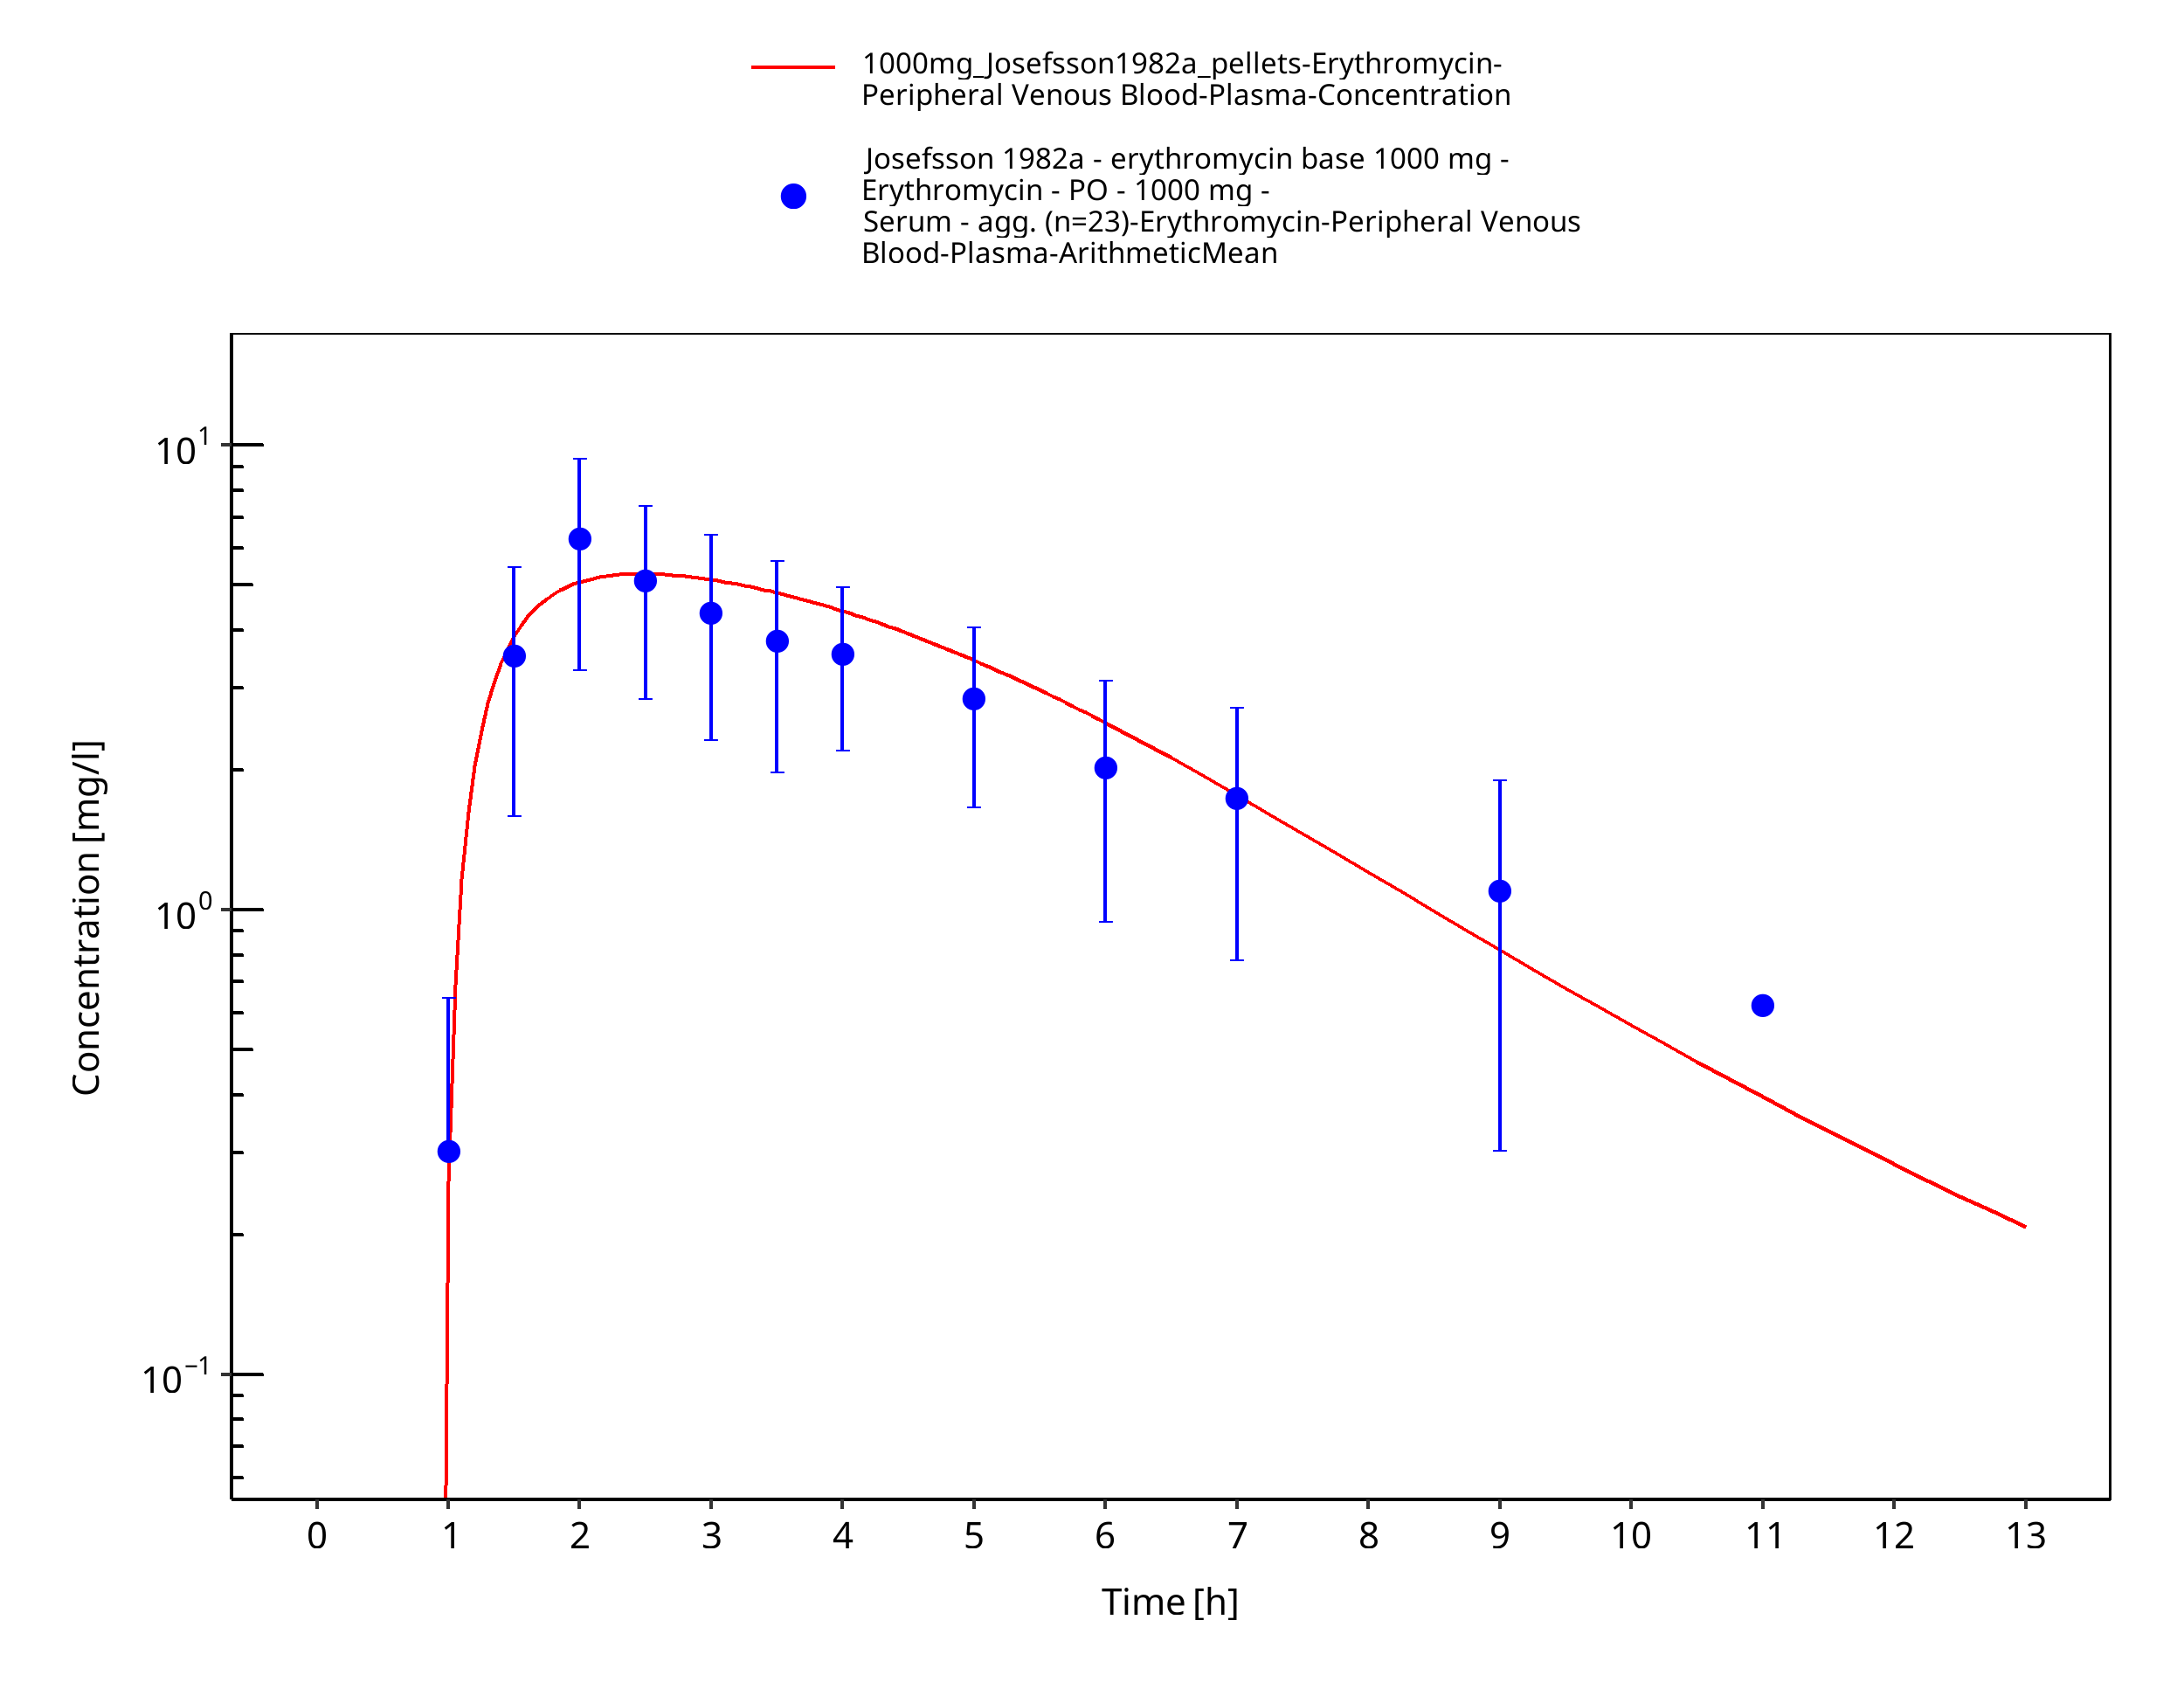
Figure 3-42: Time Profile Analysis
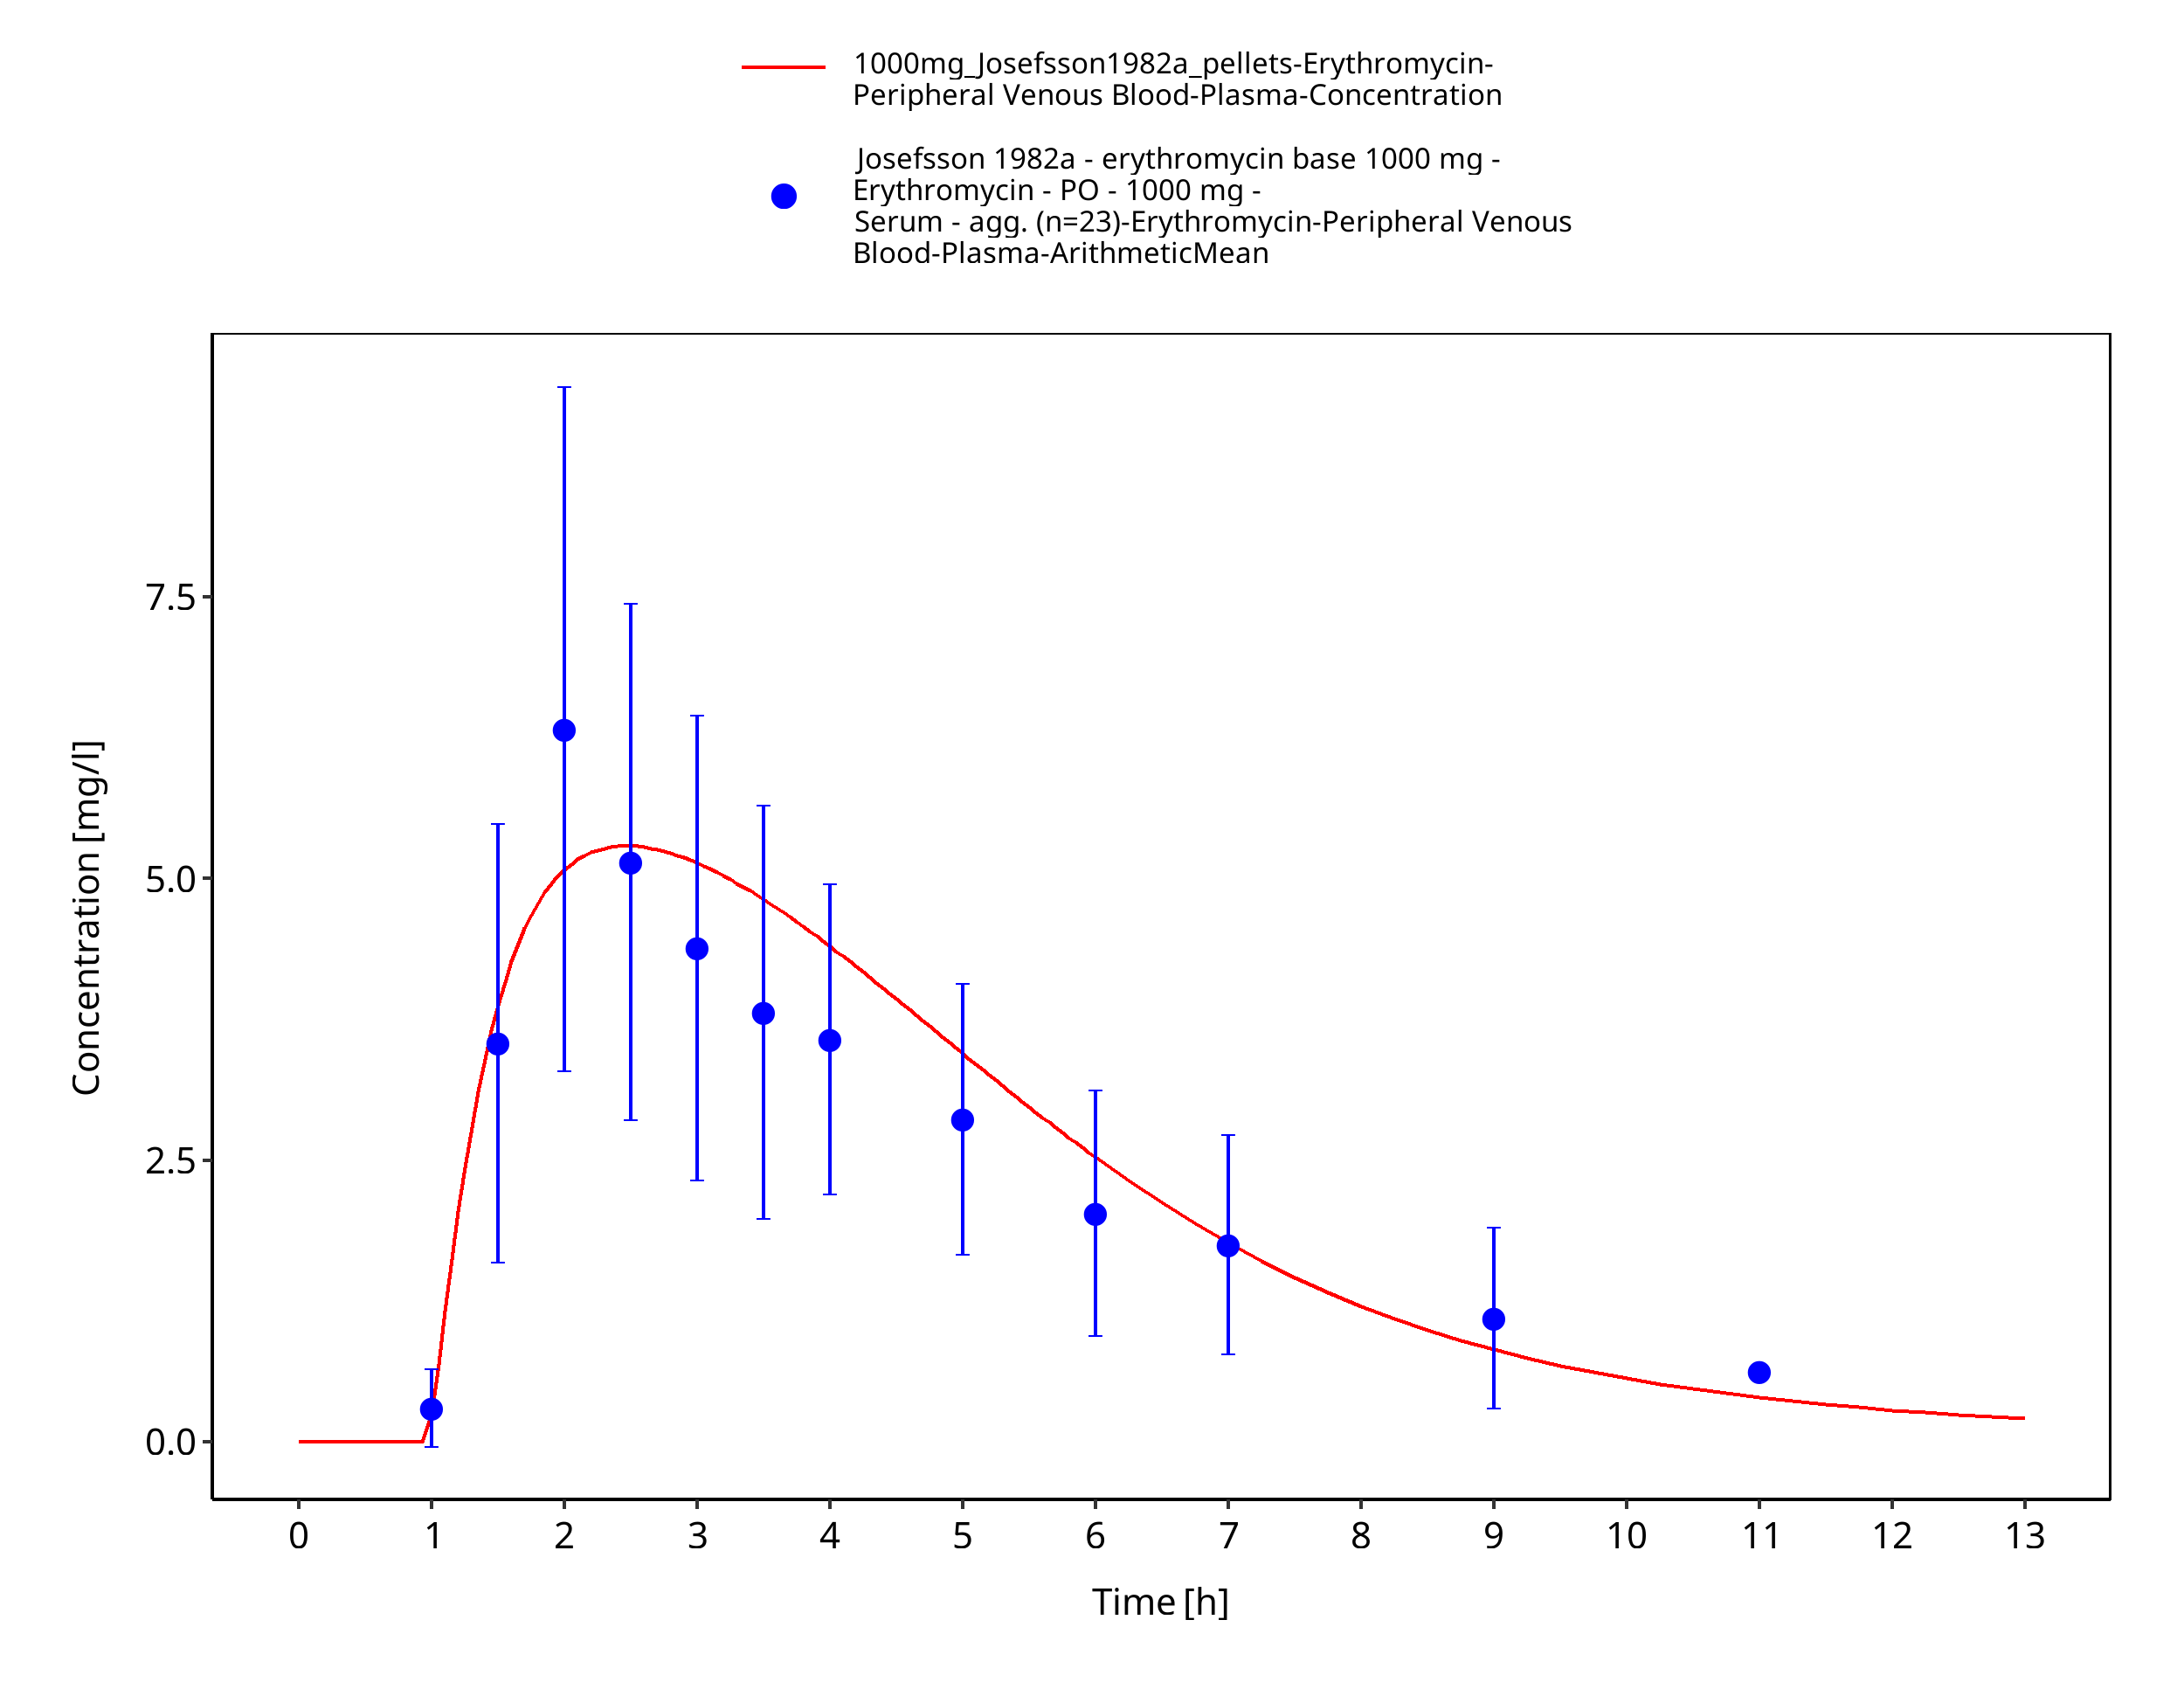
Figure 3-43: Time Profile Analysis 1
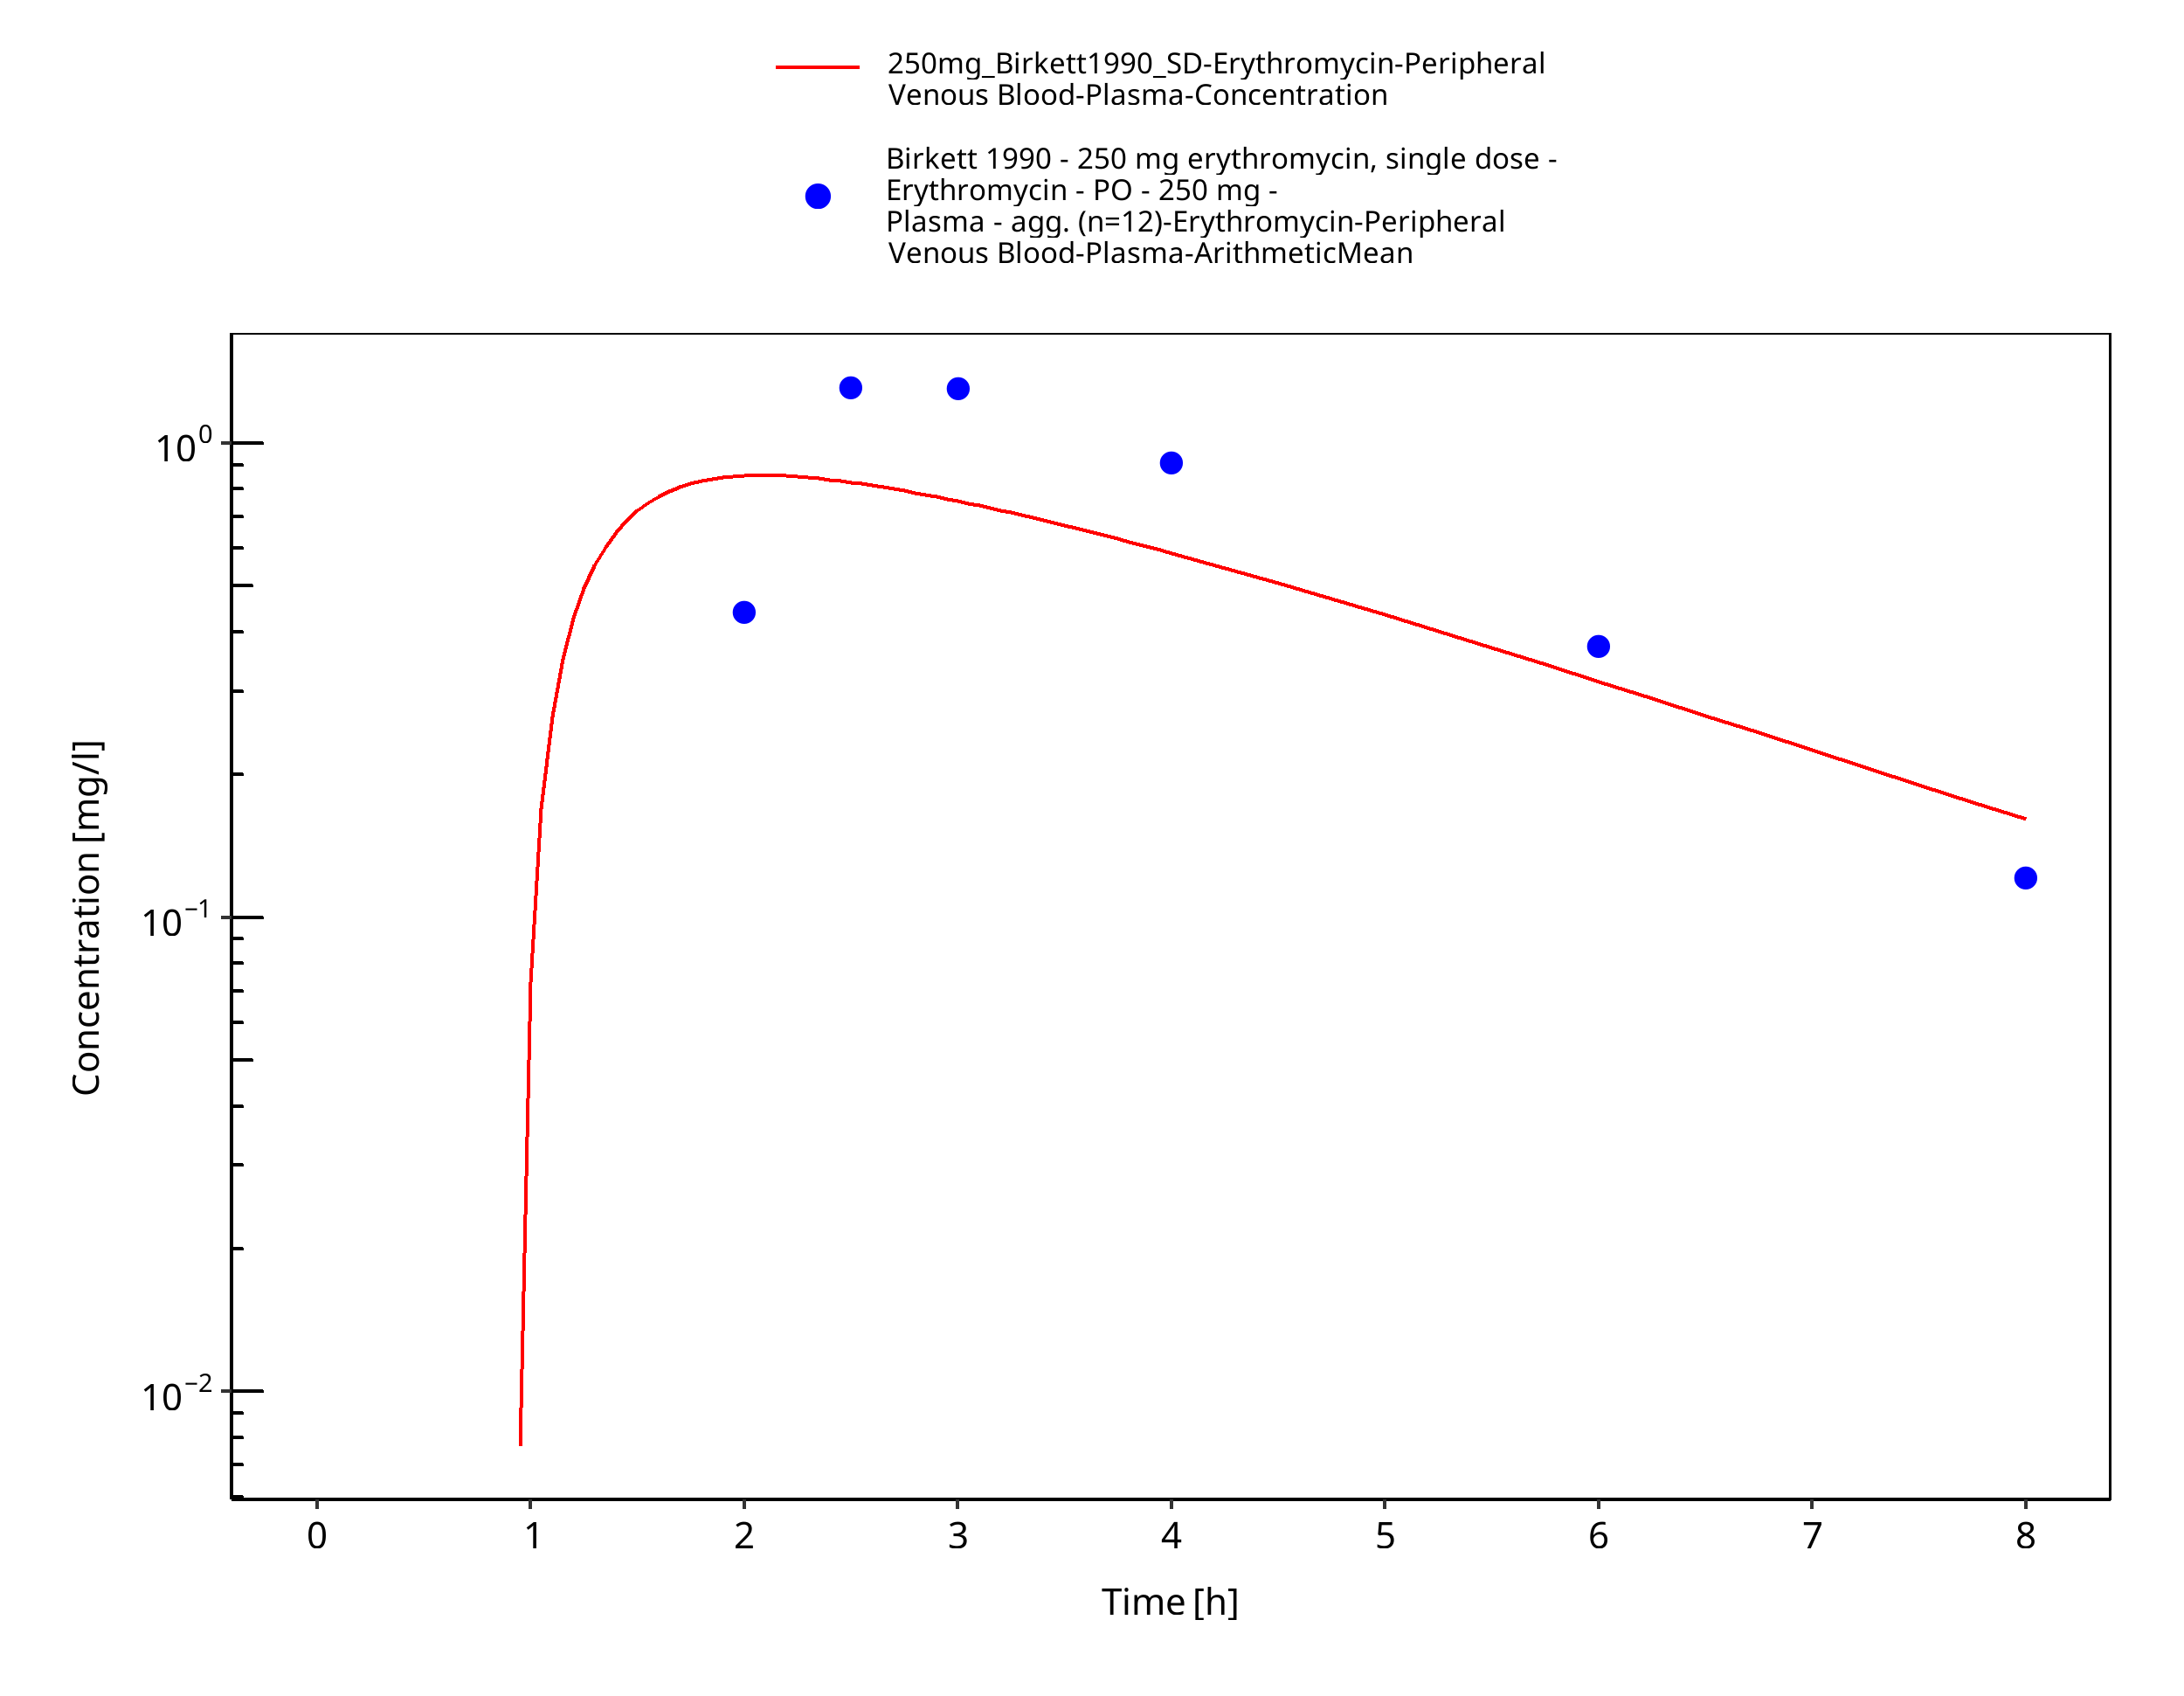
Figure 3-44: Time Profile Analysis
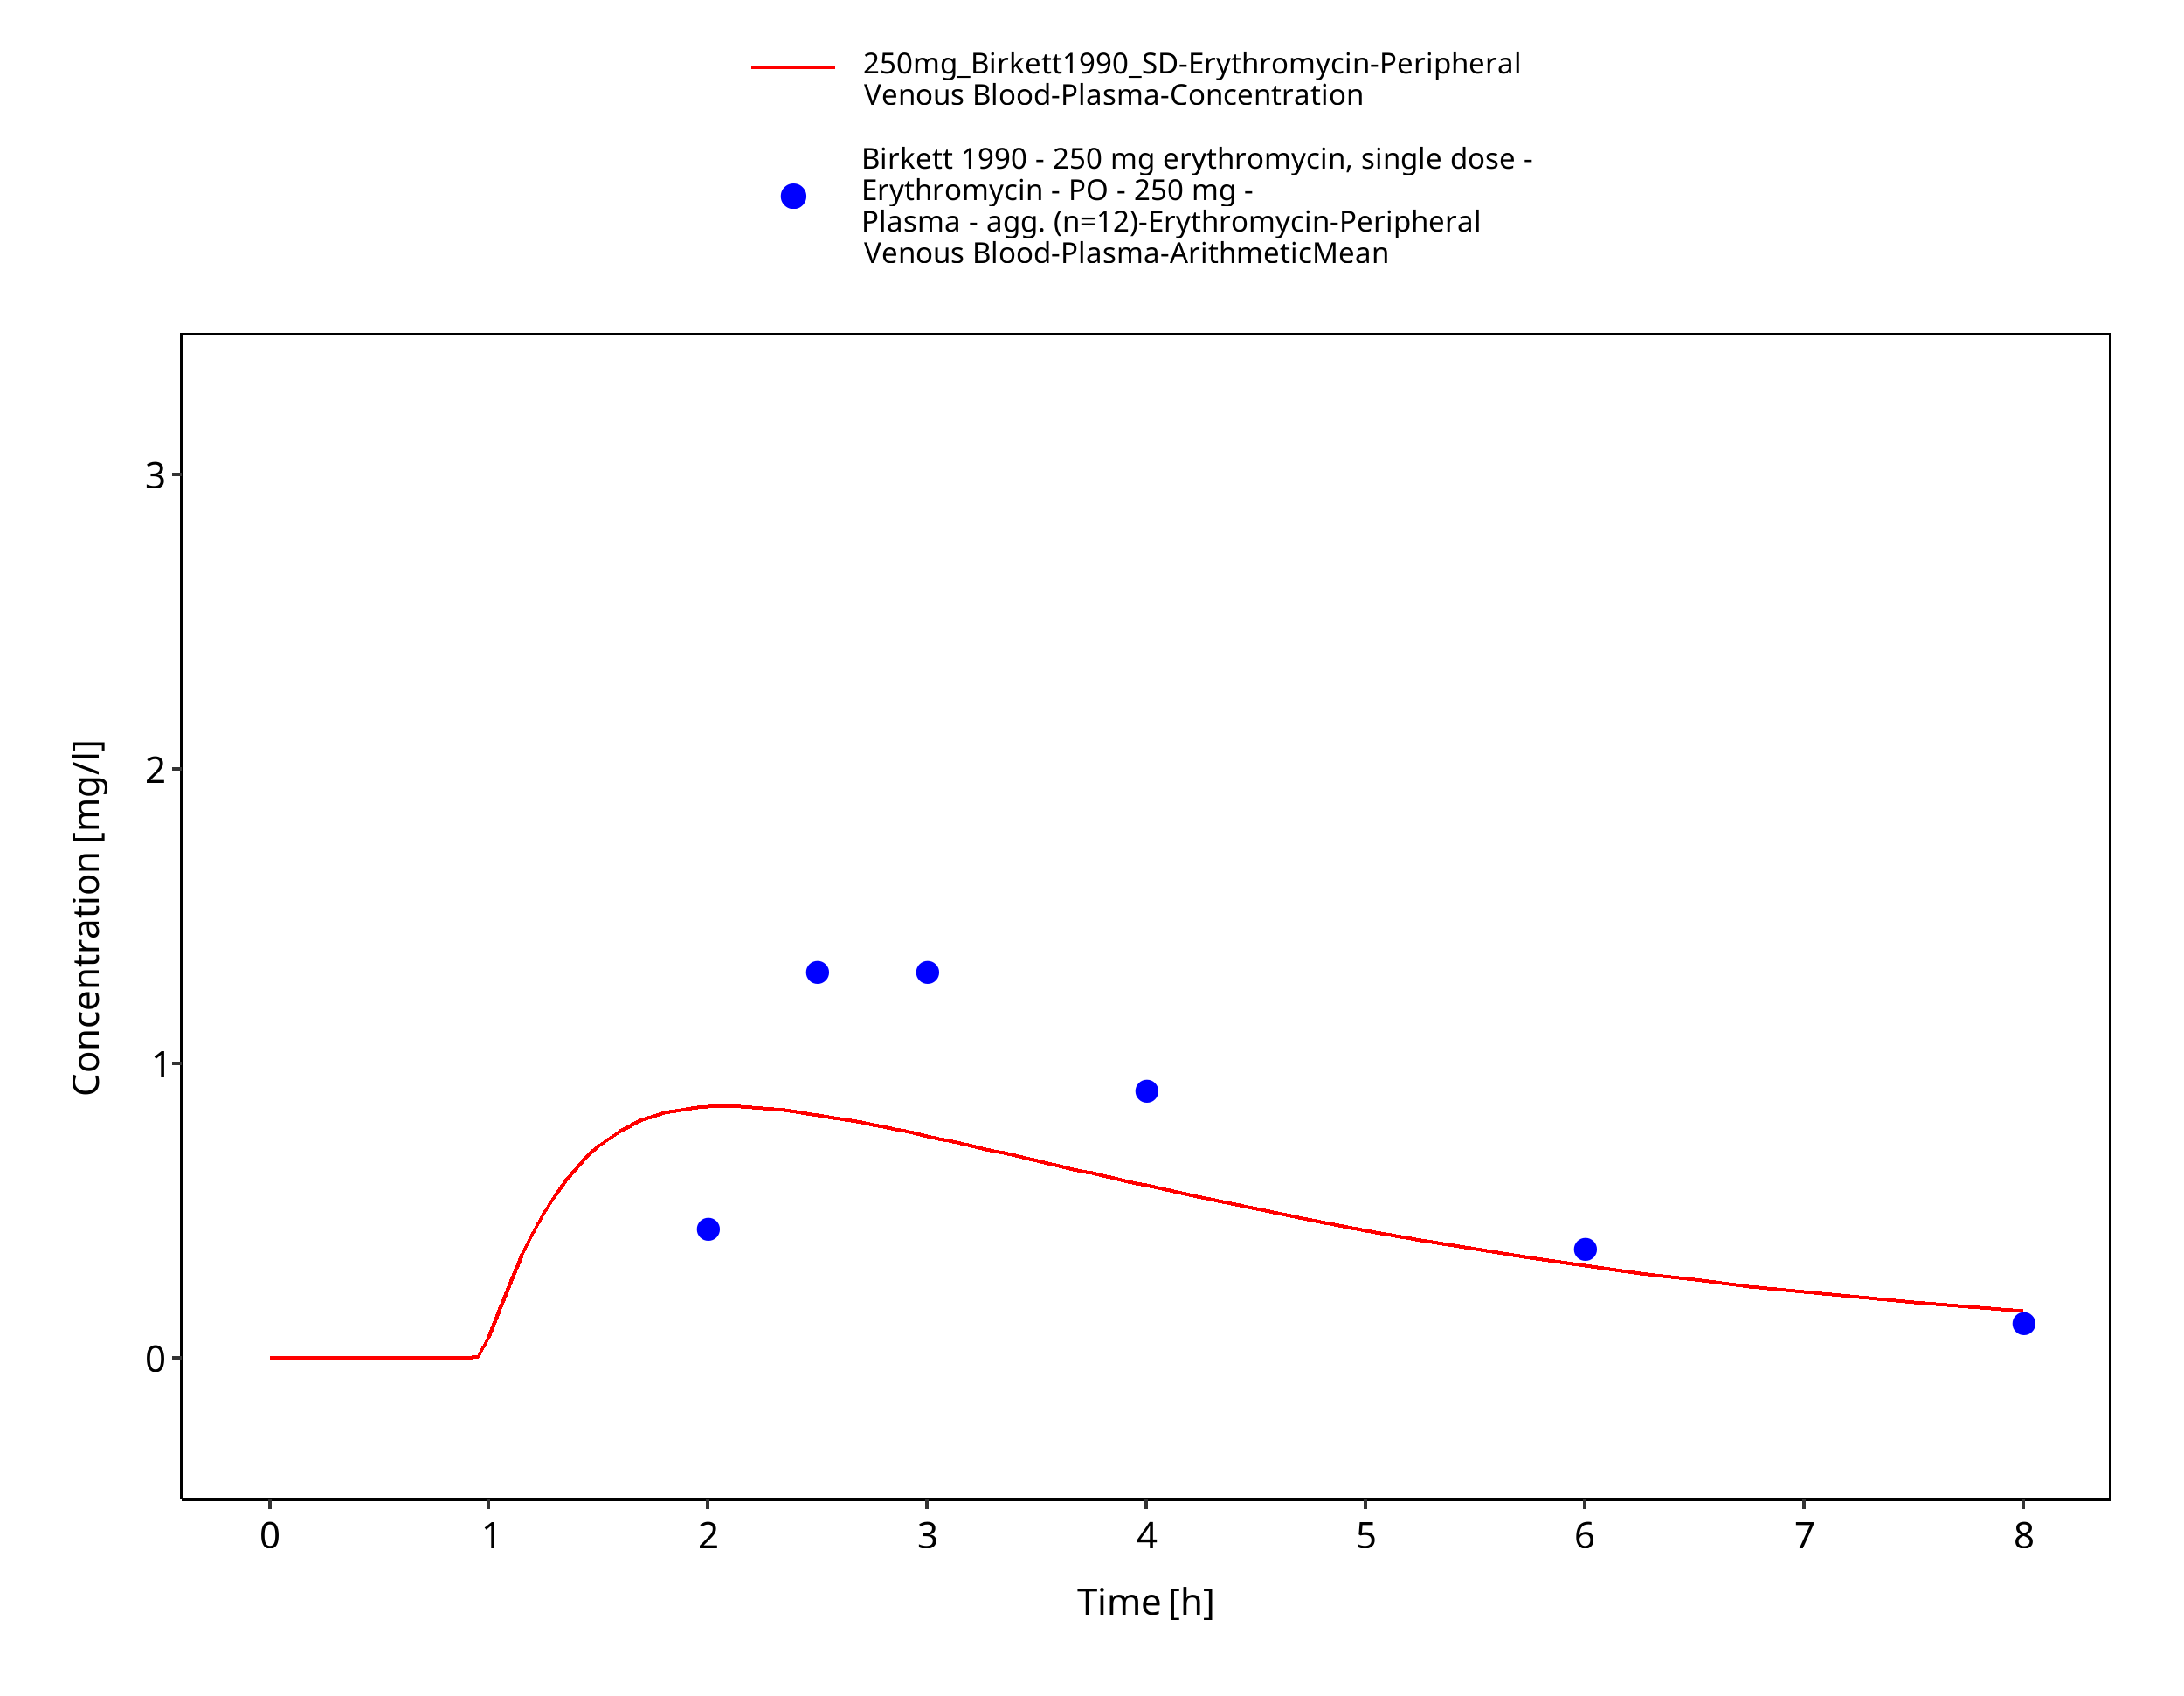
Figure 3-45: Time Profile Analysis 1
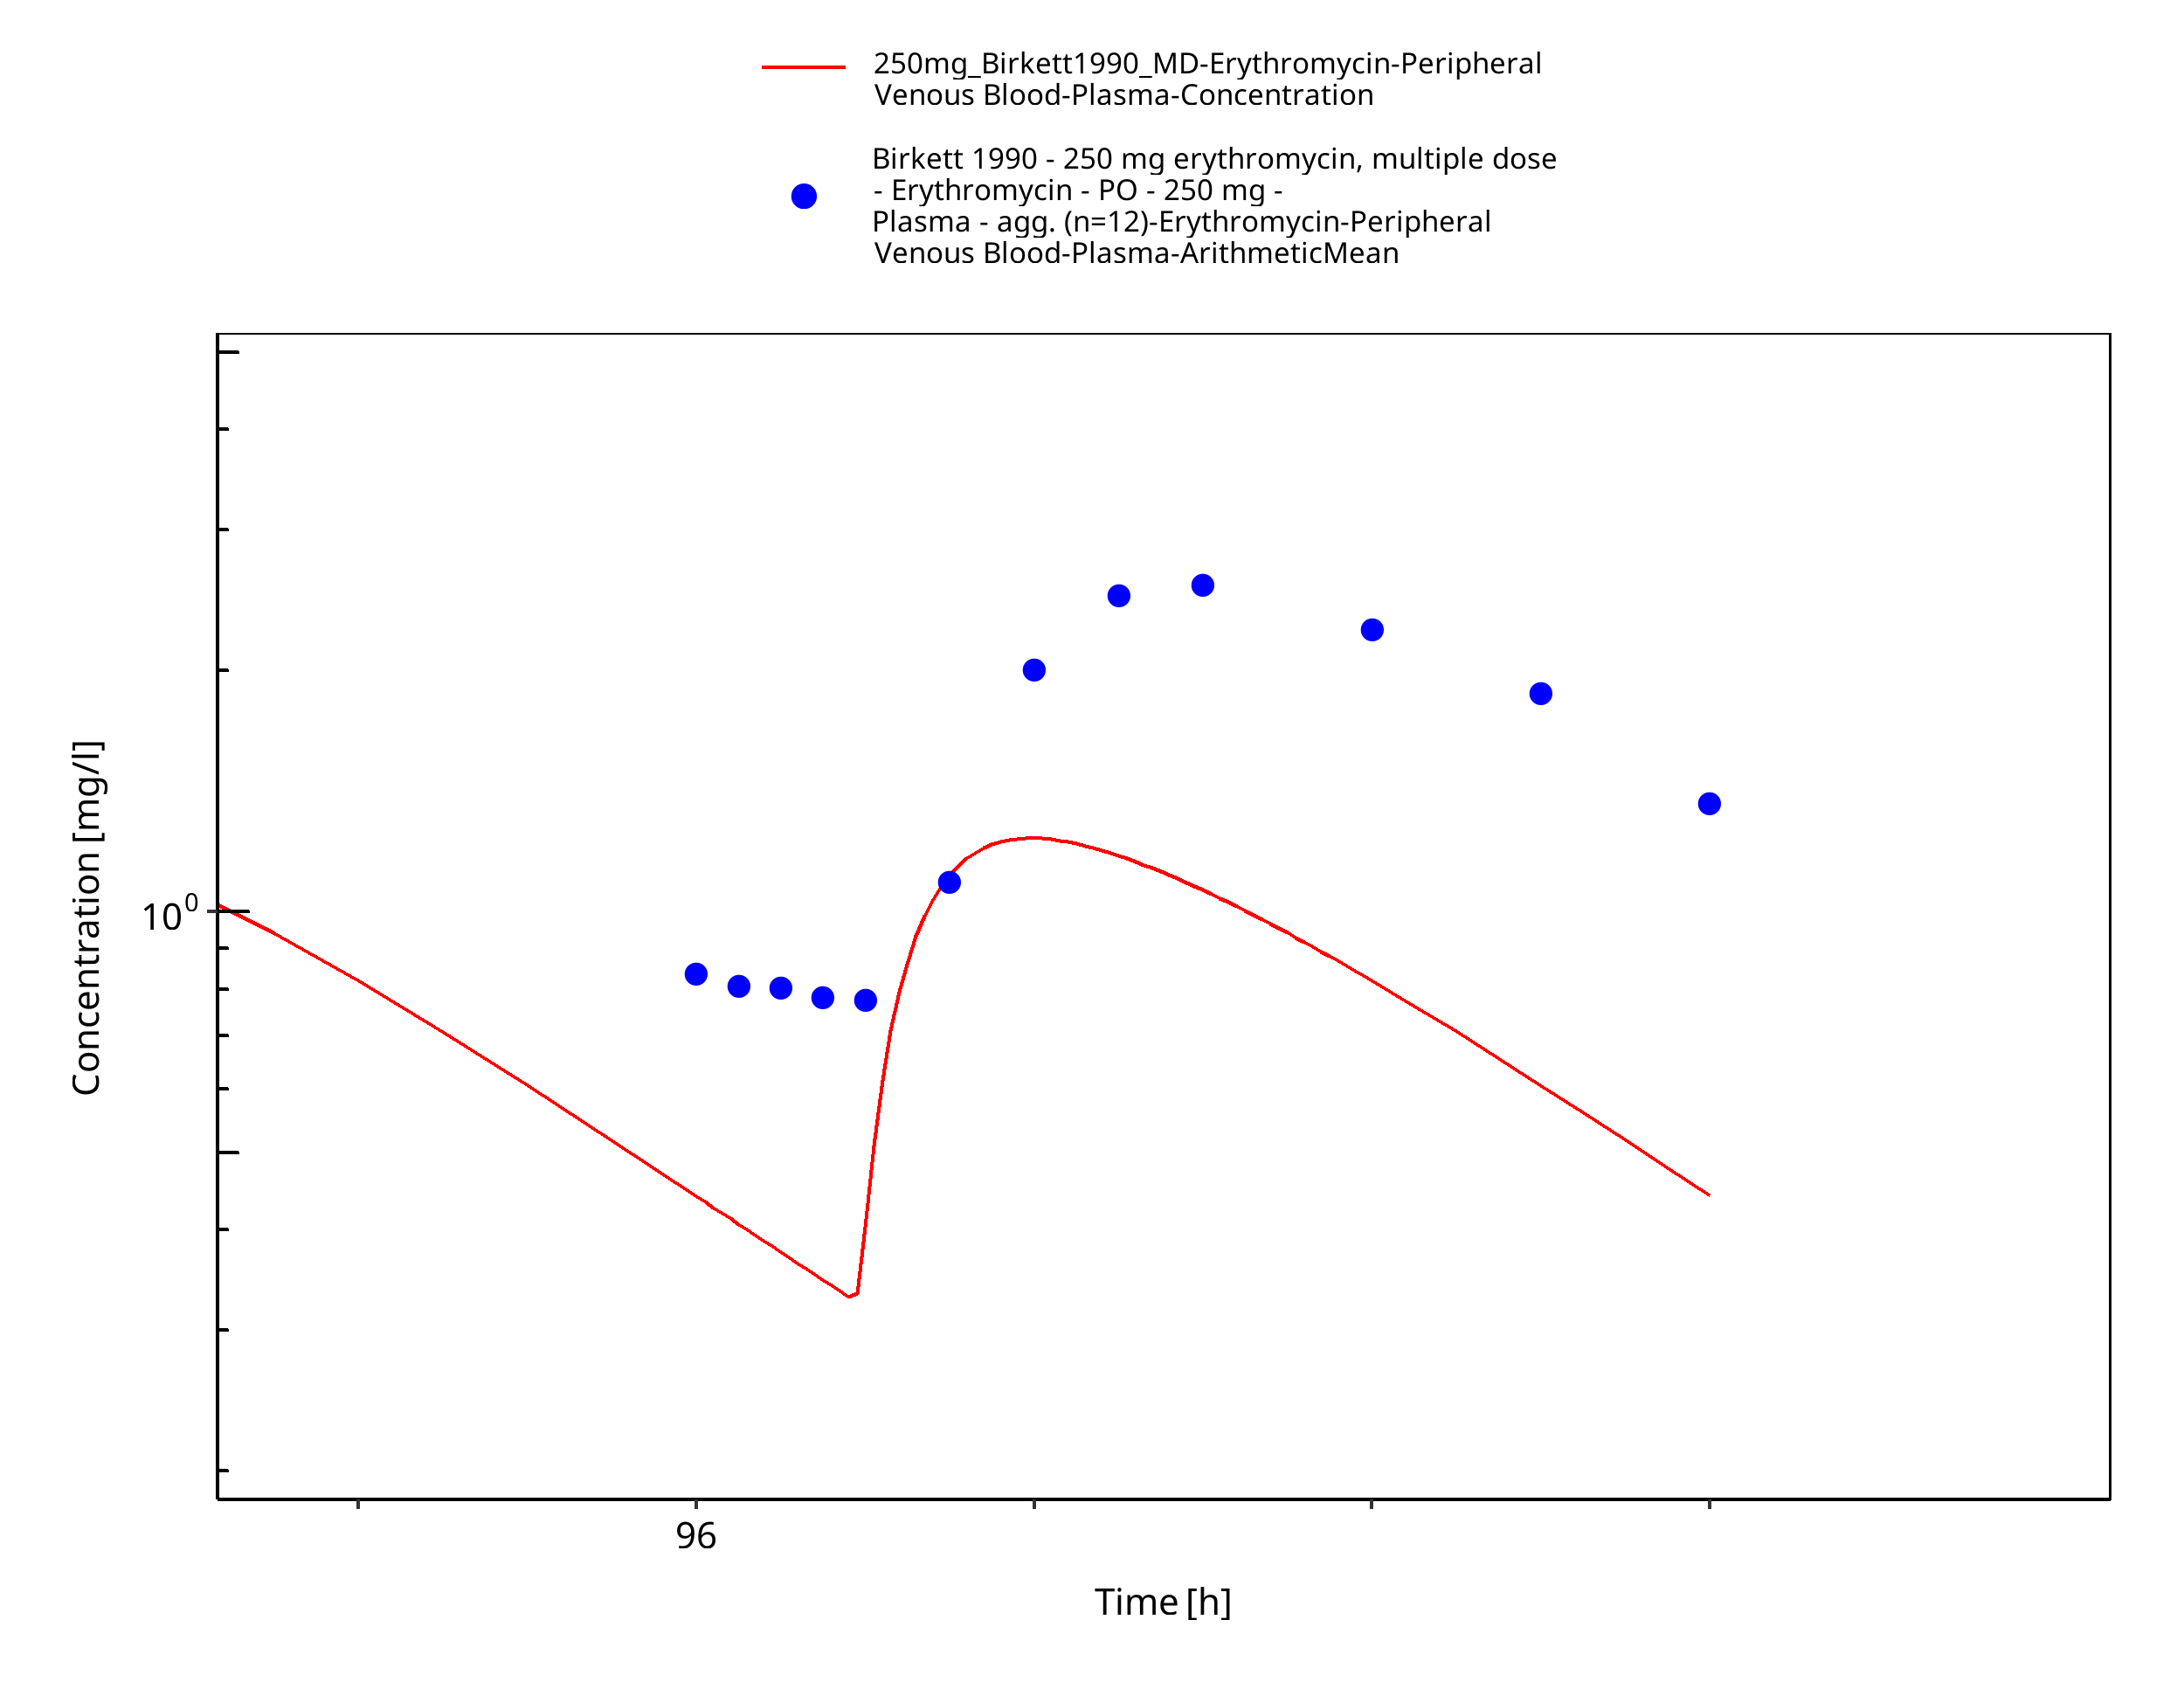
Figure 3-46: Time Profile Analysis
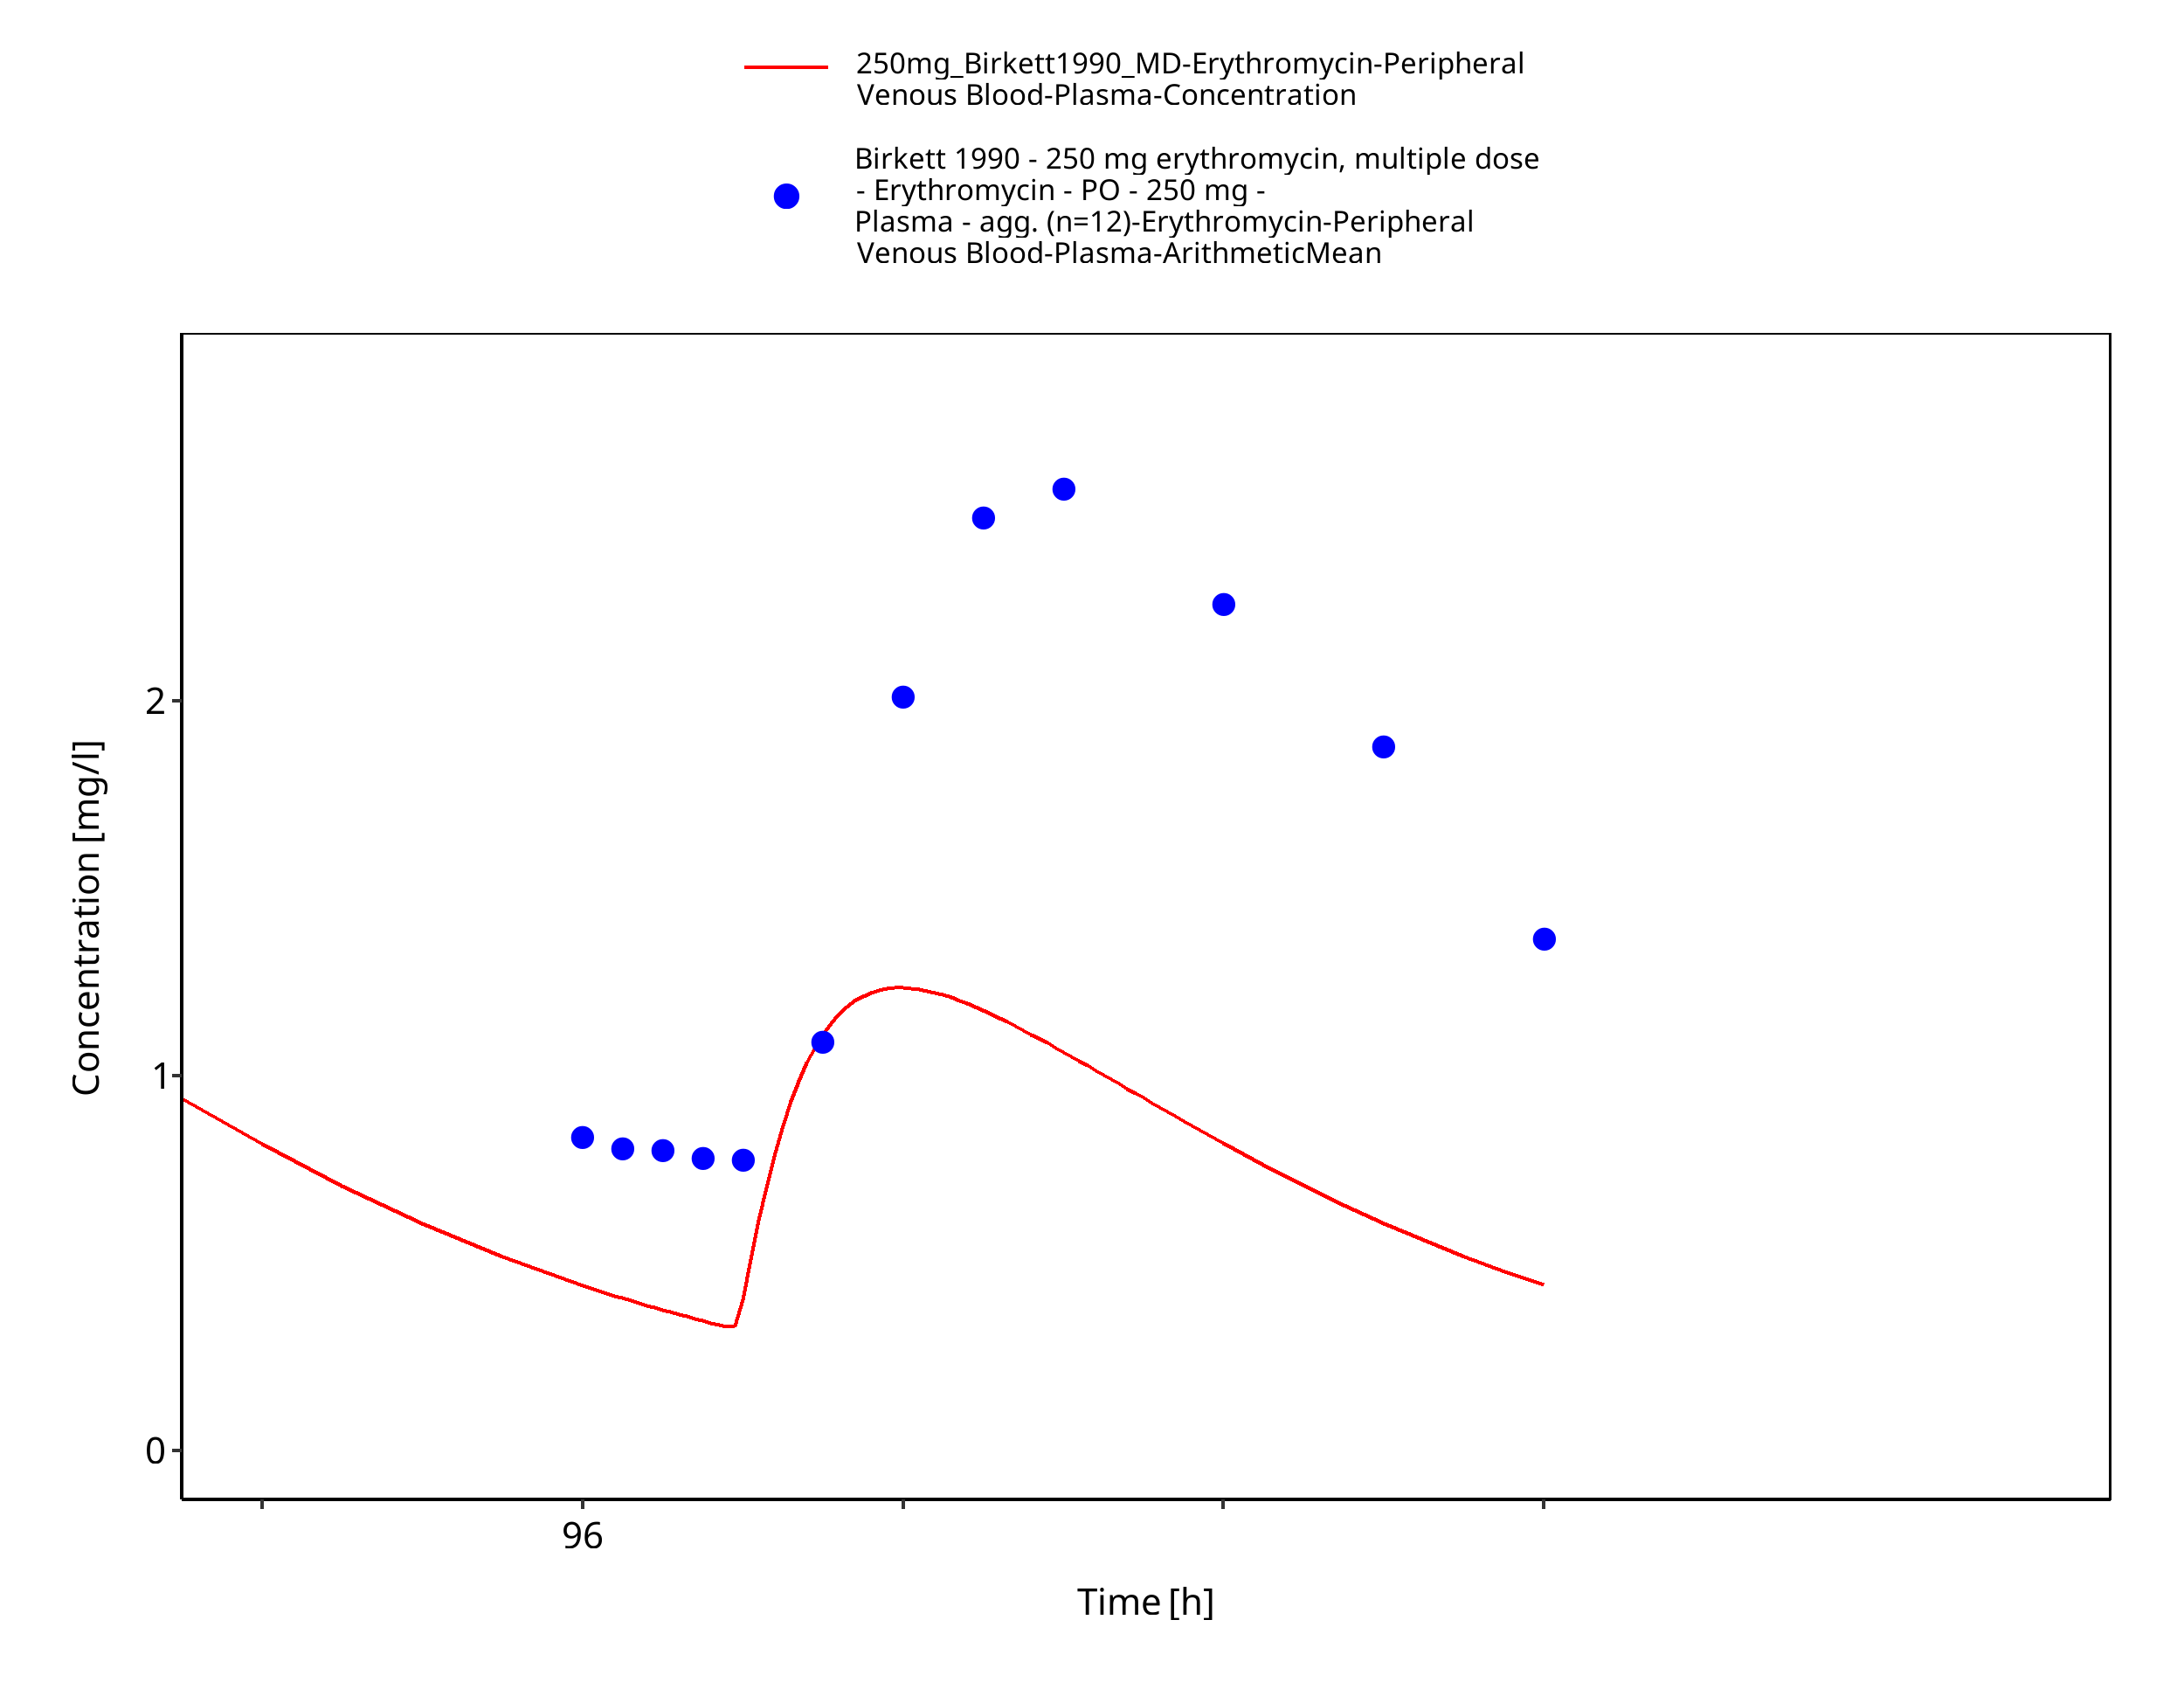
Figure 3-47: Time Profile Analysis 1
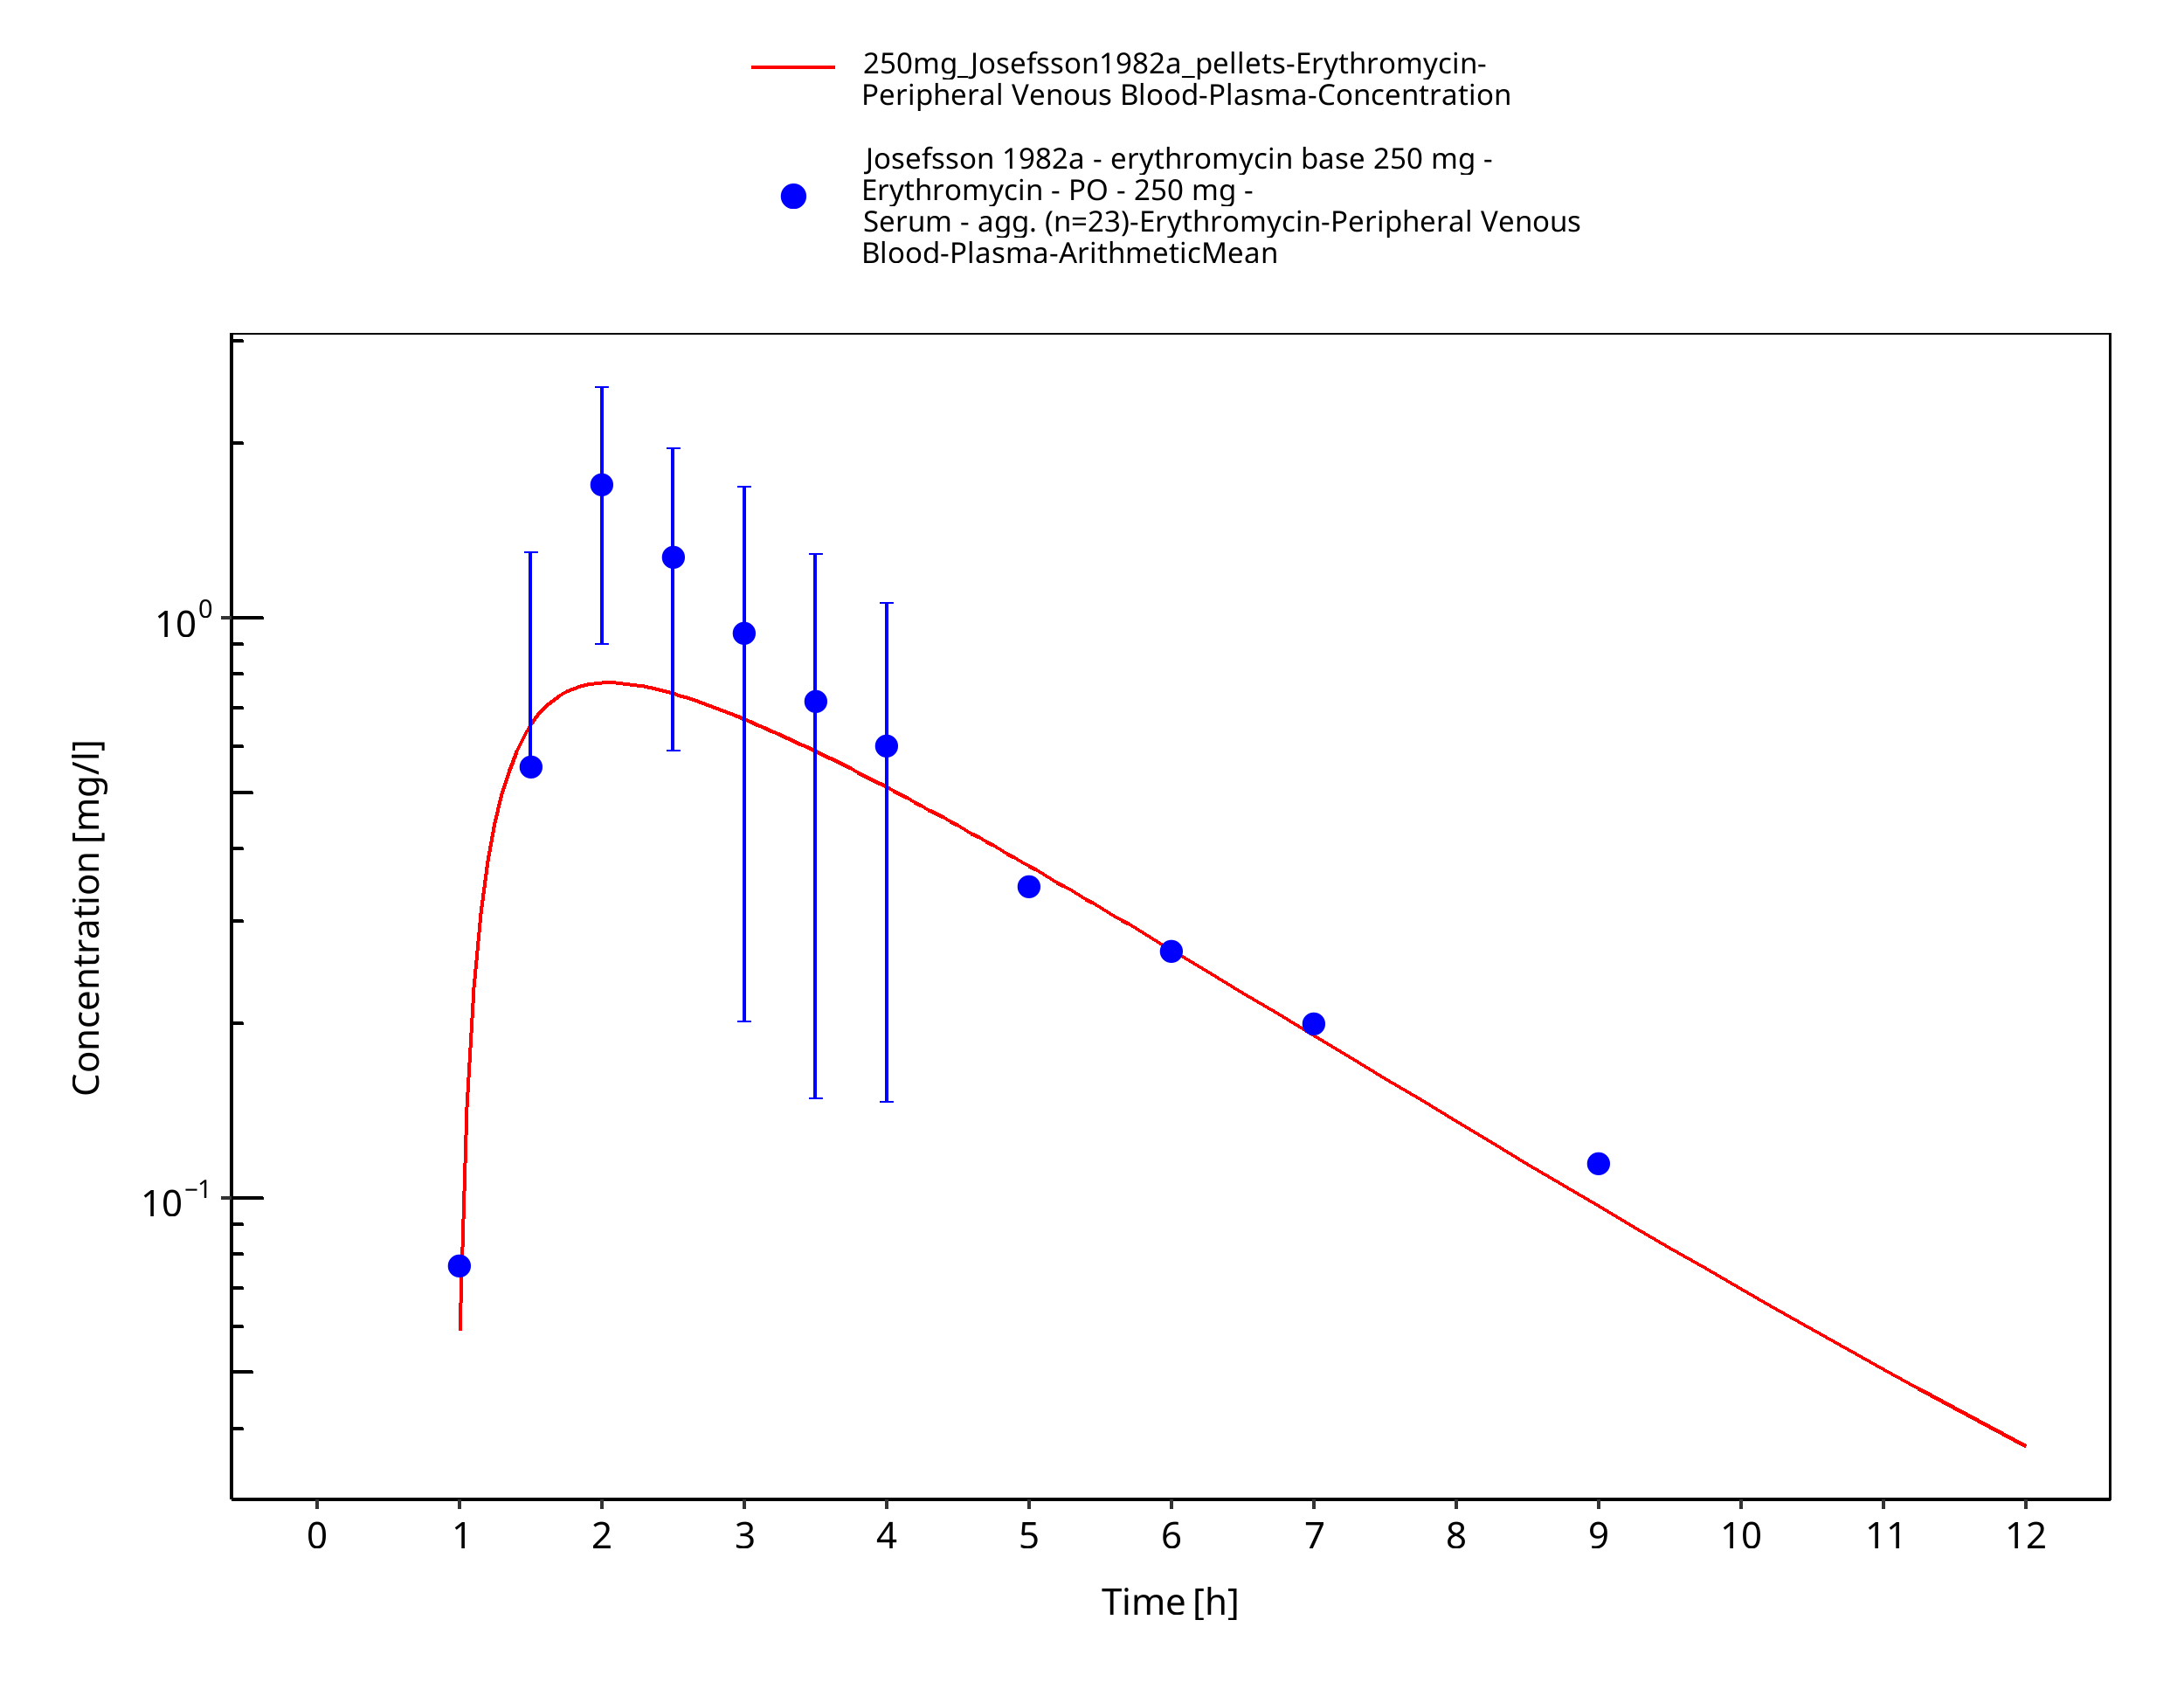
Figure 3-48: Time Profile Analysis
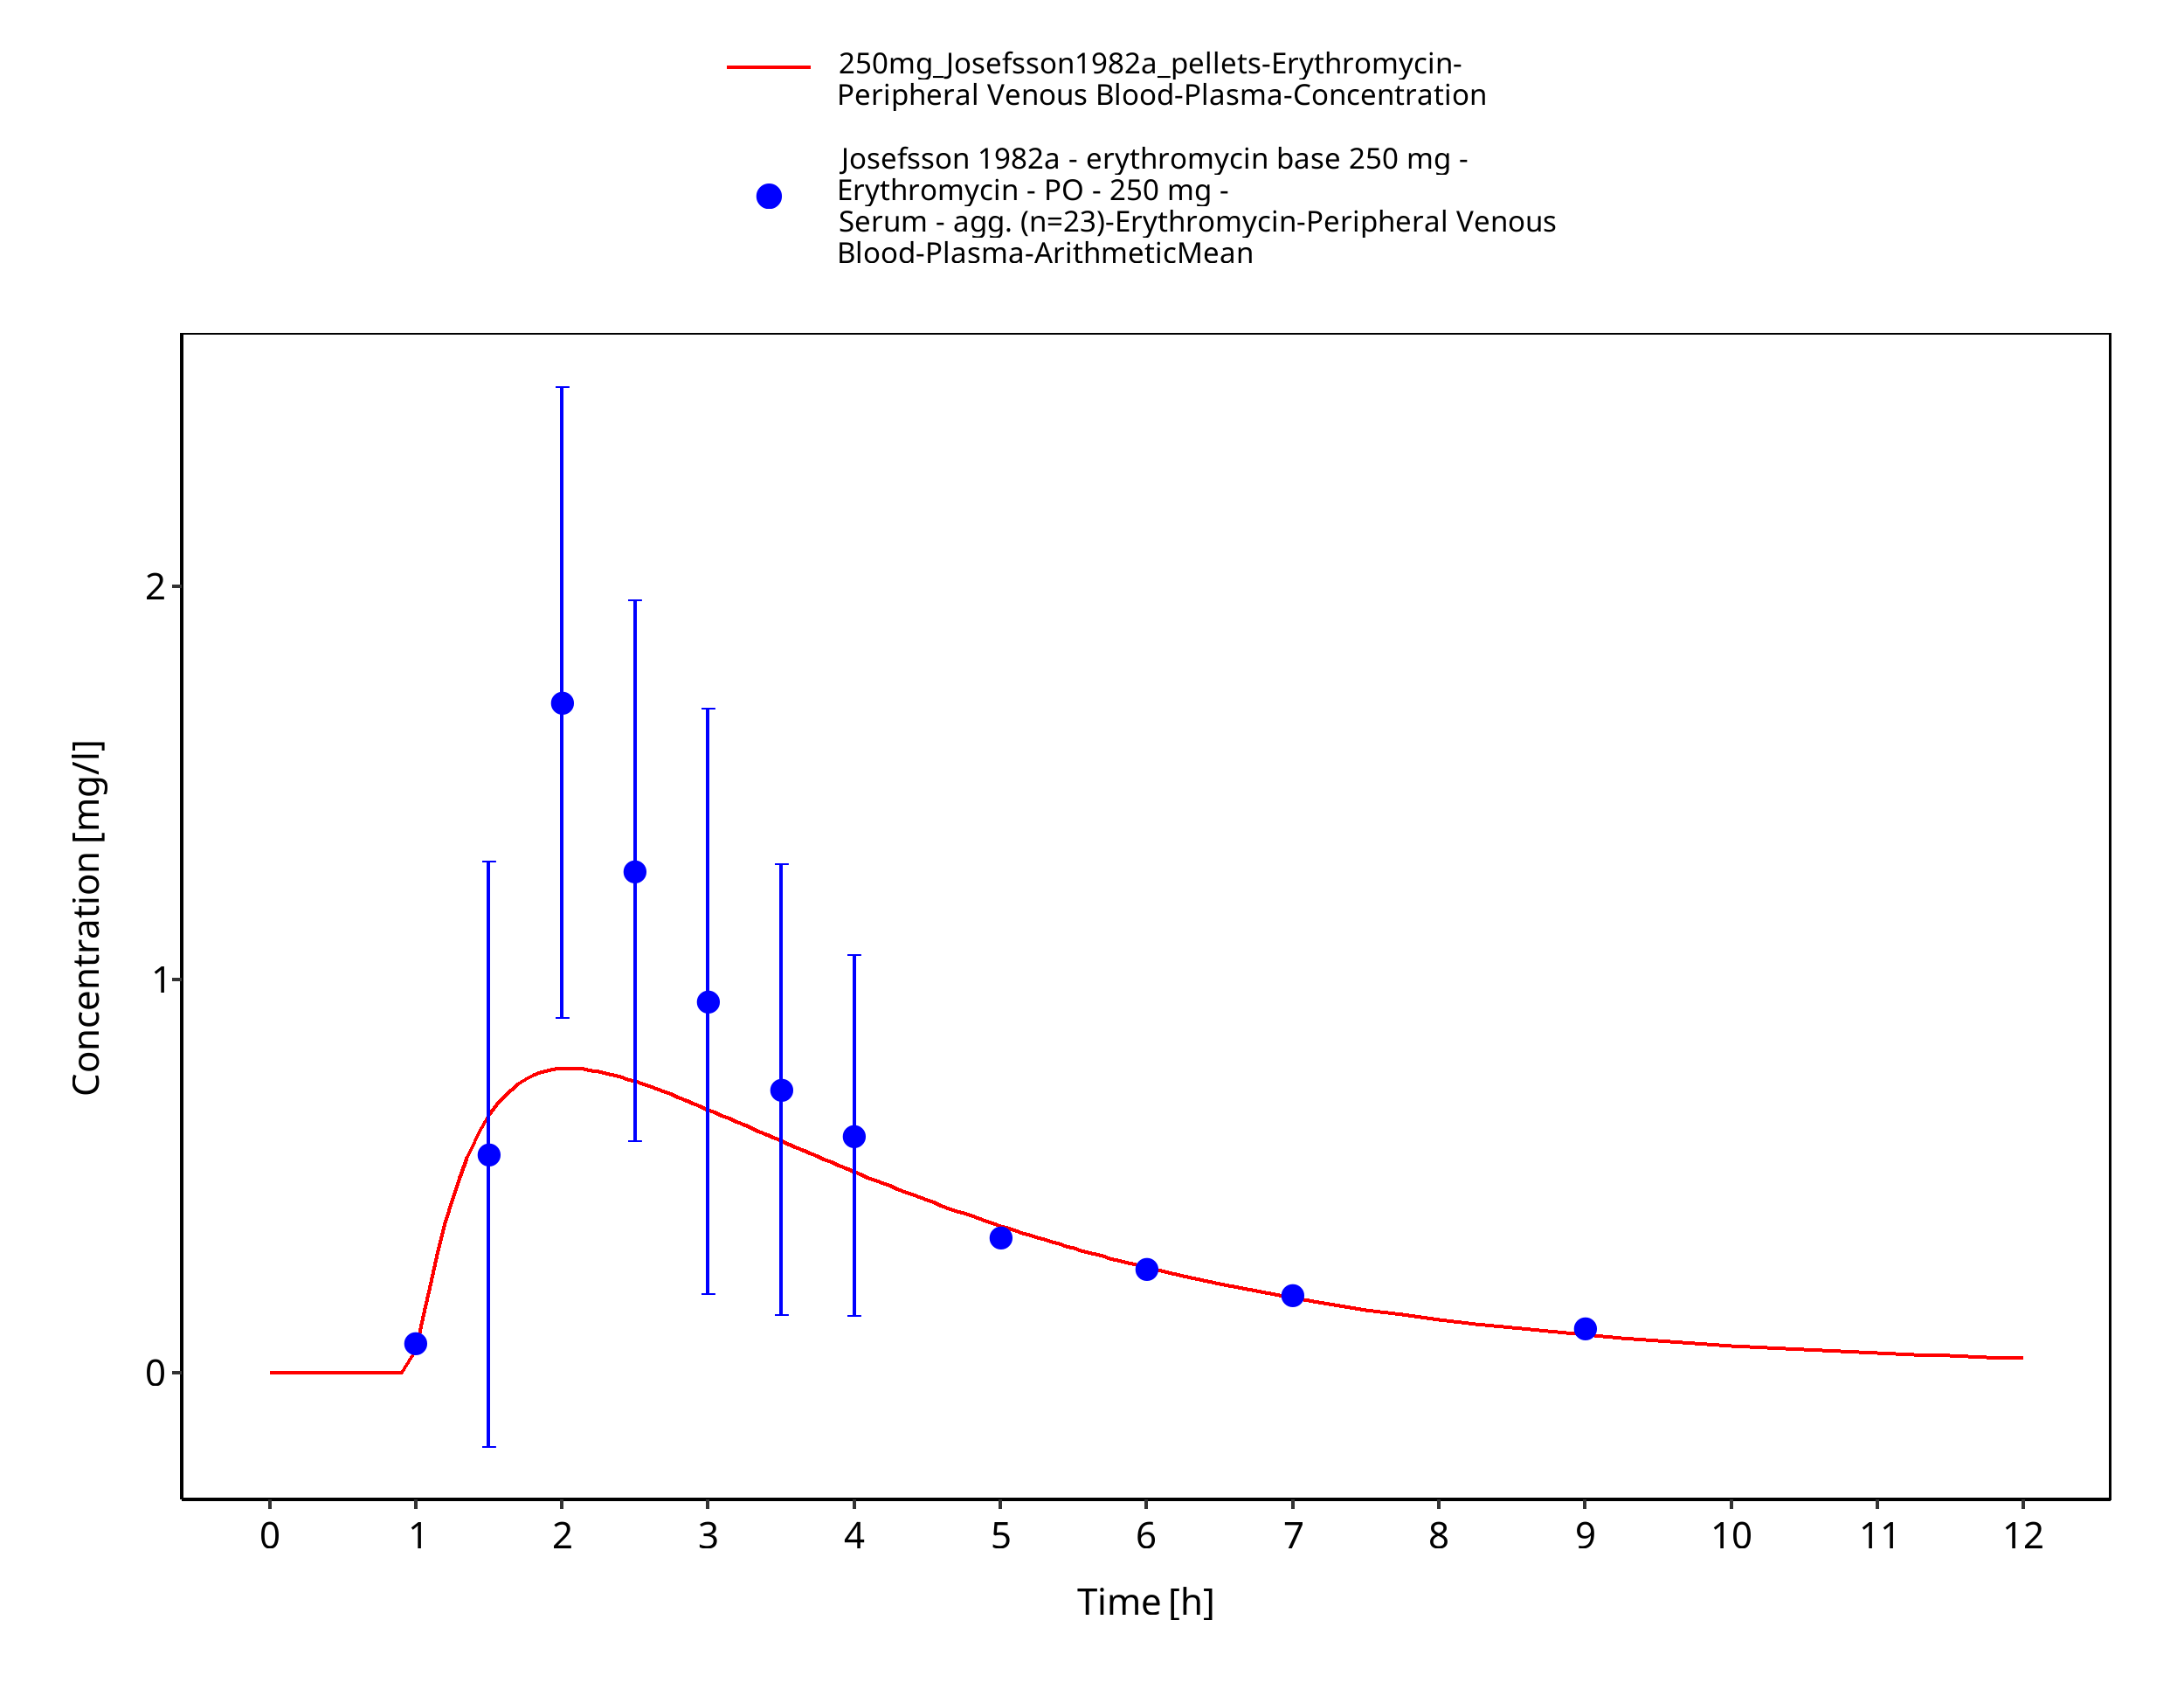
Figure 3-49: Time Profile Analysis 1
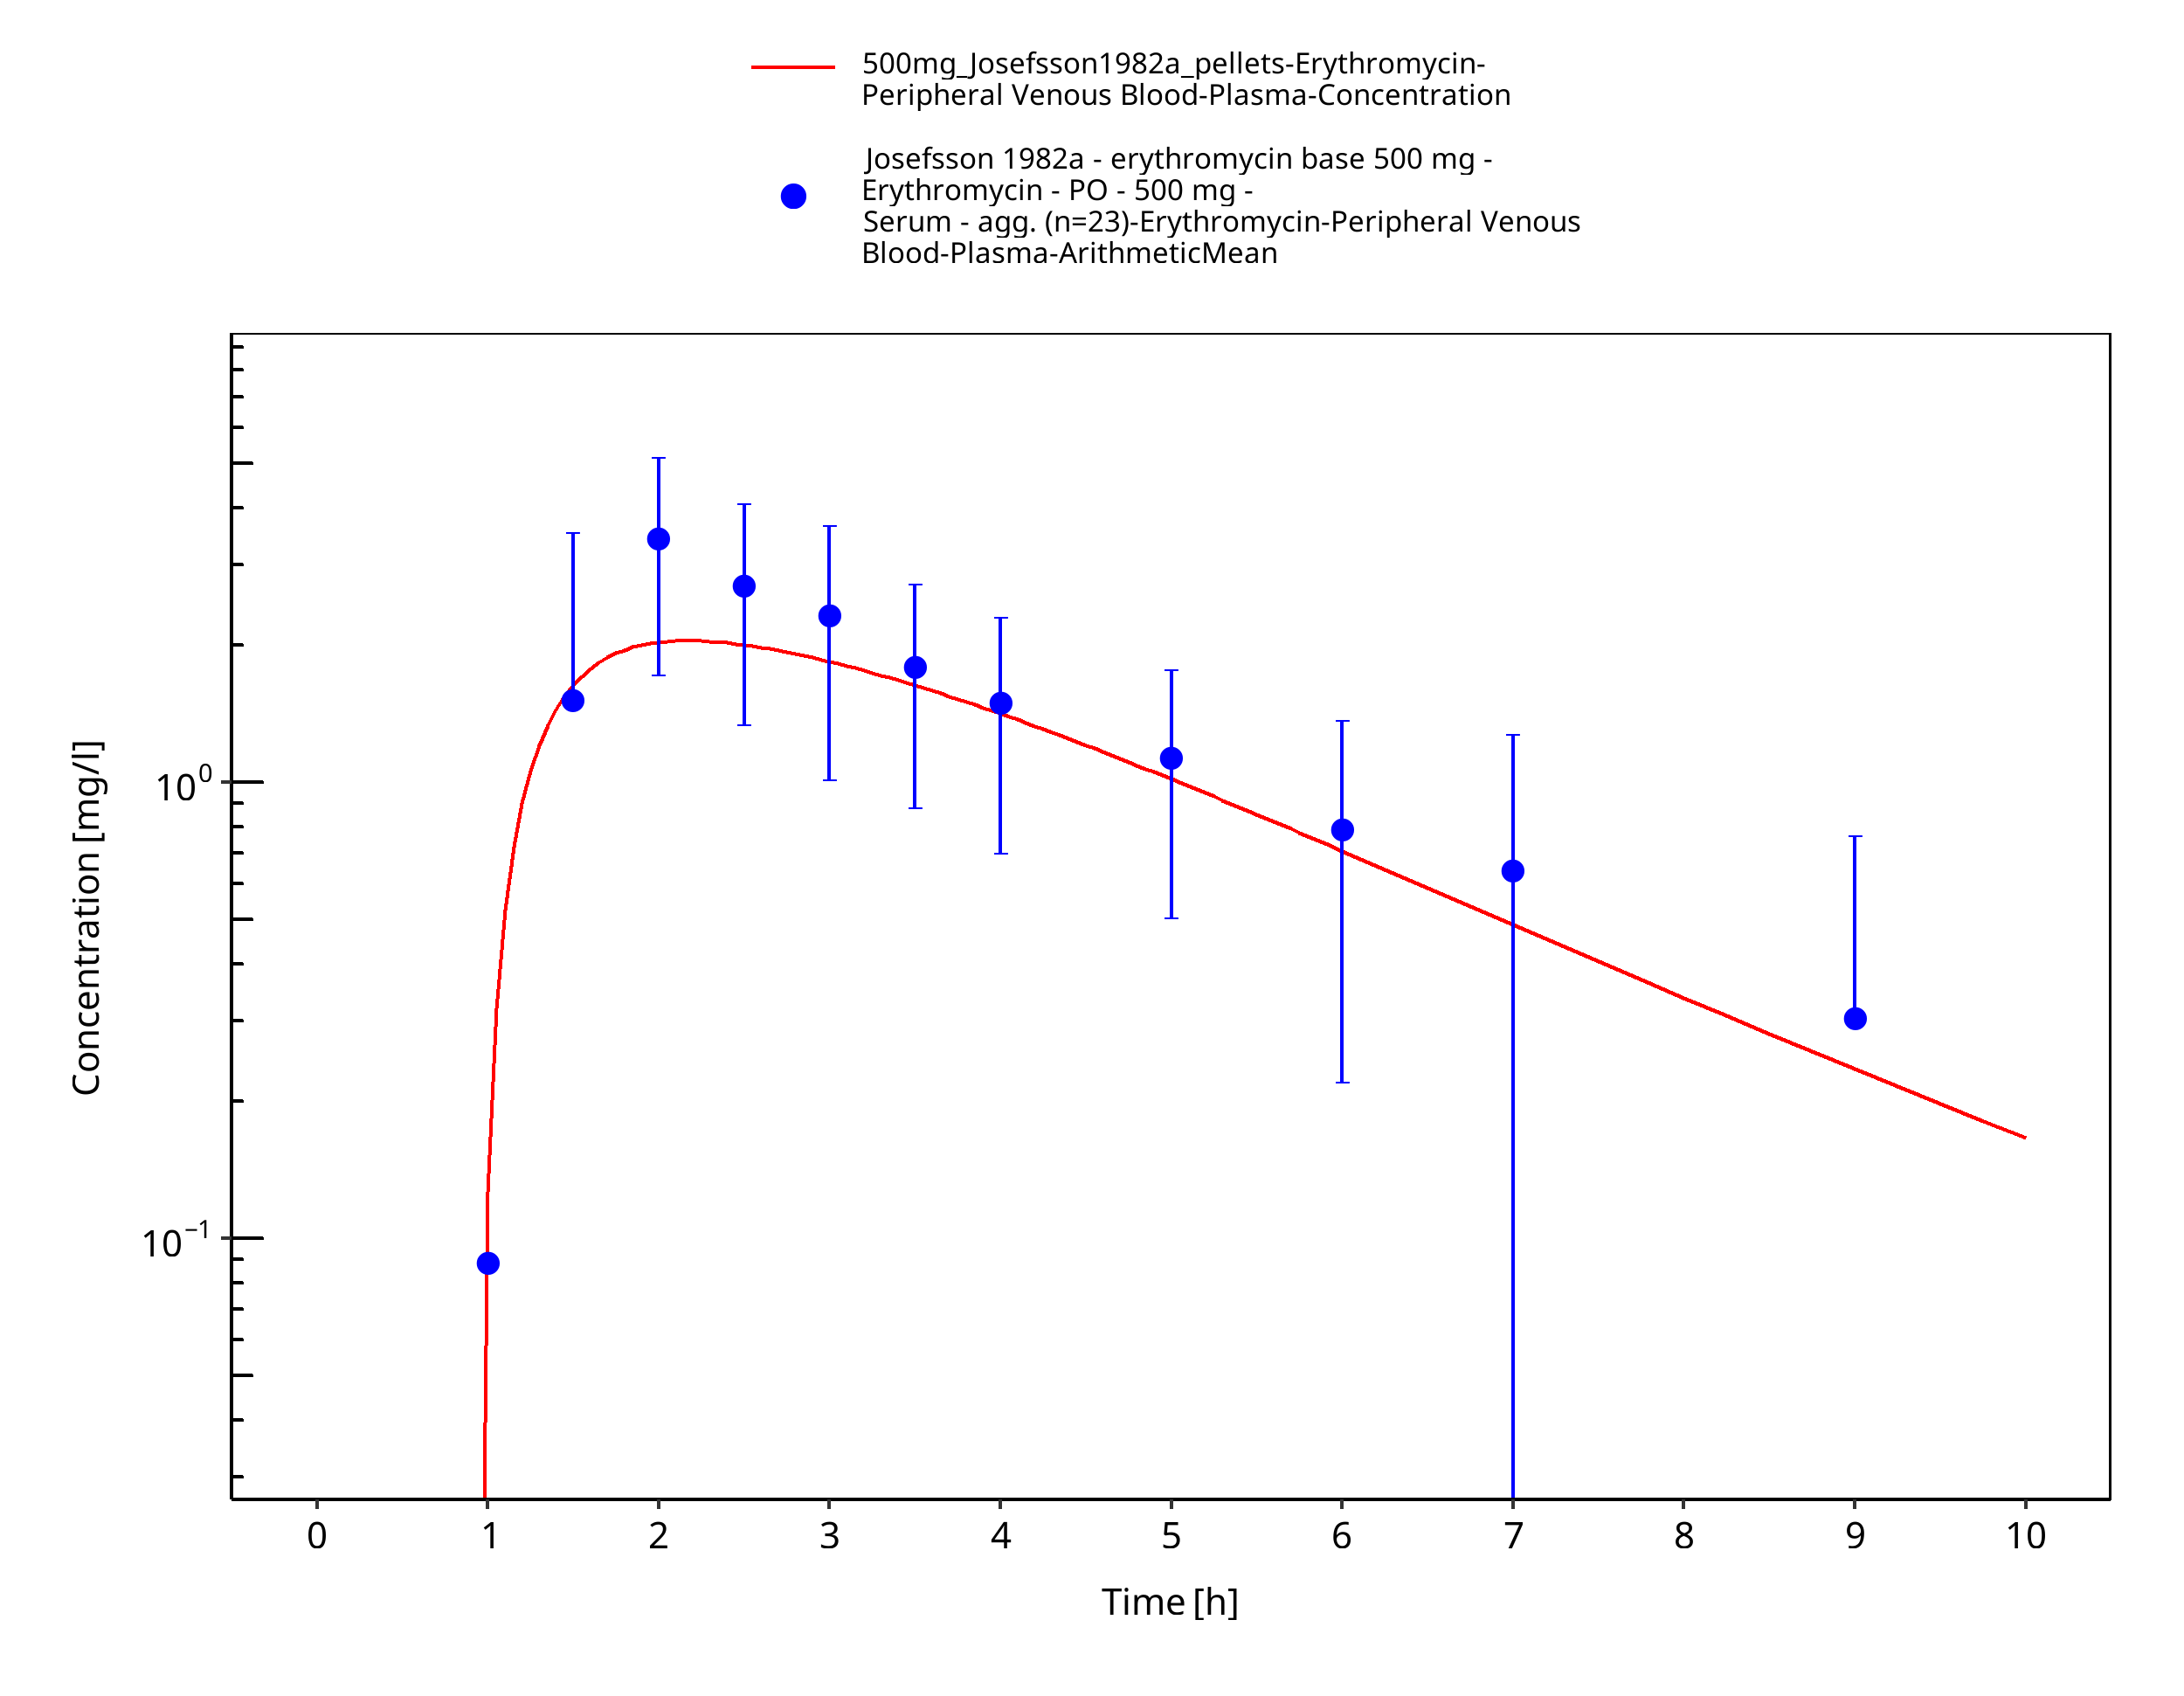
Figure 3-50: Time Profile Analysis
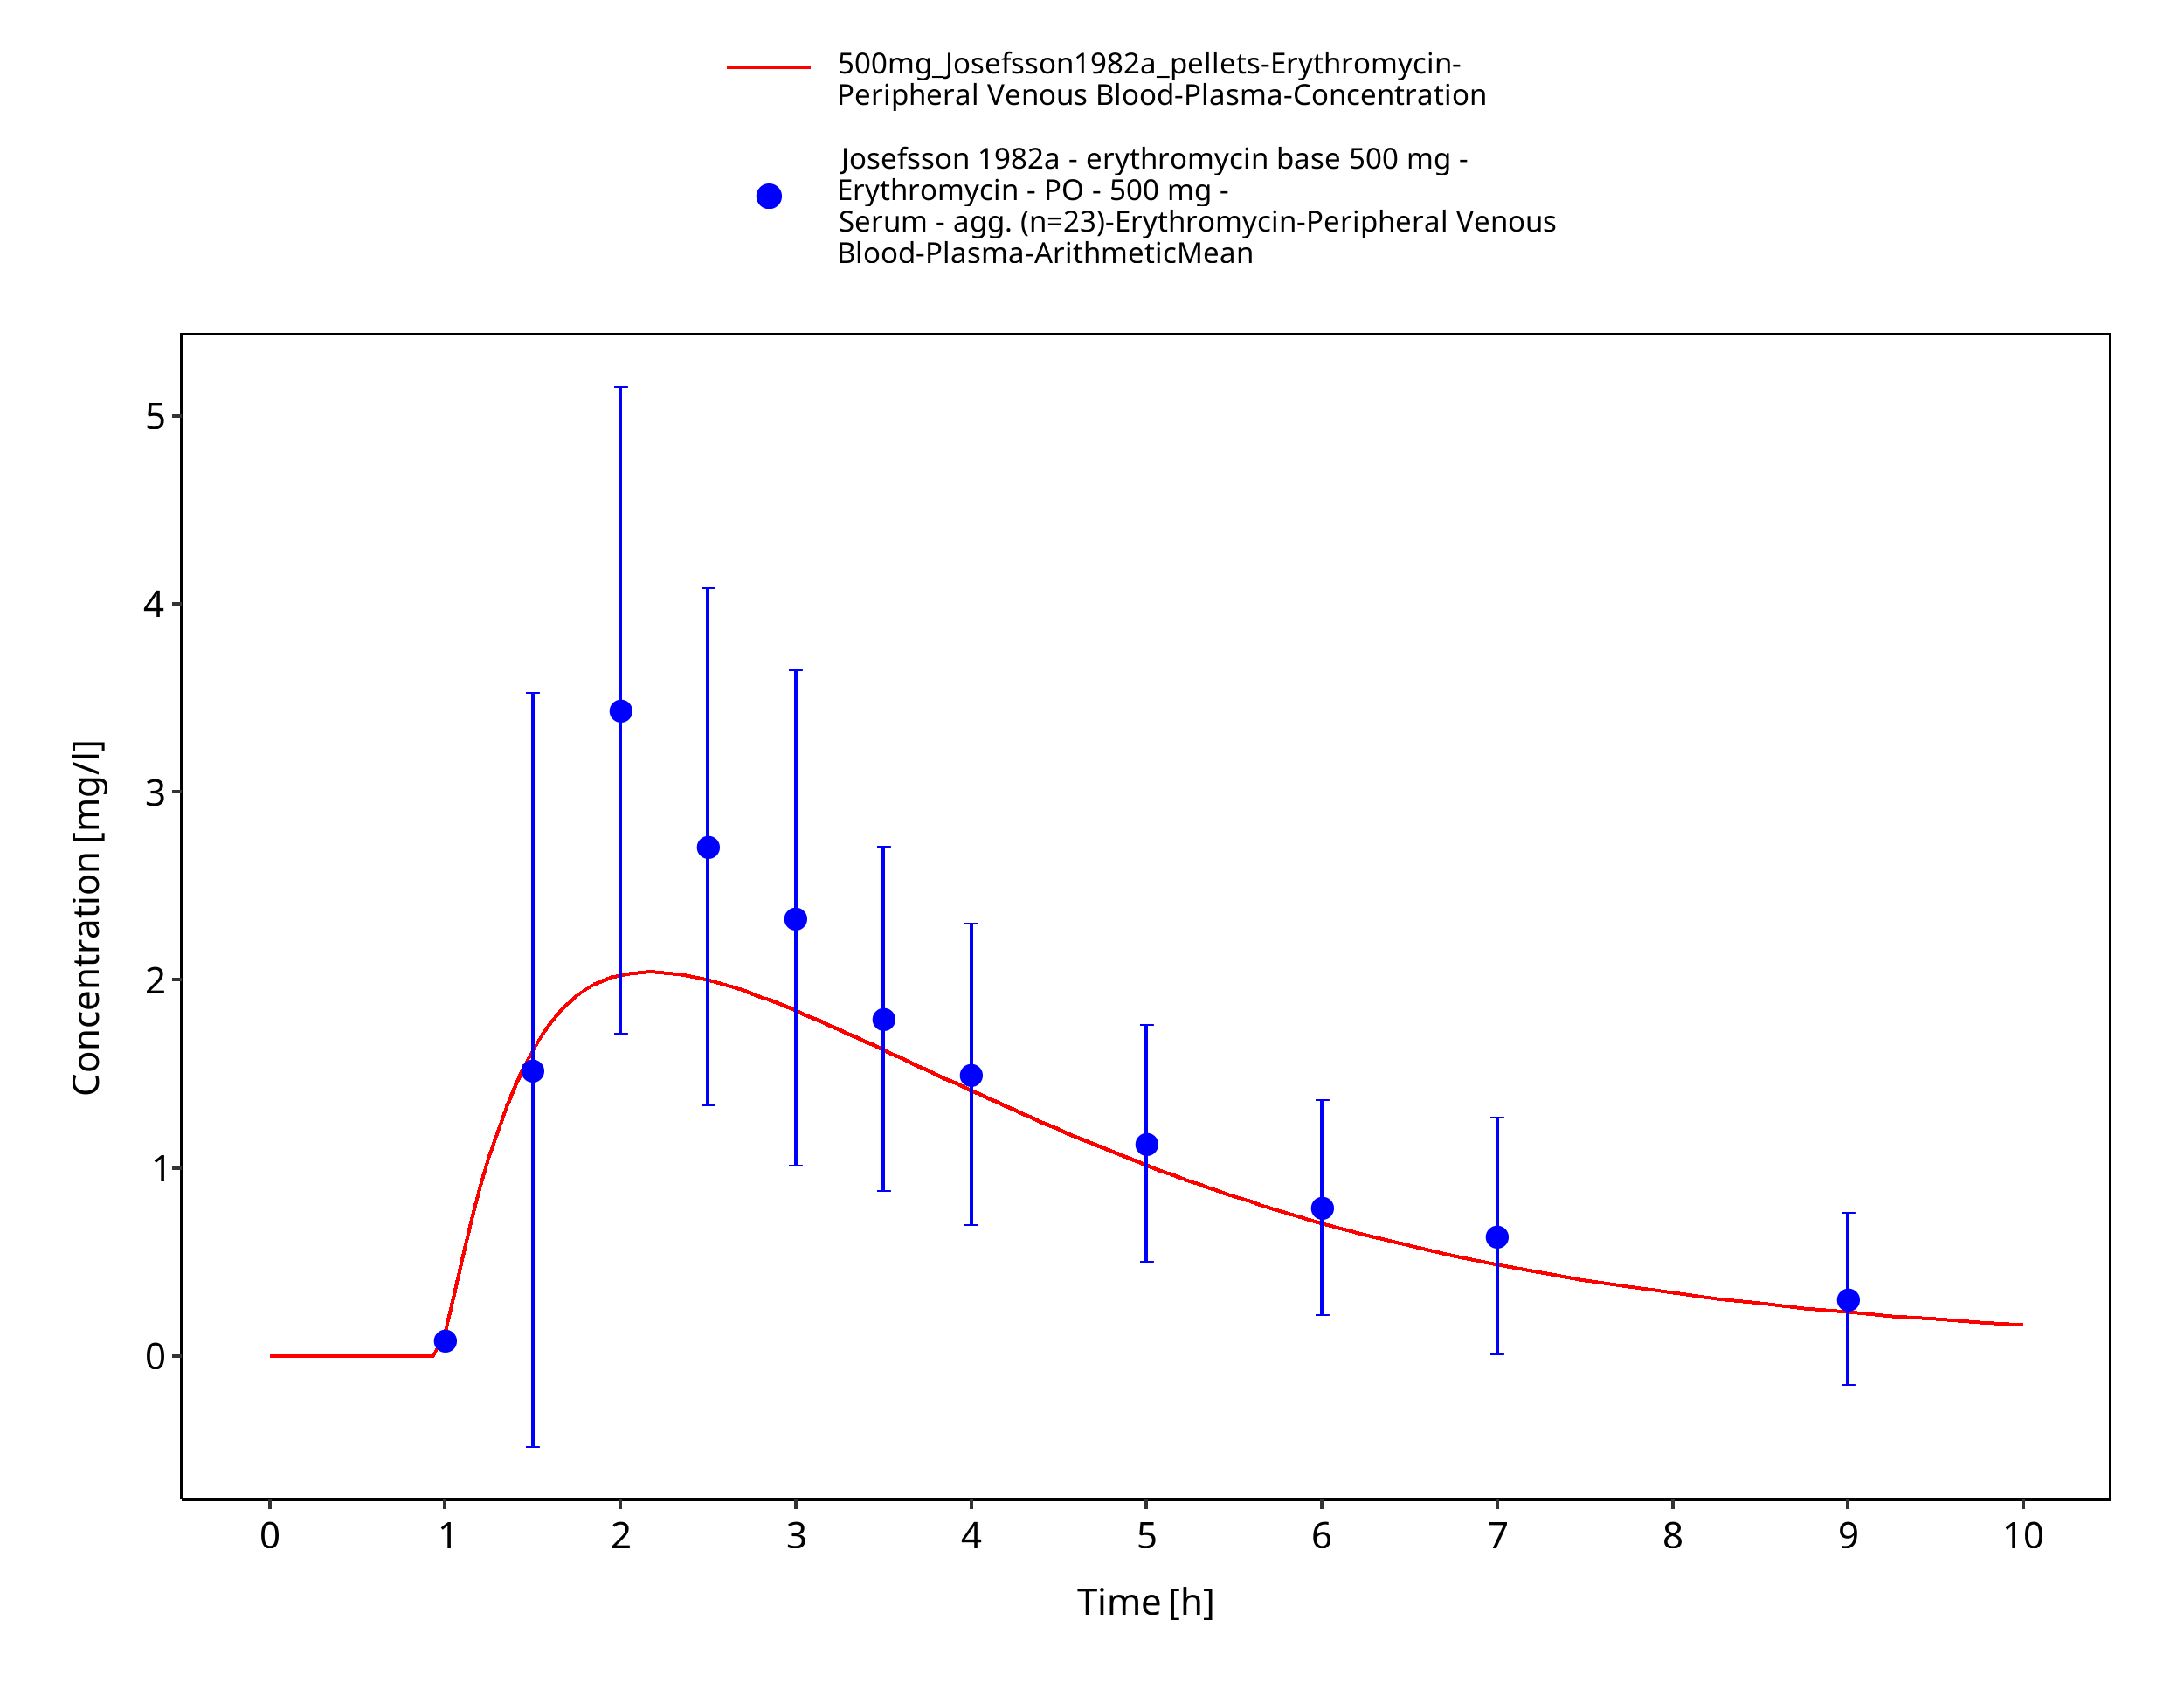
Figure 3-51: Time Profile Analysis 1
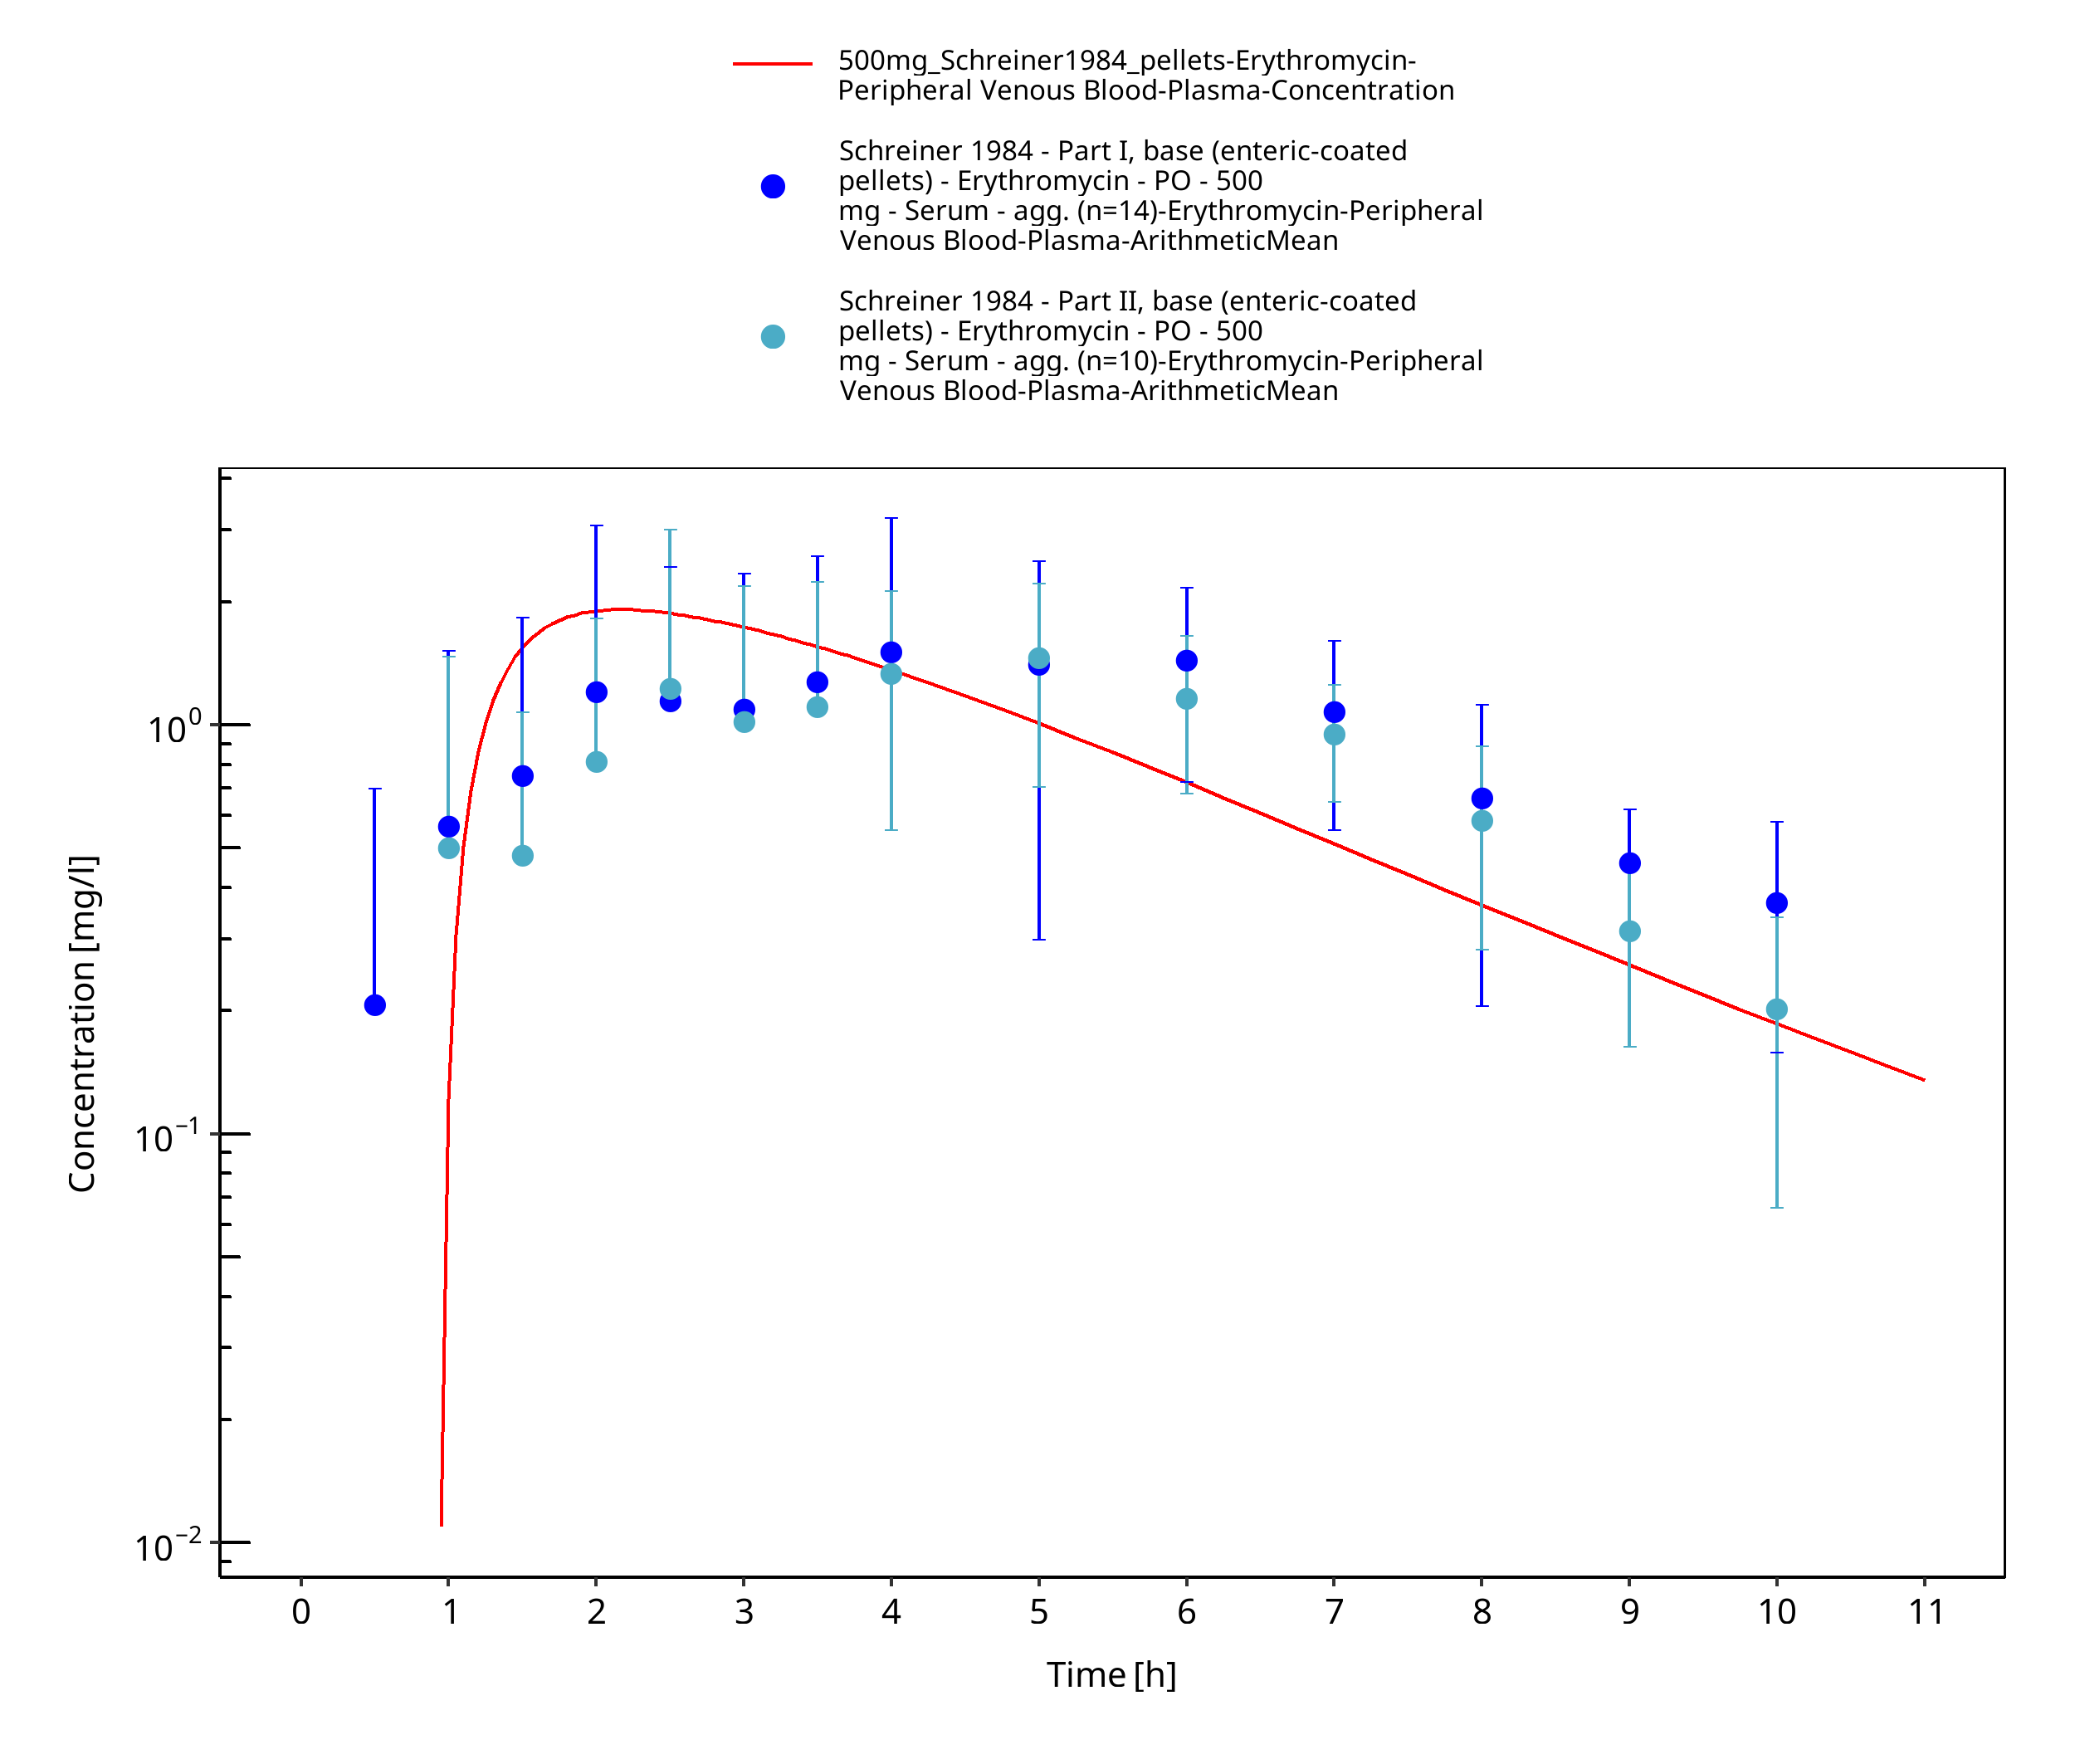
Figure 3-52: Time Profile Analysis
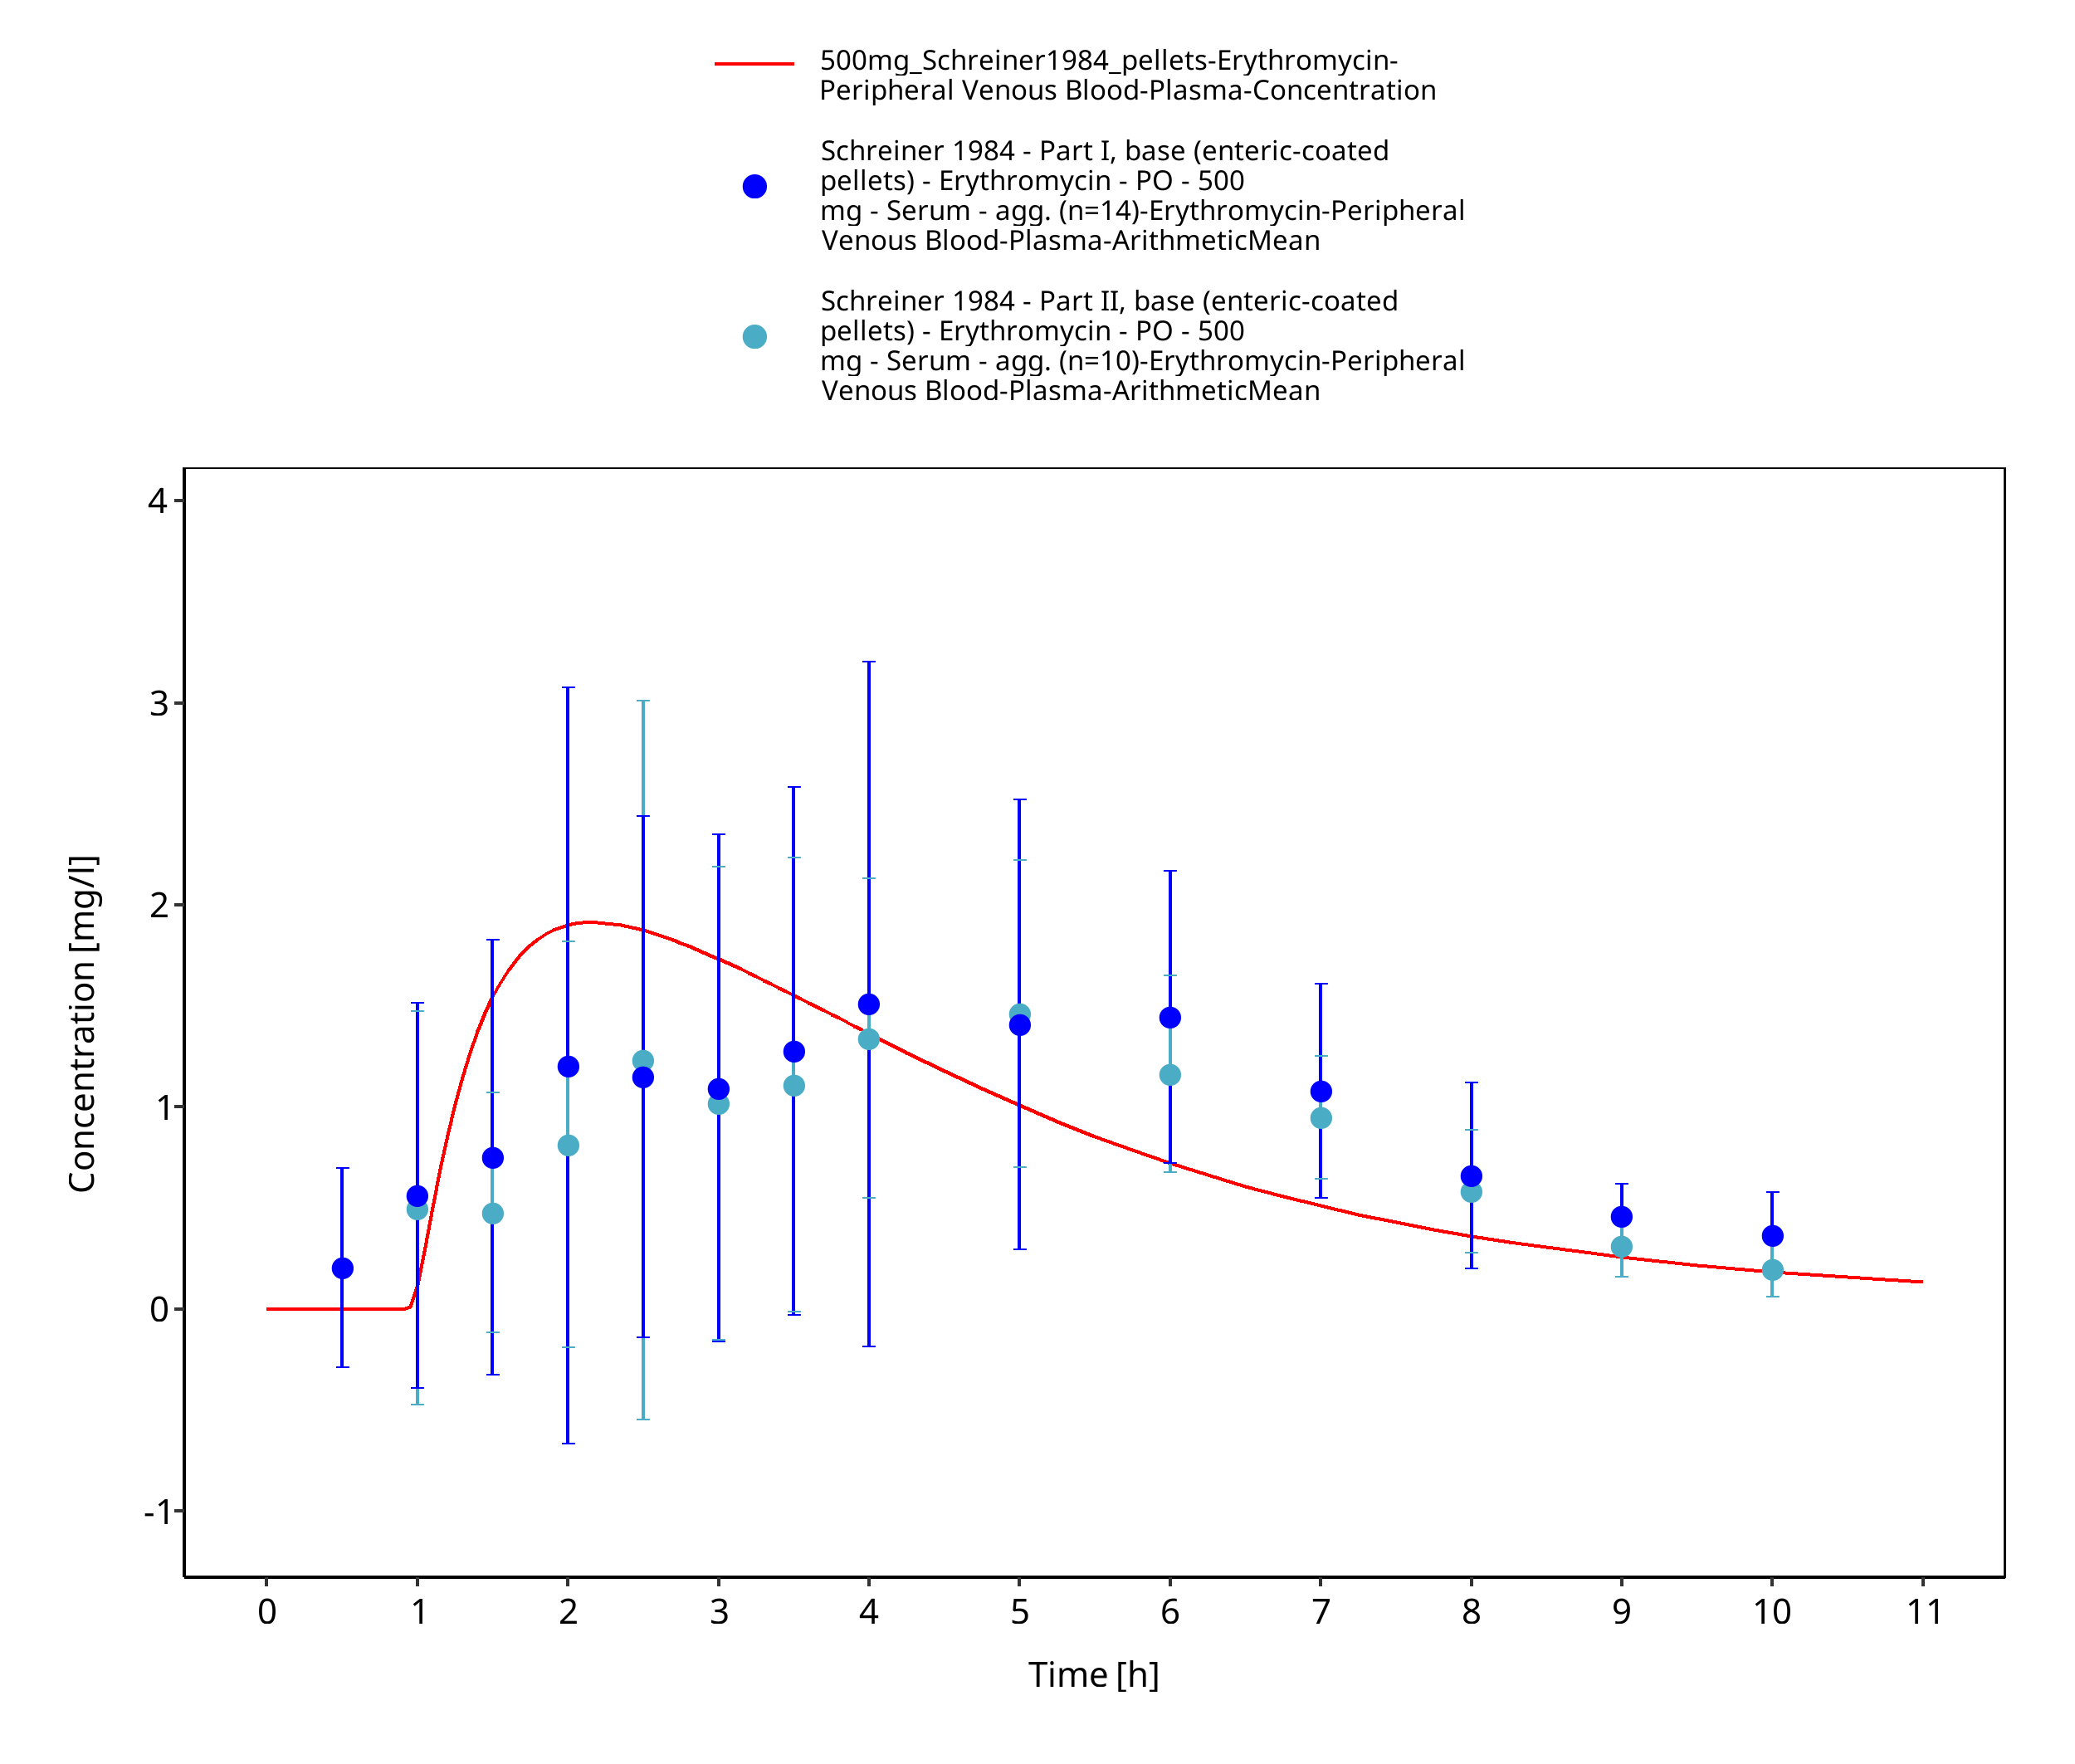
Figure 3-53: Time Profile Analysis 1
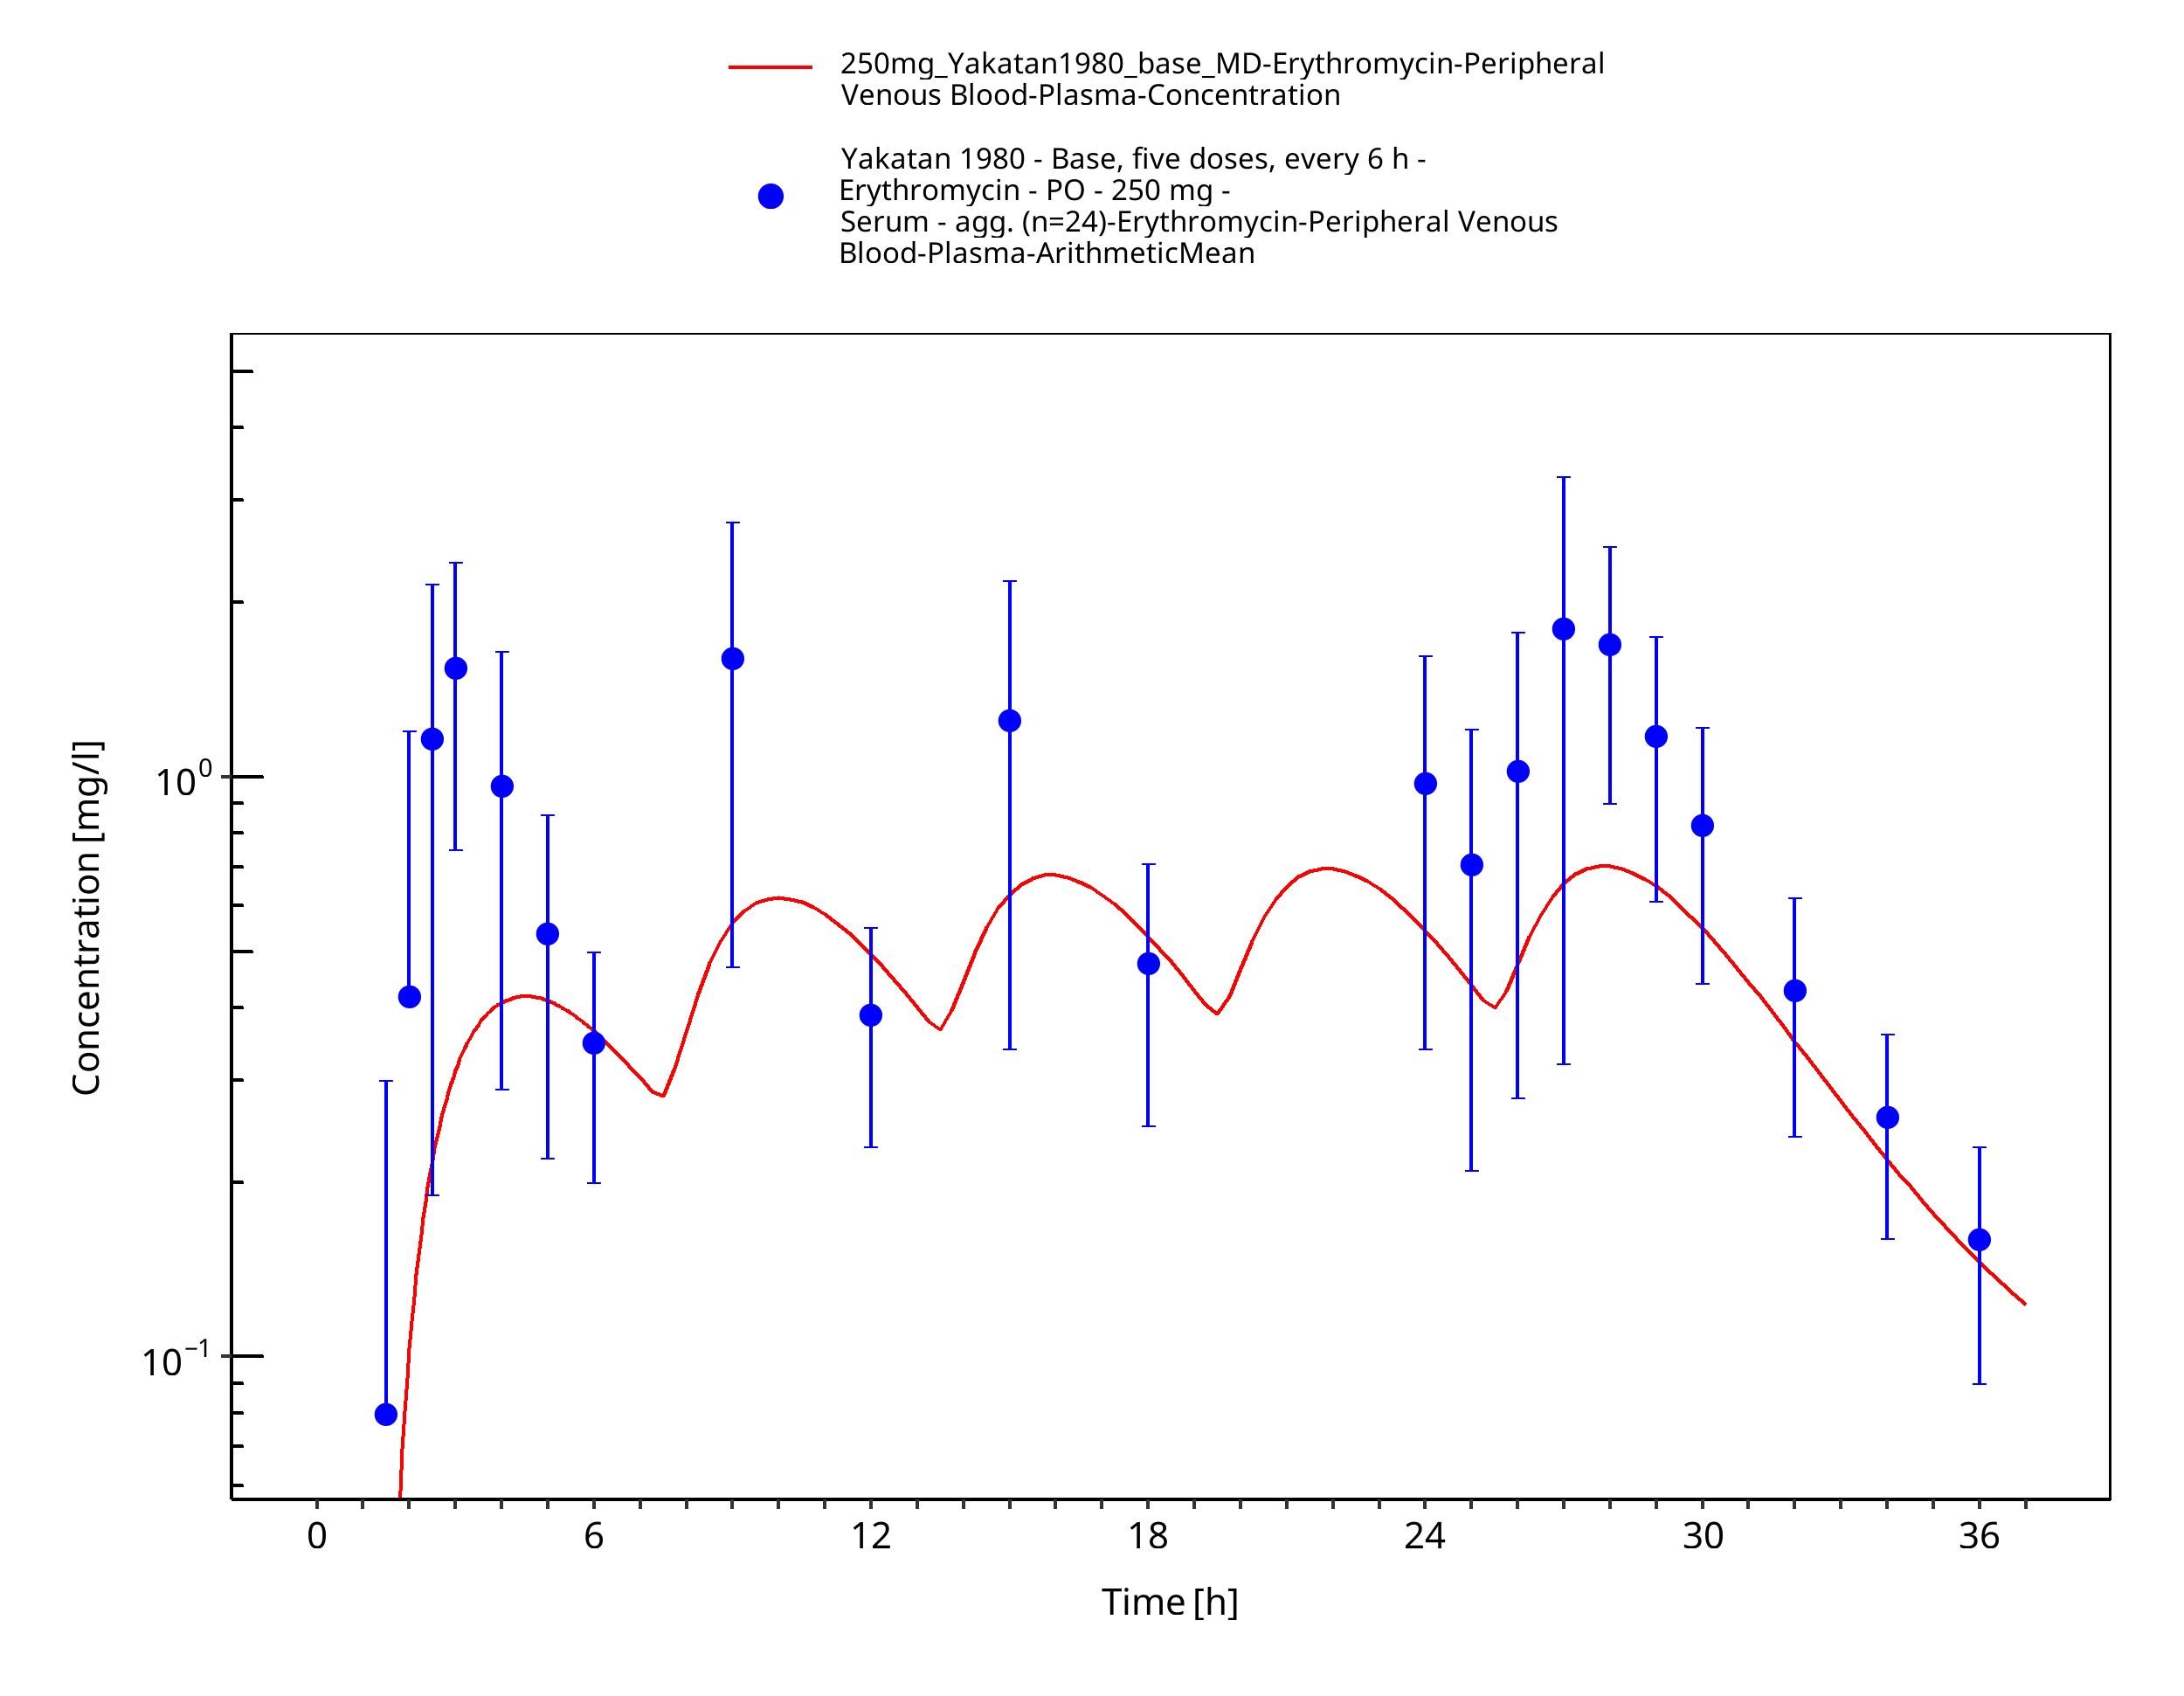
Figure 3-54: Time Profile Analysis
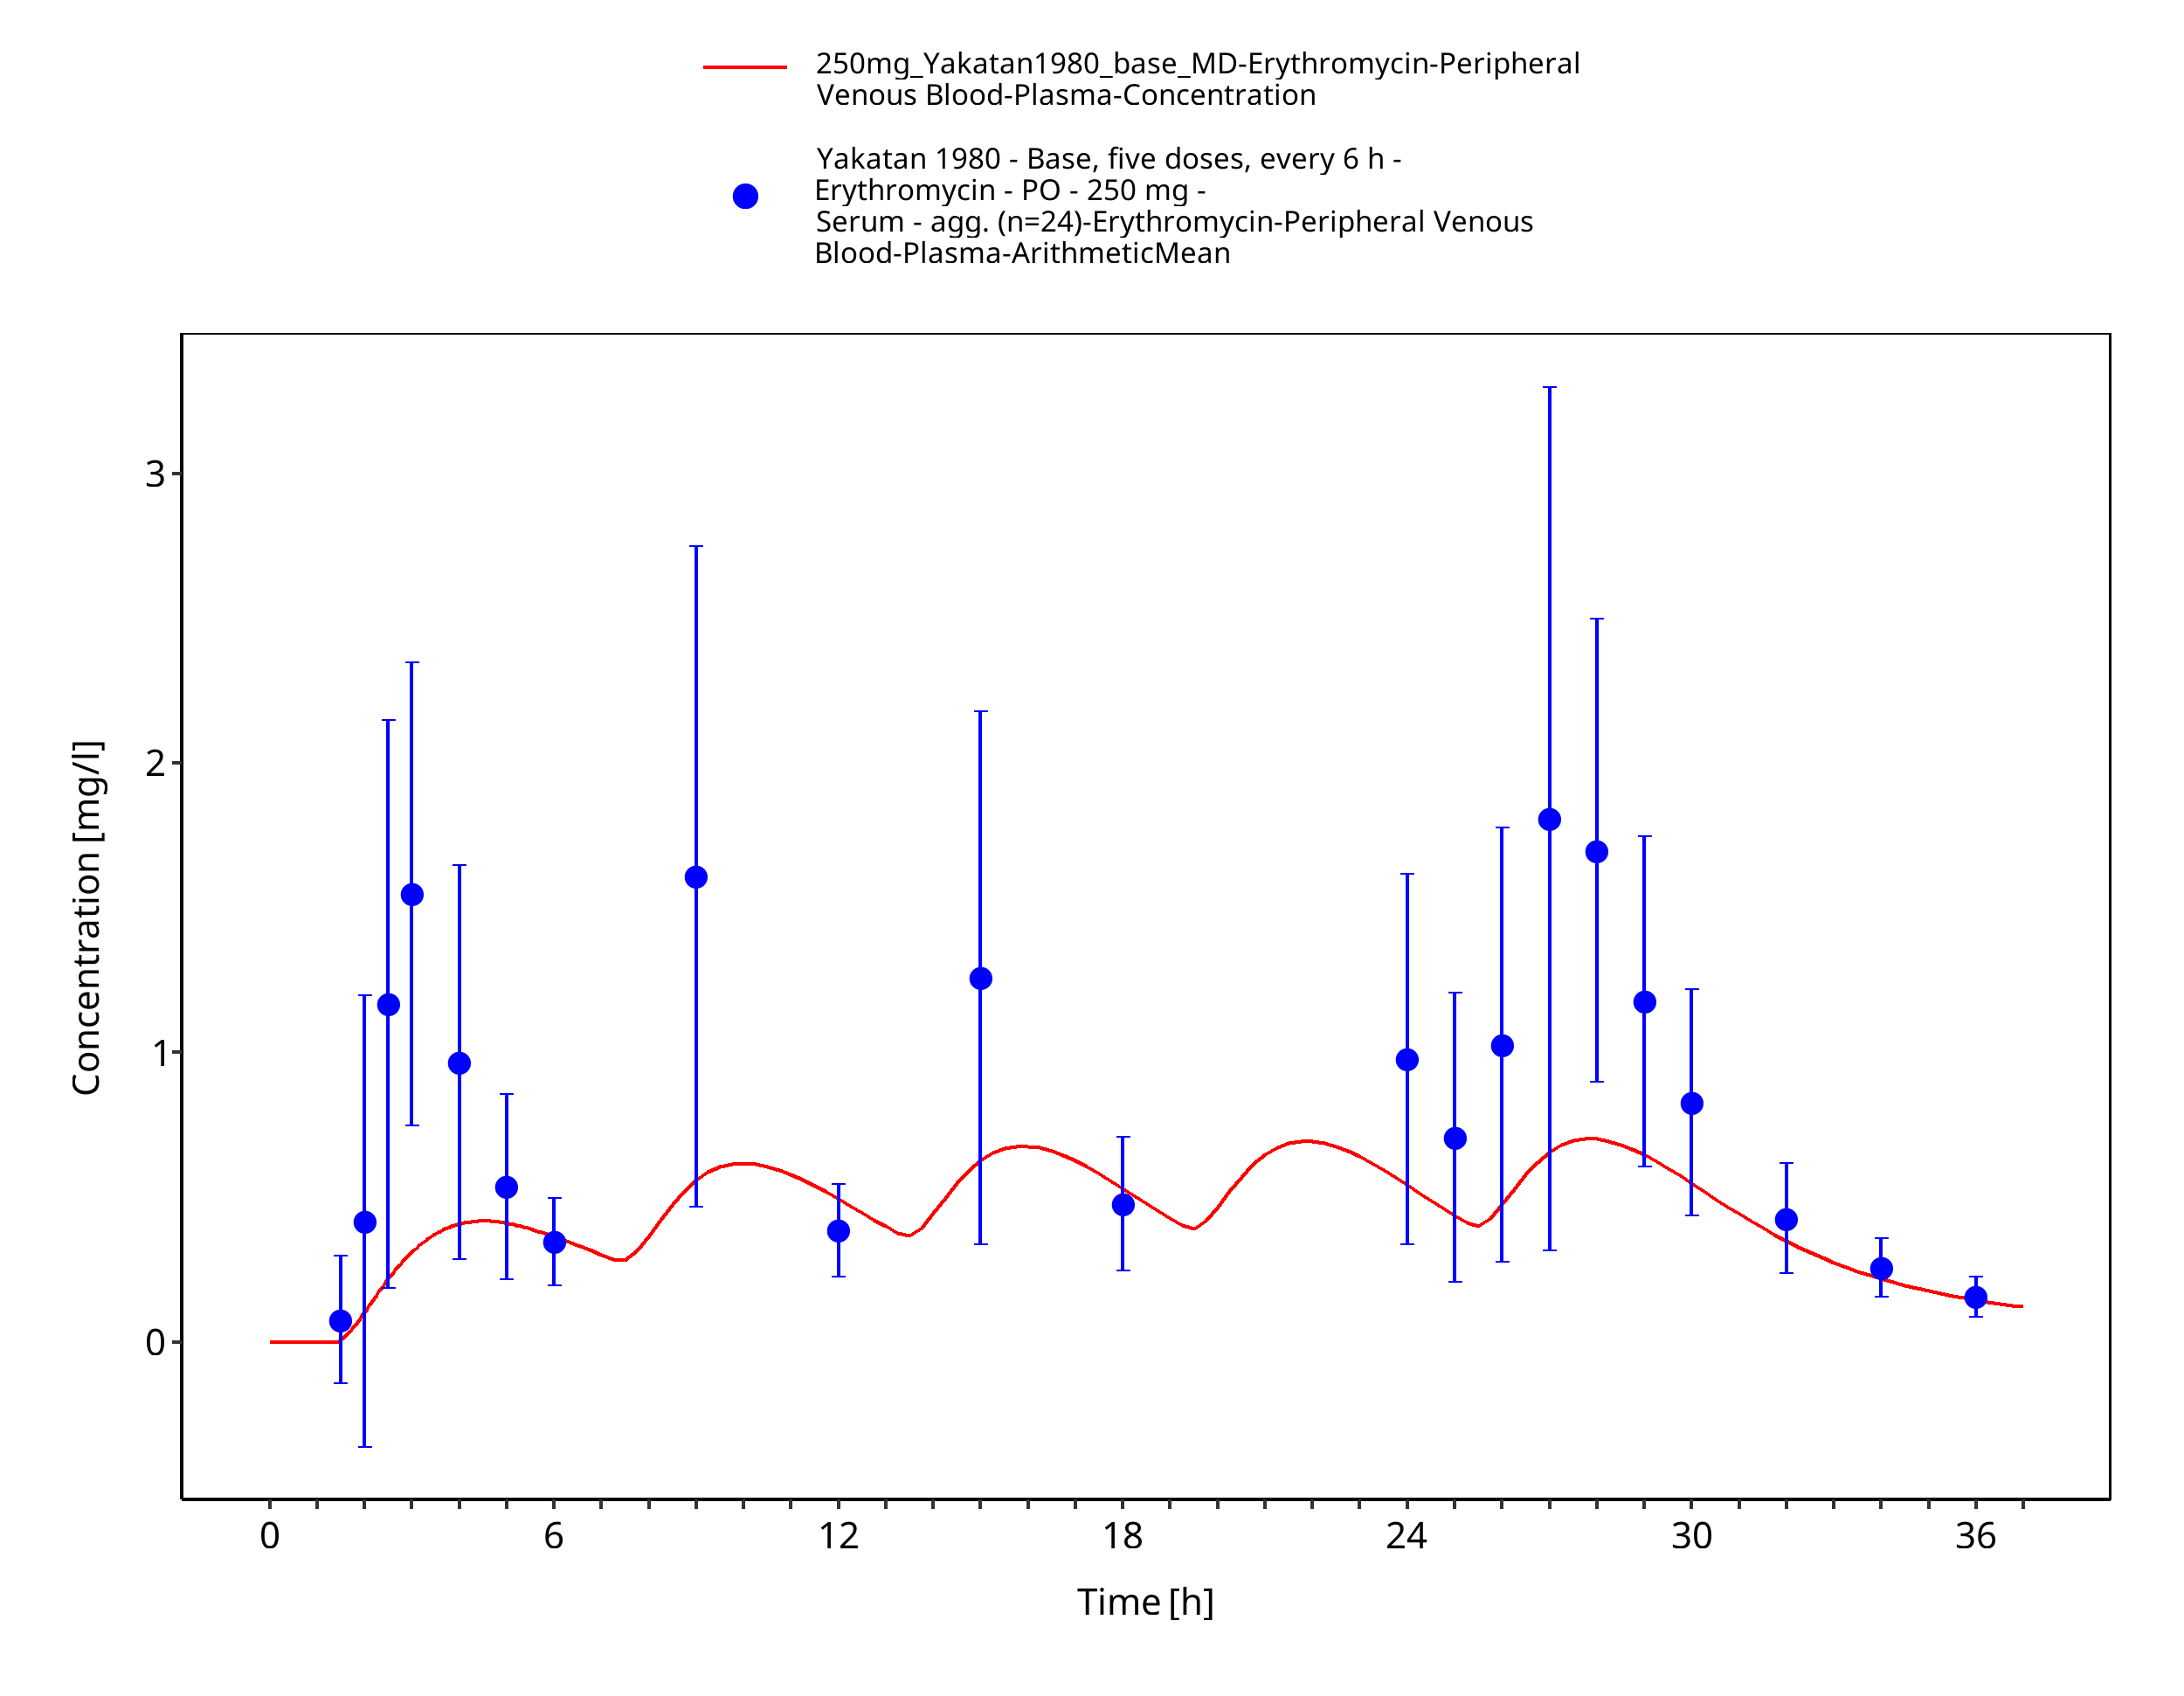
Figure 3-55: Time Profile Analysis 1
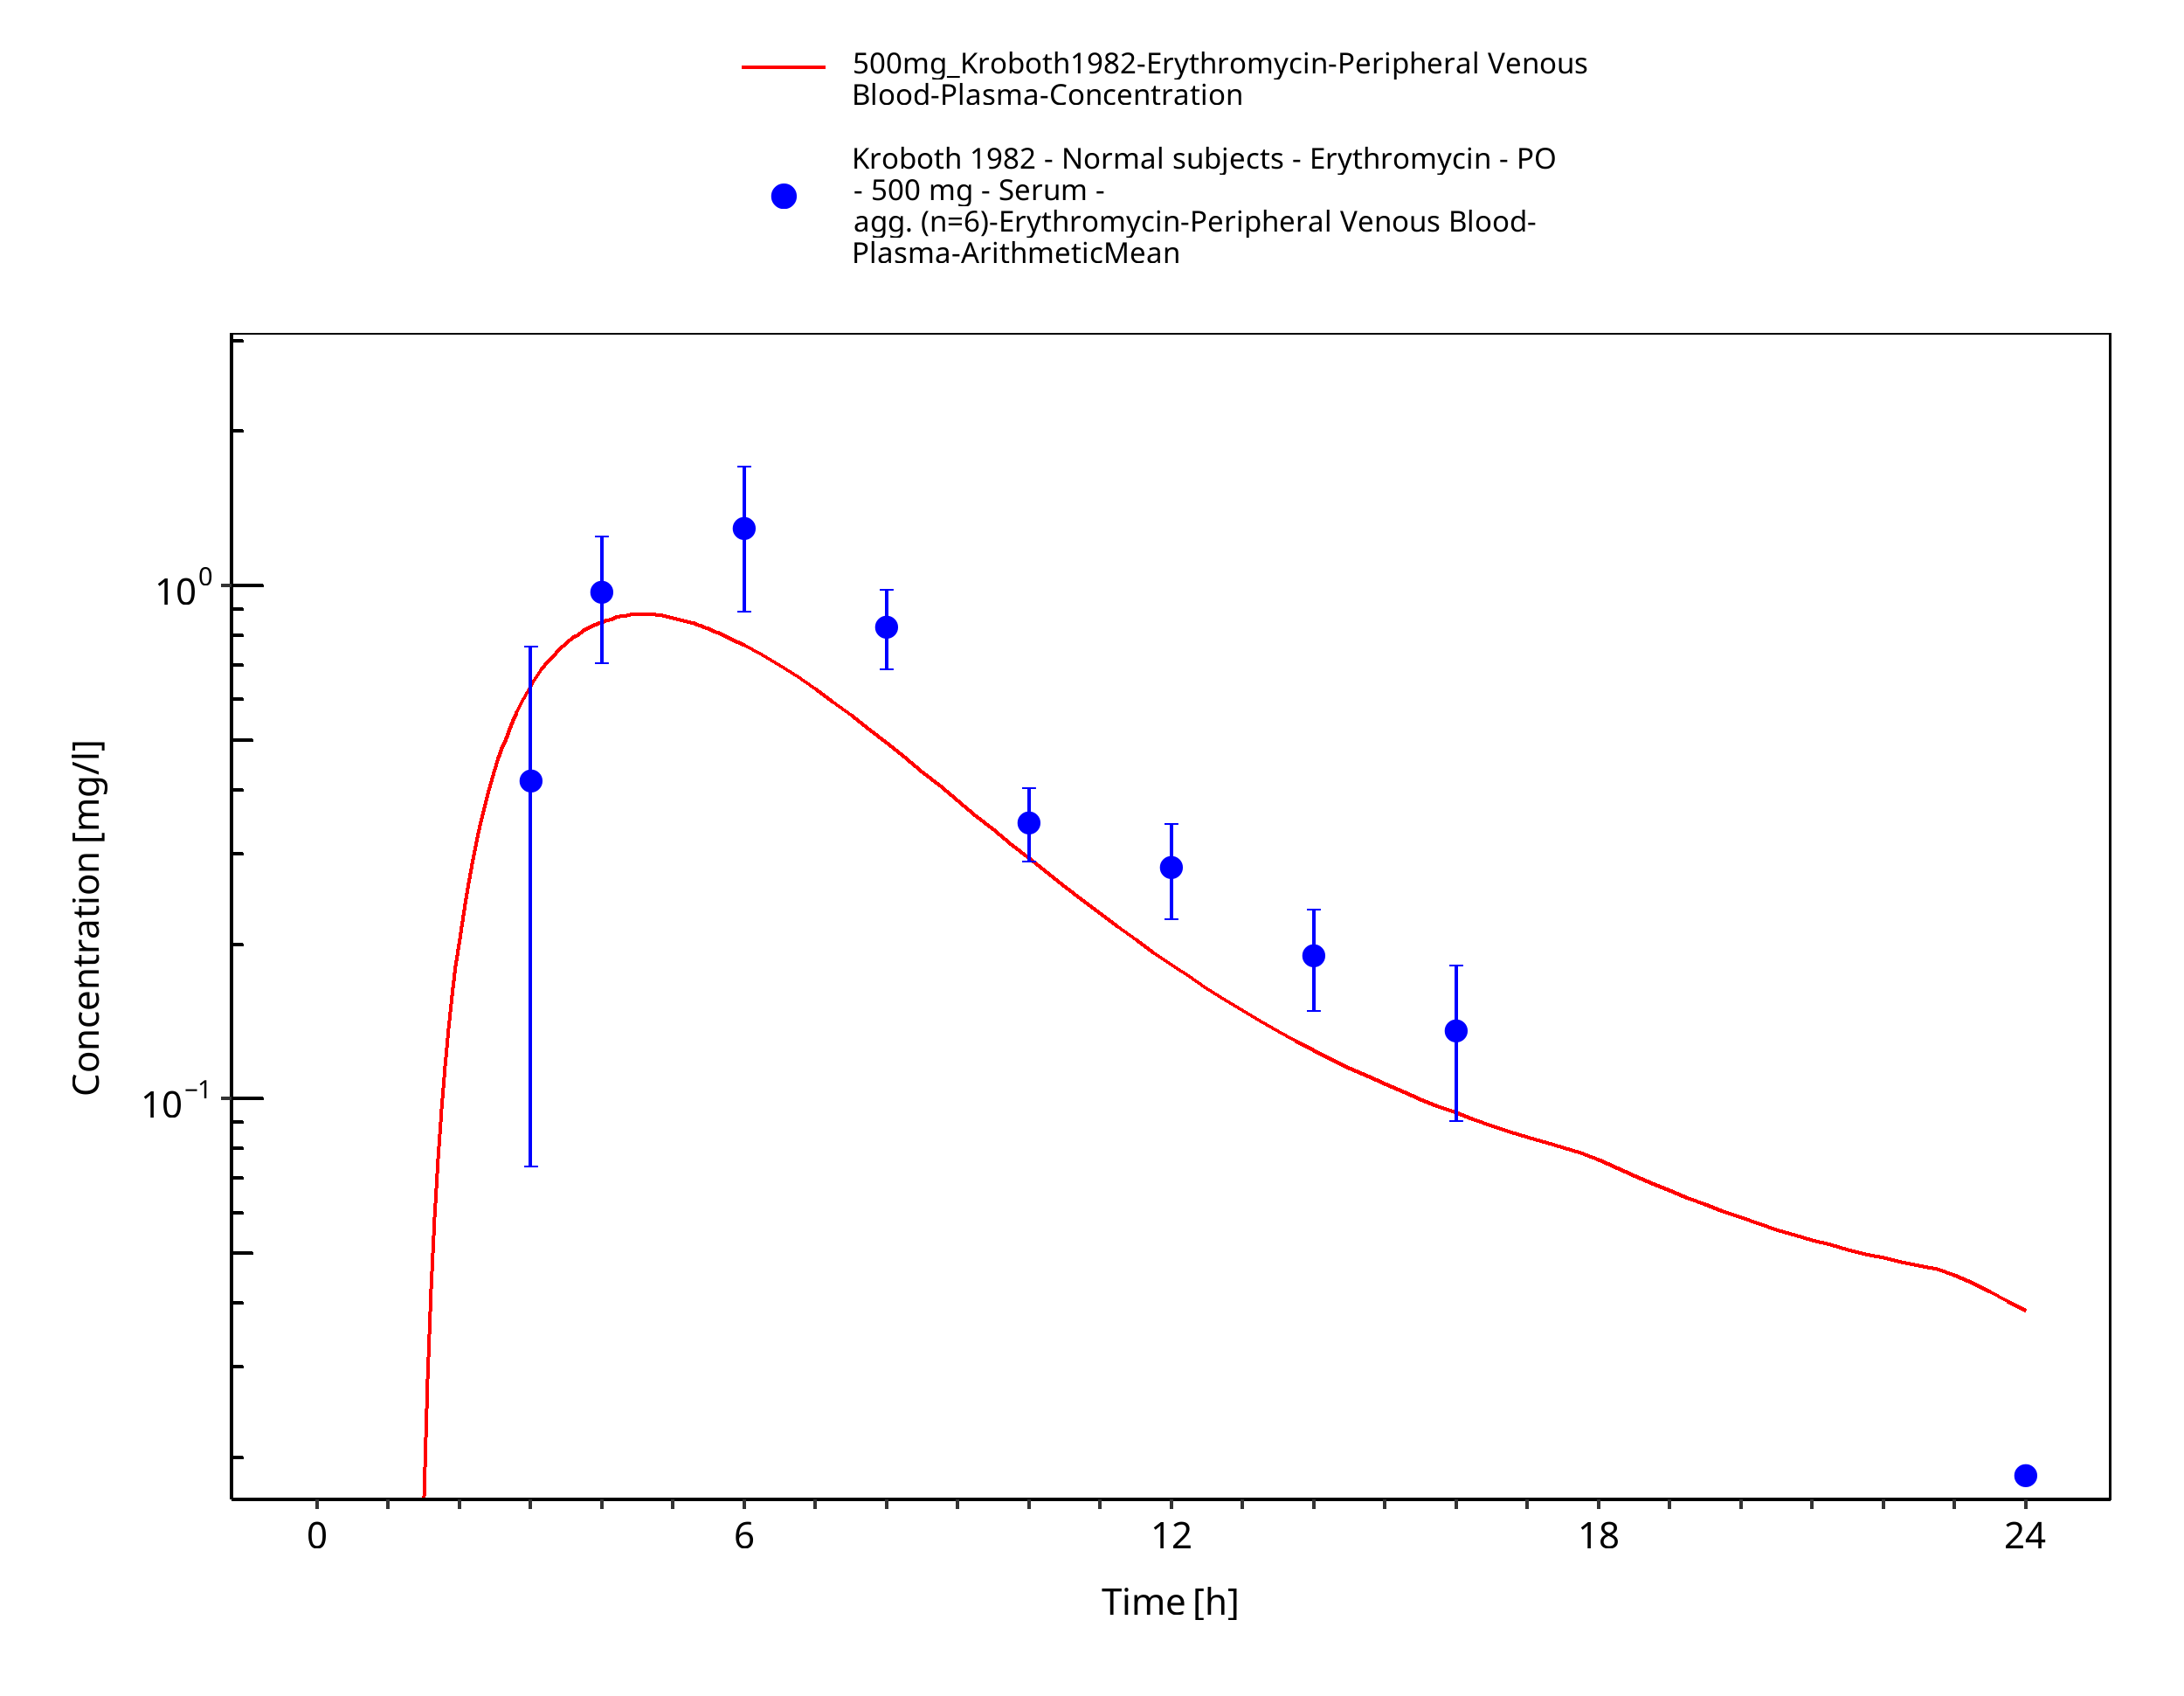
Figure 3-56: Time Profile Analysis
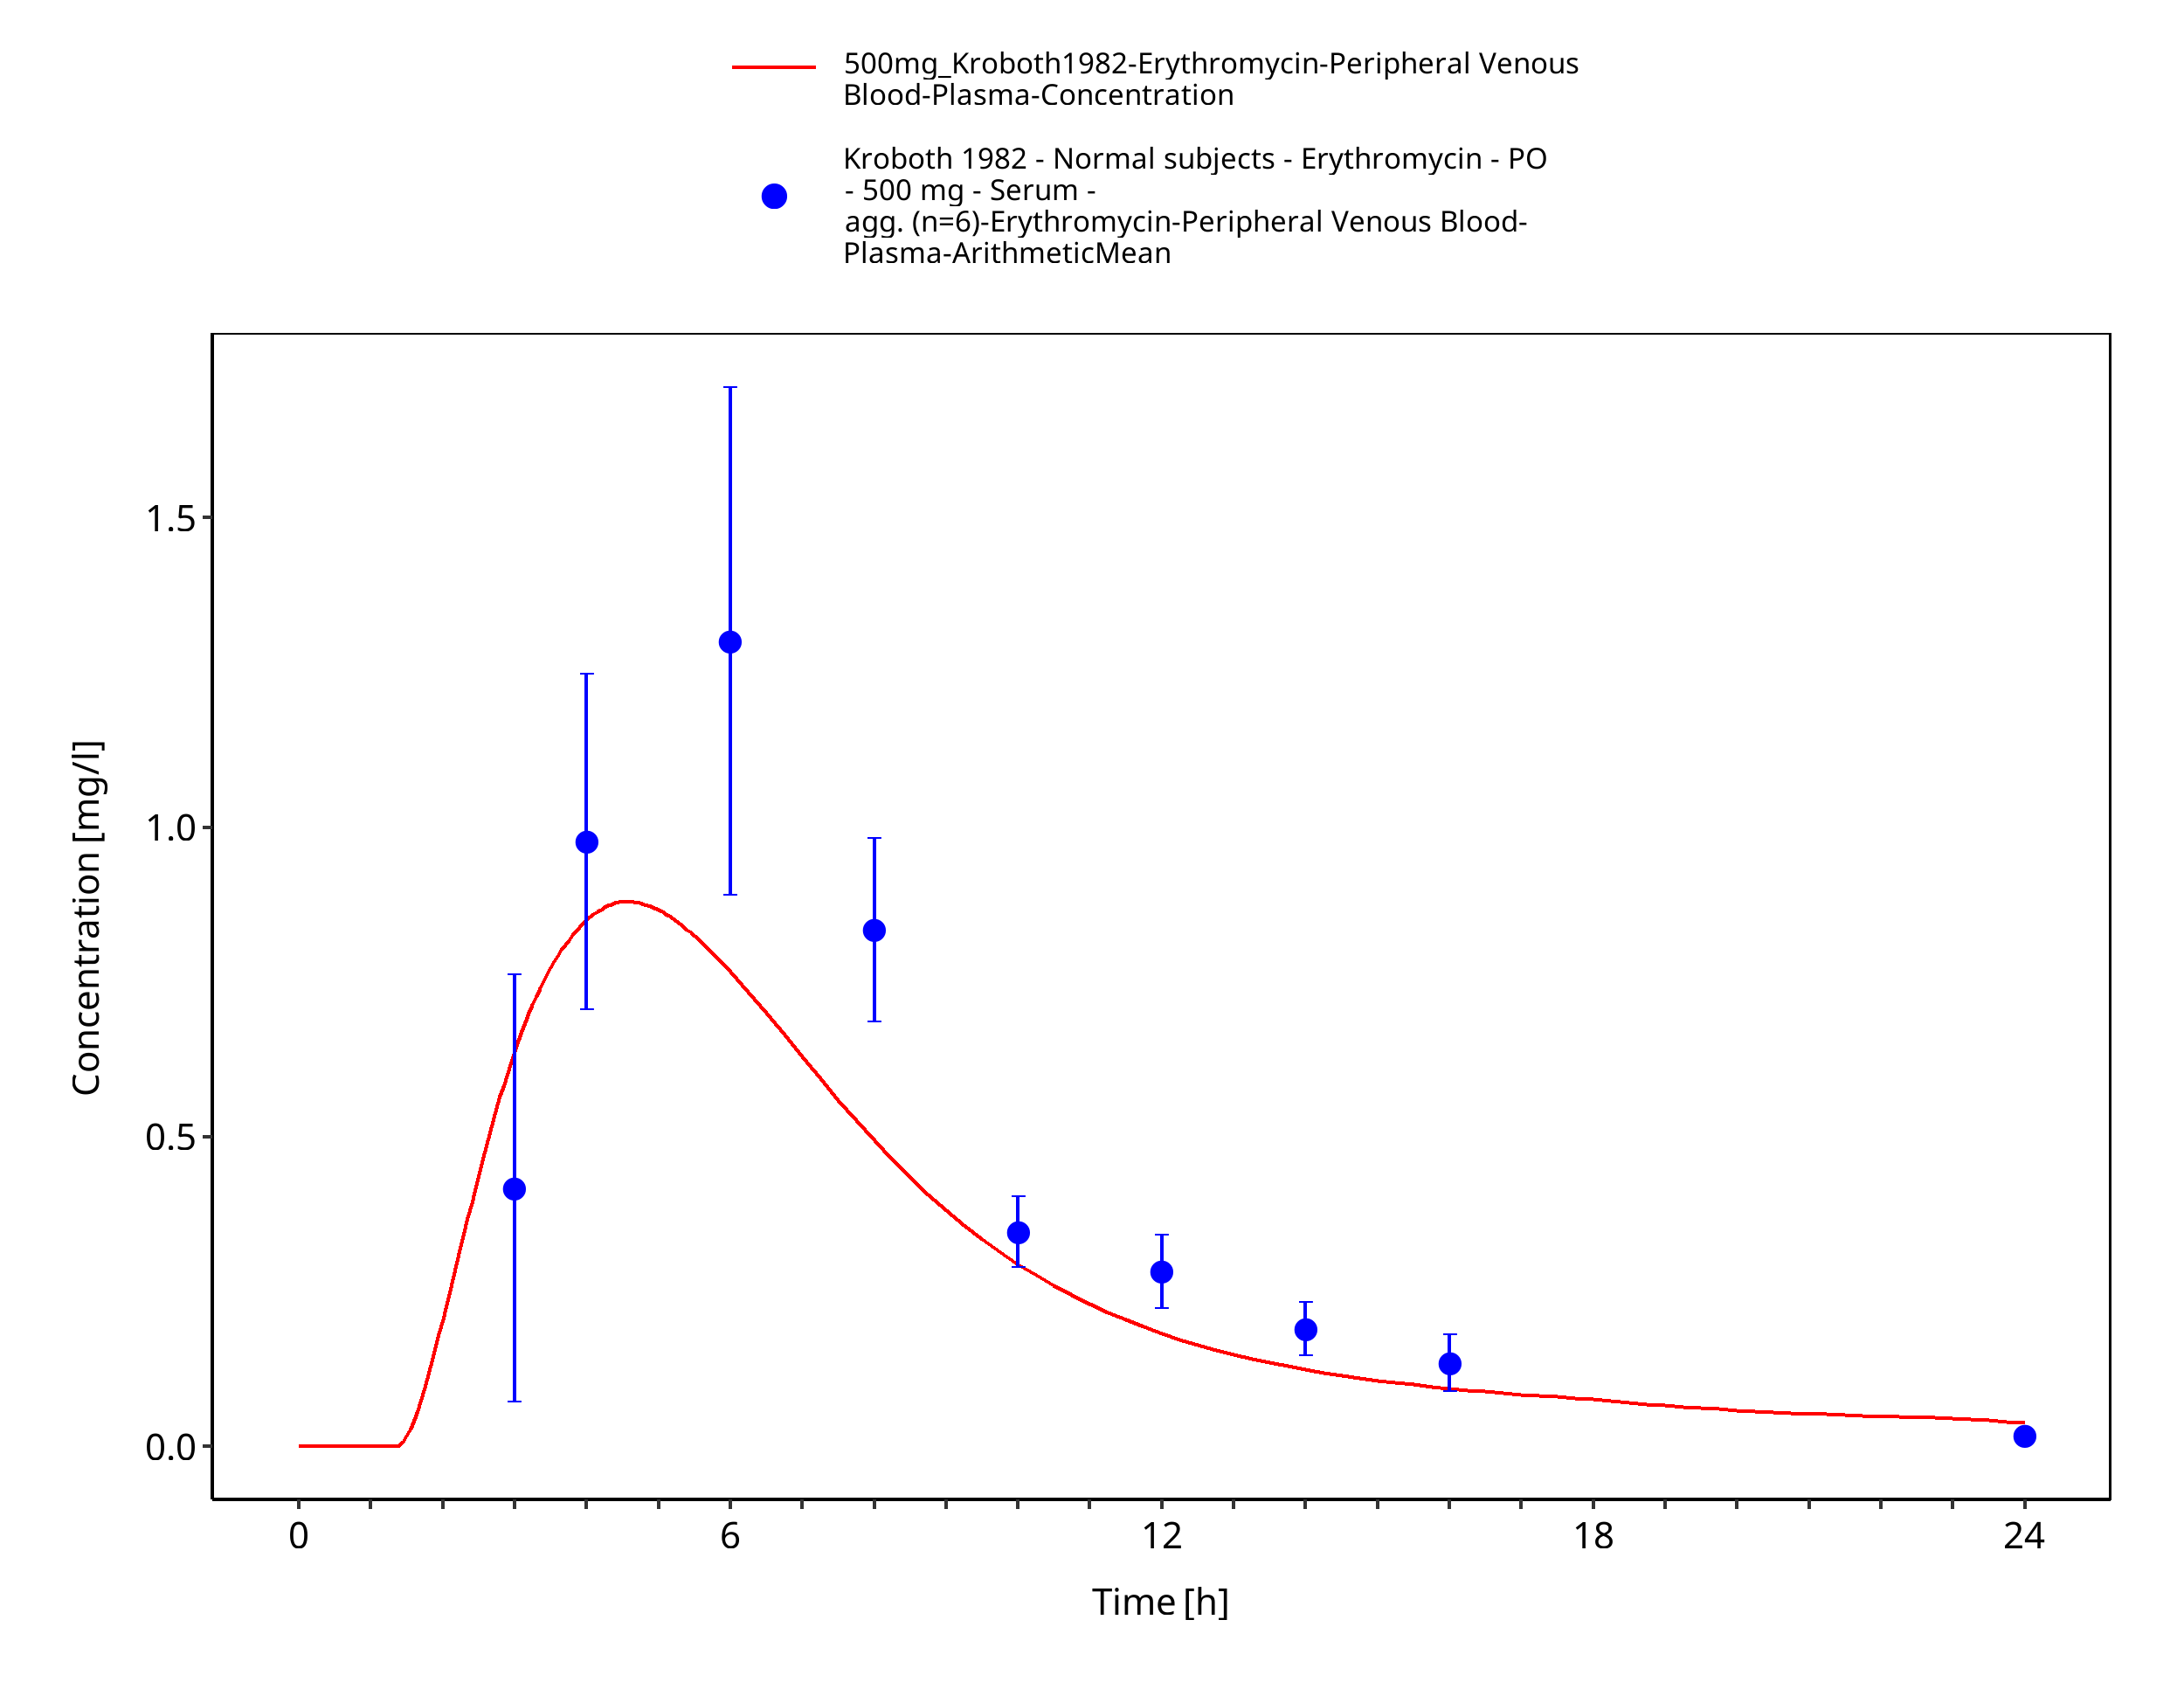
Figure 3-57: Time Profile Analysis 1
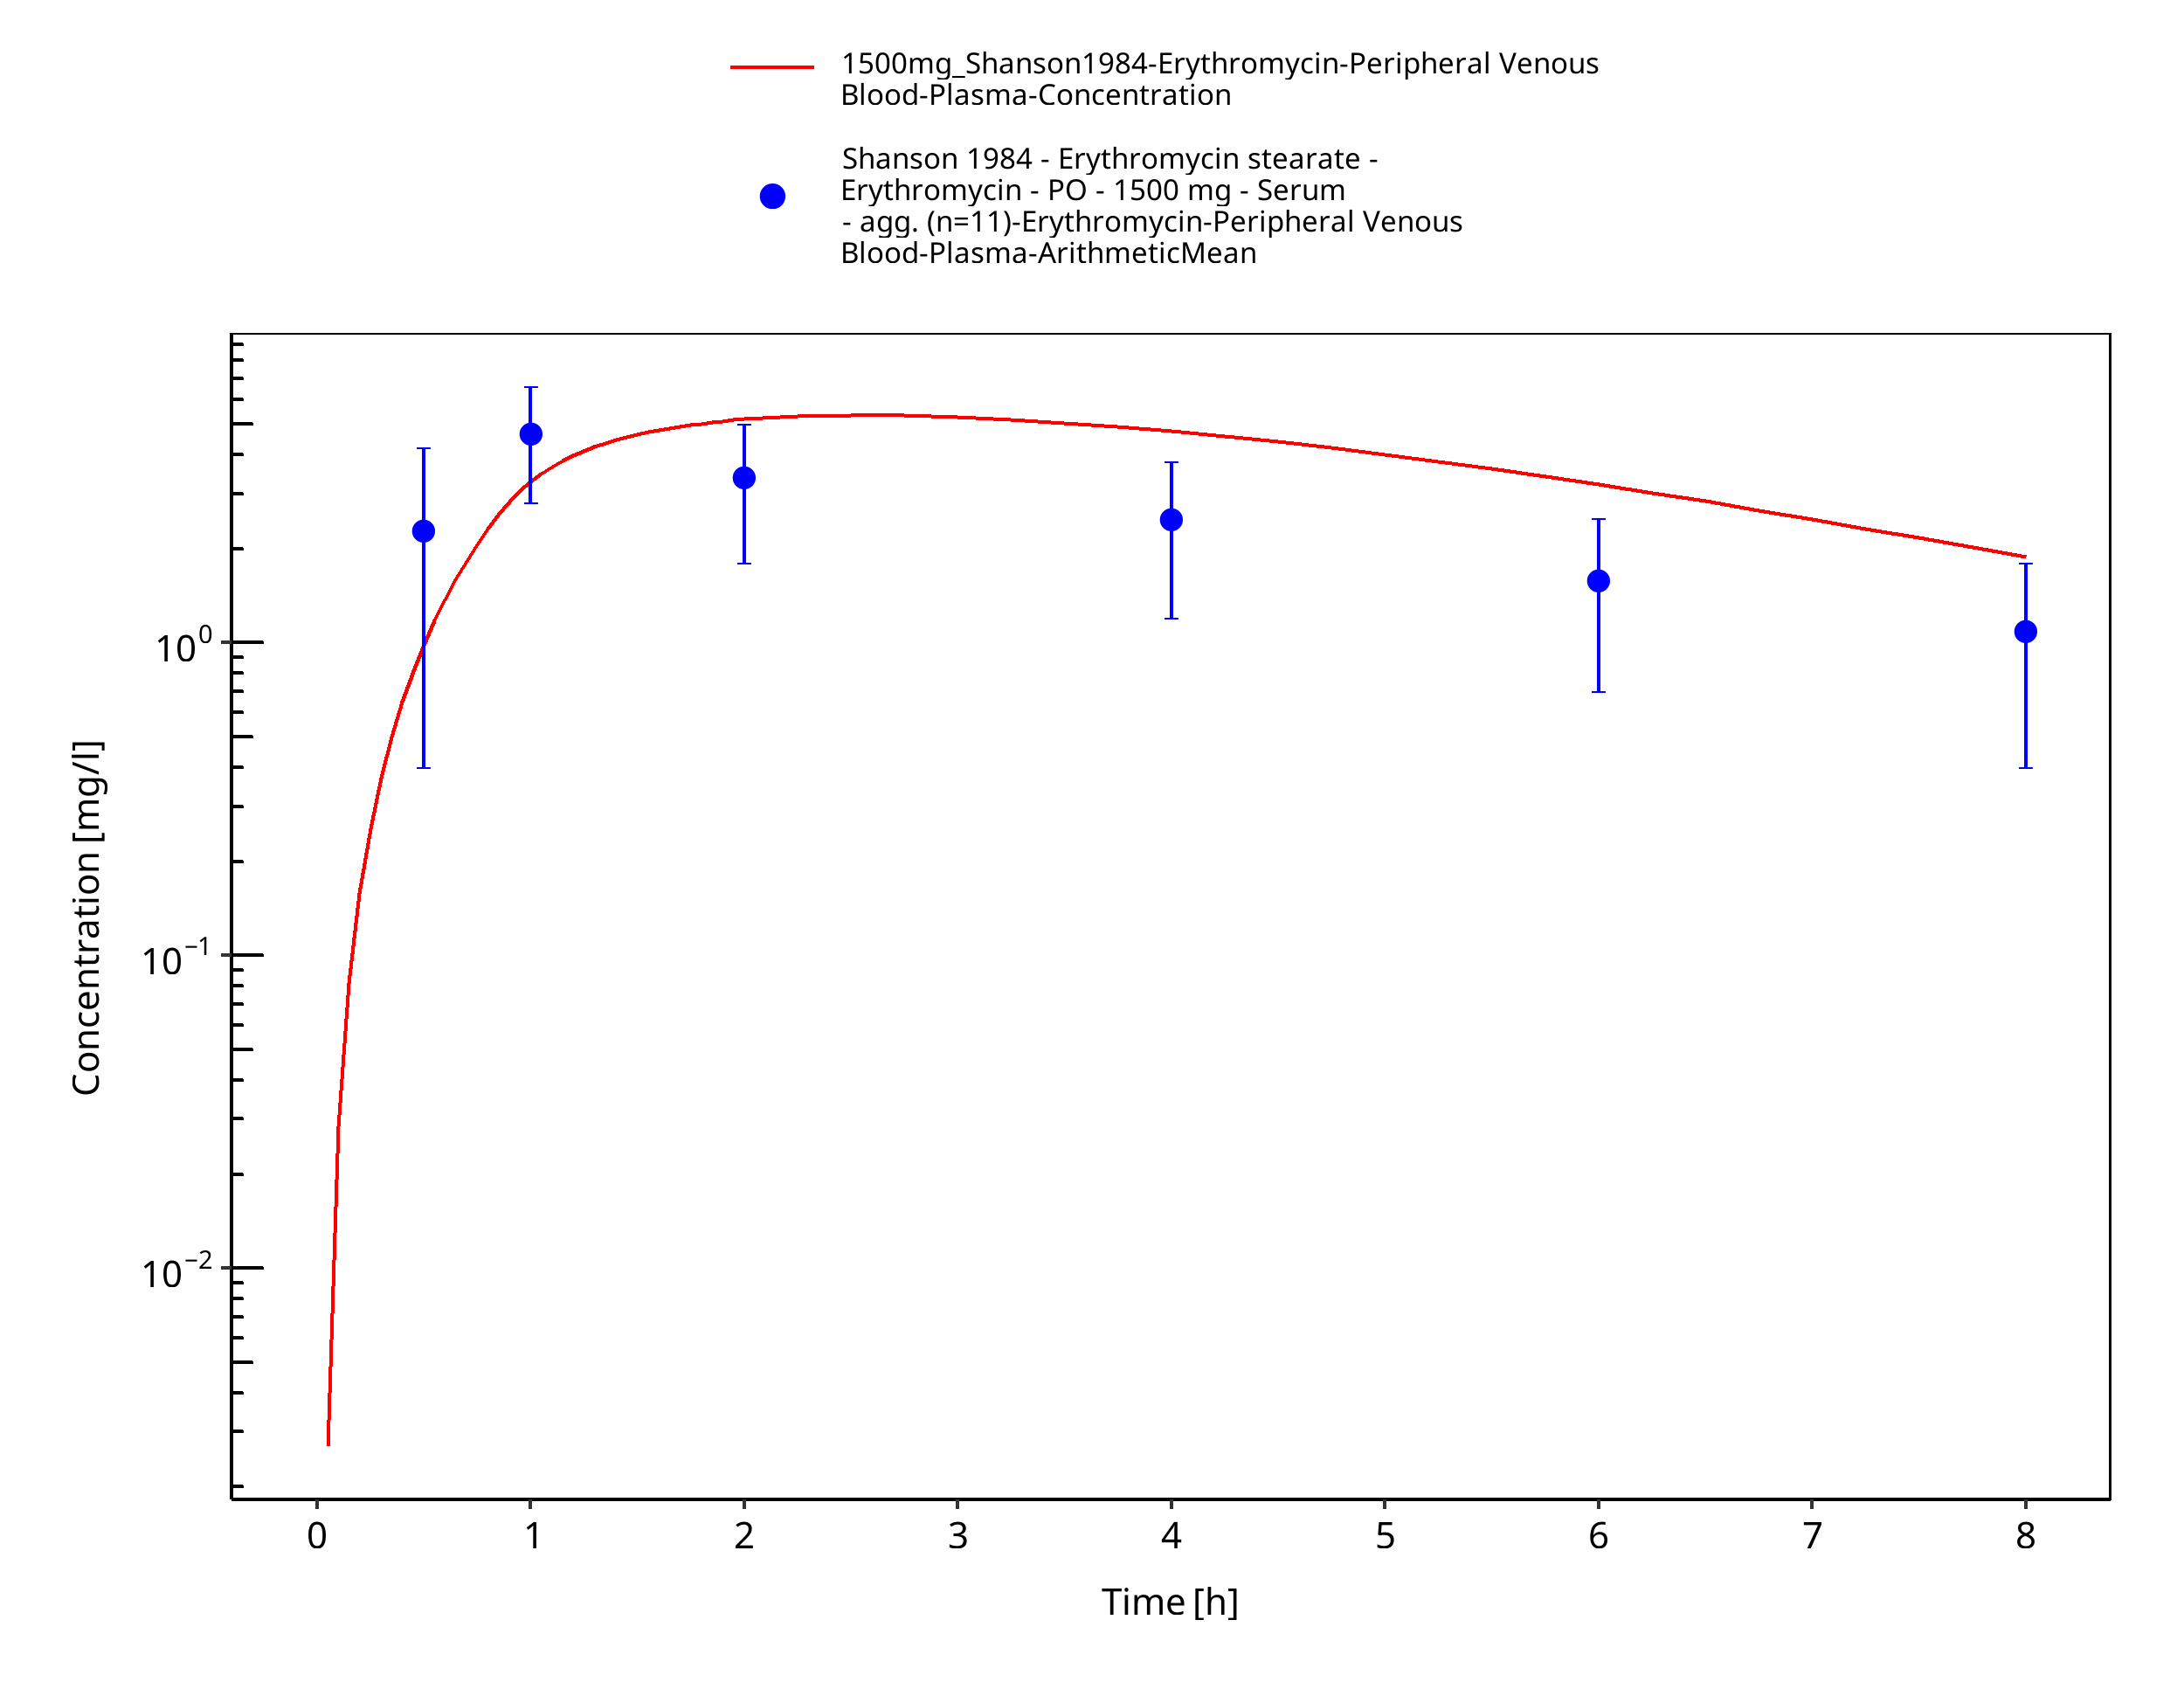
Figure 3-58: Time Profile Analysis
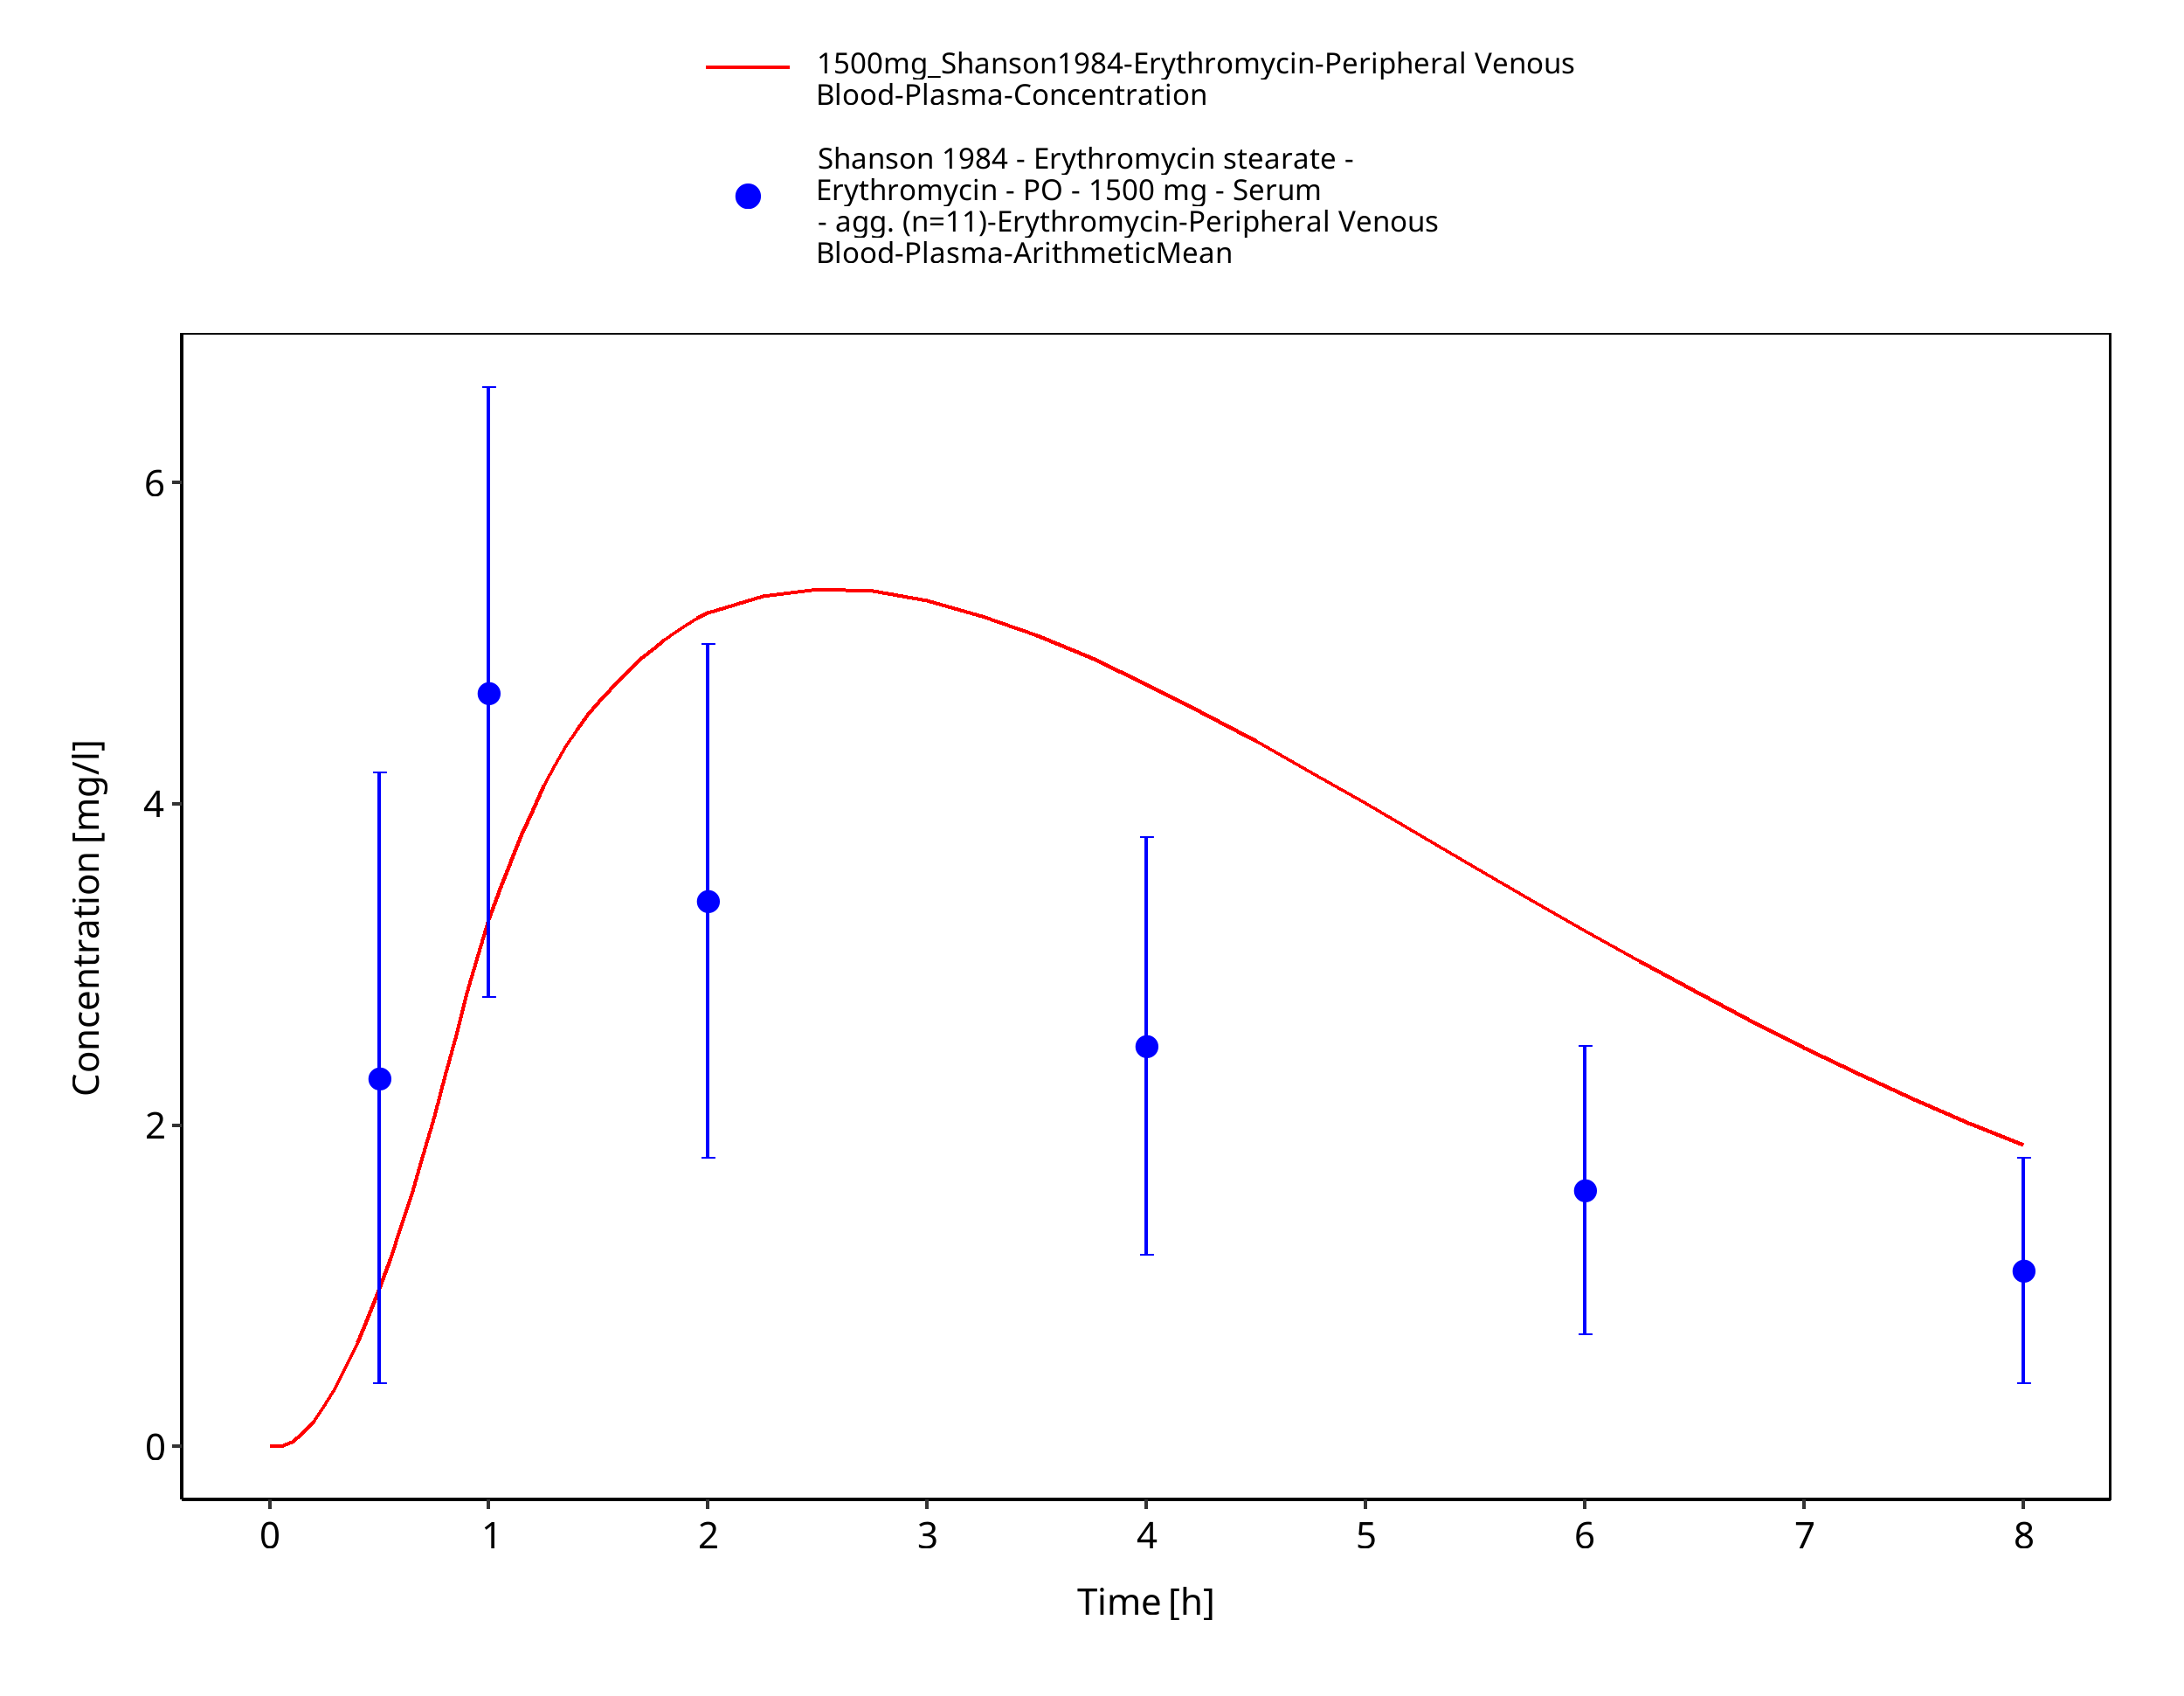
Figure 3-59: Time Profile Analysis 1
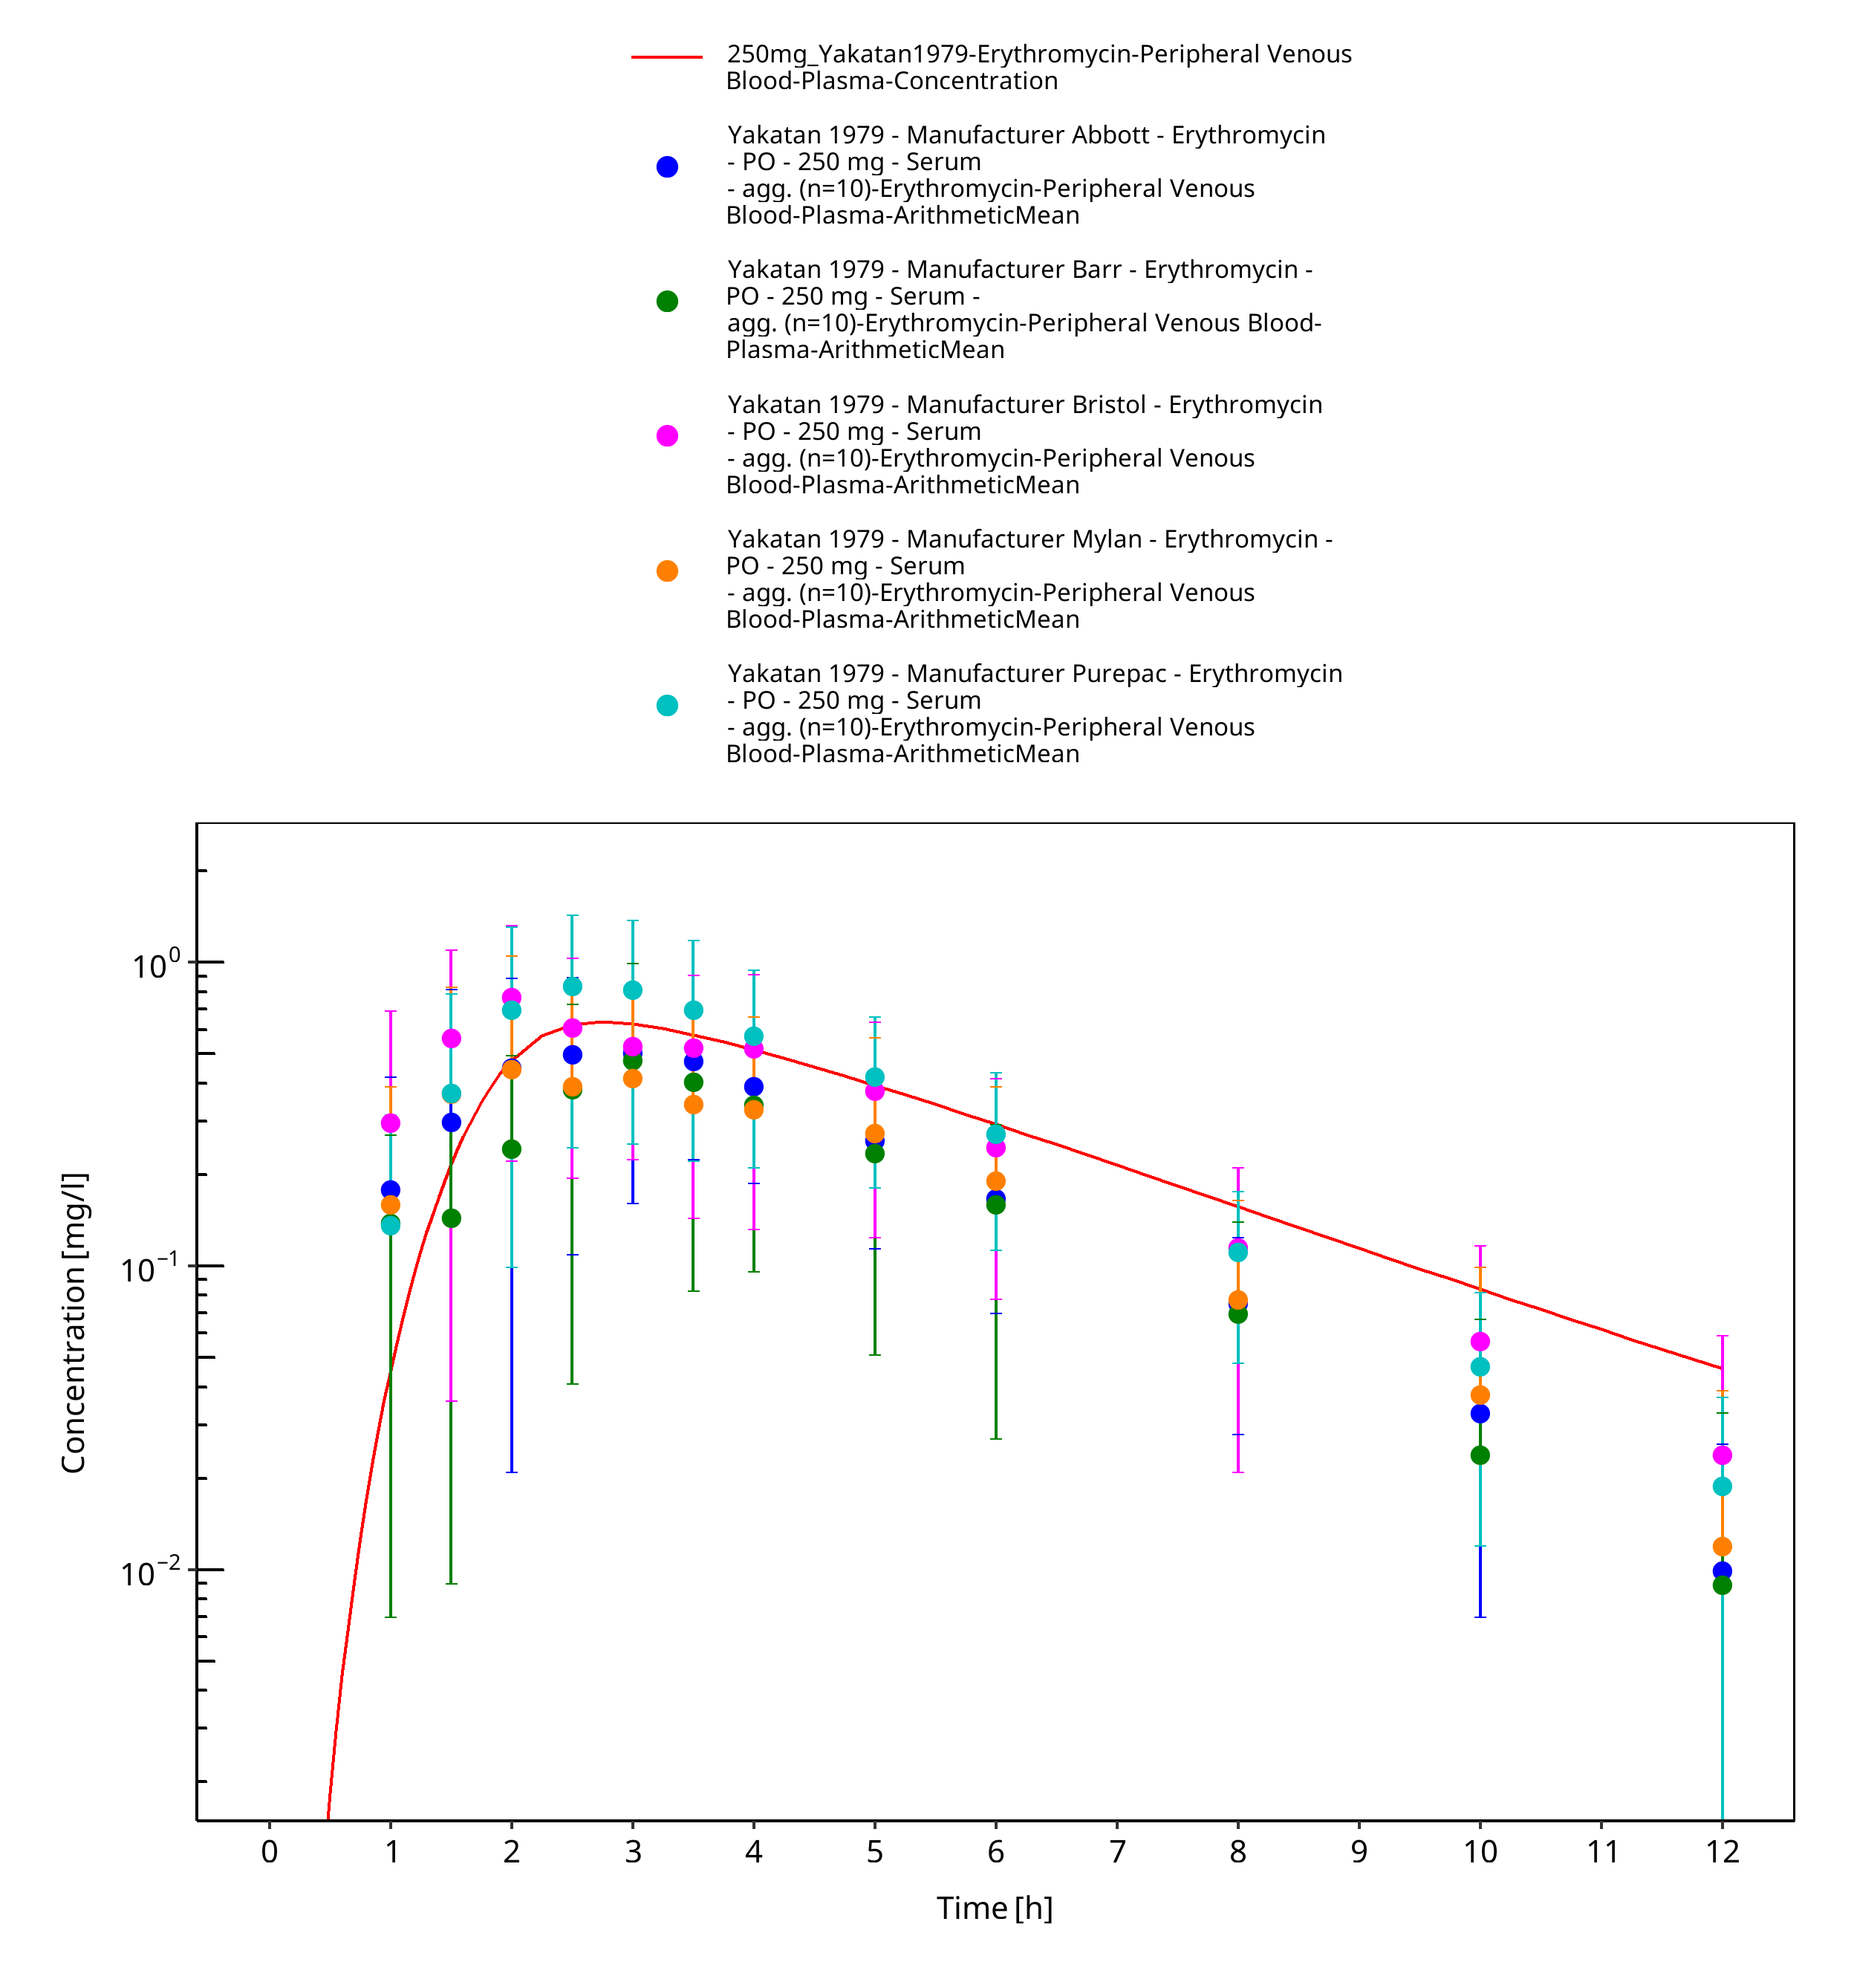
Figure 3-60: Time Profile Analysis
Figure 3-61: Time Profile Analysis 1
Figure 3-62: Time Profile Analysis
Figure 3-63: Time Profile Analysis 1
Figure 3-64: Time Profile Analysis
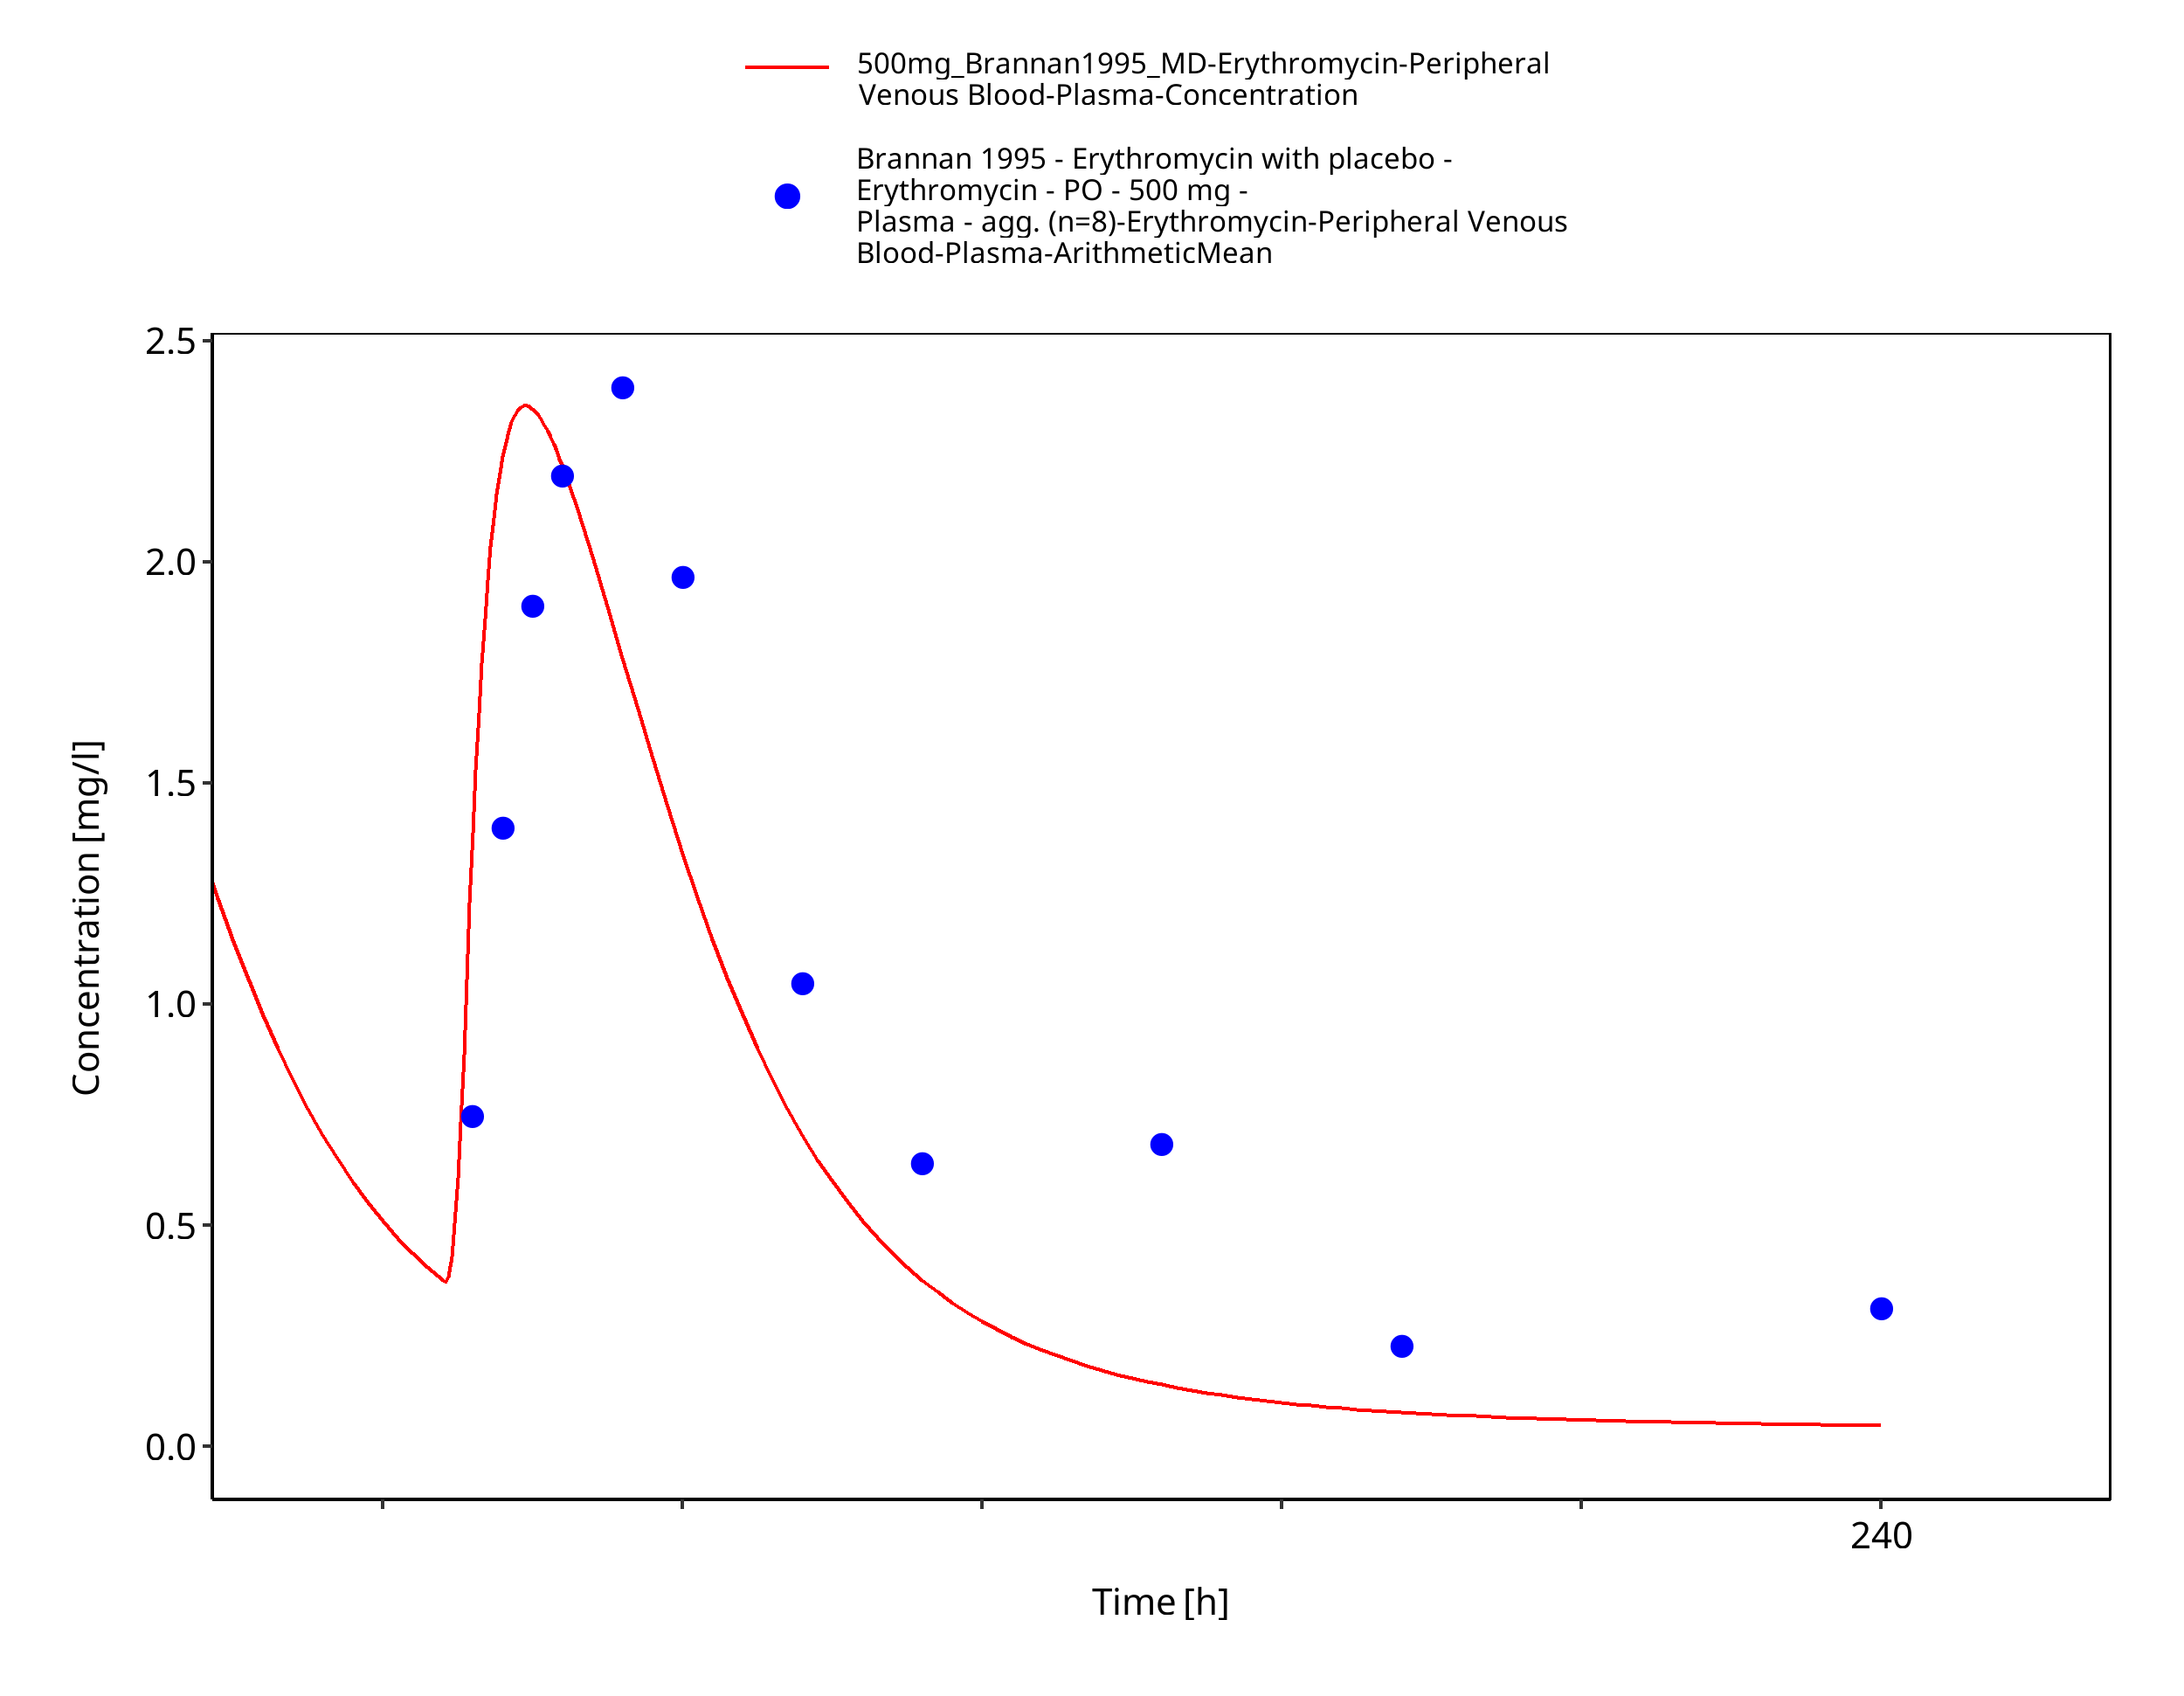
Figure 3-65: Time Profile Analysis 1
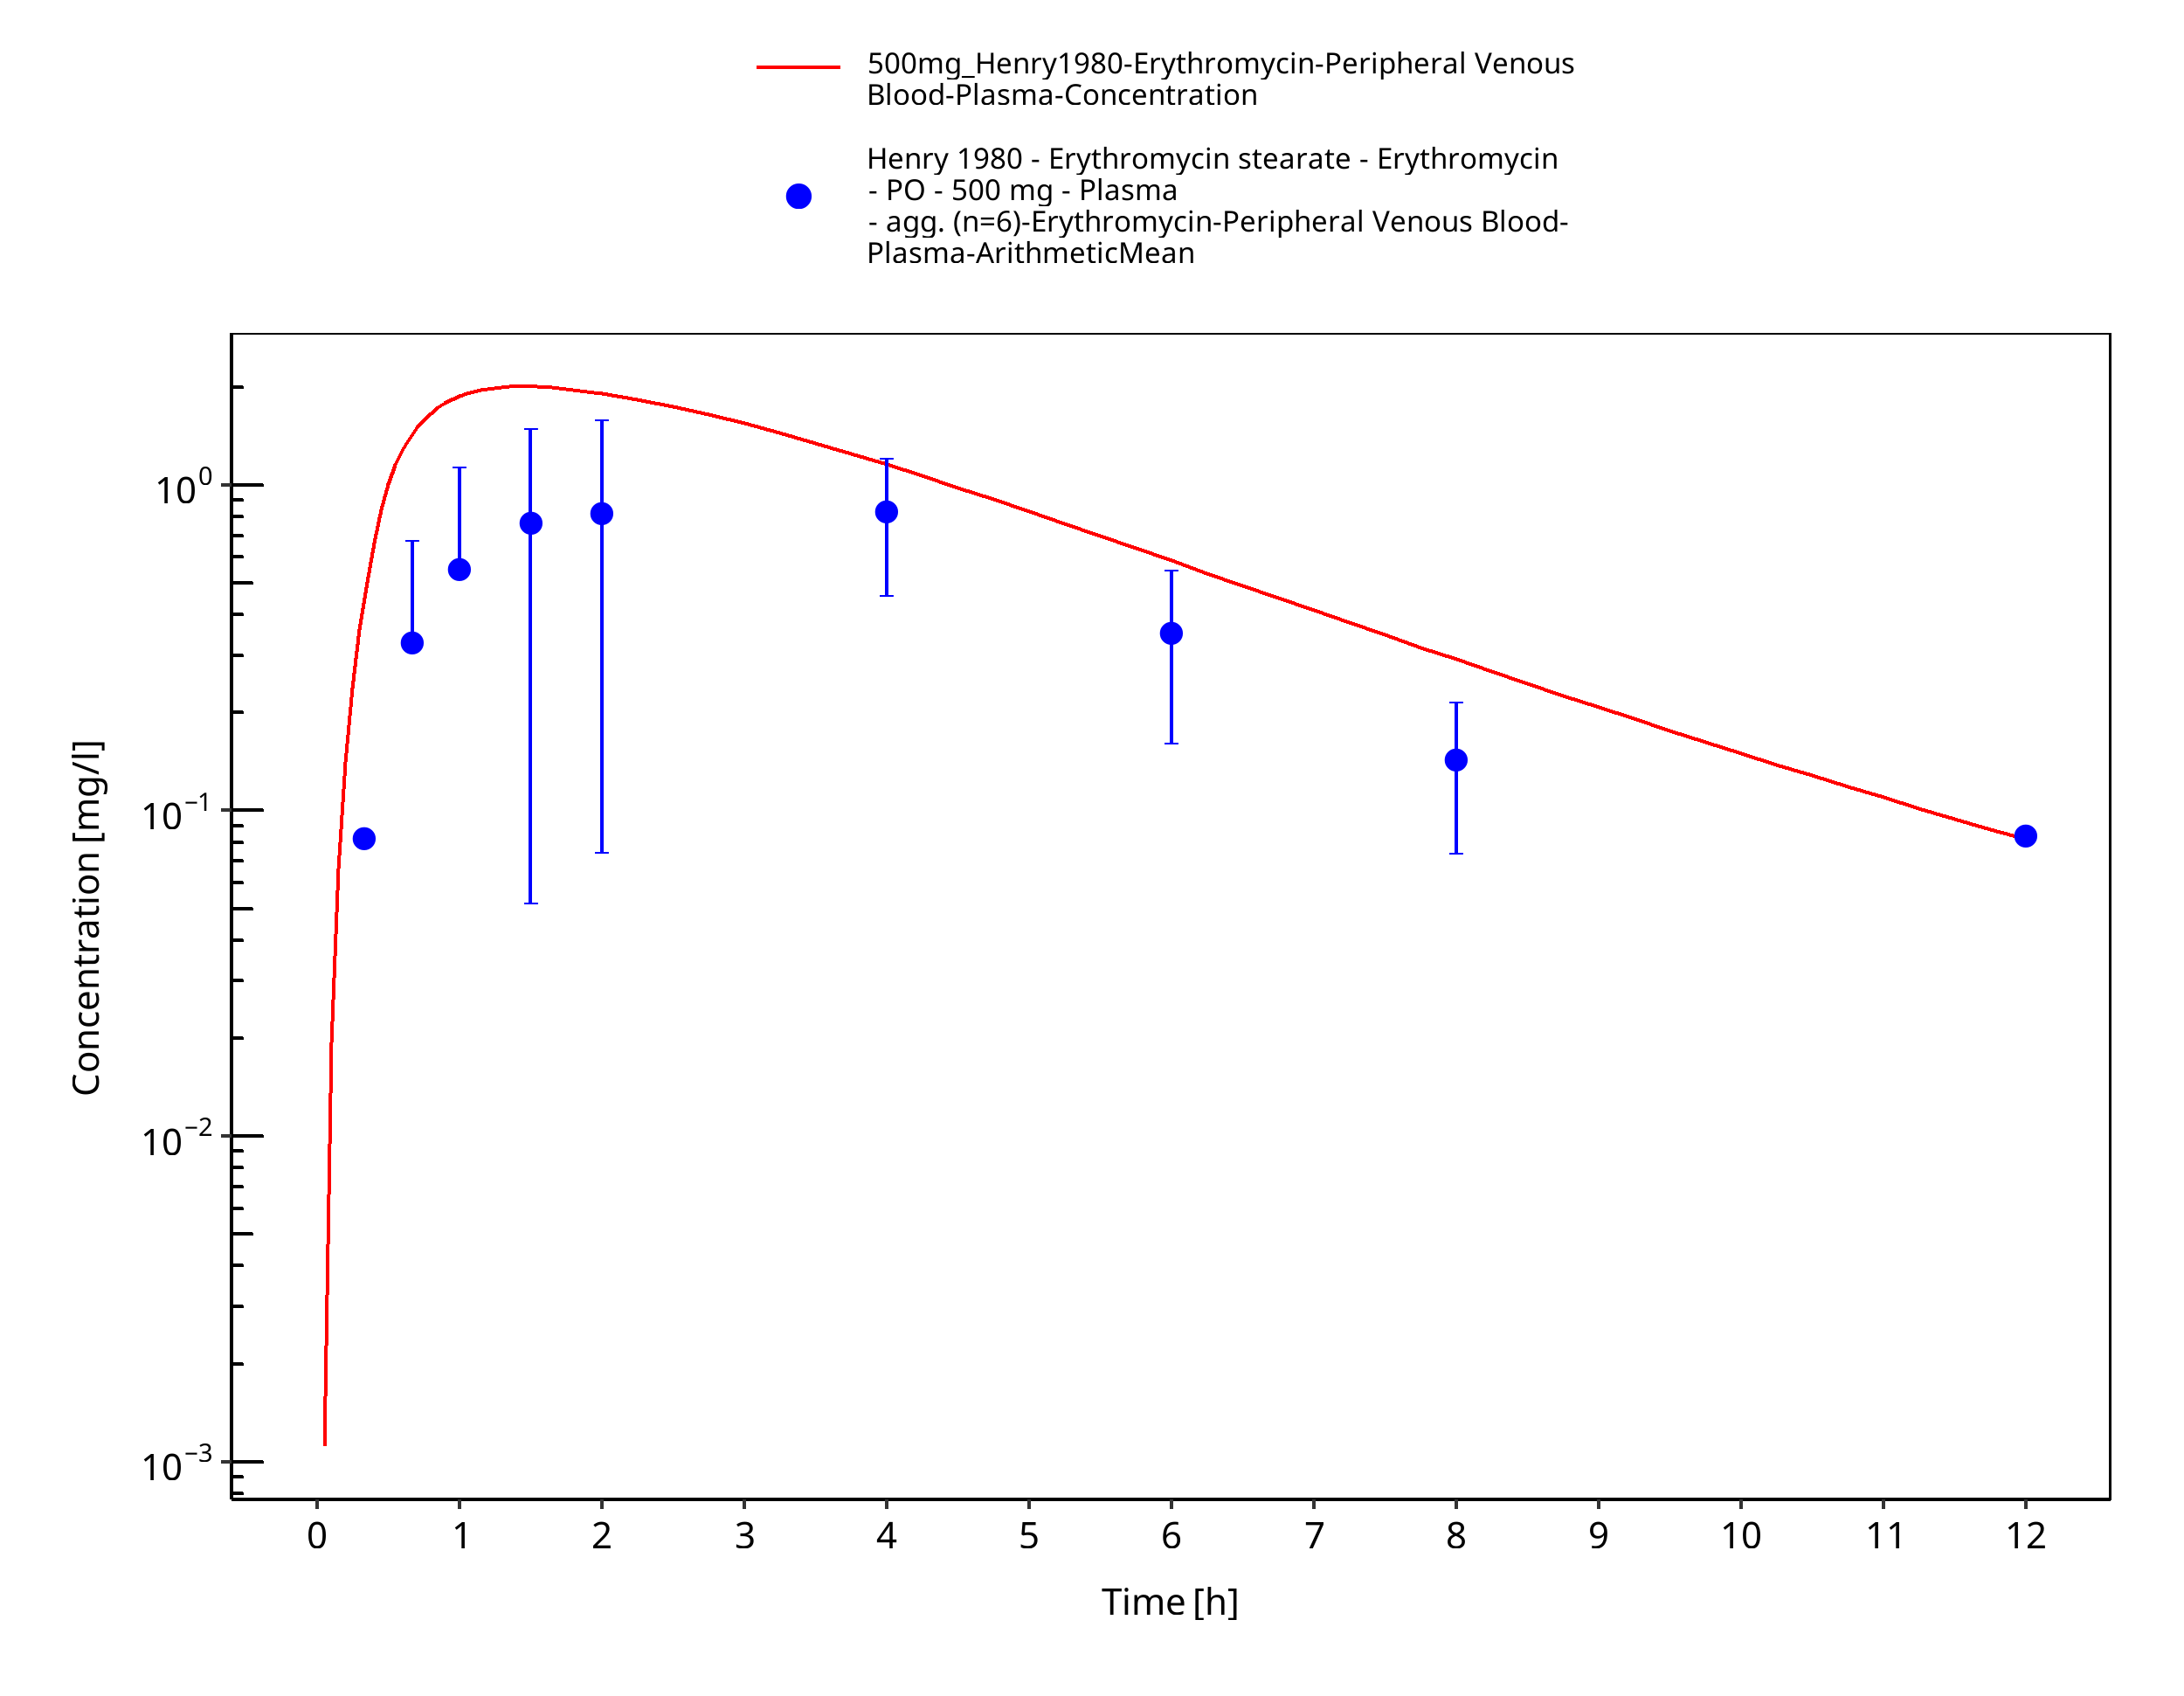
Figure 3-66: Time Profile Analysis
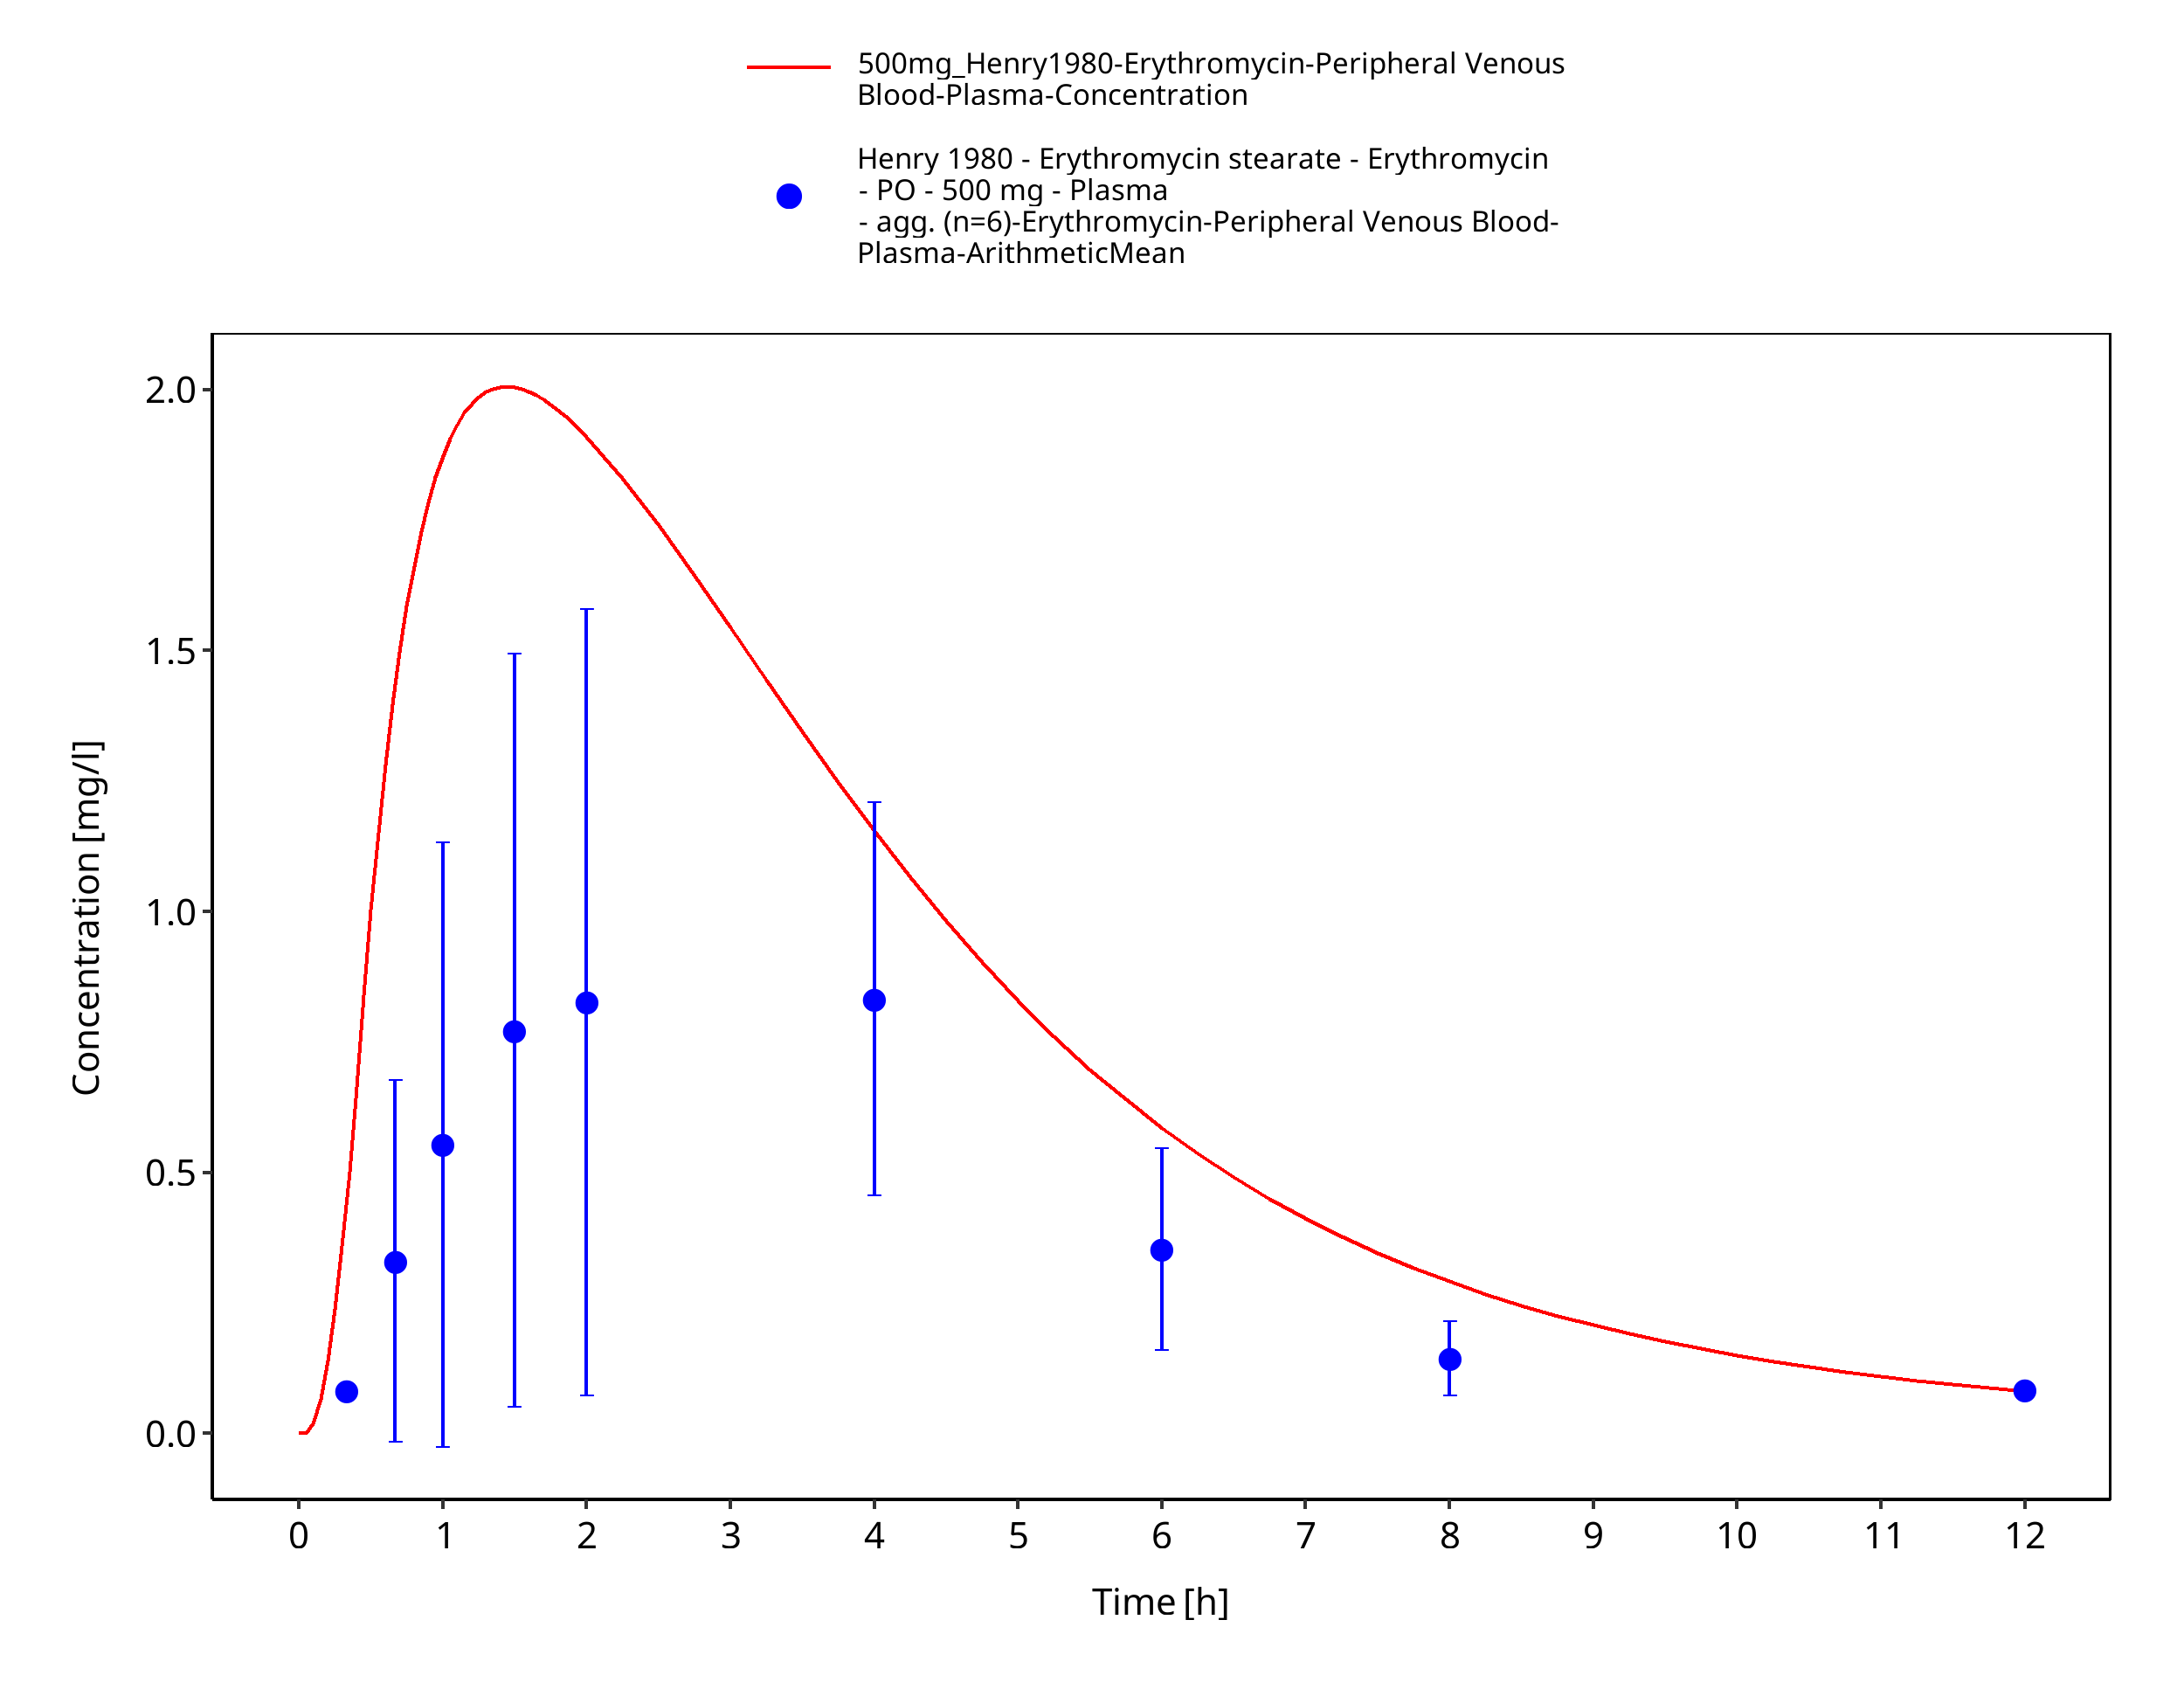
Figure 3-67: Time Profile Analysis 1
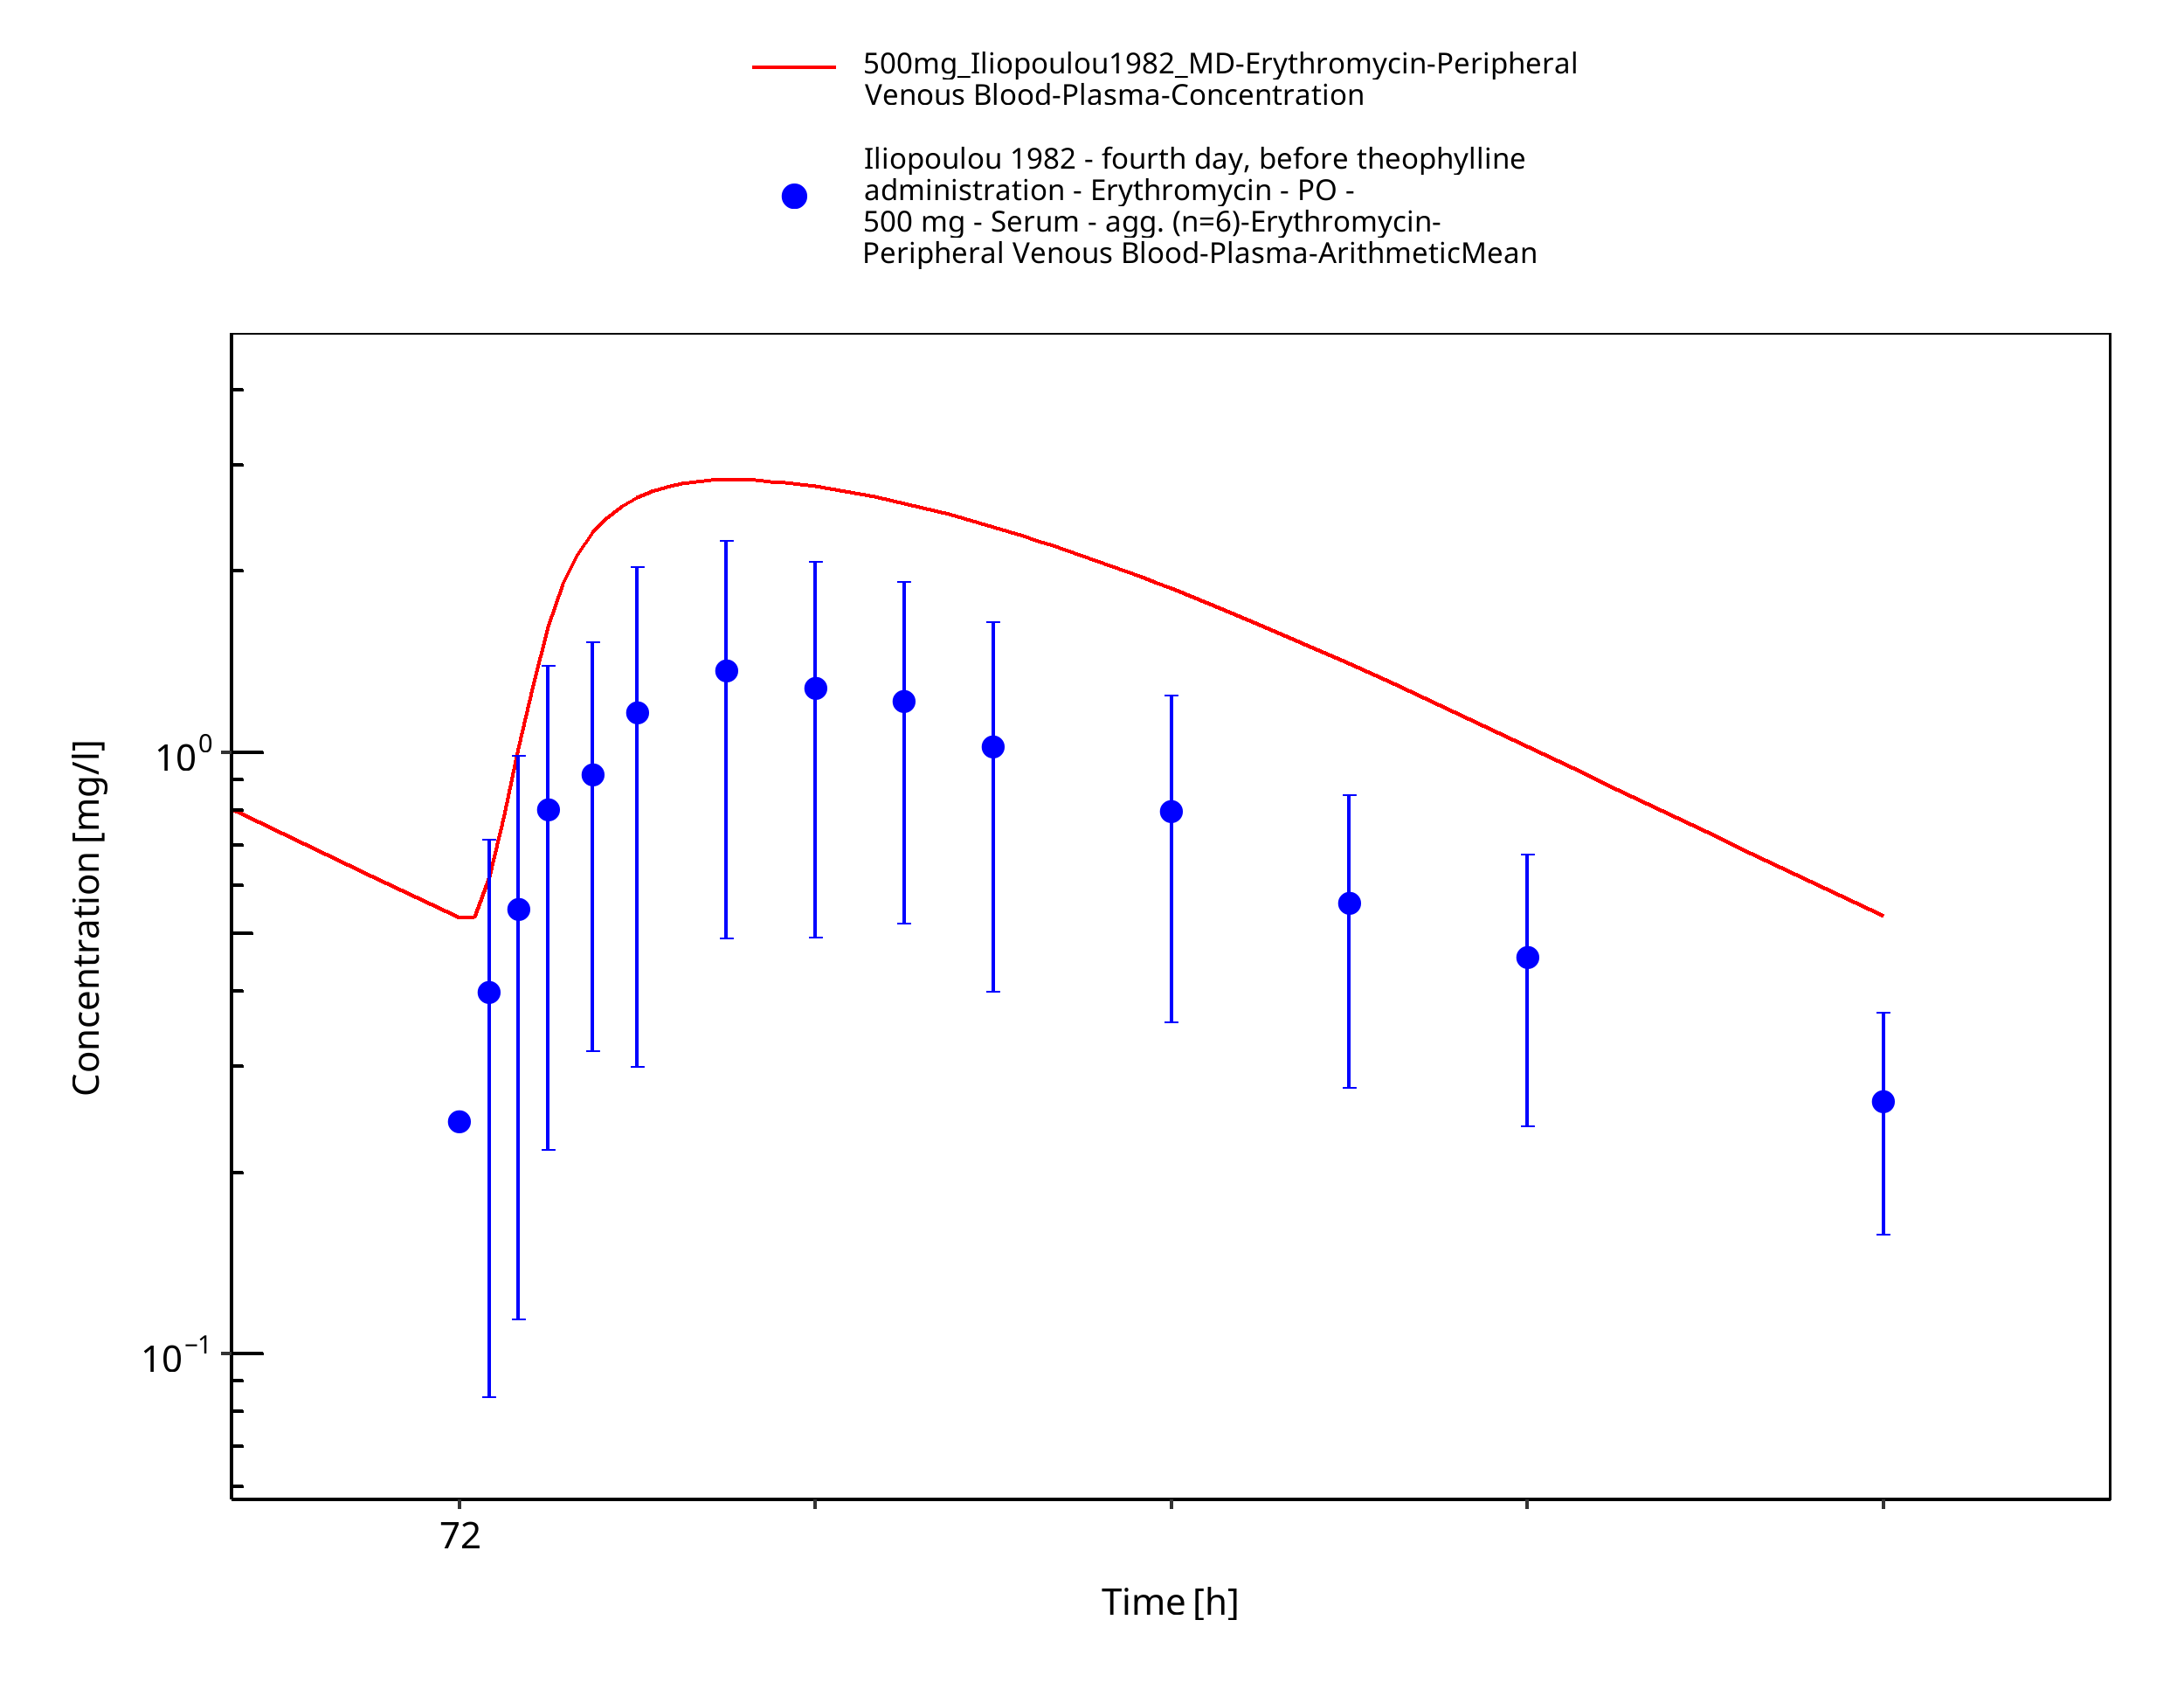
Figure 3-68: Time Profile Analysis
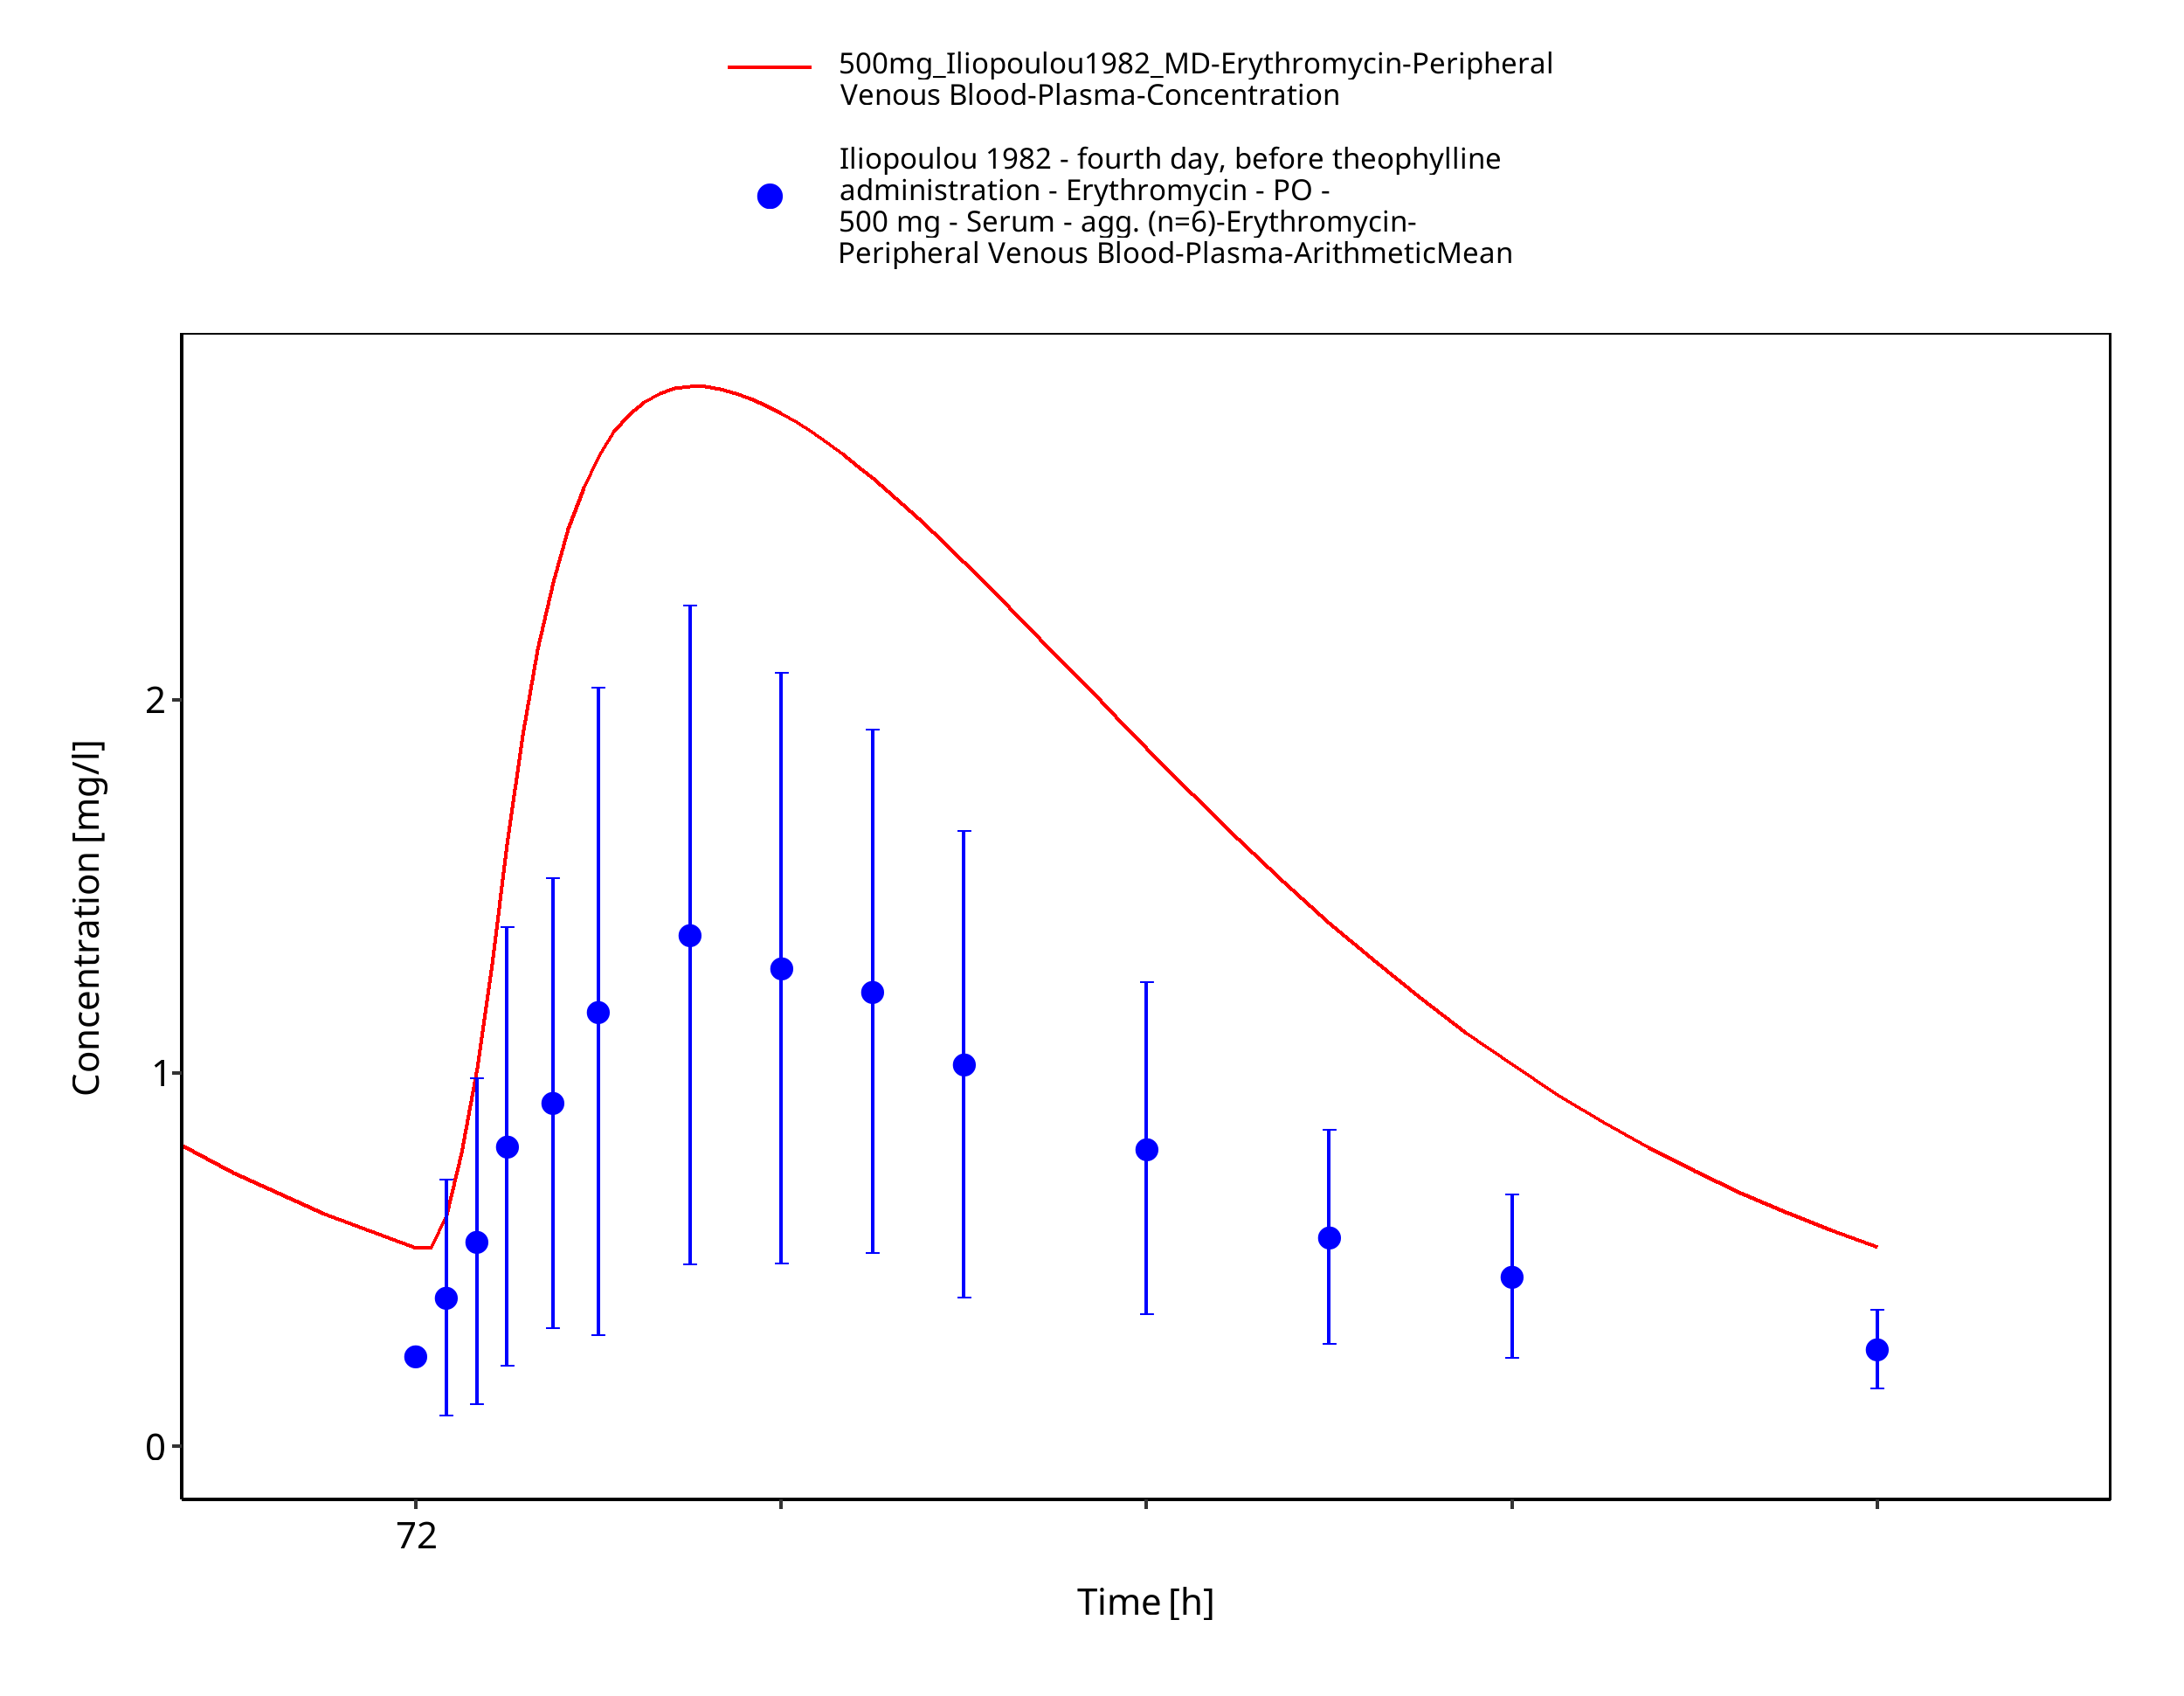
Figure 3-69: Time Profile Analysis 1
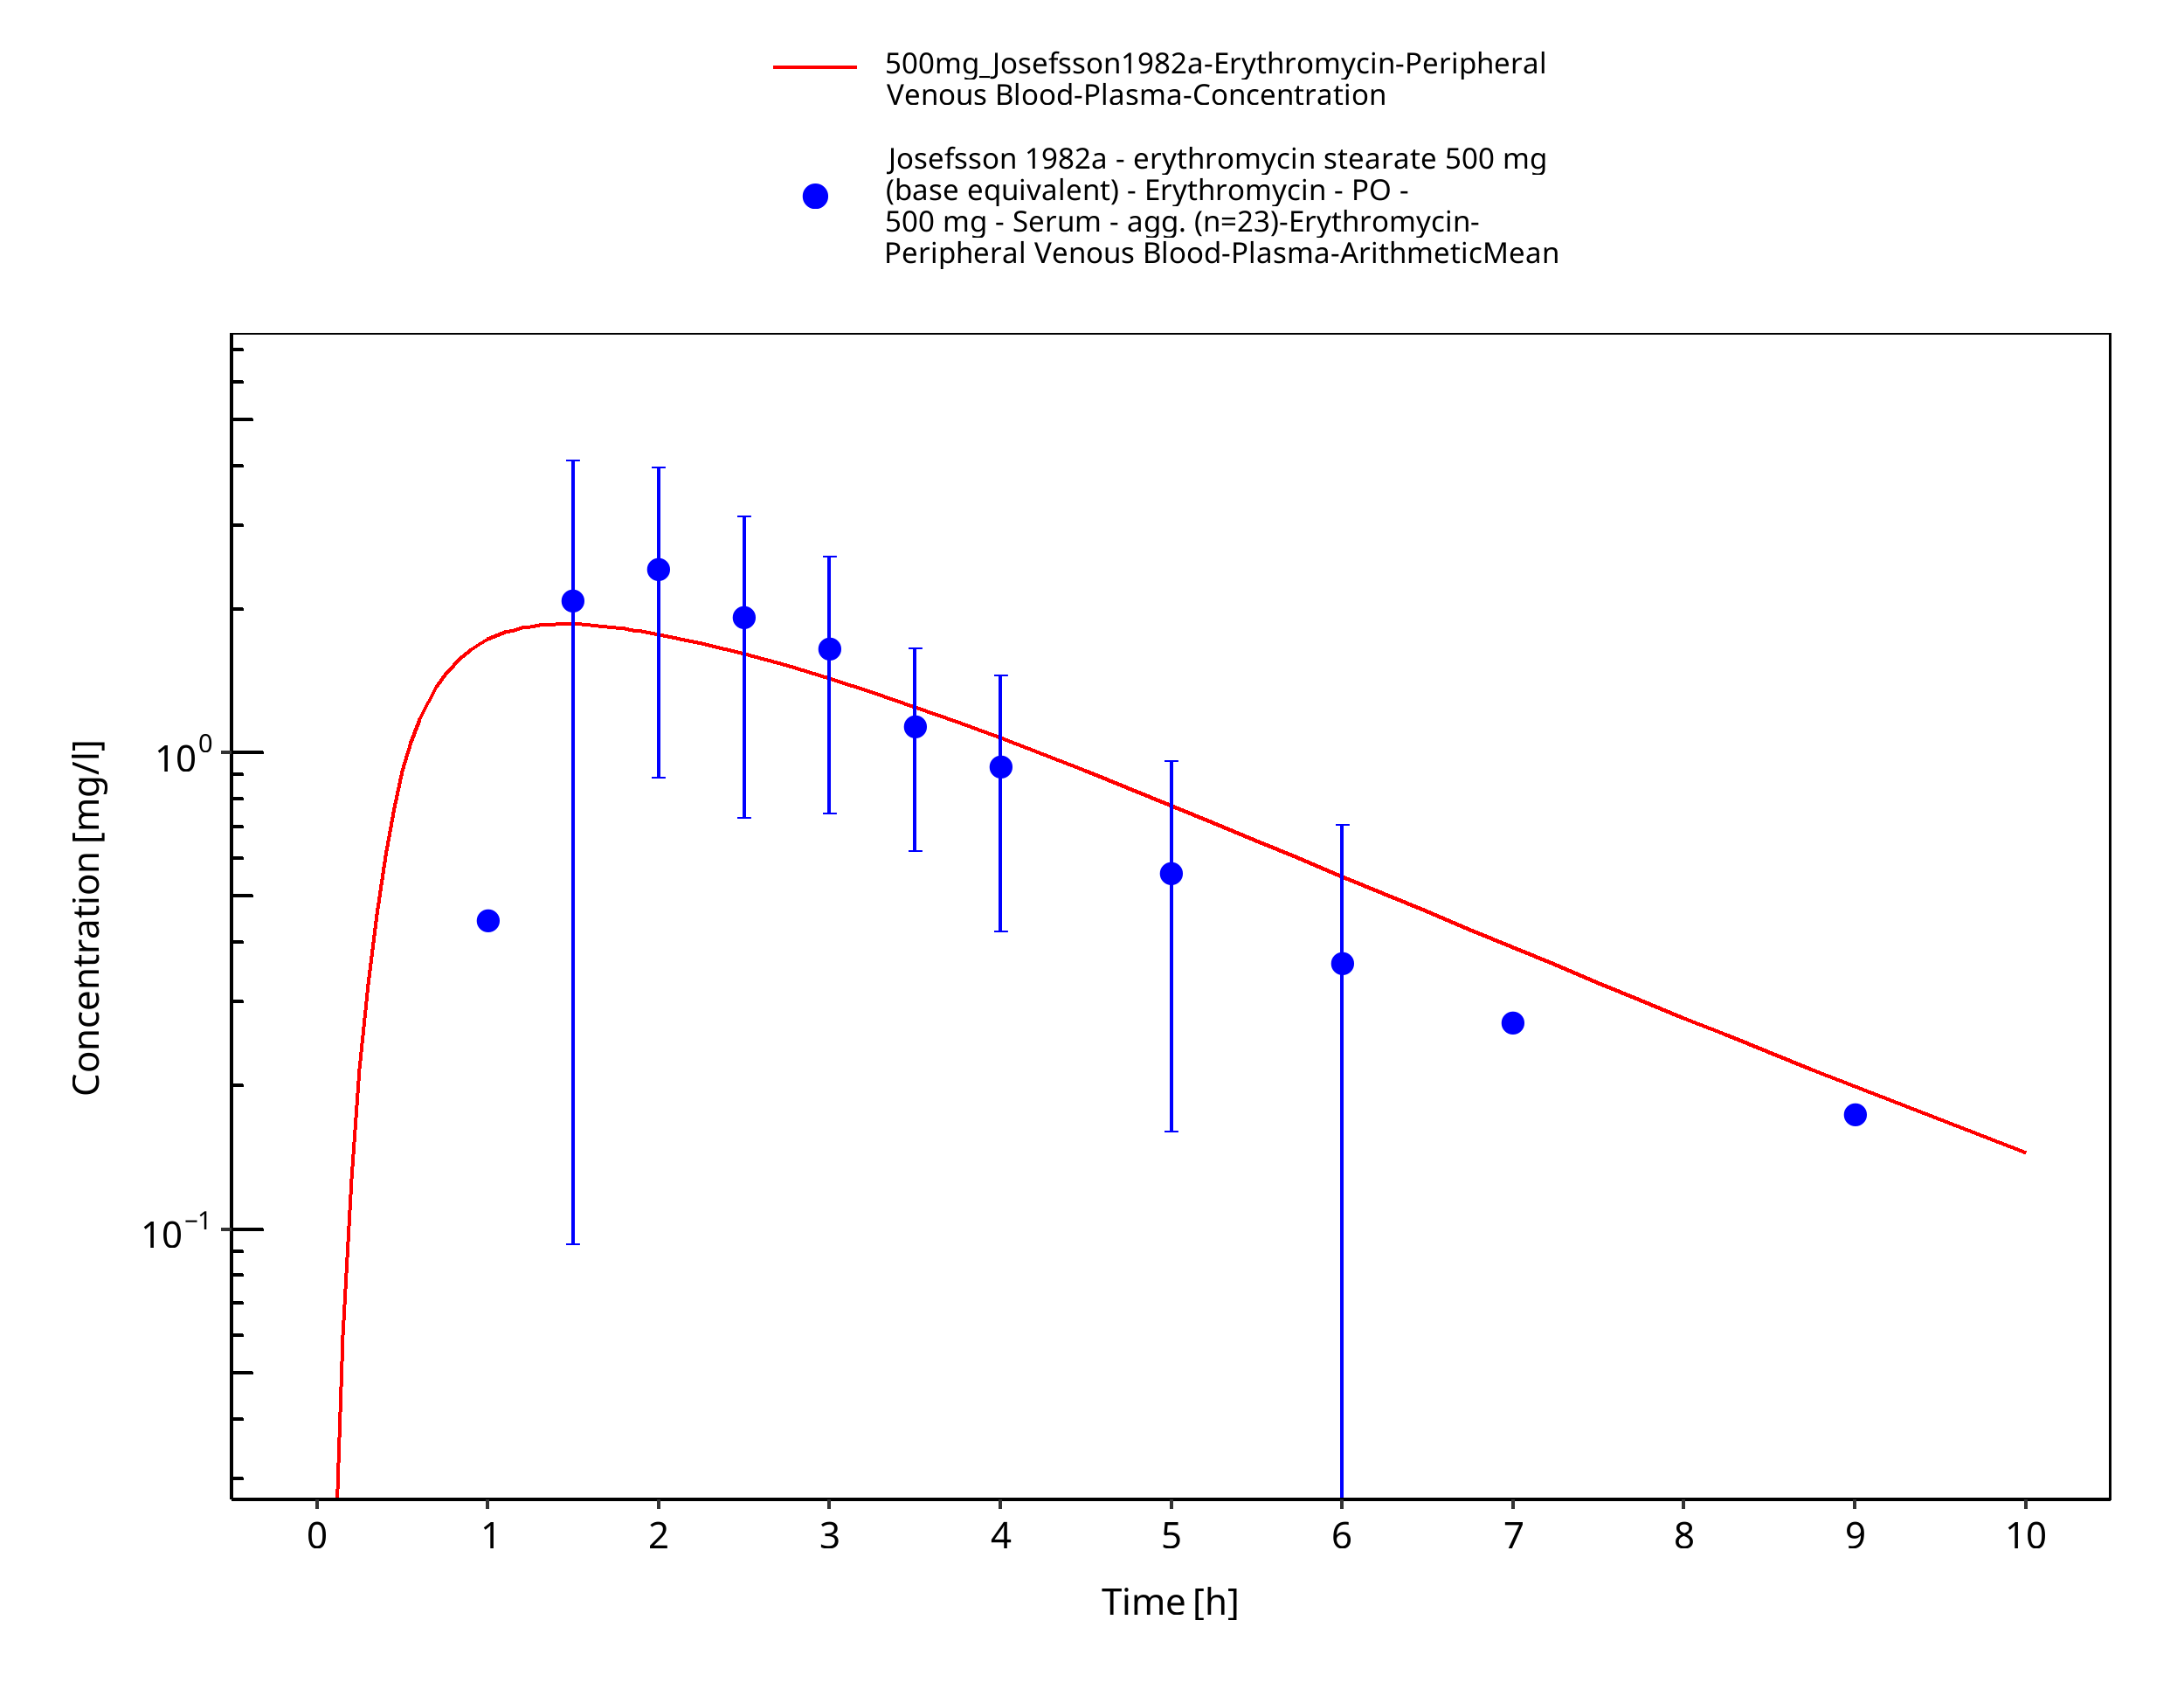
Figure 3-70: Time Profile Analysis
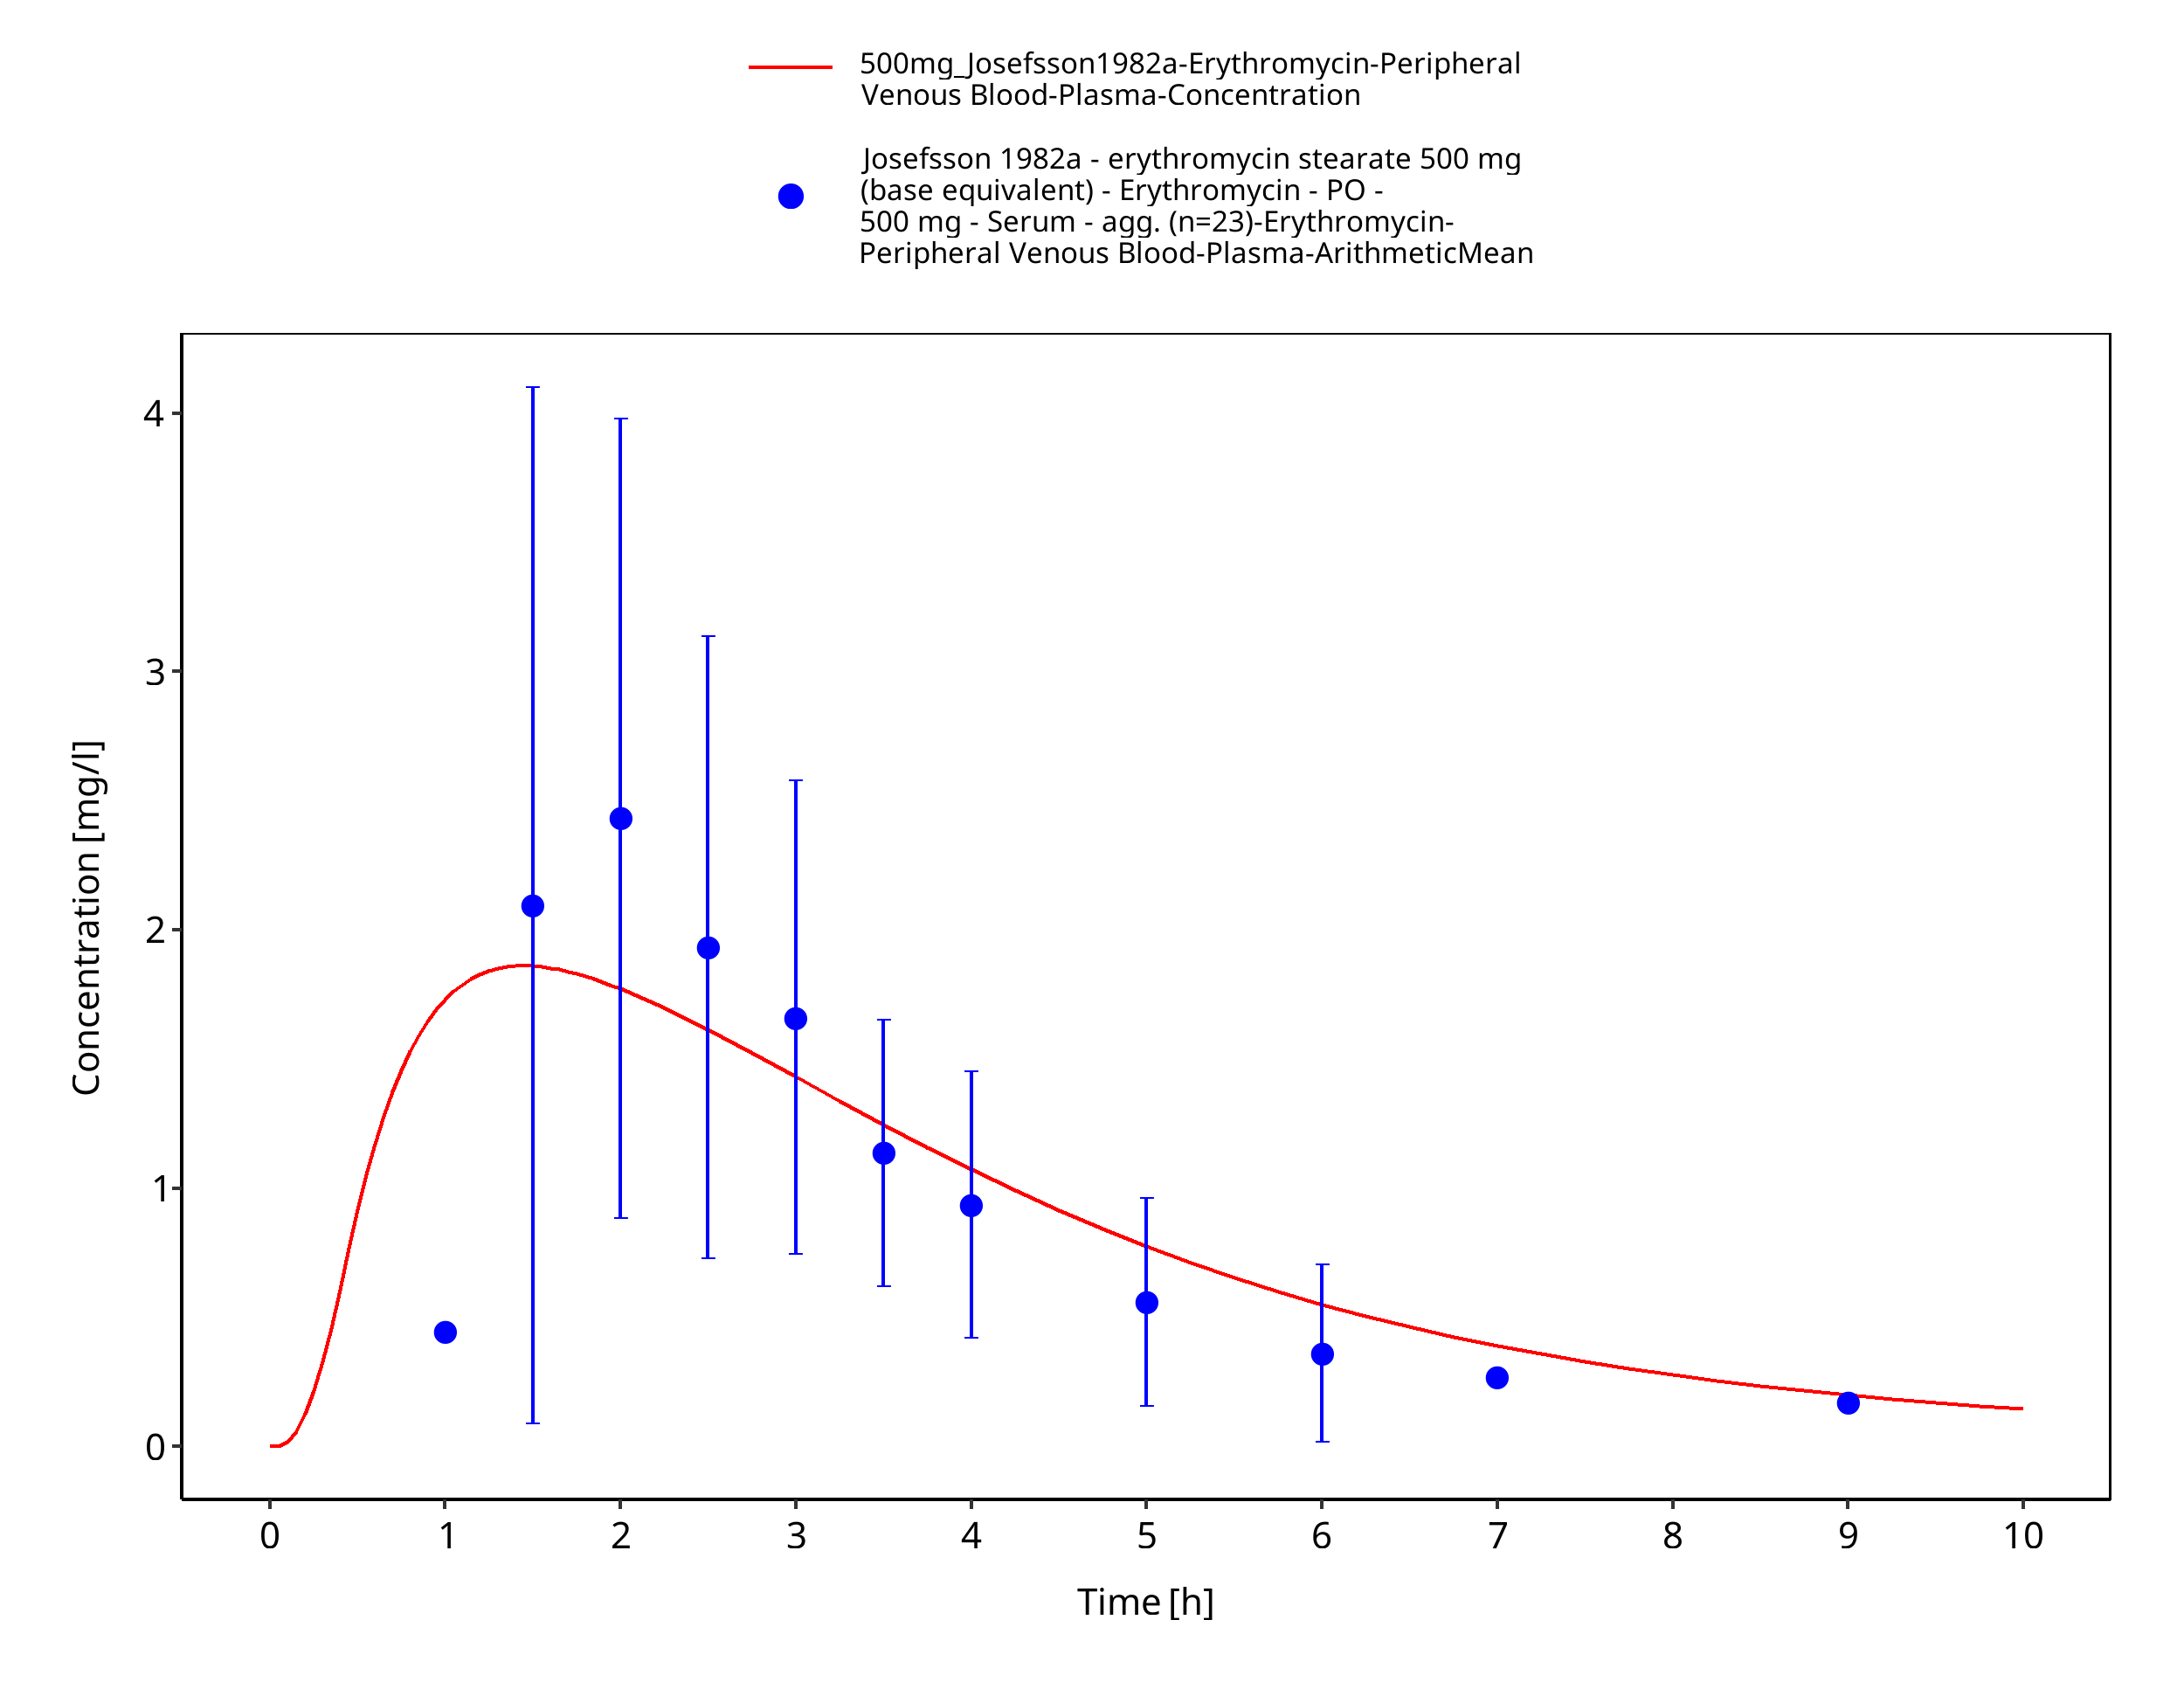
Figure 3-71: Time Profile Analysis 1
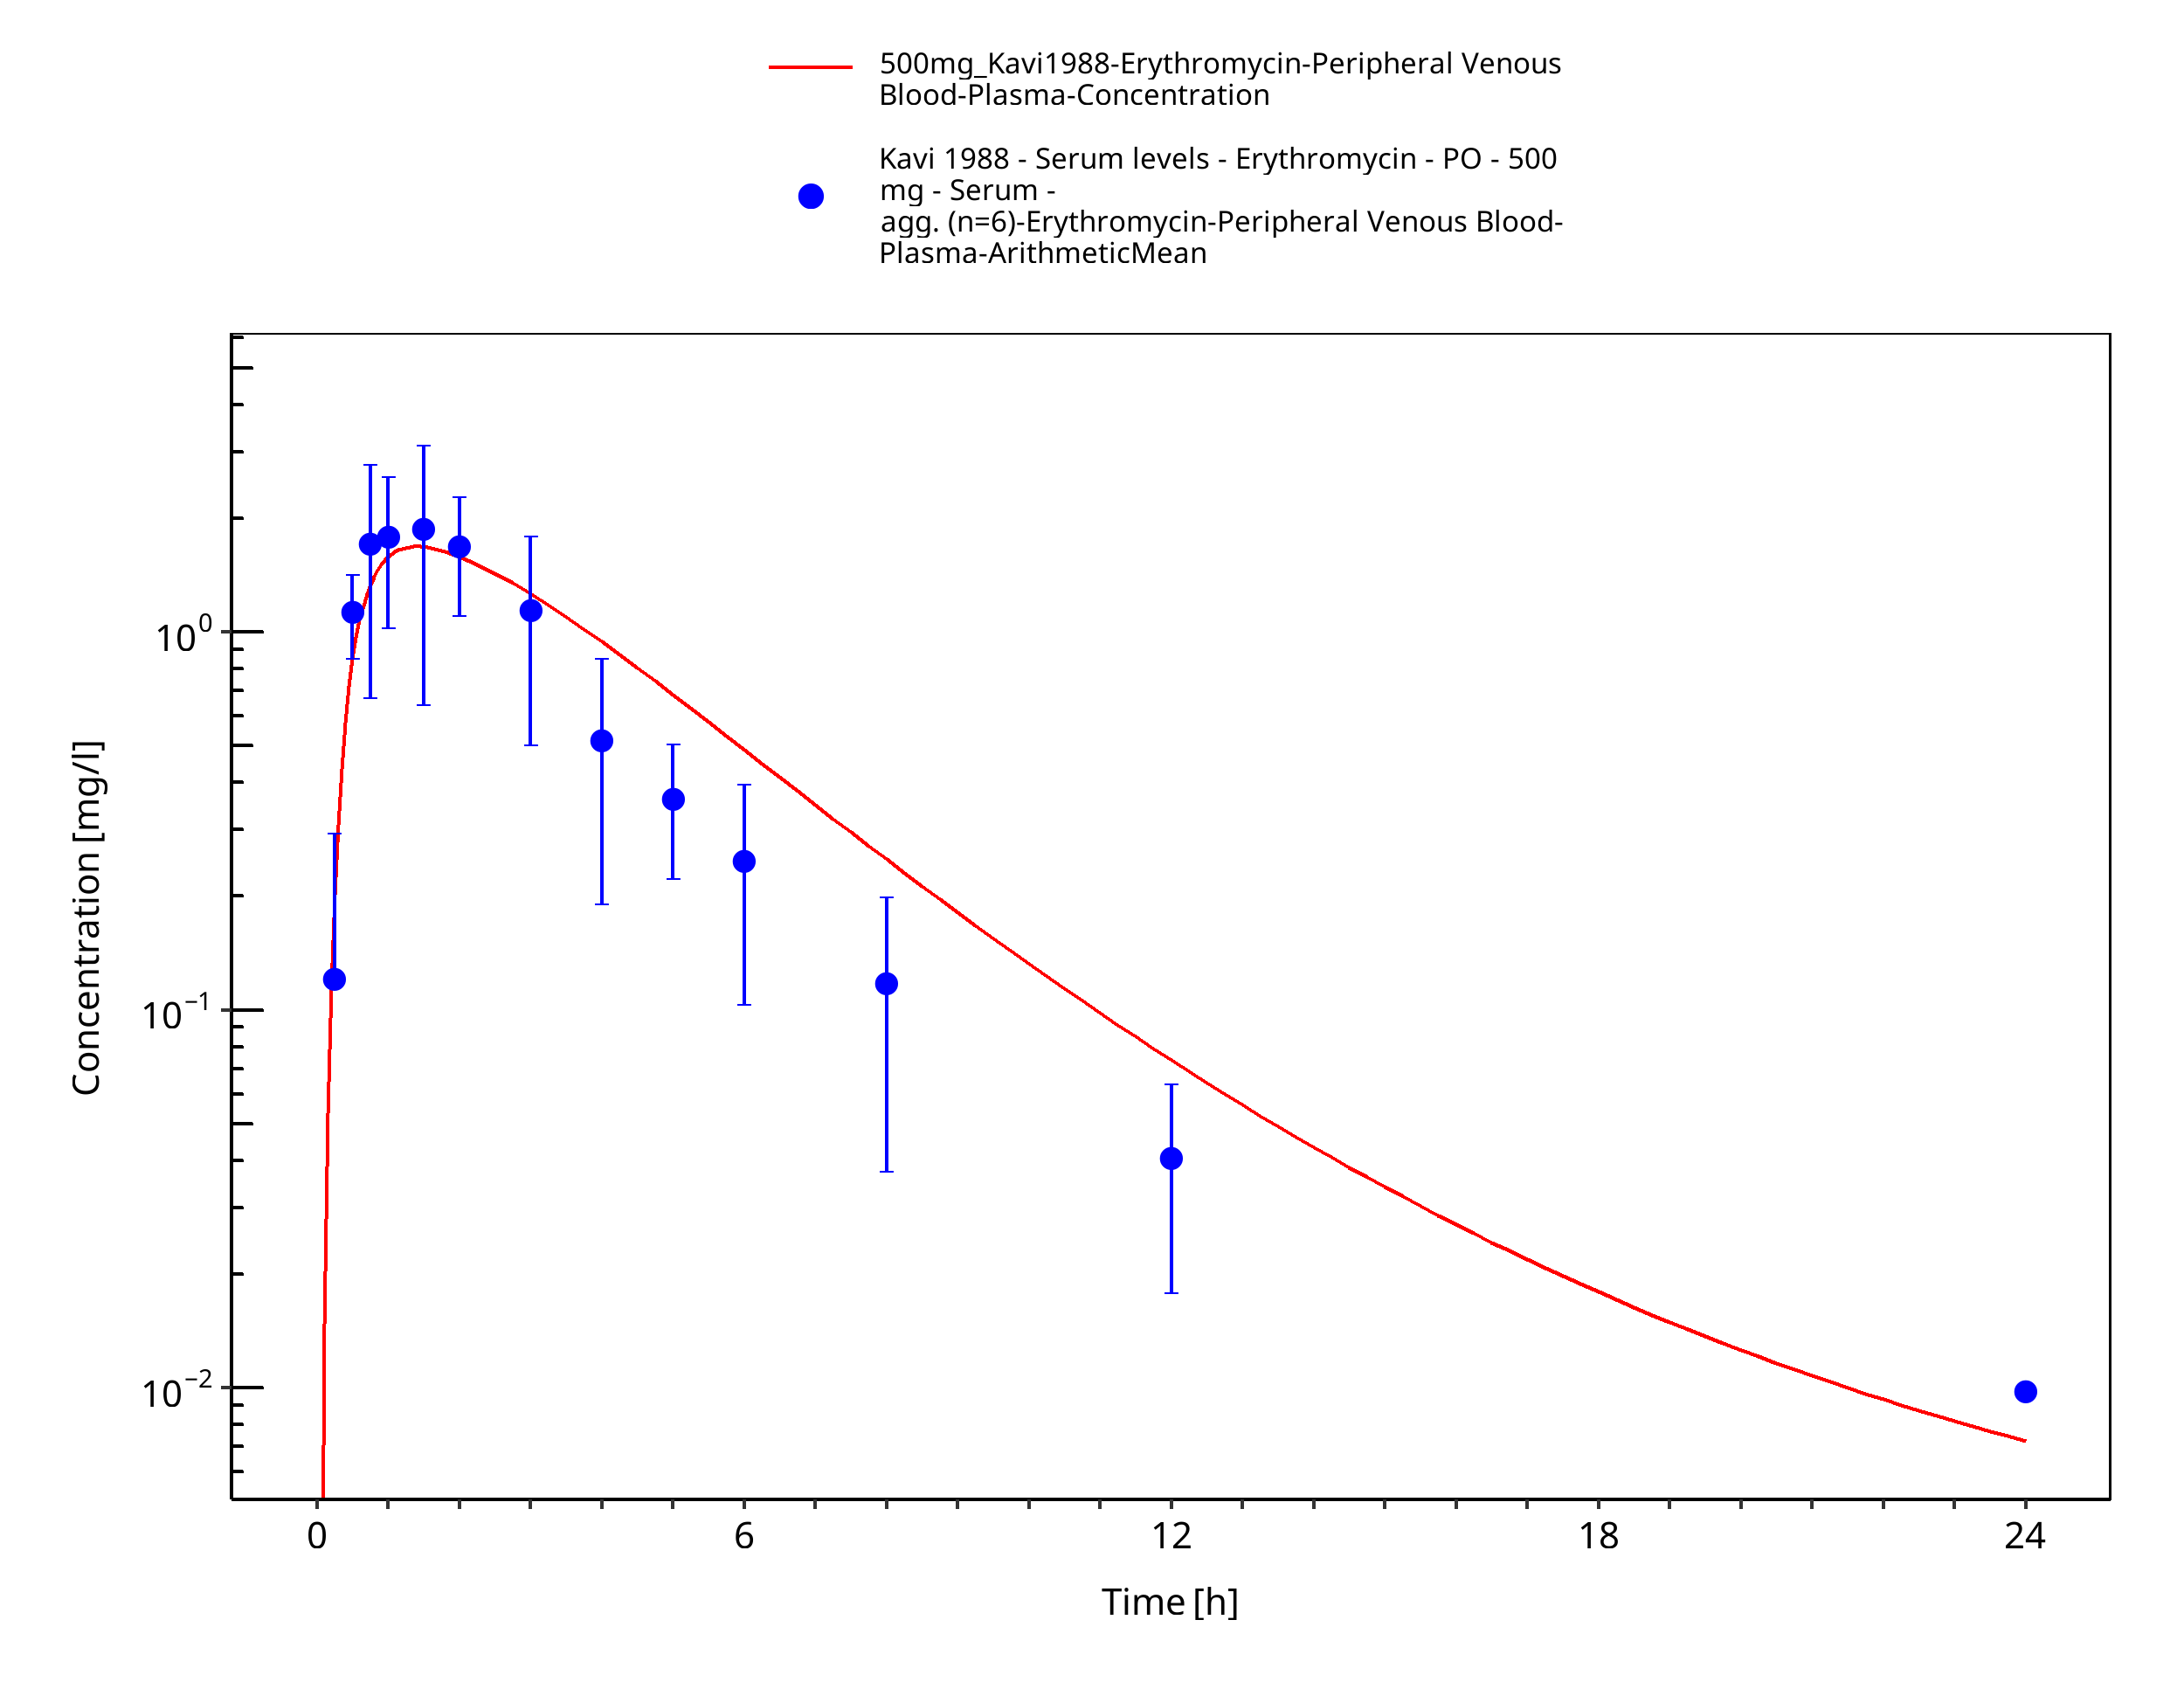
Figure 3-72: Time Profile Analysis
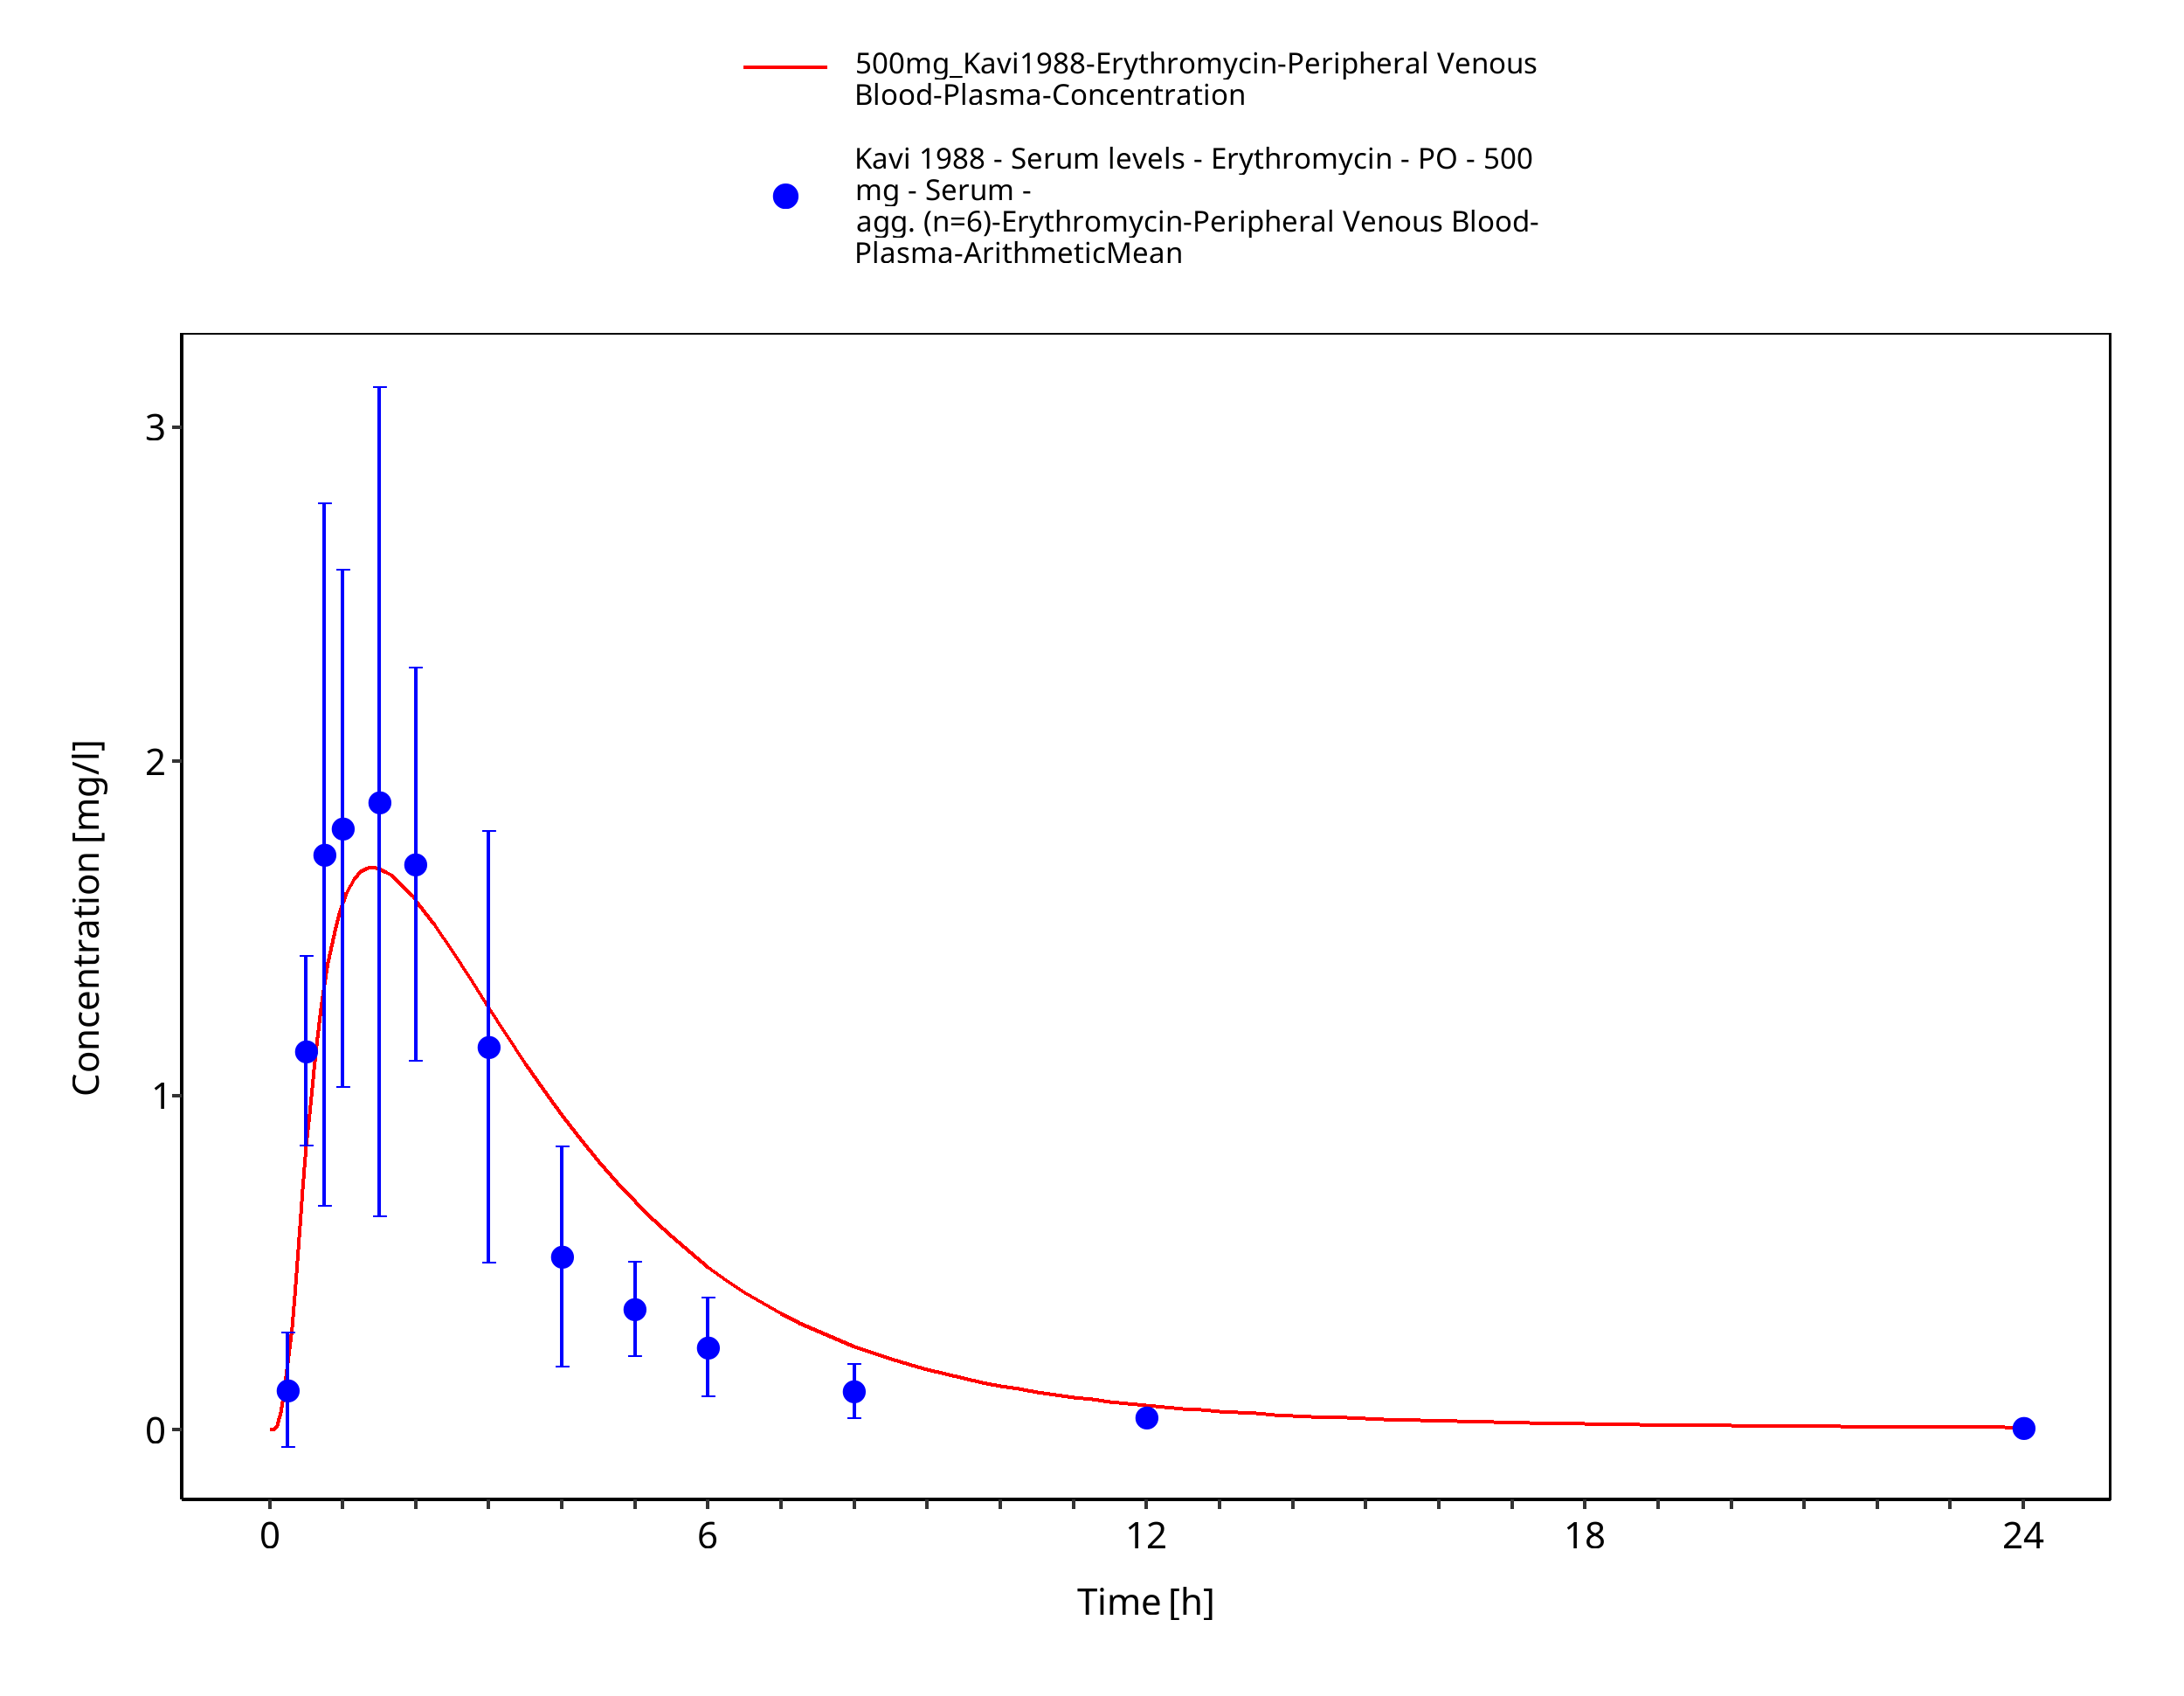
Figure 3-73: Time Profile Analysis 1
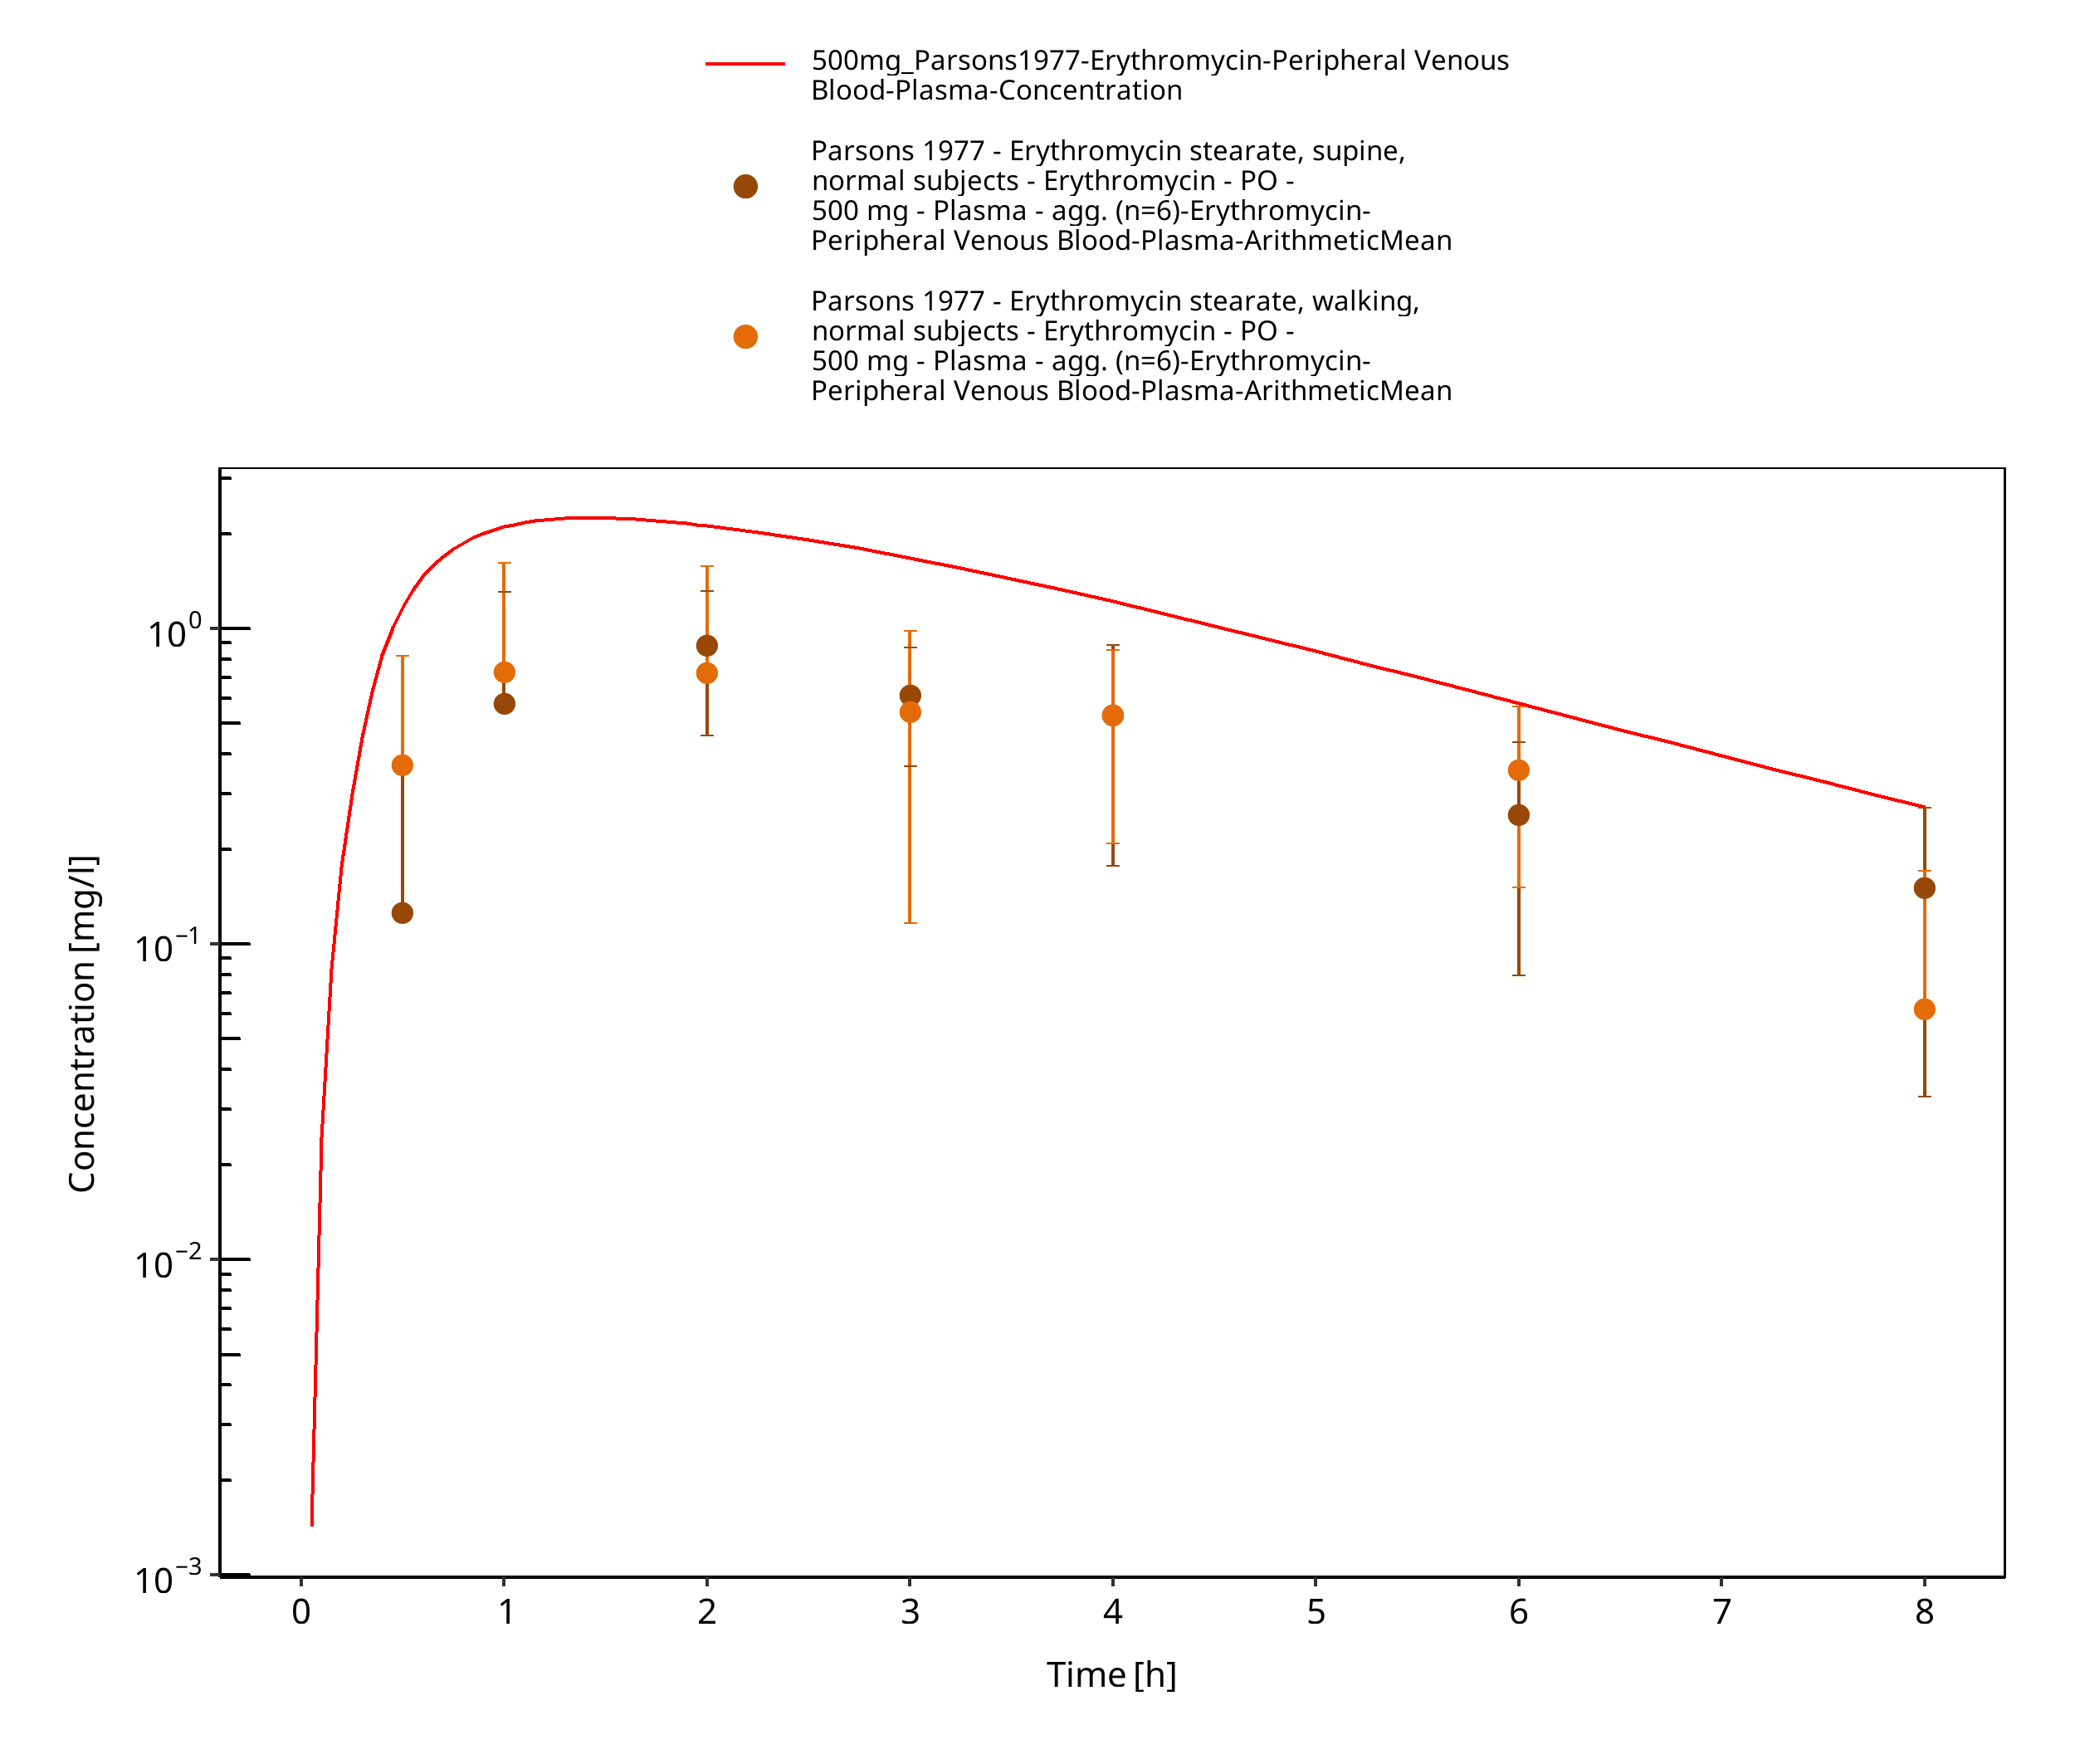
Figure 3-74: Time Profile Analysis
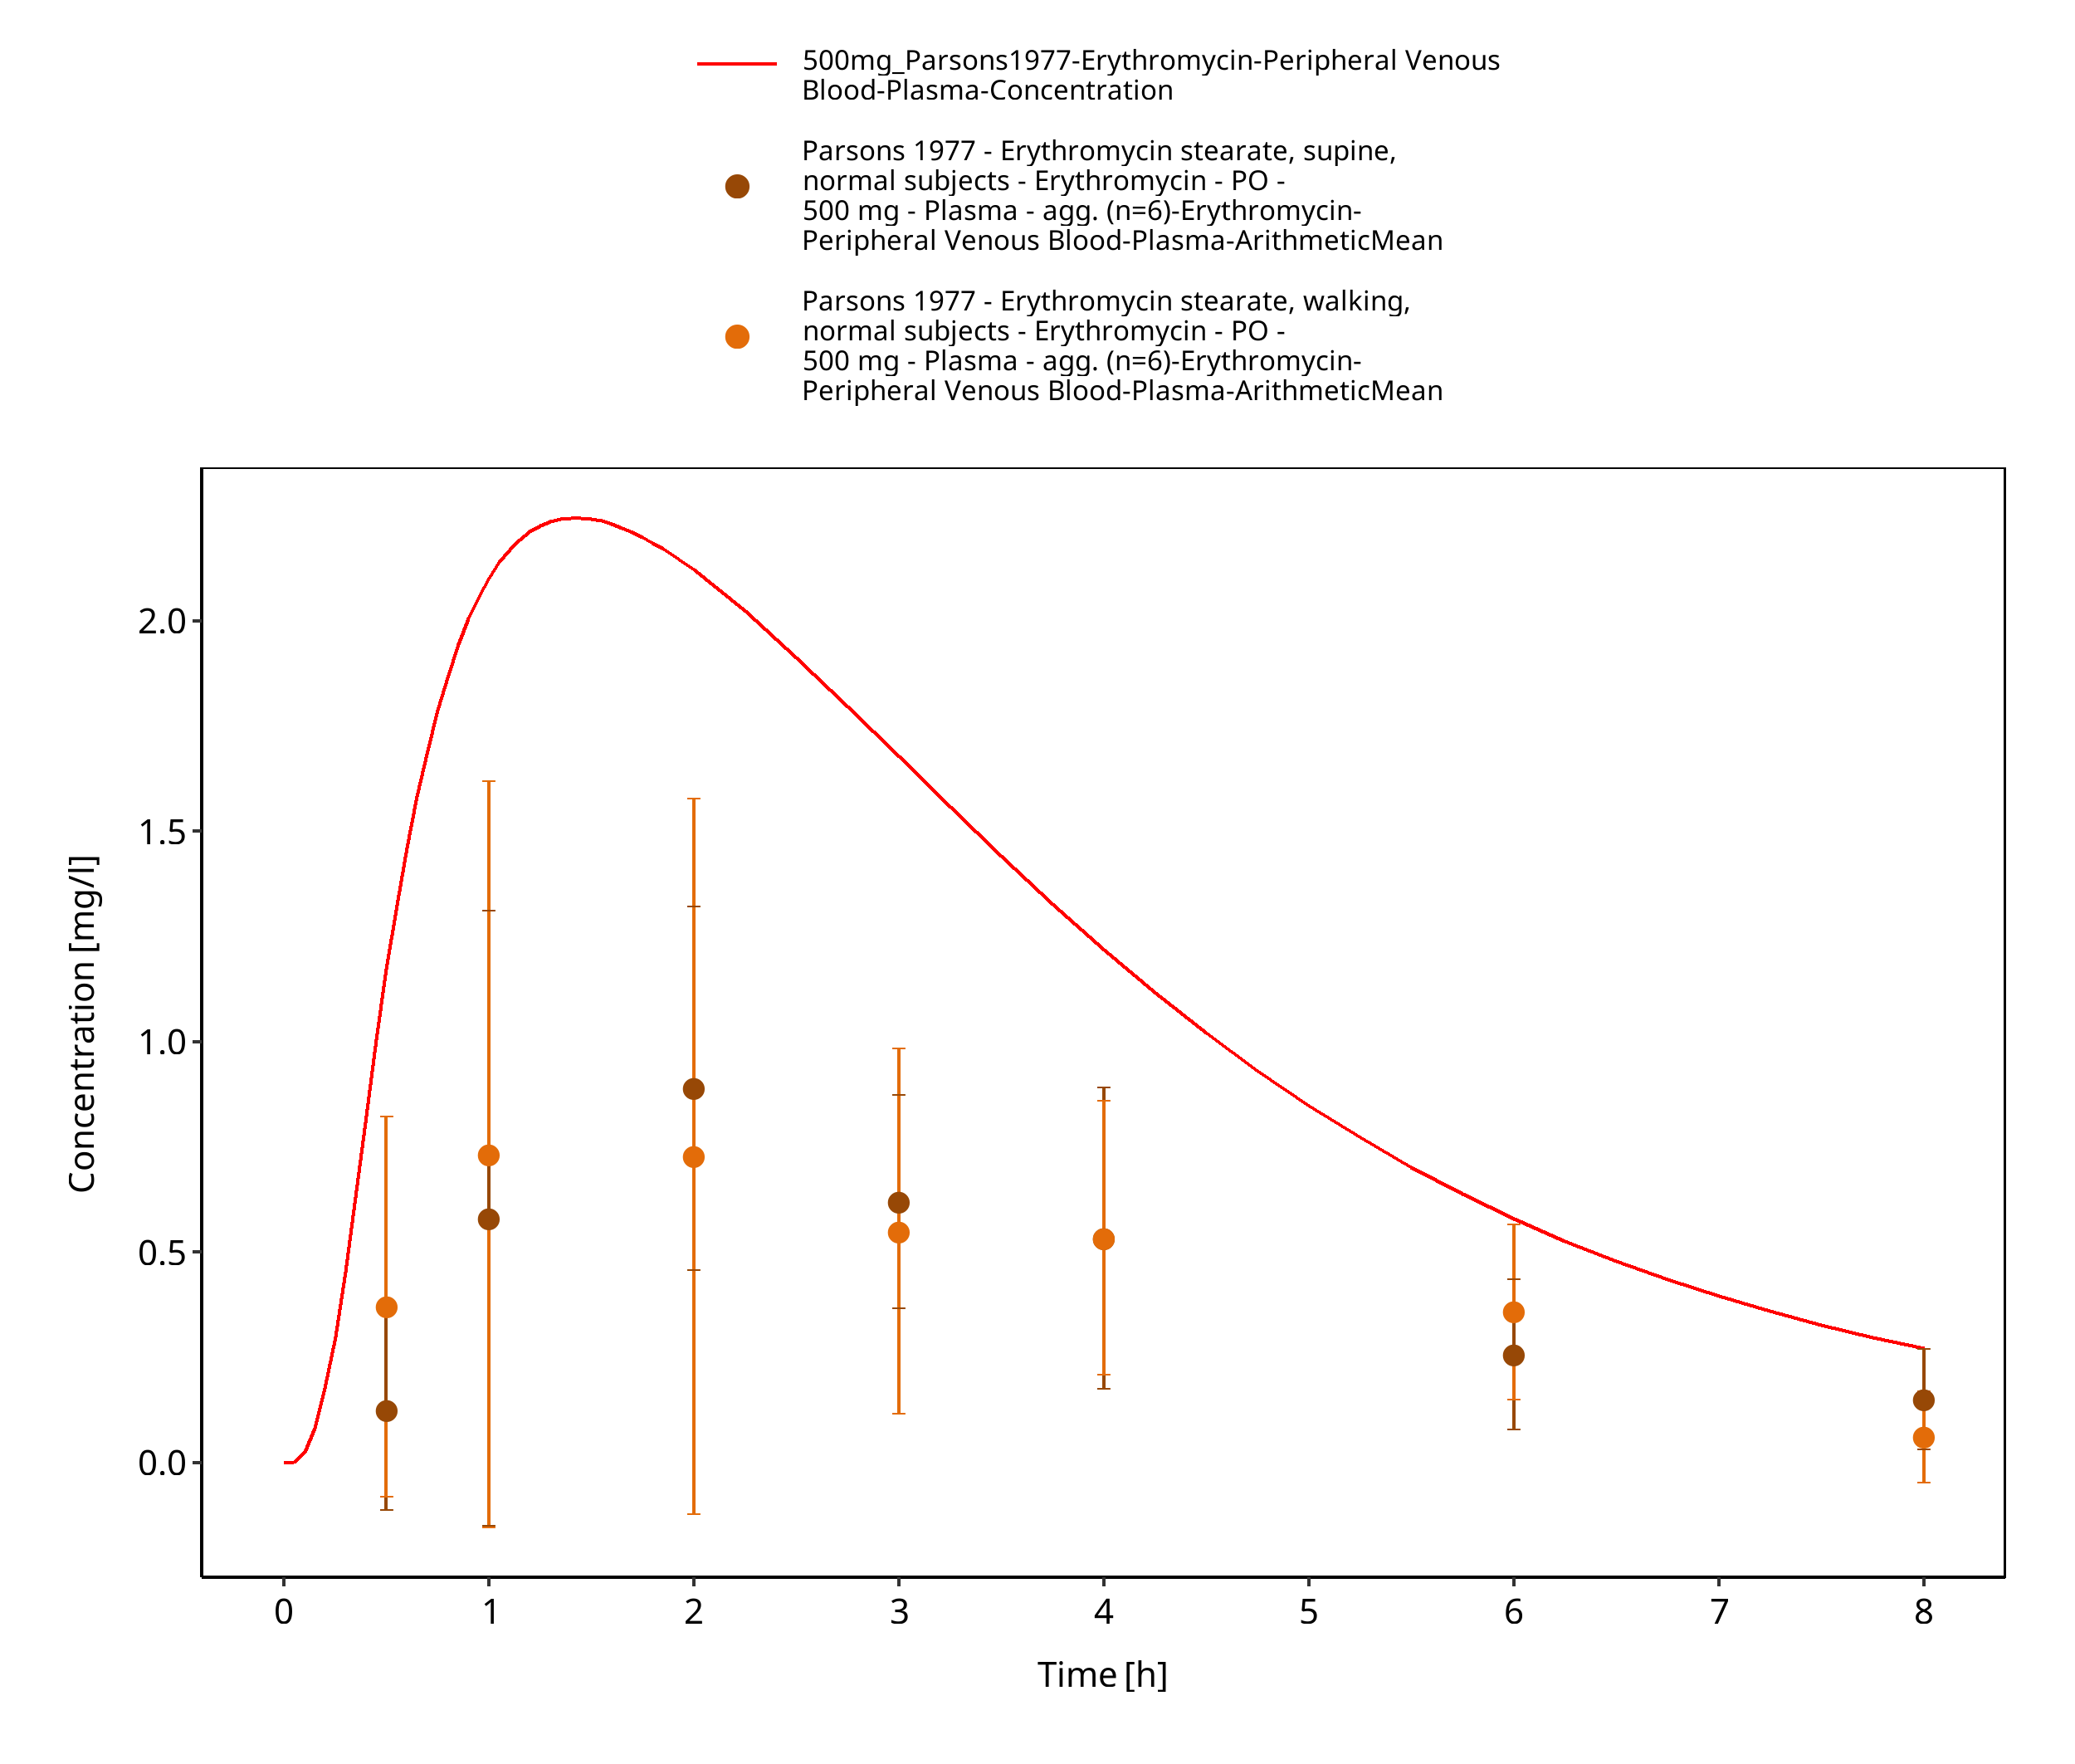
Figure 3-75: Time Profile Analysis 1
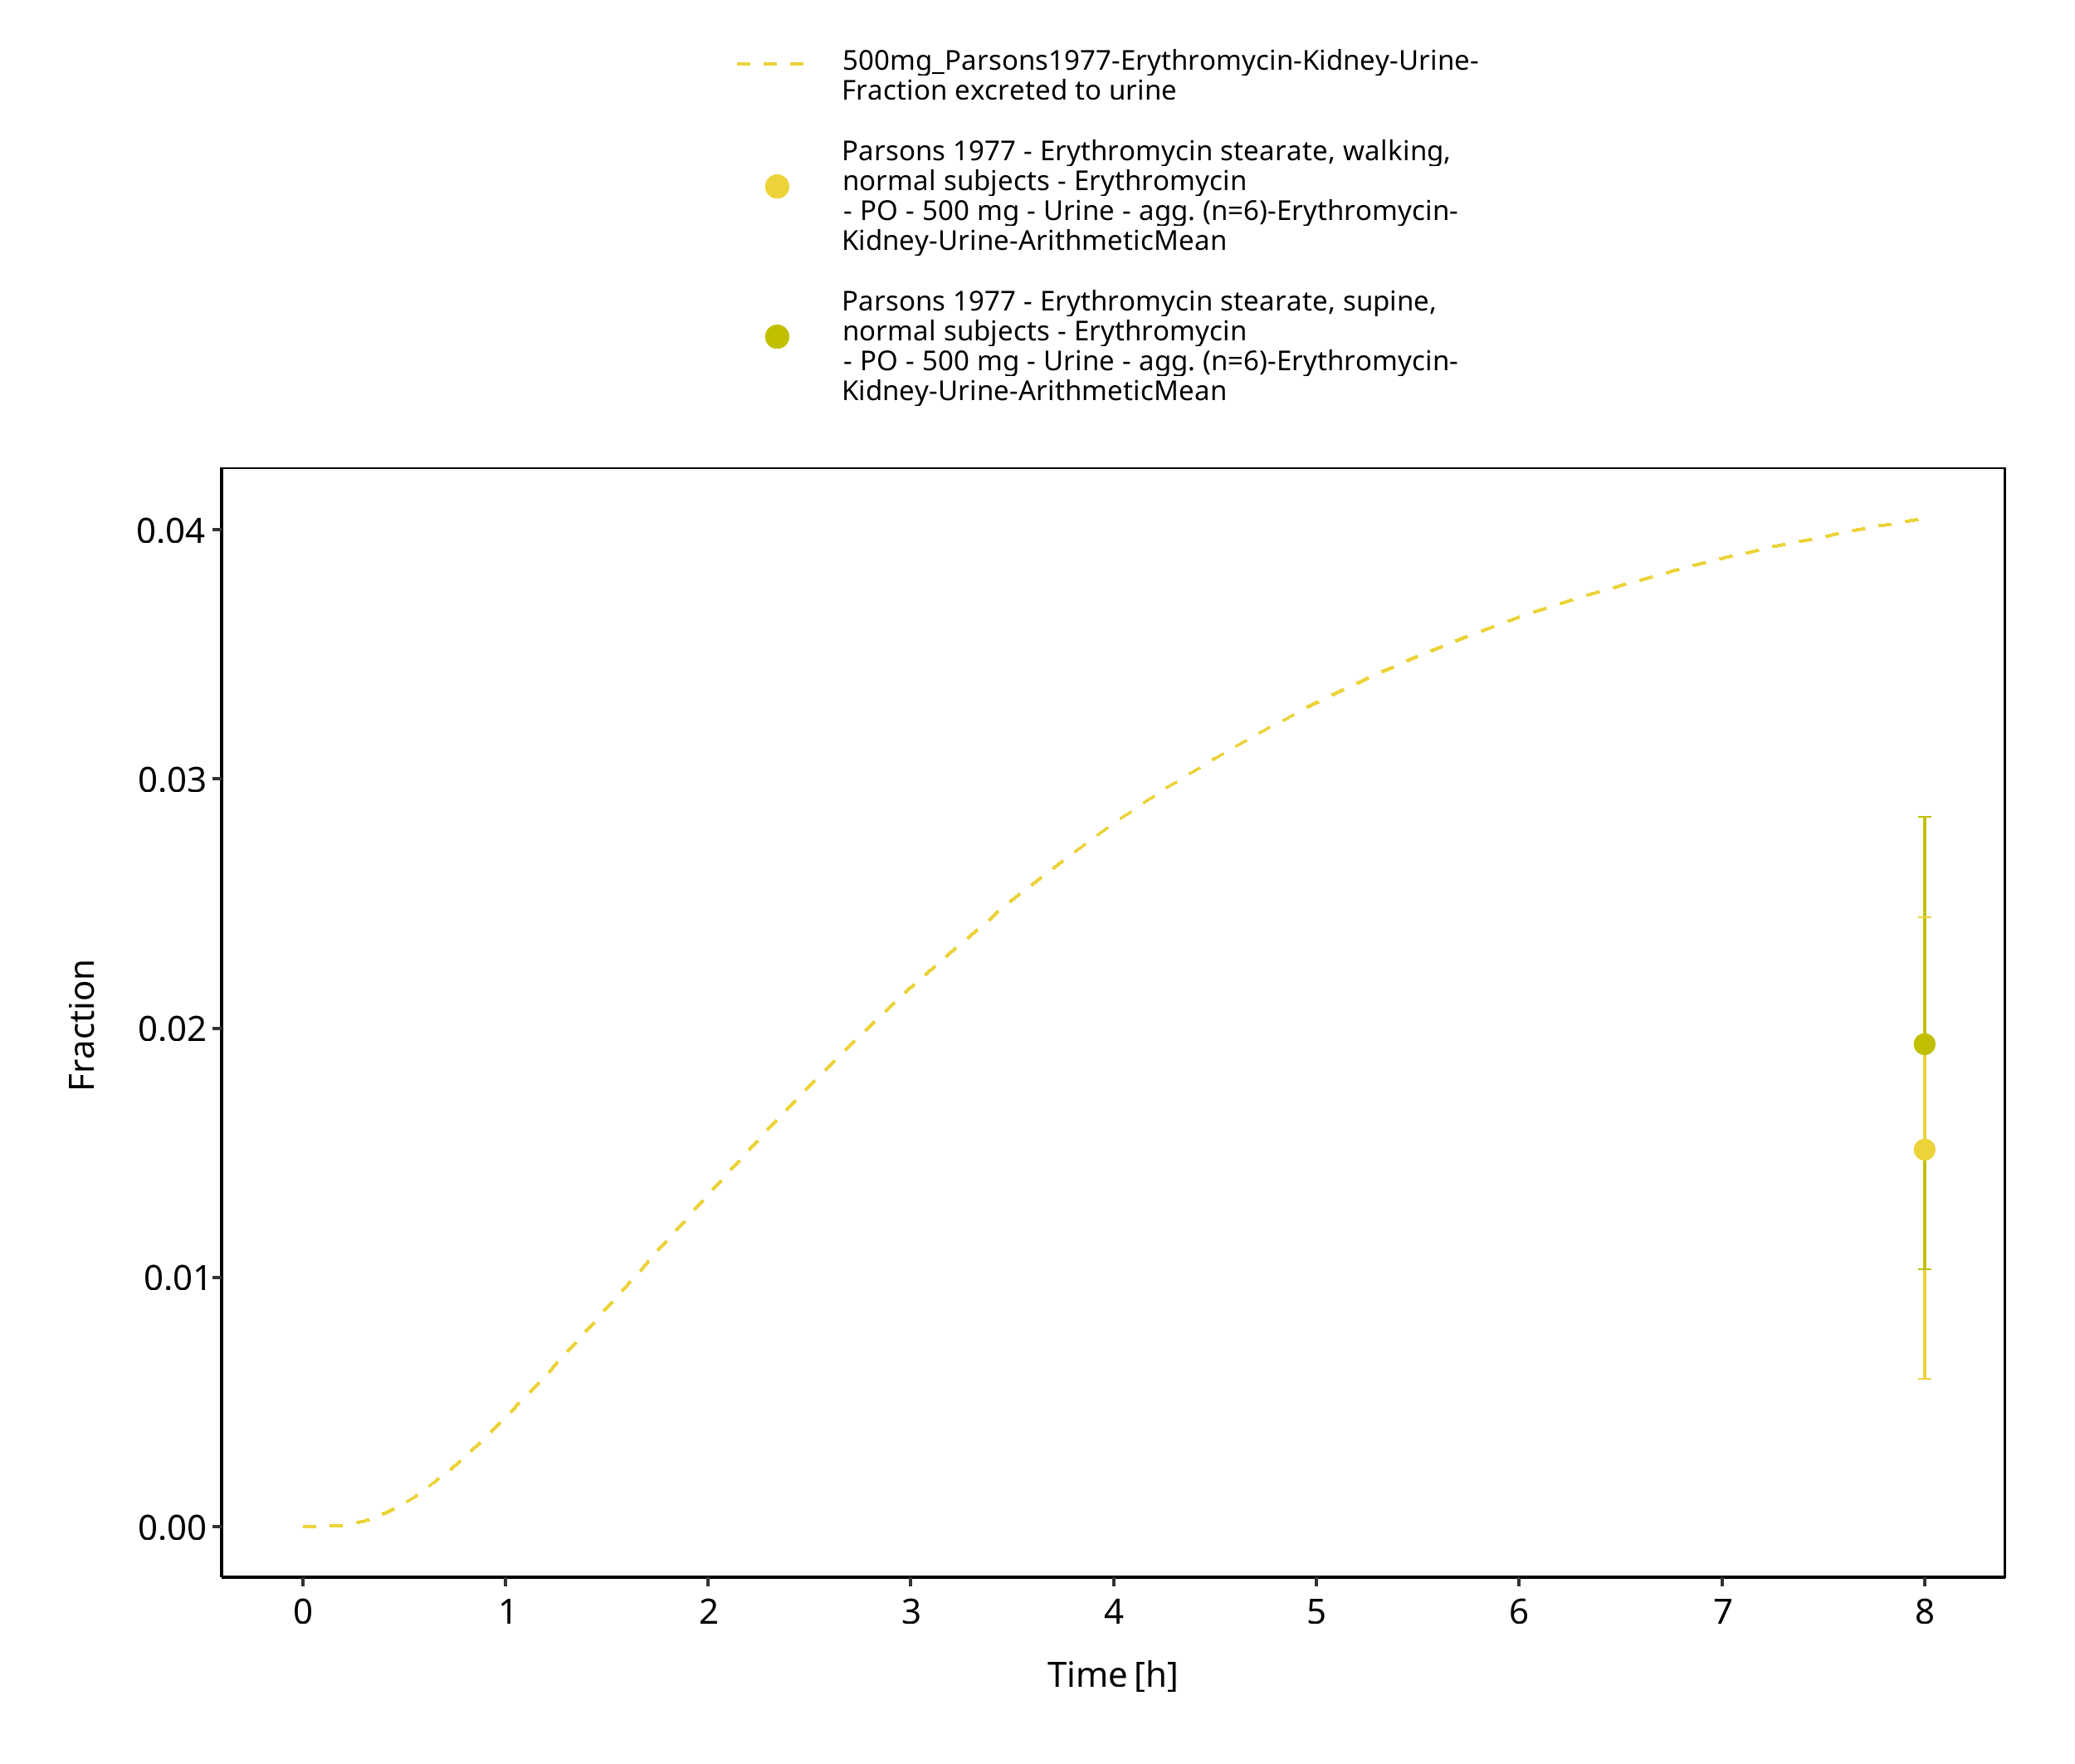
Figure 3-76: Time Profile Analysis 2
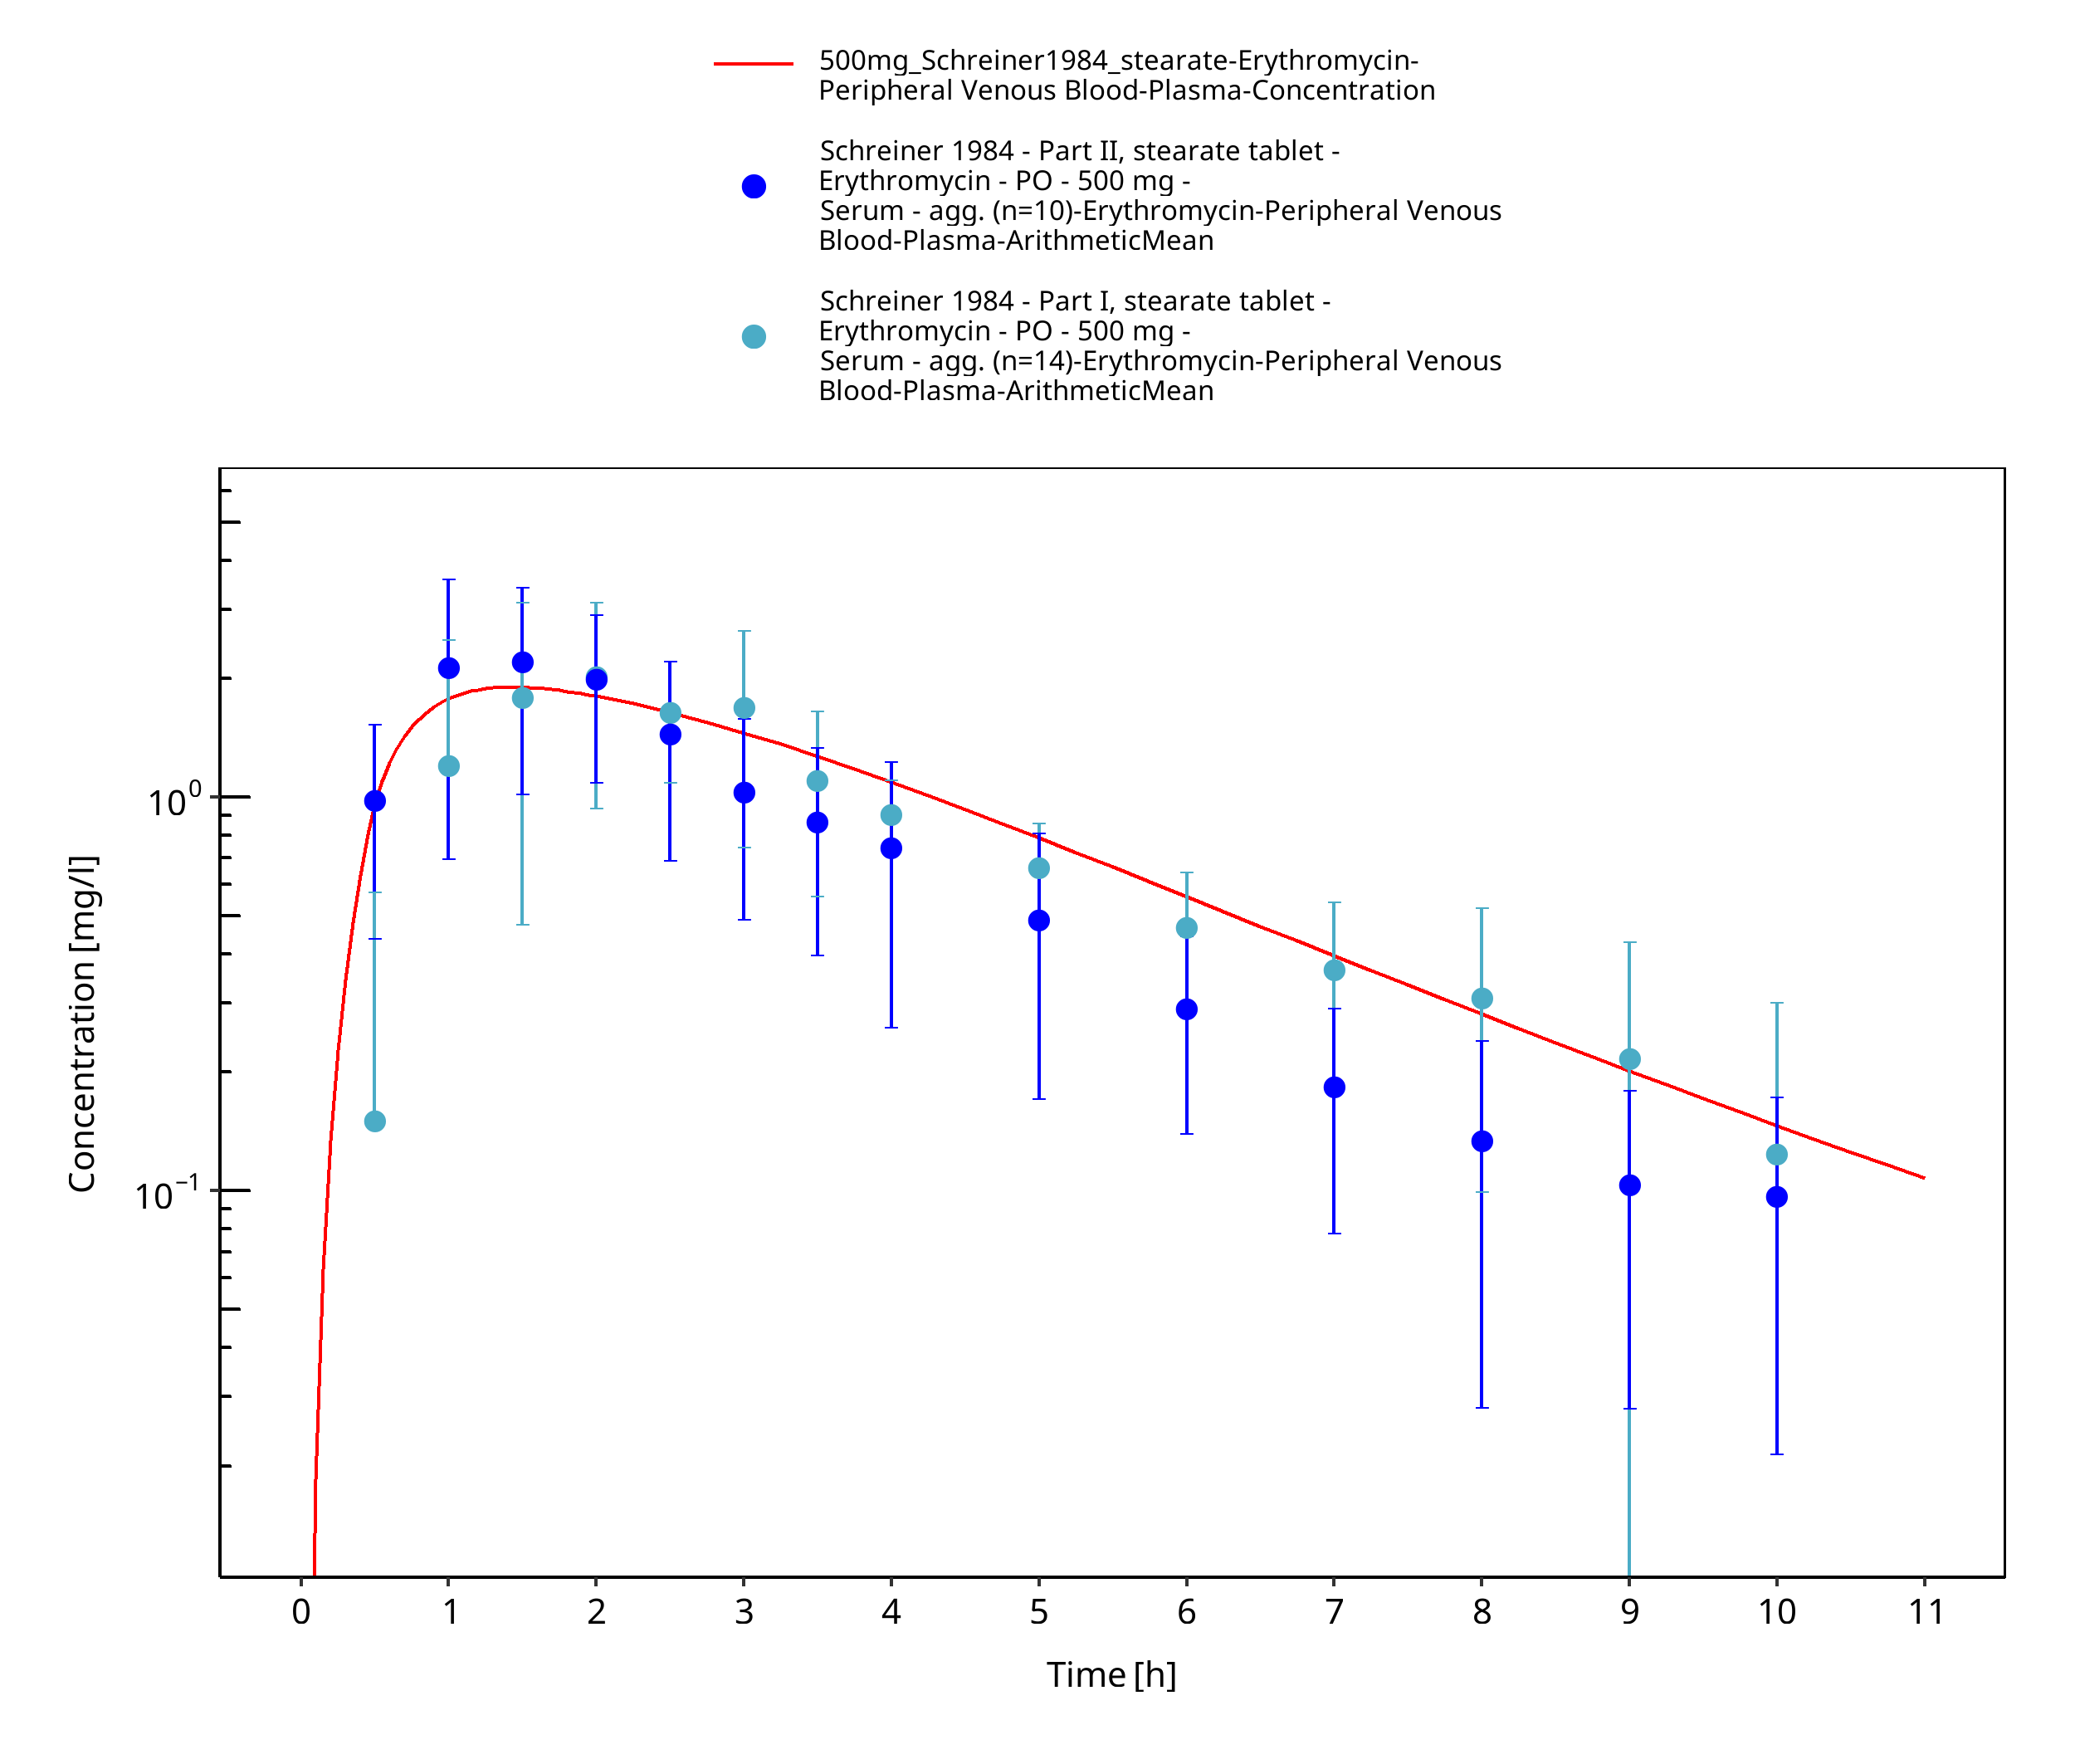
Figure 3-77: Time Profile Analysis
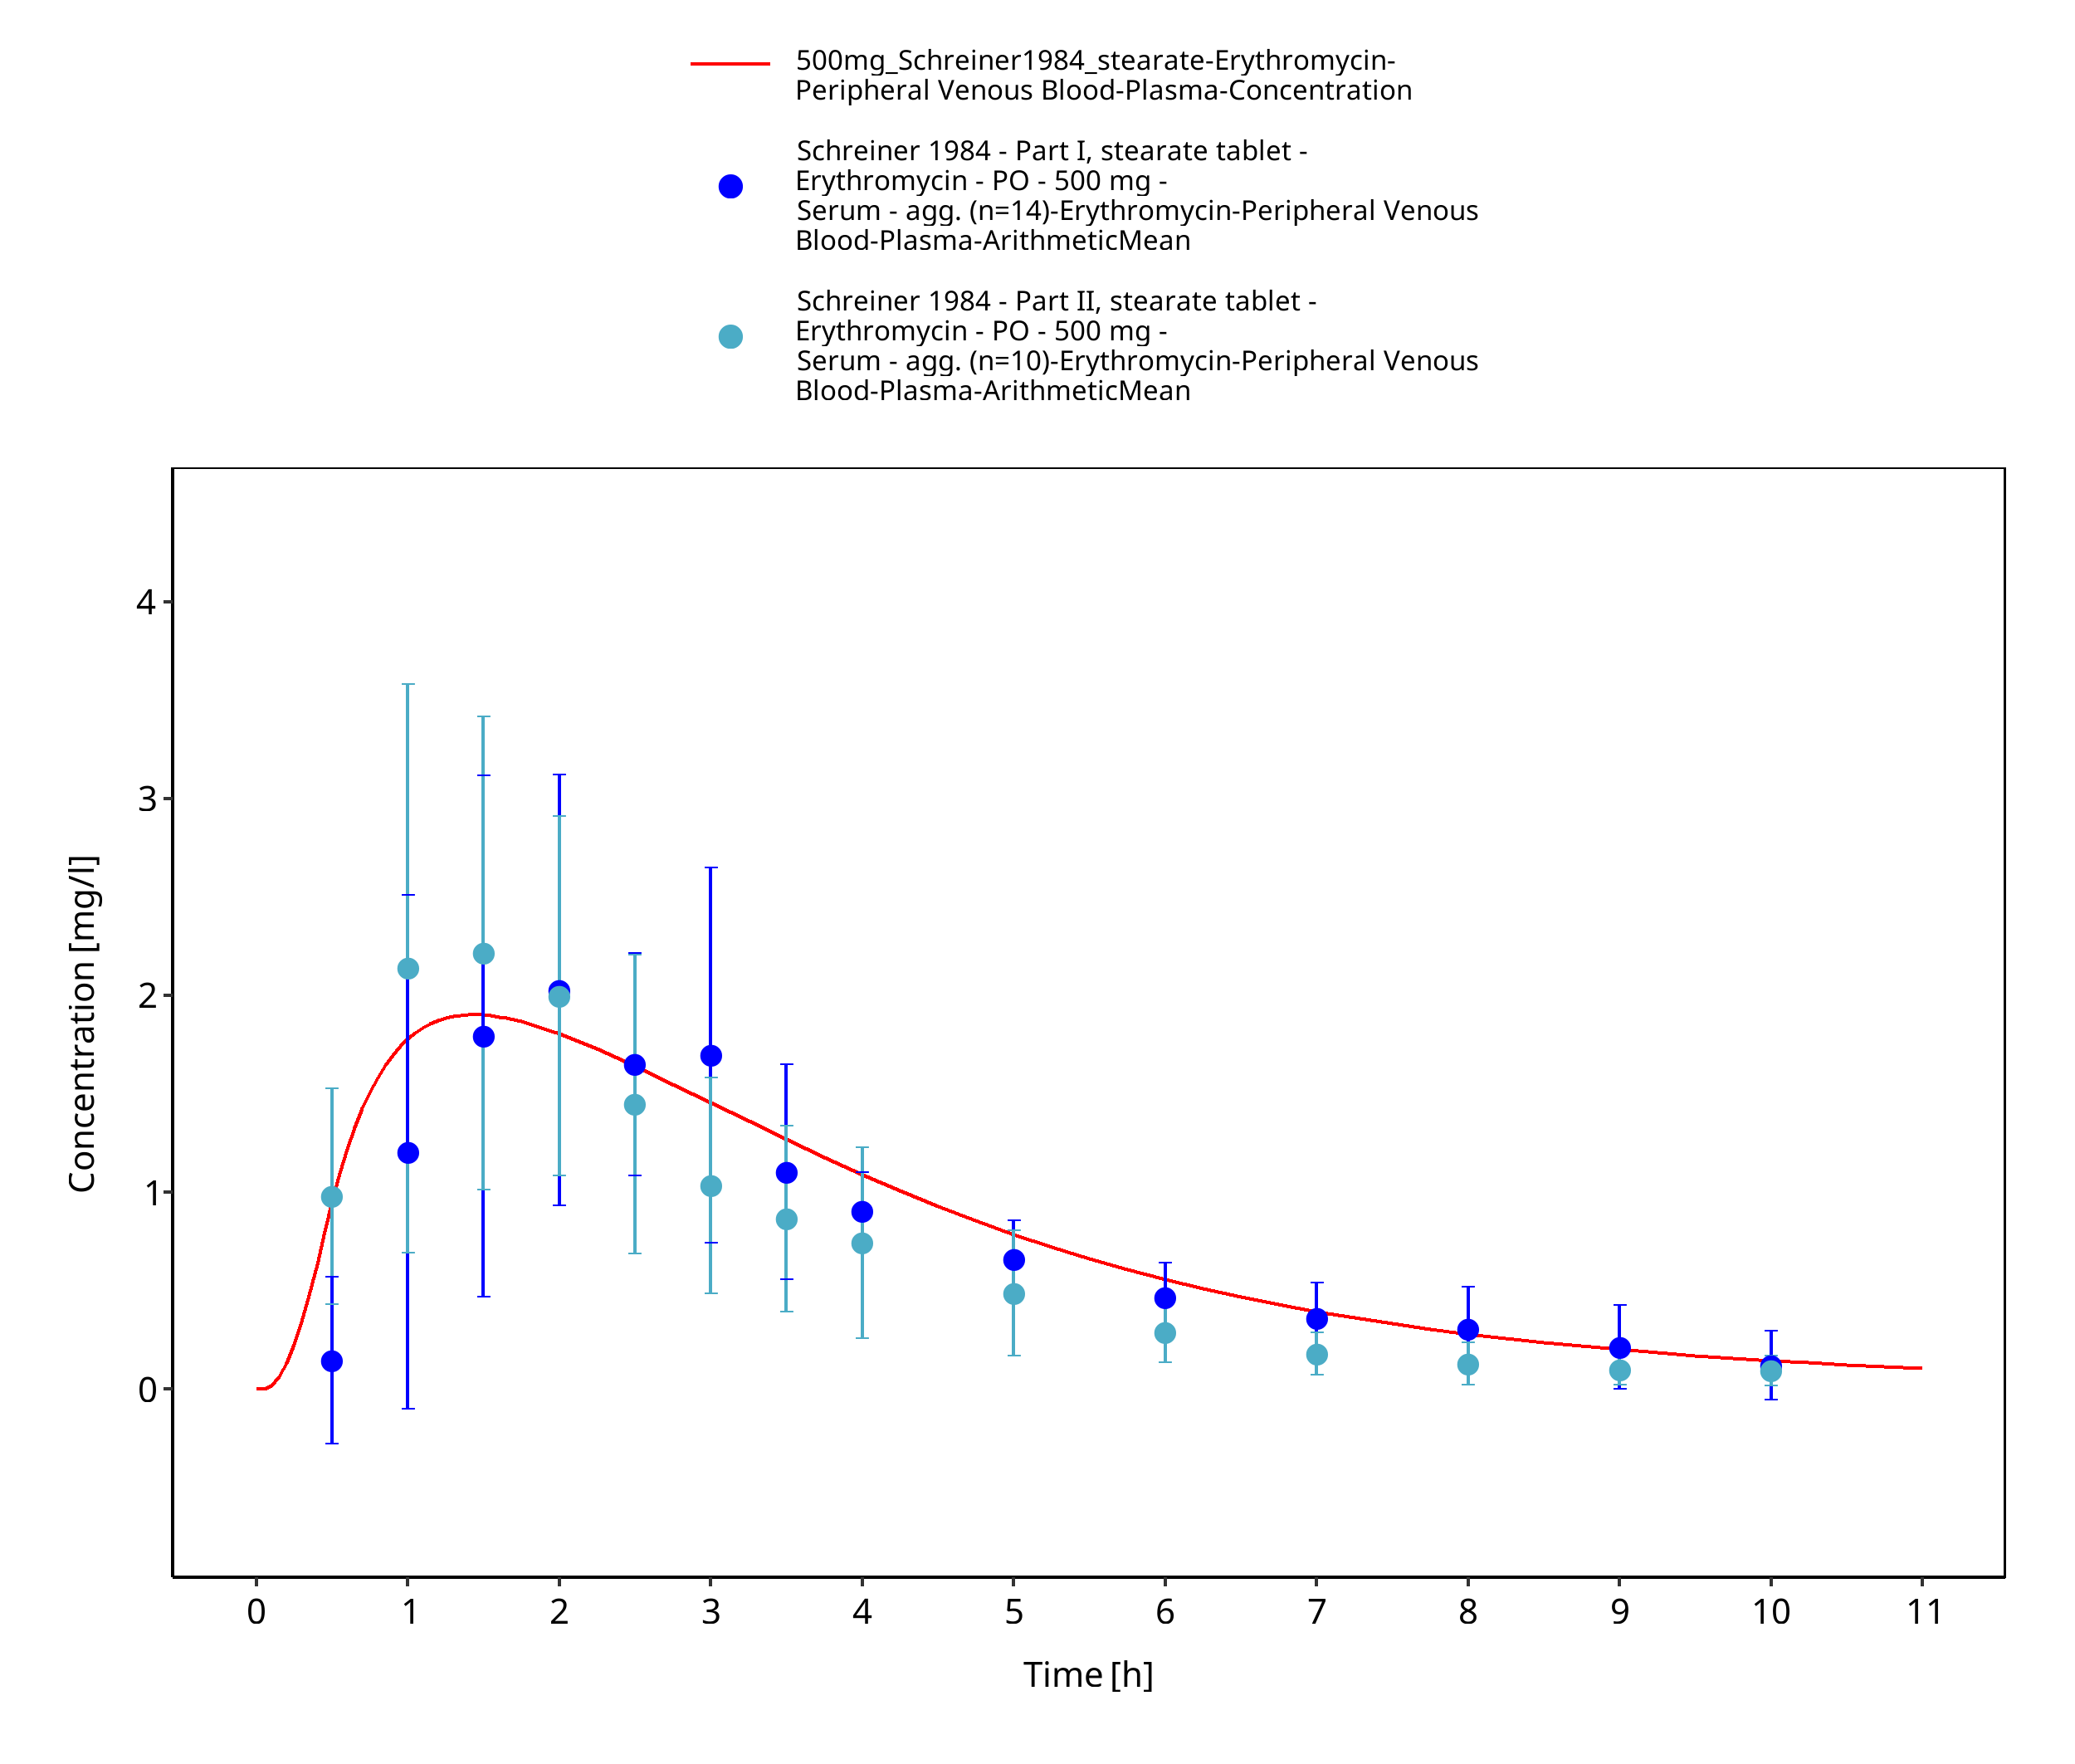
Figure 3-78: Time Profile Analysis 1
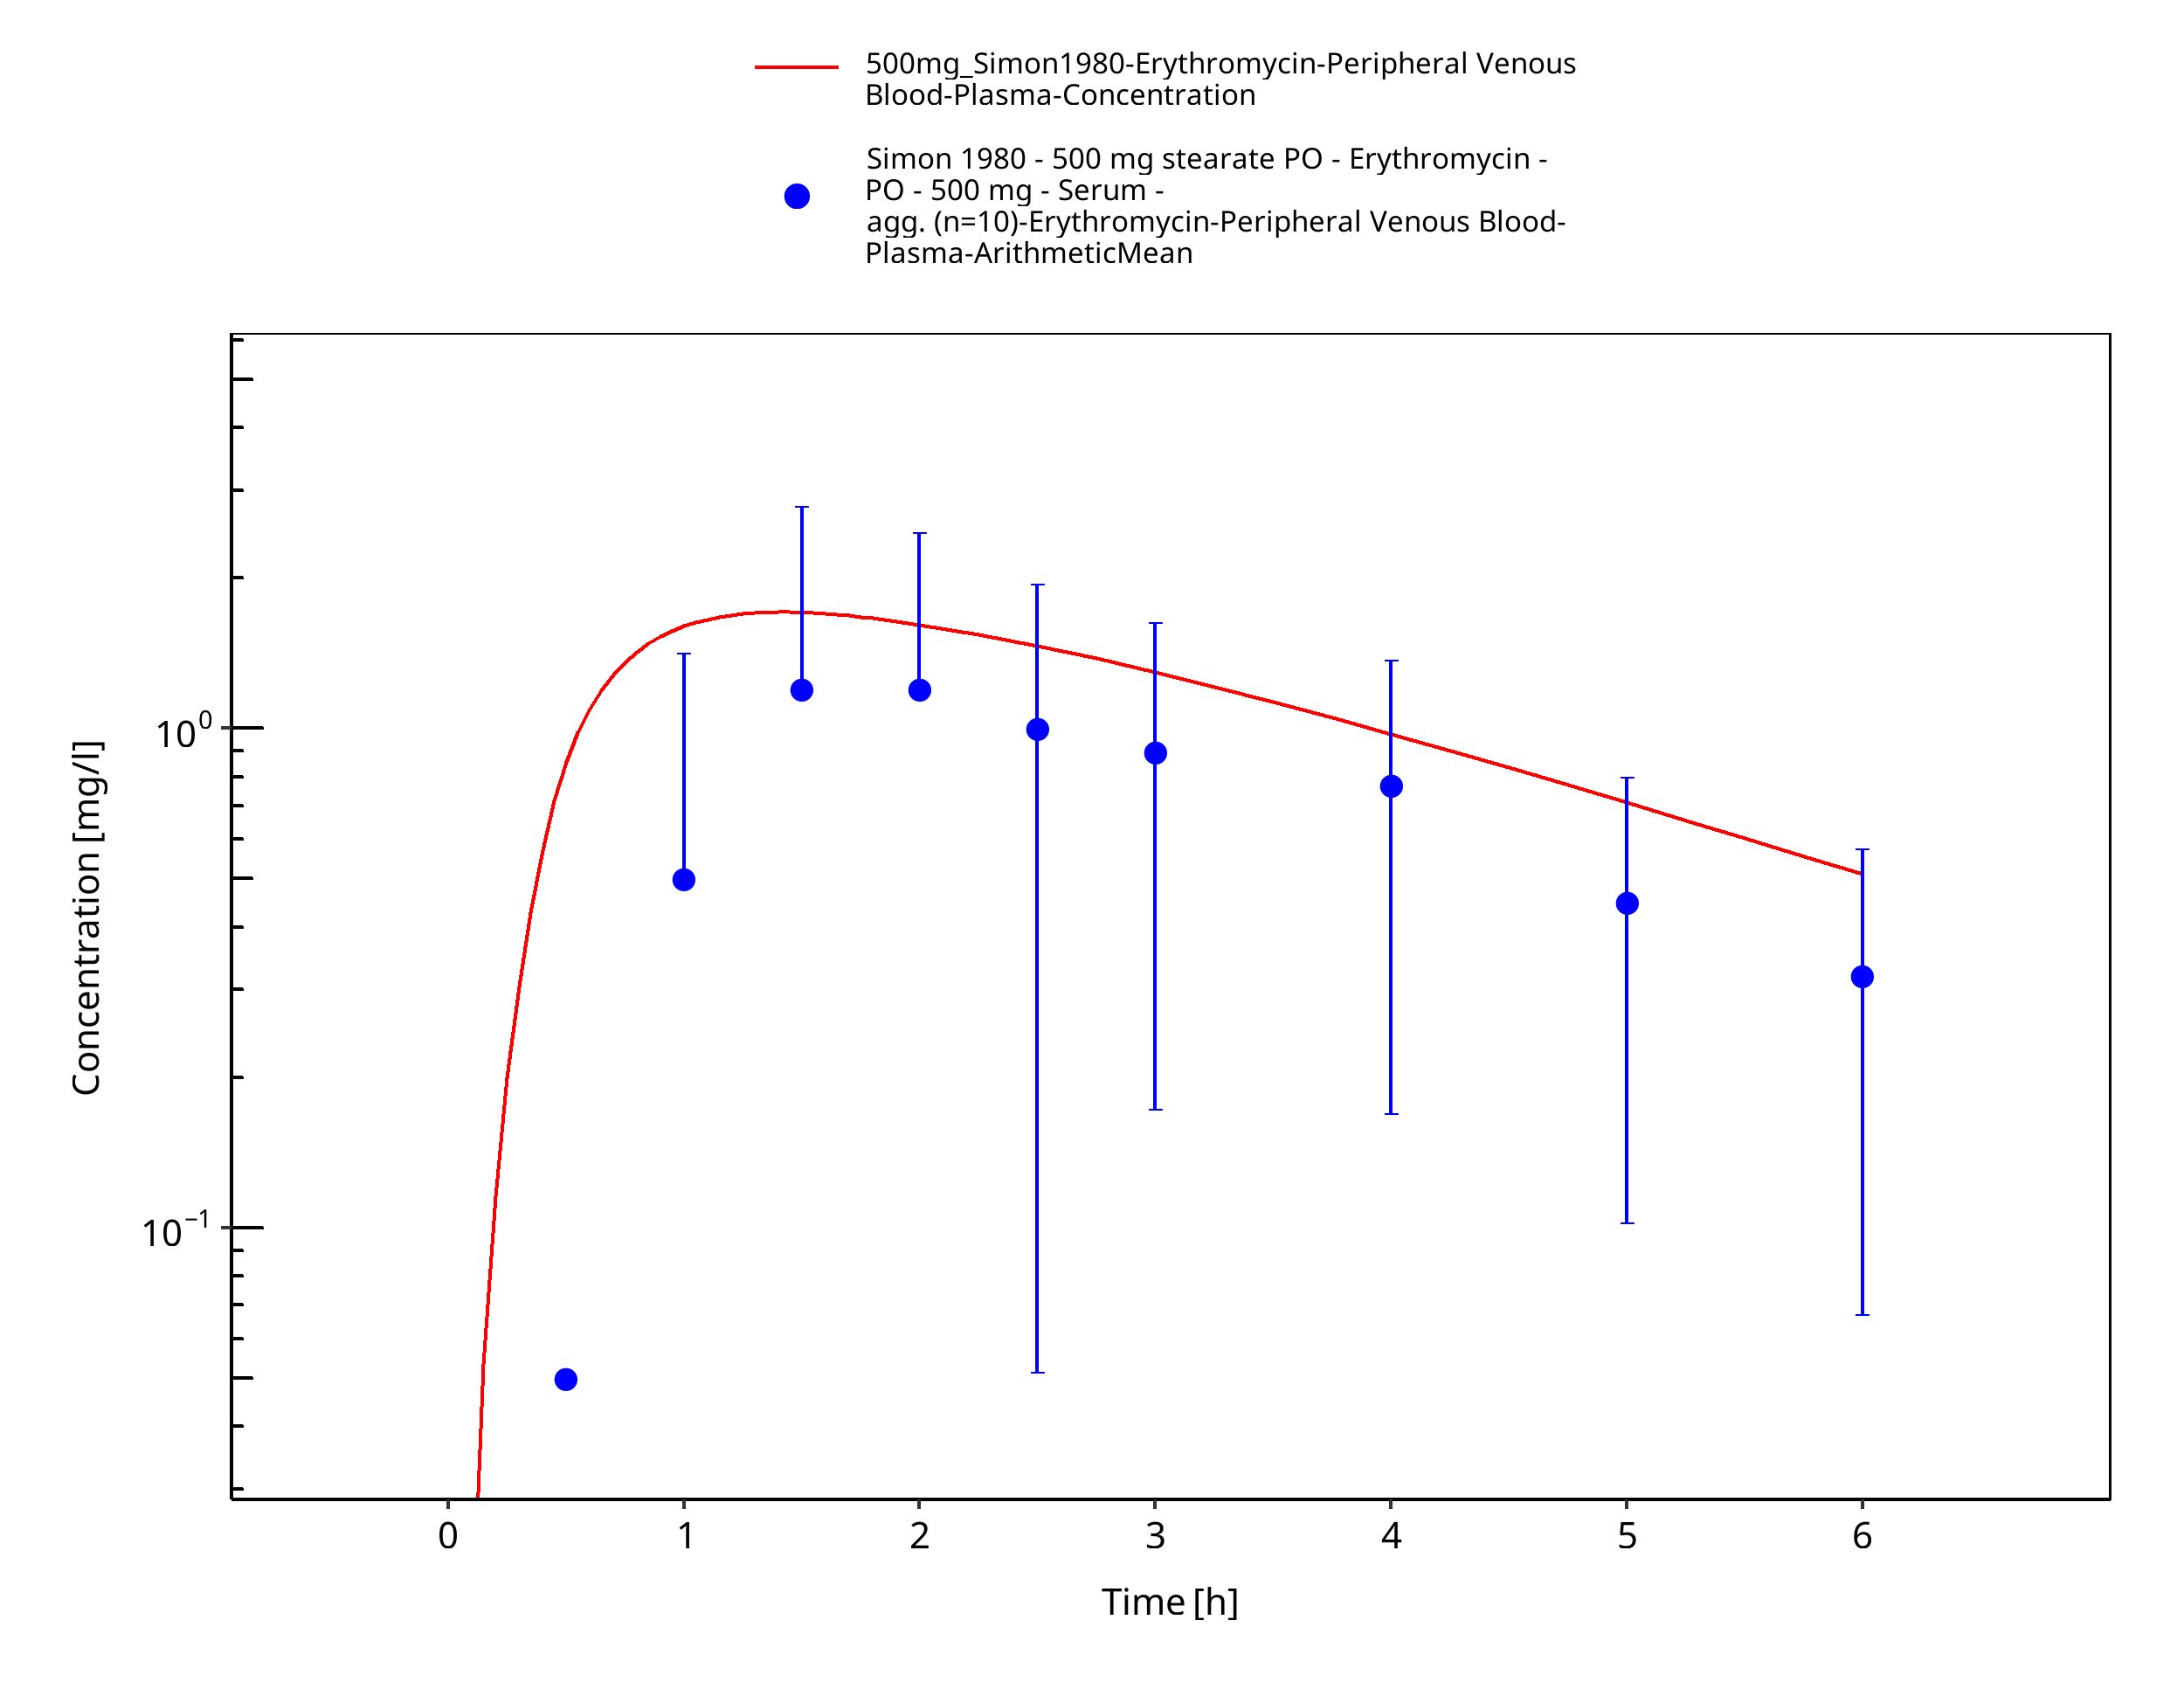
Figure 3-79: Time Profile Analysis
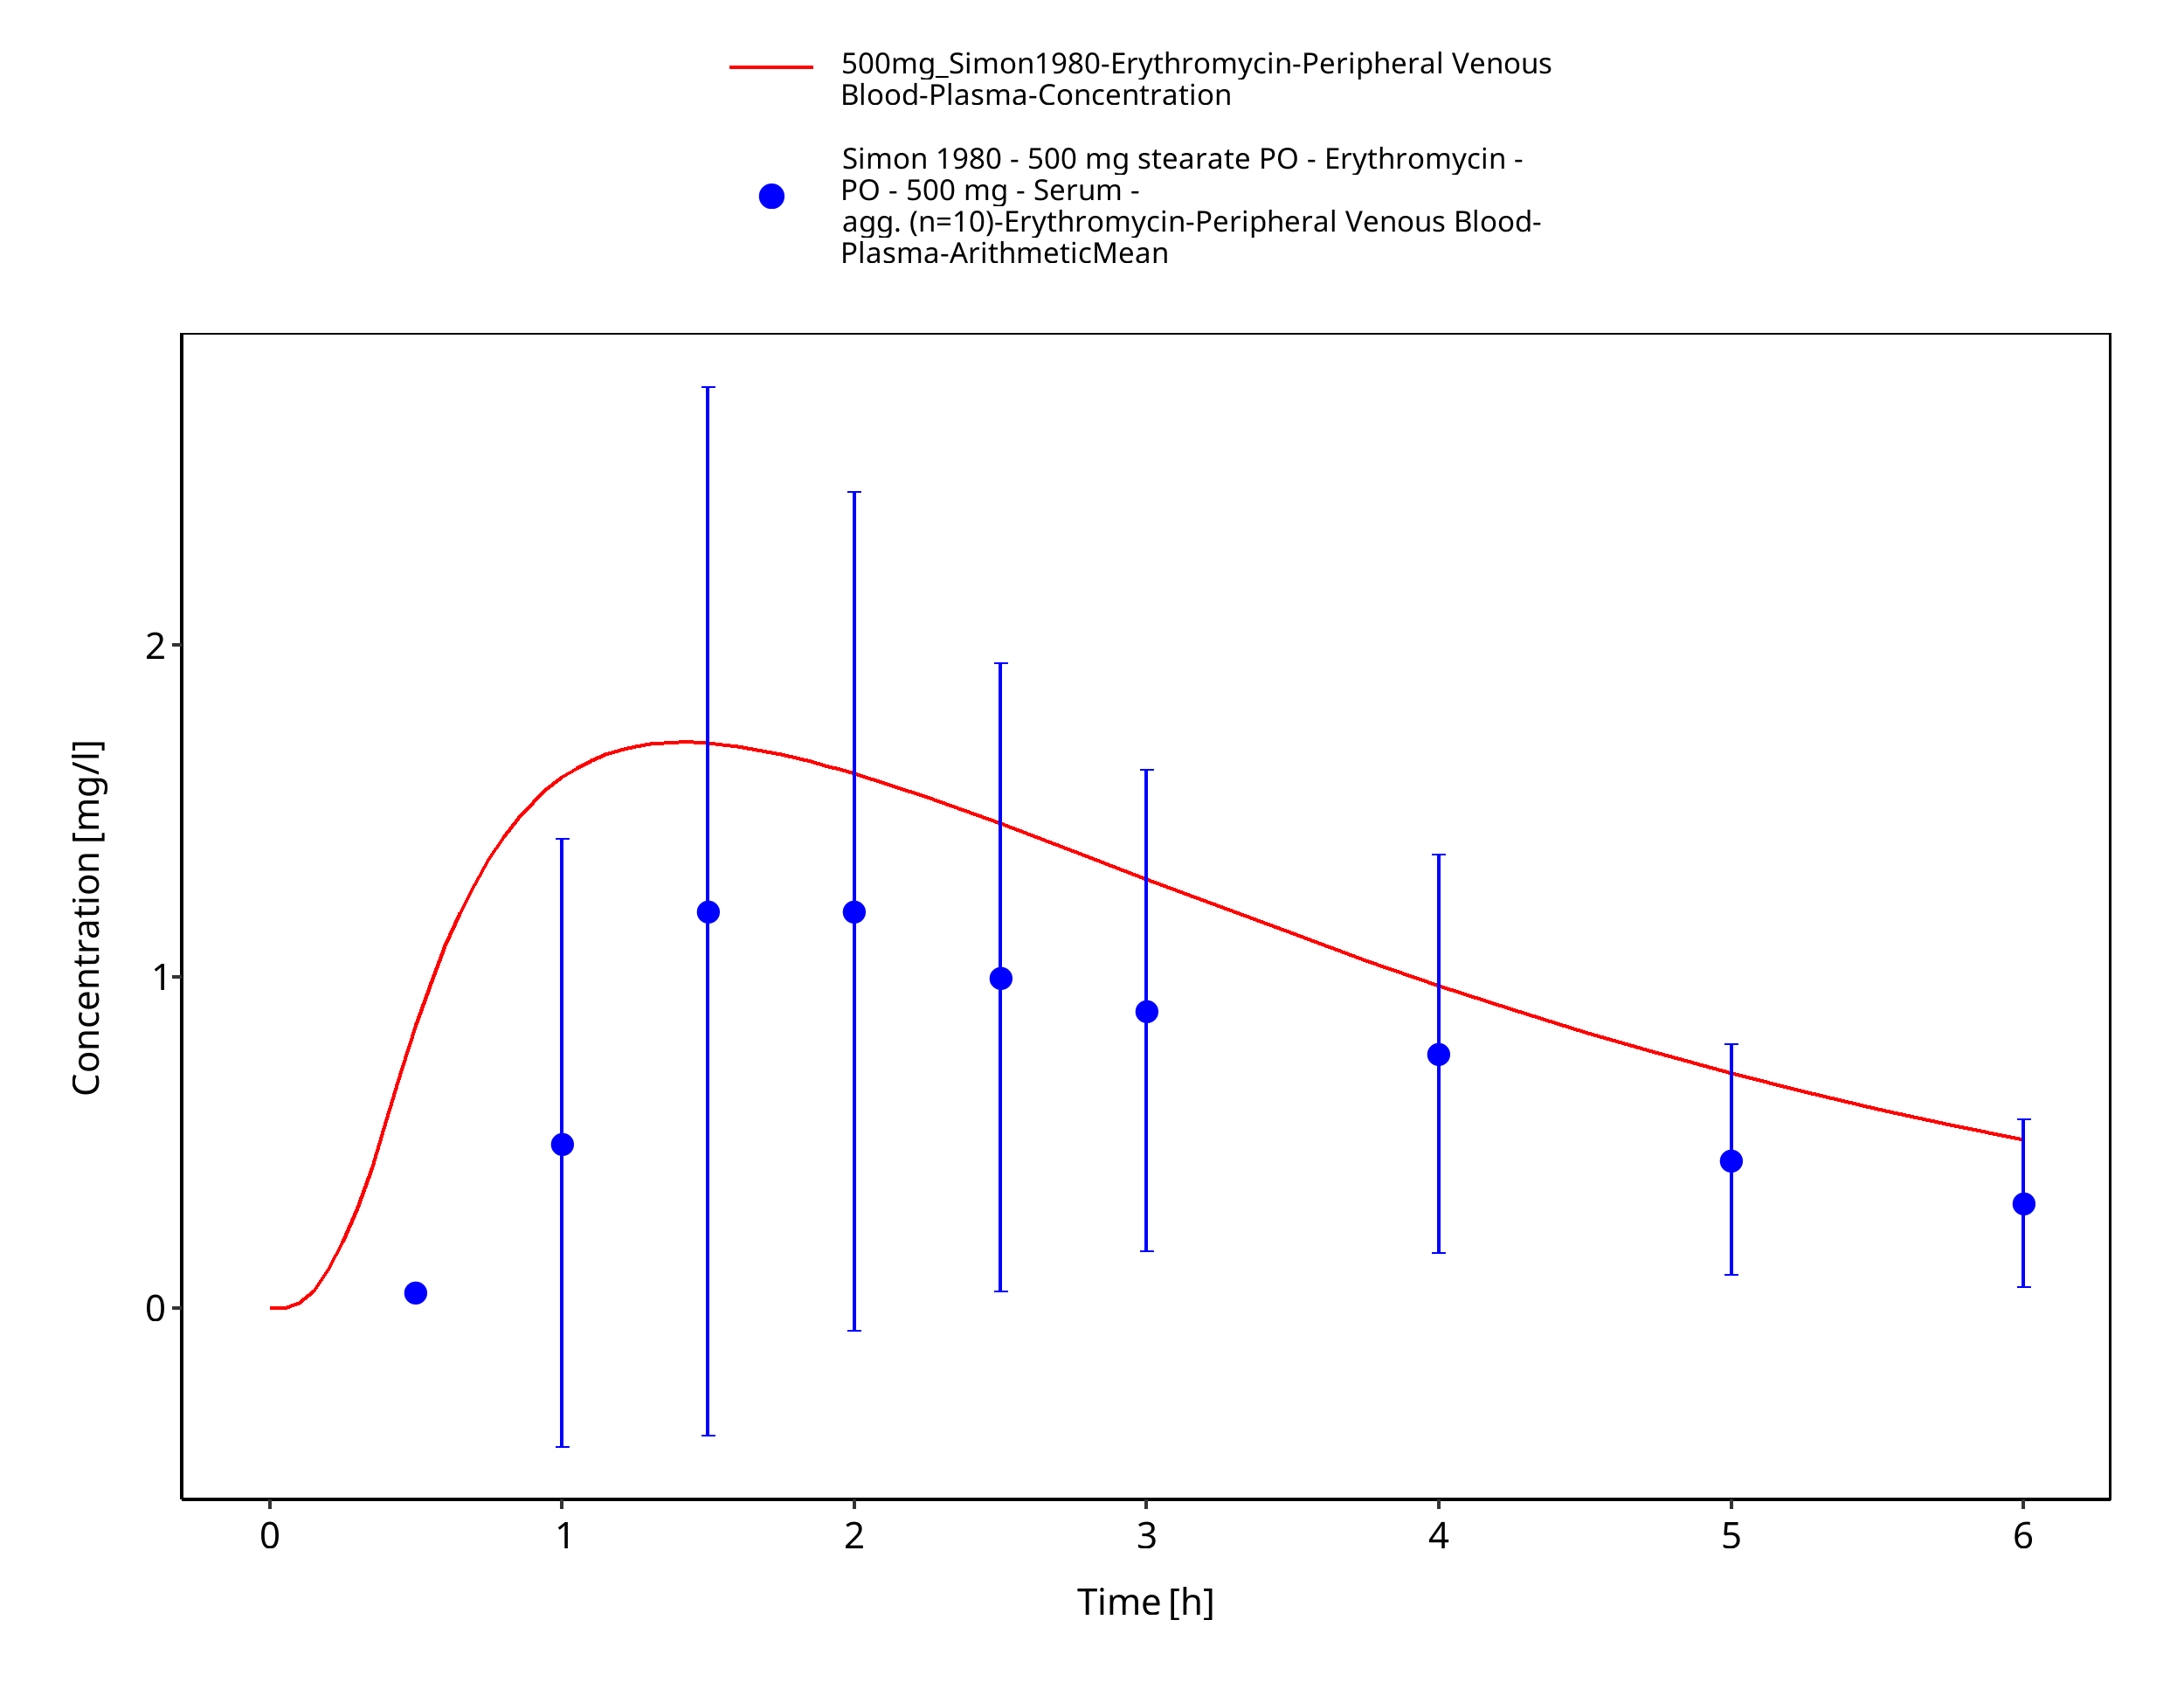
Figure 3-80: Time Profile Analysis 1
4 Conclusion
The final erythromycin PBPK model applies metabolism by CYP3A4, glomerular filtration, and a dummy clearance technically implemented as hepatic plasma clearance accounting for additional clearance pathways, as well as mechanism-based inhibition of CYP3A4. Overall, the model adequately describes the oral pharmacokinetics of erythromycin in healthy adults receiving different single or multiple doses of several oral dosage forms and is considered verified for the use as a perpetrator drug in drug-drug interaction simulations.
5 References
Acocella 1968 Acocella G, Mattiussi R, Nicolis FB, Pallanza R, Tenconi LT. Biliary excretion of antibiotics in man. Gut 1968, 9(5): 536-545.
Akiyoshi 2013 Akiyoshi T, Ito M, Murase S, Miyazaki M, Guengerich FP, Nakamura K, Yamamoto K, Ohtani H. Mechanism-based inhibition profiles of erythromycin and clarithromycin with cytochrome P450 3A4 genetic variants. Drug Metab Pharmacokinet 2013, 28(5): 411-415.
Atkinson 2005 Atkinson A, Kenny JR, Grime K. Automated Assessment of Time-Dependent Inhibition of Human CYP Enzymes using LC-MS-MS Analysis. Drug Metab Dispos 2005, 33(11): 1637-1347.
Aueviriyavit 2010 Aueviriyavit S, Kobayashi K, Chiba K. Species differences in mechanism-based inactivation of CYP3A in humans, rats and mice. Drug Metab Pharmacokinet 2010, 25(1): 93-100.
Austin 1980 Austin KL, Mather LE, Philpot CR, McDonald PJ. Intersubject and dose-related variability after intravenous administration of erythromycin. Br J Clin Pharmacol 1980, 10(3): 273-379.
Barre 1987 Barre J, Mallat A, Rosenbaum J, Deforges L, Houin G, Dhumeaux D, Tillement JP. Pharmacokinetics of erythromycin in patients with severe cirrhosis. Respective influence of decreased serum binding and impaired liver metabolic capacity. Br J Clin Pharmacol 1987, 23(6): 753-757.
Berend 1979 Berend N, Rutland J, Marlin GE. Plasma and saliva concentrations for a new formulation of erythromycin stearate. Curr Med Res Opin 1979, 6(2): 118-123.
Birkett 1990 Birkett DJ, Robson RA, Grgurinovich N, Tonkin A. Single oral dose pharmacokinetics of erythromycin and roxithromycin and the effects of chronic dosing. Ther Drug Monit 1990, 12(1): 65-71.
Brannan 1995 Brannan MD, Reidenberg P, Radwanski E, Shneyer L, Lin CC, Cayen MN, Affrime MB. Loratadine administered concomitantly with erythromycin: pharmacokinetic and electrocardiographic evaluations. Clin Pharmacol Ther 1995, 58(3): 269-278.
Capobianco 1994 Capobianco JO, Goldman RC. Macrolide transport in Escherichia coli strains having normal and altered OmpC and/or OmpF porins. Int J Antimicrob Agents 1994, 4(3): 183-189.
Carlier 1987 Carlier MB, Zenebergh A, Tulkens PM. Cellular uptake and subcellular distribution of roxithromycin and erythromycin in phagocytic cells. J Antimicrob Chemother 1987, 20 Suppl B, 47-56.
Chan 2000 Chan WK, Delucchi AB. Resveratrol, a red wine constituent, is a mechanism-based inactivator of cytochrome P450 3A4. Life Sci 2000, 67(25): 3103-3112.
Chelvan 1979 Chelvan P, Hamilton-Miller JM, Brumfitt W. Biliary excretion of erythromycin after parenteral administration. Br J Clin Pharmacol 1979, 8(3): 233-235.
Chen 2011 Chen Y, Liu L, Monshouwer M, Fretland AJ. Determination of time-dependent inactivation of CYP3A4 in cryopreserved human hepatocytes and assessment of human drug-drug interactions. Drug Metab Dispos 2011, 39(11): 2085-2092.
Chun 1977 Chun AHC, Seitz JA. Pharmacokinetics and biological availability of erythromycin. Infection 1977, 5(1): 14-22.
Cui 2000 Cui X, Nelson DR, Strobel HW. A novel human cytochrome P450 4F isoform (CYP4F11): cDNA cloning, expression, and genomic structural characterization. Genomics 2000, 68(2): 161-166.
DiSanto 1981 DiSanto AR, Chodos DJ. Influence of study design in assessing food effects on absorption of erythromycin base and erythromycin stearate. Antimicrob Agents Chemother 1981, 20(2): 190-196.
drugbank (https://www.drugbank.ca/drugs/DB00199), accessed on 05-14-2018.
Eberl 2007 Eberl S, Renner B, Neubert A, Reisig M, Bachmakov I, König J, Dörje F, Mürdter TE, Ackermann A, Dormann H, Gassmann KG, Hahn EG, Zierhut S, Brune K, Fromm MF. Role of p-glycoprotein inhibition for drug interactions: evidence from in vitro and pharmacoepidemiological studies. Clin Pharmacokinet 2007, 46(12): 1039-1049.
Henry 1980 Henry J, Turner P, Garland M, Esmieu F. Plasma and salivary concentrations of erythromycin after administration of three different formulations. Postgrad Med J 1980, 56(660): 707-710.
Huppertz 2011 Huppertz A, Breuer J, Fels LM, Schultze‐Mosgau M, Sutter G, Klein S, et al. Evaluation of possible drug–drug interaction between gadoxetic acid and erythromycin as an inhibitor of organic anion transporting peptides (OATP). J Magn Reson Imaging 2011, 33(2): 409-416.
Iliopoulou 1982 Iliopoulou A, Aldhous ME, Johnston A, Turner P. Pharmacokinetic interaction between theophylline and erythromycin. Br J Clin Pharmacol 1982, 14(4): 495-499.
Ishikawa 2017 Ishikawa Y, Akiyoshi T, Imaoka A, Ohtani H. Inactivation kinetics and residual activity of CYP3A4 after treatment with erythromycin. Biopharm Drug Dispos 2017, 38(7): 420-425.
Jones 1969 Jones PH, Rowley EK, Weiss AL, Bishop DL, Chun AH. (1969). Insoluble erythromycin salts. J Pharm Sci 1969, 58(3): 337-339.
Josefsson 1982 Josefsson K, Bergan T, Magni L. Dose-related pharmacokinetics after oral administration of a new formulation of erythromycin base. Br J Clin Pharmacol 1982, 13(5): 685-691.
Kalsotra 2004 Kalsotra A, Turman CM, Kikuta Y, Strobel HW. Expression and characterization of human cytochrome P450 4F11: Putative role in the metabolism of therapeutic drugs and eicosanoids. Toxicol Appl Pharmacol 2004, 199(3): 295-304.
Kanamitsu 2000 Kanamitsu SI, Ito K, Green CE, Tyson CA, Shimada N, Sugiyama Y. Prediction of in vivo interaction between triazolam and erythromycin based on in vitro studies using human liver microsomes and recombinant human CYP3A4. Pharm Res 2000, 17(4): 419-426.
Kavi 1988 Kavi J, Webberley JM, Andrews JM, Wise R. A comparison of the pharmacokinetics and tissue penetration of spiramycin and erythromycin. J Antimicrob Chemother 1988, 22 Suppl B: 105-110.
Kivistö 1997 Kivistö KT, Lamberg TS, Kantola T, Neuvonen PJ. Plasma buspirone concentrations are greatly increased by erythromycin and itraconazole. Clin Pharmacol Ther 1997, 62(3): 348-354.
Kosaka 2017 Kosaka M, Kosugi Y, Hirabayashi H. Risk assessment using cytochrome P450 time-dependent inhibition assays at single time and concentration in the early stage of drug discovery. J Pharm Sci 2017, 106(9): 2839-2846.
Kozakai 2013 Kozakai K, Yamada Y, Oshikata M, Kawase T, Suzuki E, Haramaki Y, Taniguchi H. Cocktail-substrate approach-based high-throughput assay for evaluation of direct and time-dependent inhibition of multiple cytochrome P450 isoforms. Drug Metab Pharmacokinet 2013, 29(2): 198-207.
Kroboth 1982 Kroboth PD, Brown A, Lyon JA, Kroboth FJ, Juhl RP. Pharmacokinetics of single-dose erythromycin in normal and alcoholic liver disease subjects. Antimicrob Agents Chemother 1982, 21(1): 135-140.
Kuepfer 2016 Kuepfer L, Niederalt C, Wendl T, Schlender JF, Willmann S, Lippert J, Block M, Eissing T, Teutonico D. Applied concepts in PBPK modeling: how to build a PBPK/PD model. CPT Pharmacometrics Syst Pharmacol 2016, 5(10): 516-531.
Lancaster 2012 Lancaster CS, Bruun GH, Peer CJ, Mikkelsen TS, Corydon TJ, Gibson AA, Hu S, Orwick SJ, Mathijssen RH, Figg WD, Baker SD, Sparreboom A. OATP1B1 polymorphism as a determinant of erythromycin disposition. Clin Pharmacol Ther 2012, 92(5): 642-650.
Larrey 1983 Larrey D, Tinel M, and Pessayre D. Formation of inactive cytochrome P-450 Fe(II)-metabolite complexes with several erythromycin derivatives but not with josamycin and midecamycin in rats. Biochem Pharmacol 1983, 32(9): 1487-1493.
Lien 1974 Lien EJ, Kuwahara J, Koda RT. Diffusion of drugs into prostatic fluid and milk. Drug Intelligence & Clinical Pharmacy 1974, 8(8): 470-475.
Malmborg 1978 Malmborg AS. Absorption of erythromycin stearate after oral administration. Curr Med Res Opin 1978, 5 Sup 2: 15-18.
Manna 1998 Manna PK, Basu SK. Preparation and Evaluation of Erythromycin Fumarate-a New Derivative of Erythromycin. Drug Dev Ind Pharm 1998, 24(9): 879-882.
Mather 1981 Mather LE, Austin KL, Philpot CR, McDonald PJ. Absorption and bioavailability of oral erythromycin. Br J Clin Pharmacol 1981, 12(2): 131-140.
Mao 2011 Mao J, Mohutsky MA, Harrelson JP, Wrighton SA, Hall SD. Prediction of CYP3A-mediated drug-drug interactions using human hepatocytes suspended in human plasma. Drug Metab Dispos 2011, 39(4): 591-602.
Mao 2016 Mao J, Tay S, Khojasteh CS, Chen Y, Hop CE, Kenny JR. Evaluation of time dependent inhibition assays for marketed oncology drugs: comparison of human hepatocytes and liver microsomes in the presence and absence of human plasma. Pharm Res 2016, 33(5): 1204-1219.
McConn 2004 McConn DJ, Lin YS, Allen K, Kunze KL, Thummel KE. Differences in the inhibition of cytochromes P450 3A4 and 3A5 by metabolite-inhibitor complex-forming drugs. Drug Metab Dispos 2004, 32(10): 1083-1091.
McFarland 1997 McFarland JW, Berger CM, Froshauer SA, Hayashi SF, Hecker SJ, Jaynes BH, et al. Quantitative structure− activity relationships among macrolide antibacterial agents: in vitro and in vivo potency against Pasteurella multocida. J Med Chem 1997, 40(9): 1340-1346.
McGinnity 2006 McGinnity DF, Berry AJ, Kenny JR, Grime K, Riley RJ. Evaluation of time-dependent cytochrome P450 inhibition using cultured human hepatocytes. Drug Metab Dispos 2006, 34(8): 1291-1300.
Michaels 2014 Michaels S, Wang MZ. The revised human liver cytochrome P450 "Pie": absolute protein quantification of CYP4F and CYP3A enzymes using targeted quantitative proteomics. Drug Metab Dispos 2014, 42(8): 1241-1251.
Miglioli 1990 Miglioli PA, Pivetta P, Strazzabosco M, Orlando R, Okolicsanyi L, Palatini P. Effect of age on single- and multiple-dose pharmacokinetics of erythromycin. Eur J Clin Pharmacol 1990, 39(2): 161-164.
Miller 1984 Miller MF, Martin JR, Johnson P, Ulrich JT, Rdzok EJ, Billing P. Erythromycin uptake and accumulation by human polymorphonuclear leukocytes and efficacy of erythromycin in killing ingested Legionella pneumophila. J Infect Dis 1984, 149(5): 714-718.
Mordi 2000 Mordi MN, Pelta MD, Boote V, Morris GA, Barber J. Acid-catalyzed degradation of clarithromycin and erythromycin B: a comparative study using NMR spectroscopy. J Med Chem 2000, 43(3): 467-474.
Obach 2007 Obach RS, Walsky RL, Venkatakrishnan K. Mechanism-based inactivation of human cytochrome p450 enzymes and the prediction of drug-drug interactions. Drug Metab Dispos 2007, 35(2): 246-255.
Olkkola 1993 Olkkola KT, Aranko K, Luurila H, Hiller A, Saarnivaara L, Himberg JJ, Neuvonen PJ. A potentially hazardous interaction between erythromycin and midazolam. Clin Pharmacol Ther 1993, 53(3): 298-305.
Open Systems Pharmacology Documentation. (https://docs.open-systems-pharmacology.org/), accessed on 07-30-2019.
Parsons 1977 Parsons RL, Paddock M, Hossack A. Particular aspects of the pharmacokinetics of erythromycin. Infection 1977, 5(1): 23-28.
Pasic 1987 Pasic J, Jackson SH, Johnston A, Peverel-Cooper CA, Turner P, Downey K, Chaput de Saintonge DM. The interaction between chronic oral slow-release theophylline and single-dose intravenous erythromycin. Xenobiotica 1987, 17(4):493-497.
PK-Sim Ontogeny Database Version 7.3. (https://github.com/Open-Systems-Pharmacology/OSPSuite.Documentation/blob/38cf71b384cfc25cfa0ce4d2f3addfd32757e13b/PK-Sim%20Ontogeny%20Database%20Version%207.3.pdf), accessed on 07-30-2019.
Polasek 2006 Polasek TM, Miners JO. Quantitative prediction of macrolide drug-drug interaction potential from in vitro studies using testosterone as the human cytochrome P4503A substrate. Eur J Clin Pharmacol 2006, 62(3): 203-208.
Posti 1983 Posti J, Salonen M. Effect of formulation factors and food intake on the bioavailability of erythromycin stearate tablets. Int J Pharm 1983, 17(2-3): 225-235.
Riley 1997 Riley RJ, Howbrook D. In vitro analysis of the activity of the major human hepatic CYP enzyme (CYP3A4) using [N-methyl-14C]-erythromycin. J Pharmacol Toxicol Methods 1997, 38(4): 189-193.
Ring 2005 Ring BJ, Patterson BE, Mitchell MI, Vandenbranden M, Gillespie J, Bedding AW, Jewell H, Payne CD, Forgue ST, Eckstein J, Wrighton SA, Phillips DL. Effect of tadalafil on cytochrome P450 3A4-mediated clearance: studies in vitro and in vivo. Clin Pharmacol Ther 2005, 77(1): 63-75.
Schreiner 1984 Schreiner A, Digranes A. Absorption of erythromycin stearate and enteric-coated erythromycin base after a single oral dose immediately before breakfast. Infection 1984, 12(5): 345-348.
Shanson 1984 Shanson DC, Tidbury P, McNabb WR, Tadayon M. The pharmacokinetics and tolerance of oral erythromycin stearate compared with erythromycin ethylsuccinate: implications for preventing endocarditis. J Antimicrob Chemother 1984, 14(2): 157-163.
Simon 1980 Simon C. Pharmacokinetics of erythromycin in healthy adults and in adults with respiratory infections. Curr Med Res Opin 1980, 6(sup8): 17-22.
Sun 2010 Sun H, Frassetto LA, Huang Y, Benet LZ. Hepatic clearance, but not gut availability, of erythromycin is altered in patients with end-stage renal disease. Clin Pharmacol Ther 2010, 87(4): 465-472.
Teng 2010 Teng WC, Oh JW, New LS, Wahlin MD, Nelson SD, Ho HK, Chan EC. Mechanism-based inactivation of cytochrome P450 3A4 by lapatinib. Mol Pharmacol 2010, 78(4): 693-703.
Uehara 2015 Uehara S, Murayama N, Nakanishi Y, Nakamura C, Hashizume T, Zeldin DC, Yamazaki H, Uno Y. Immunochemical quantification of cynomolgus CYP2J2, CYP4A and CYP4F enzymes in liver and small intestine. Xenobiotica 2015, 45(2): 124-130.
Ung 2009 Ung D, Parkman HP, Nagar S. Metabolic interactions between prokinetic agents domperidone and erythromycin: an in vitro analysis. Xenobiotica 2009, 39(10): 749-756.
U.S. Patent 2,761,859. Aqueous soluble salts of erythromycin. Issued September 4, 1956. https://patents.google.com/patent/US2761859A/en, accessed on 07-17-2018.
Wang 1997 Wang RW, Newton DJ, Scheri TD, Lu AY. Human cytochrome P450 3A4-catalyzed testosterone 6 beta-hydroxylation and erythromycin N-demethylation. Competition during catalysis. Drug Metab Dispos 1997, 25(4): 502-507.
Watanabe 2007 Watanabe A, Nakamura K, Okudaira N, Okazaki O, Sudo K. Risk assessment for drug-drug interaction caused by metabolism-based inhibition of CYP3A using automated in vitro assay systems and its application in the early drug discovery process. Drug Metab Dispos 2007, 35(7): 1232-1238.
Willmann 2007 Willmann S, Höhn K, Edginton A, Sevestre M, Solodenko J, Weiss W, Lippert J, Schmitt W. Development of a physiology-based whole-body population model for assessing the influence of individual variability on the pharmacokinetics of drugs. J Pharmacokinet Pharmacodyn 2007, 34(3): 401-431.
Xu 2009 Xu L, Chen Y, Pan Y, Skiles GL, Shou M. Prediction of human drug-drug interactions from time-dependent inactivation of CYP3A4 in primary hepatocytes using a population-based simulator. Drug Metab Dispos 2009, 37(12): 2330-2339.
Yakatan 1979 Yakatan GJ, Poynor WJ, Harris RG, Martin A, Leonard RG, Briggs AH, Doluisio JT. Single-dose fasting bioequivalence assessment of erythromycin stearate tablets in man. J Pharmacokinet Biopharm 1979, 7(4): 355-368.
Yakatan 1980 Yakatan GJ, Poynor WJ, Breeding SA, Lankford CE, Dighe SV, Martin AN, Doluisio JT. Single- and multiple-dose bioequivalence of erythromycin pharmaceutical alternatives. J Clin Pharmacol 1980, 20(11): 625-638.
Yamano 2001 Yamano K, Yamamoto K, Katashima M, Kotaki H, Takedomi S, Matsuo H, Ohtani H, Sawada Y, Iga T. Prediction of midazolam-CYP3A inhibitors interaction in the human liver from in vivo/in vitro absorption, distribution, and metabolism data. Drug Metab Dispos 2001, 29(4 Pt 1): 443-452.
Zhang 2006 Zhang X, Gorski J, Lucksiri A, Chien J, Quinney S, Jones D, Hall S. OIV‐B‐4; Physiologically-based pharmacokinetic models for the inhibition of midazolam clearance by erythromycin and diltiazem. Clin Pharmacol Ther 2006, 79: P34-P34.
Zhang 2009 Zhang X, Jones DR, Hall SD. Prediction of the effect of erythromycin, diltiazem, and their metabolites, alone and in combination, on CYP3A4 inhibition. Drug Metab Dispos 2009, 37(1):150-160.
Zimmerlin 2011 Zimmerlin A, Trunzer M, Faller B. CYP3A time-dependent inhibition risk assessment validated with 400 reference drugs. Drug Metab Dispos 2011, 39(6): 1039-1046.
Related Models
Explore other Antibiotics models in this library:
- Amikacin - PBPK model and evaluation report
- Clarithromycin - PBPK model and evaluation report
- Ethinylestradiol - PBPK model and evaluation report
- Rifampicin - PBPK model and evaluation report
- Vancomycin - PBPK model and evaluation report