Building and evaluation of a PBPK model for Fluconazole in healthy adults
| Version | 2.0-OSP12.3 |
|---|---|
| based on Model Snapshot and Evaluation Plan | https://github.com/Open-Systems-Pharmacology/Fluconazole-Model/releases/tag/v2.0 |
| OSP Version | 12.3 |
| Qualification Framework Version | 3.7 |
This evaluation report and the corresponding PK-Sim project file are filed at:
https://github.com/Open-Systems-Pharmacology/OSP-PBPK-Model-Library/
Table of Contents
- 1 Introduction
- 2 Methods
- 2.1 Modeling strategy
- 2.2 Data used
- 2.3 Model parameters and assumptions
- 3 Results and Discussion
- 3.1 Fluconazole final input parameters
- 3.2 Fluconazole Diagnostics Plots
- 3.3 Concentration-Time Profiles
- 4 Conclusion
- 5 References
1 Introduction
Fluconazole is an antifungal medication for the treatment of a number of different fungal infections. It is metabolized by UGT2B7 and renally excreted by glomerular filtration. About 70% of fluconazole is excreted unchanged in urine during 120 hours. Fluconazole is a moderate inhibitor of CYP3A4 and can therefore serve as a perpetrator for CYP3A4 in DDI studies.
The herein presented PBPK model of fluconazole has been developed using published pharmacokinetic clinical data by Palkama et al. (Palkama 1998), Ripa et al. (Ripa 1993), Shiba et al. (Shiba 1990), Ahonen et al. (Ahonen 1997), Brammer et al. (Brammer 1990), Brammer et al. (Brammer 1991), Thorpe et al. (Thorpe 1990 and Varhe et al. (Varhe 1996). The model has then been evaluated by comparing observed data to simulations of both intravenously and orally administered fluconazole covering a dose range of 25 mg to 400 mg. Both single dose and multiple dose administration are represented in the development and evaluation data sets.
The presented model includes the following features:
- metabolism by UGT2B7,
- inhibition of CYP3A4,
- renal clearance by glomerular filtration,
- oral absorption with dissolution rate assigned to the Weibull function for low, medium and high doses.
2 Methods
2.1 Modeling strategy
The general concept of building a PBPK model has previously been described by Kuepfer et al. (Kuepfer 2016). Relevant information on anthropometric (height, weight) and physiological parameters (e.g. blood flows, organ volumes, binding protein concentrations, hematocrit, cardiac output) in adults was gathered from the literature and has been previously published (Willmann 2007). The information was incorporated into PK-Sim® and was used as default values for the simulations in adults.
The applied activity and variability of plasma proteins and active processes that are integrated into PK-Sim® are described in the publicly available PK-Sim® Ontogeny Database Version 7.3 (PK-Sim Ontogeny Database Version 7.3) or otherwise referenced for the specific process.
A mean model was built based on clinical data from studies with intravenous administration of fluconazole by Palkama et al. 1998 (Palkama 1998), Ripa et al. 1993 (Ripa 1993) and Shiba et al. 1990 (Shiba 1990). The studies conducted by Palkama et al. and Ripa et al. reported plasma concentrations of fluconazole and the study by Shiba reported fraction of unchanged fluconazole excreted to urine in addition to plasma concentrations. The mean PBPK model was developed using a typical male European individual. The relative tissue-specific expressions of enzymes predominantly being involved in the metabolism of fluconazole (UGT2B7) were considered (Meyer 2012).
A specific set of parameters (see below) was optimized to describe the distribution of fluconazole after intravenous administration using the Parameter Identification module provided in PK-Sim®. Structural model selection was mainly guided by visual inspection and total error of the resulting description of data, 95% confidence interval of the identified parameter values and biological plausibility.
Once the appropriate structural model was identified for the intravenous administration, the model was verified by simulating other clinical studies reporting pharmacokinetic concentration-time profiles after intravenous administration of fluconazole.
Thereafter additional parameters for oral administration of non-dissolved formulations (i.e. capsules) were identified. Administered doses of fluconazole were ranging from single dose of 25 mg to multiple dosing of 400 mg, why the applied Weibull function to describe the dissolution of fluconazole were divided into low, medium and high dose. The dissolution shape were kept between the doses while the dissolution time were separated.
The model was then verified by simulating further clinical studies reporting pharmacokinetic concentration-time profiles after oral administration of fluconazole.
Details about input data (physicochemical, in vitro and clinical) can be found in Section 2.2.
Details about the structural model and its parameters can be found in Section 2.3.
2.2 Data used
2.2.1 In vitro and physicochemical data
A literature search was performed to collect available information on physicochemical properties of fluconazole. The obtained information from literature is summarized in the table below, and is used for model building.
| Parameter | Unit | Value | Source | Description |
|---|---|---|---|---|
| MW | g/mol | 306.28 | Debruyne 1993 | Molecular weight |
| pKa | 2.03 | Charoo 2014 | acid dissociation constant of conjugate acid; compound type: weak base | |
| Solubility (pH) | mg/mL | 6.9 (7.4) | Charoo 2014 | Aqueous Solubility |
| logP | 0.5 | Christofoletti 2016 | Partition coefficient between octanol and water | |
| 0.5 | Charoo 2014 | Partition coefficient between octanol and water | ||
| fu | % | 89 | Pfizer | Fraction unbound in plasma |
| % | 88 | Christofoletti 2016 | Fraction unbound in plasma | |
| CLint UGT2B7 | 1/min | 0.005 | Watt 2018 | First order intrinsic clearance UGT2B7 |
| Peff | cm/s | 0.000213 | GastroPlus | Specific intestinal permeability |
| Ki CYP3A4 | µmol/L | 13.1 | Sakaeda 2005 | Non-competitive inhibition of CYP3A4 |
| GFR fraction | 0.17 | Watt 2018 | glomerular filtration fraction |
2.2.2 Clinical data
A literature search was performed to collect available clinical data on fluconazole in adults.
The following publications were found in adults for model building:
| Publication | Arm / Treatment / Information used for model building |
|---|---|
| Ahonen 1997 | Plasma PK profiles in healthy subjects after single dose oral administration of 400 mg fluconazole |
| Brammer 1990 | Plasma PK profiles in healthy subjects after multiple oral administration of 200, 300 and 400 mg fluconazole |
| Brammer 1991 | Plasma PK profiles in healthy subjects after single dose oral administration of 50 mg fluconazole |
| Shiba 1990 | Plasma PK profiles and urine data in healthy subjects after single iv and oral administration of 25 and 50 mg fluconazole and single oral dose of 100 mg fluconazole |
| Palkama 1998 | Plasma PK profiles in healthy subjects after single dose iv and oral administration of 400 mg fluconazole |
| Ripa 1993 | Plasma PK profiles in healthy subjects after single dose iv administration of 100 mg fluconazole |
| Thorpe 1990 | Plasma PK profiles in healthy subjects after single dose oral administration of 100 mg fluconazole |
| Varhe 1996 | Plasma PK profiles in healthy subjects after multiple oral administration of 100 and 200 mg fluconazole |
The following table shows the data from the excretion studies (Shiba 1990) used for model building:
| Observer | Value |
|---|---|
| Fraction excreted to urine of unchanged fluconazole after iv administration 25 mg | 74% |
| Fraction excreted to urine of unchanged fluconazole after iv administration 25 mg | 72% |
| Fraction excreted to urine of unchanged fluconazole after oral administration 25 mg | 69% |
| Fraction excreted to urine of unchanged fluconazole after oral administration 50 mg | 67% |
| Fraction excreted to urine of unchanged fluconazole after oral administration 100 mg | 75% |
The following dosing scenarios were simulated and compared to respective data for model verification:
| Scenario | Data reference |
|---|---|
| iv 400 mg (60 min) | Ahonen 1997 |
| iv 50 mg (2 min) | Brammer 1990 |
| iv 25 mg (1 min) | Shiba 1990 |
| iv 800 mg (240 min) once daily for 14 days | Sobue 2004 |
| iv 100 mg (20 min) | Yeates 1994 |
| po 400 mg | Palkama 1998 |
| po 100 mg | Shiba 1990 |
| po 50 mg once daily for 4 days | Varhe 1996 |
2.3 Model parameters and assumptions
2.3.1 Absorption
The parameter value for Specific intestinal permeability was used as in GastroPlus. Although, the permeability didn't seem to be the rate-limiting step in oral absorption as this parameter could not be identified when attempting to estimate a value using Parameter Identification. The default solubility was assumed to be the measured value in phosphate buffer (see Section 2.2.1)
The dissolution of capsules/tablets (not always specified in the literature which formulation for oral administration was used) were implemented via empirical Weibull dissolution. A different Weibull function was used for different dose categories, low, medium high and high dose to distinguish the dissolution time across the dose range; see results of optimization in Section 2.3.4.
2.3.2 Distribution
Fluconazole has a low protein bound (approx. 11 %) fraction in plasma (see Section 2.2.1). A value of 89% was used in this PBPK model for Fraction unbound (plasma, reference value). The major binding partner was set to alpha1- acid glycoprotein(see Section 2.2.1).
An important parameter influencing the resulting volume of distribution is lipophilicity. The reported experimental logP values are in the range of 0.5-1.0 (see Section 2.2.1) which served as a starting value. Finally, the model parameters Lipophilicity was optimized to match best clinical data (see also Section 2.3.4).
After testing the available organ-plasma partition coefficient and cell permeability calculation methods built in PK-Sim, observed clinical data was best described by choosing the partition coefficient calculation by Rodgers and Rowland and cellular permeability calculation by PK-Sim Standard.
2.3.3 Metabolism and Elimination
One metabolic pathway was implement into the model via first order kinetics
- UGT2B7
The UGT2B7 expression profiles is based on high-sensitive real-time RT-PCR (Nishimura 2003). Absolute tissue-specific expressions were obtained by considering the respective absolute concentration in the liver. The Specific clearance of fluconazole accounted by UGT2B7 was identified to best describe observed clinical data after intravenous administration (see Section 2.3.4).
Additionally, renal clearance (which is the main elimination process for fluconazole) assumed to be mainly driven by glomerular filtration was implemented. The GFR fraction was identified to best describe the observed fraction of unchanged fluconazole that was renally excreted (see Section 2.3.4).
2.3.4 Automated Parameter Identification
This is the result of the final parameter identification for the intravenous model:
| Model Parameter | Optimized Value | Unit |
|---|---|---|
Lipophilicity |
0.83 | Log Units |
GFR fraction |
0.14 | |
Specific clearance (UGT2B7) |
1.85E-3 | 1/min |
This is the result of the final parameter identification for the dissolution parameters of a oral administered fluconazole:
| Model Parameter | Optimized Value | Unit |
|---|---|---|
Dissolution time (50% dissolved) high dose |
105.81 | min |
Dissolution time (50% dissolved) medium high dose |
75.14 | min |
Dissolution time (50% dissolved) low dose |
33.40 | min |
Dissolution shape |
2.14 |
3 Results and Discussion
The PBPK model for fluconazole was developed and verified with clinical pharmacokinetic data.
The model was built and evaluated covering data from studies including in particular
- intravenous infusions and oral administrations (capsules).
- a dose range of 25 to 800 mg.
The model quantifies excretion via urine (glomerular filtration) and metabolism via UGT2B7.
The next sections show:
- the final model input parameters for the building blocks: Section 3.1.
- the overall goodness of fit: Section 3.2.
- simulated vs. observed concentration-time profiles for the clinical studies used for model building and for model verification: Section 3.3.
3.1 Fluconazole final input parameters
The compound parameter values of the final PBPK model are illustrated below.
Compound: Fluconazole
Parameters
| Name | Value | Value Origin | Alternative | Default |
|---|---|---|---|---|
| Solubility at reference pH | 6.9 mg/ml | Measurement_Solubility_Charoo2014 | True | |
| Reference pH | 7 | Measurement_Solubility_Charoo2014 | True | |
| Lipophilicity | 0.8302390226 Log Units | Parameter Identification-Parameter Identification-Value updated from 'Parameter Identification 1' on 2021-07-13 15:29 | Optimized_Lipophilicity | True |
| Fraction unbound (plasma, reference value) | 89 % | Measurement_Fraction_Unbound_Pfizer | True | |
| Specific intestinal permeability (transcellular) | 0.000213 cm/s | Measurement_Specific_Intestinal_Permeability_GastroPlus | True | |
| F | 2 | |||
| Is small molecule | Yes | |||
| Molecular weight | 306.328 g/mol | |||
| Plasma protein binding partner | α1-acid glycoprotein |
Calculation methods
| Name | Value |
|---|---|
| Partition coefficients | Rodgers and Rowland |
| Cellular permeabilities | PK-Sim Standard |
Processes
Metabolizing Enzyme: UGT2B7-Watt2018
Species: Human
Molecule: UGT2B7
Parameters
| Name | Value | Value Origin |
|---|---|---|
| Intrinsic clearance | 0.008 l/min | |
| Specific clearance | 0.0018460294654 1/min | Parameter Identification-Parameter Identification-Value updated from 'Parameter Identification 1' on 2021-07-13 15:29 |
Systemic Process: Glomerular Filtration-Watt2018
Species: Human
Parameters
| Name | Value | Value Origin |
|---|---|---|
| GFR fraction | 0.1433240785 | Parameter Identification-Parameter Identification-Value updated from 'Parameter Identification 1' on 2021-07-13 15:29 |
Inhibition: CYP3A4-Sakaeda2005
Molecule: CYP3A4
Parameters
| Name | Value | Value Origin |
|---|---|---|
| Ki | 13.1 µmol/l |
Formulation: Fluconazole_Weibull_high dose
Type: Weibull
Parameters
| Name | Value | Value Origin |
|---|---|---|
| Dissolution time (50% dissolved) | 105.8071997888 min | Parameter Identification-Parameter Identification-Value updated from 'Parameter Identification 2' on 2021-07-13 18:01 |
| Lag time | 0 min | |
| Dissolution shape | 2.1410681544 | Parameter Identification-Parameter Identification-Value updated from 'Parameter Identification 2' on 2021-07-13 18:01 |
| Use as suspension | Yes |
Formulation: Fluconazole_Weibull_low dose
Type: Weibull
Parameters
| Name | Value | Value Origin |
|---|---|---|
| Dissolution time (50% dissolved) | 33.3965005792 min | Parameter Identification-Parameter Identification-Value updated from 'Parameter Identification 2' on 2021-07-13 18:01 |
| Lag time | 0 min | |
| Dissolution shape | 2.1410681544 | Parameter Identification-Parameter Identification-Value updated from 'Parameter Identification 2' on 2021-07-13 18:01 |
| Use as suspension | Yes |
Formulation: Fluconazole_Weibull_medium high dose
Type: Weibull
Parameters
| Name | Value | Value Origin |
|---|---|---|
| Dissolution time (50% dissolved) | 75.1395611322 min | Parameter Identification-Parameter Identification-Value updated from 'Parameter Identification 2' on 2021-07-13 18:01 |
| Lag time | 0 min | |
| Dissolution shape | 2.1410681544 | Parameter Identification-Parameter Identification-Value updated from 'Parameter Identification 2' on 2021-07-13 18:01 |
| Use as suspension | Yes |
3.2 Fluconazole Diagnostics Plots
Below you find the goodness-of-fit visual diagnostic plots for the PBPK model performance of all data used presented in Section 2.2.2.
The first plot shows observed versus simulated plasma concentration, the second weighted residuals versus time.
Table 3-1: GMFE for Goodness of fit plot for concentration in plasma.
| Group | GMFE |
|---|---|
| Fluconazole iv (model building) | 1.09 |
| Fluconazole iv (model verification) | 1.14 |
| Fluconazole oral administration (model building) | 1.20 |
| Fluconazole oral administration (model verification) | 1.26 |
| All | 1.18 |
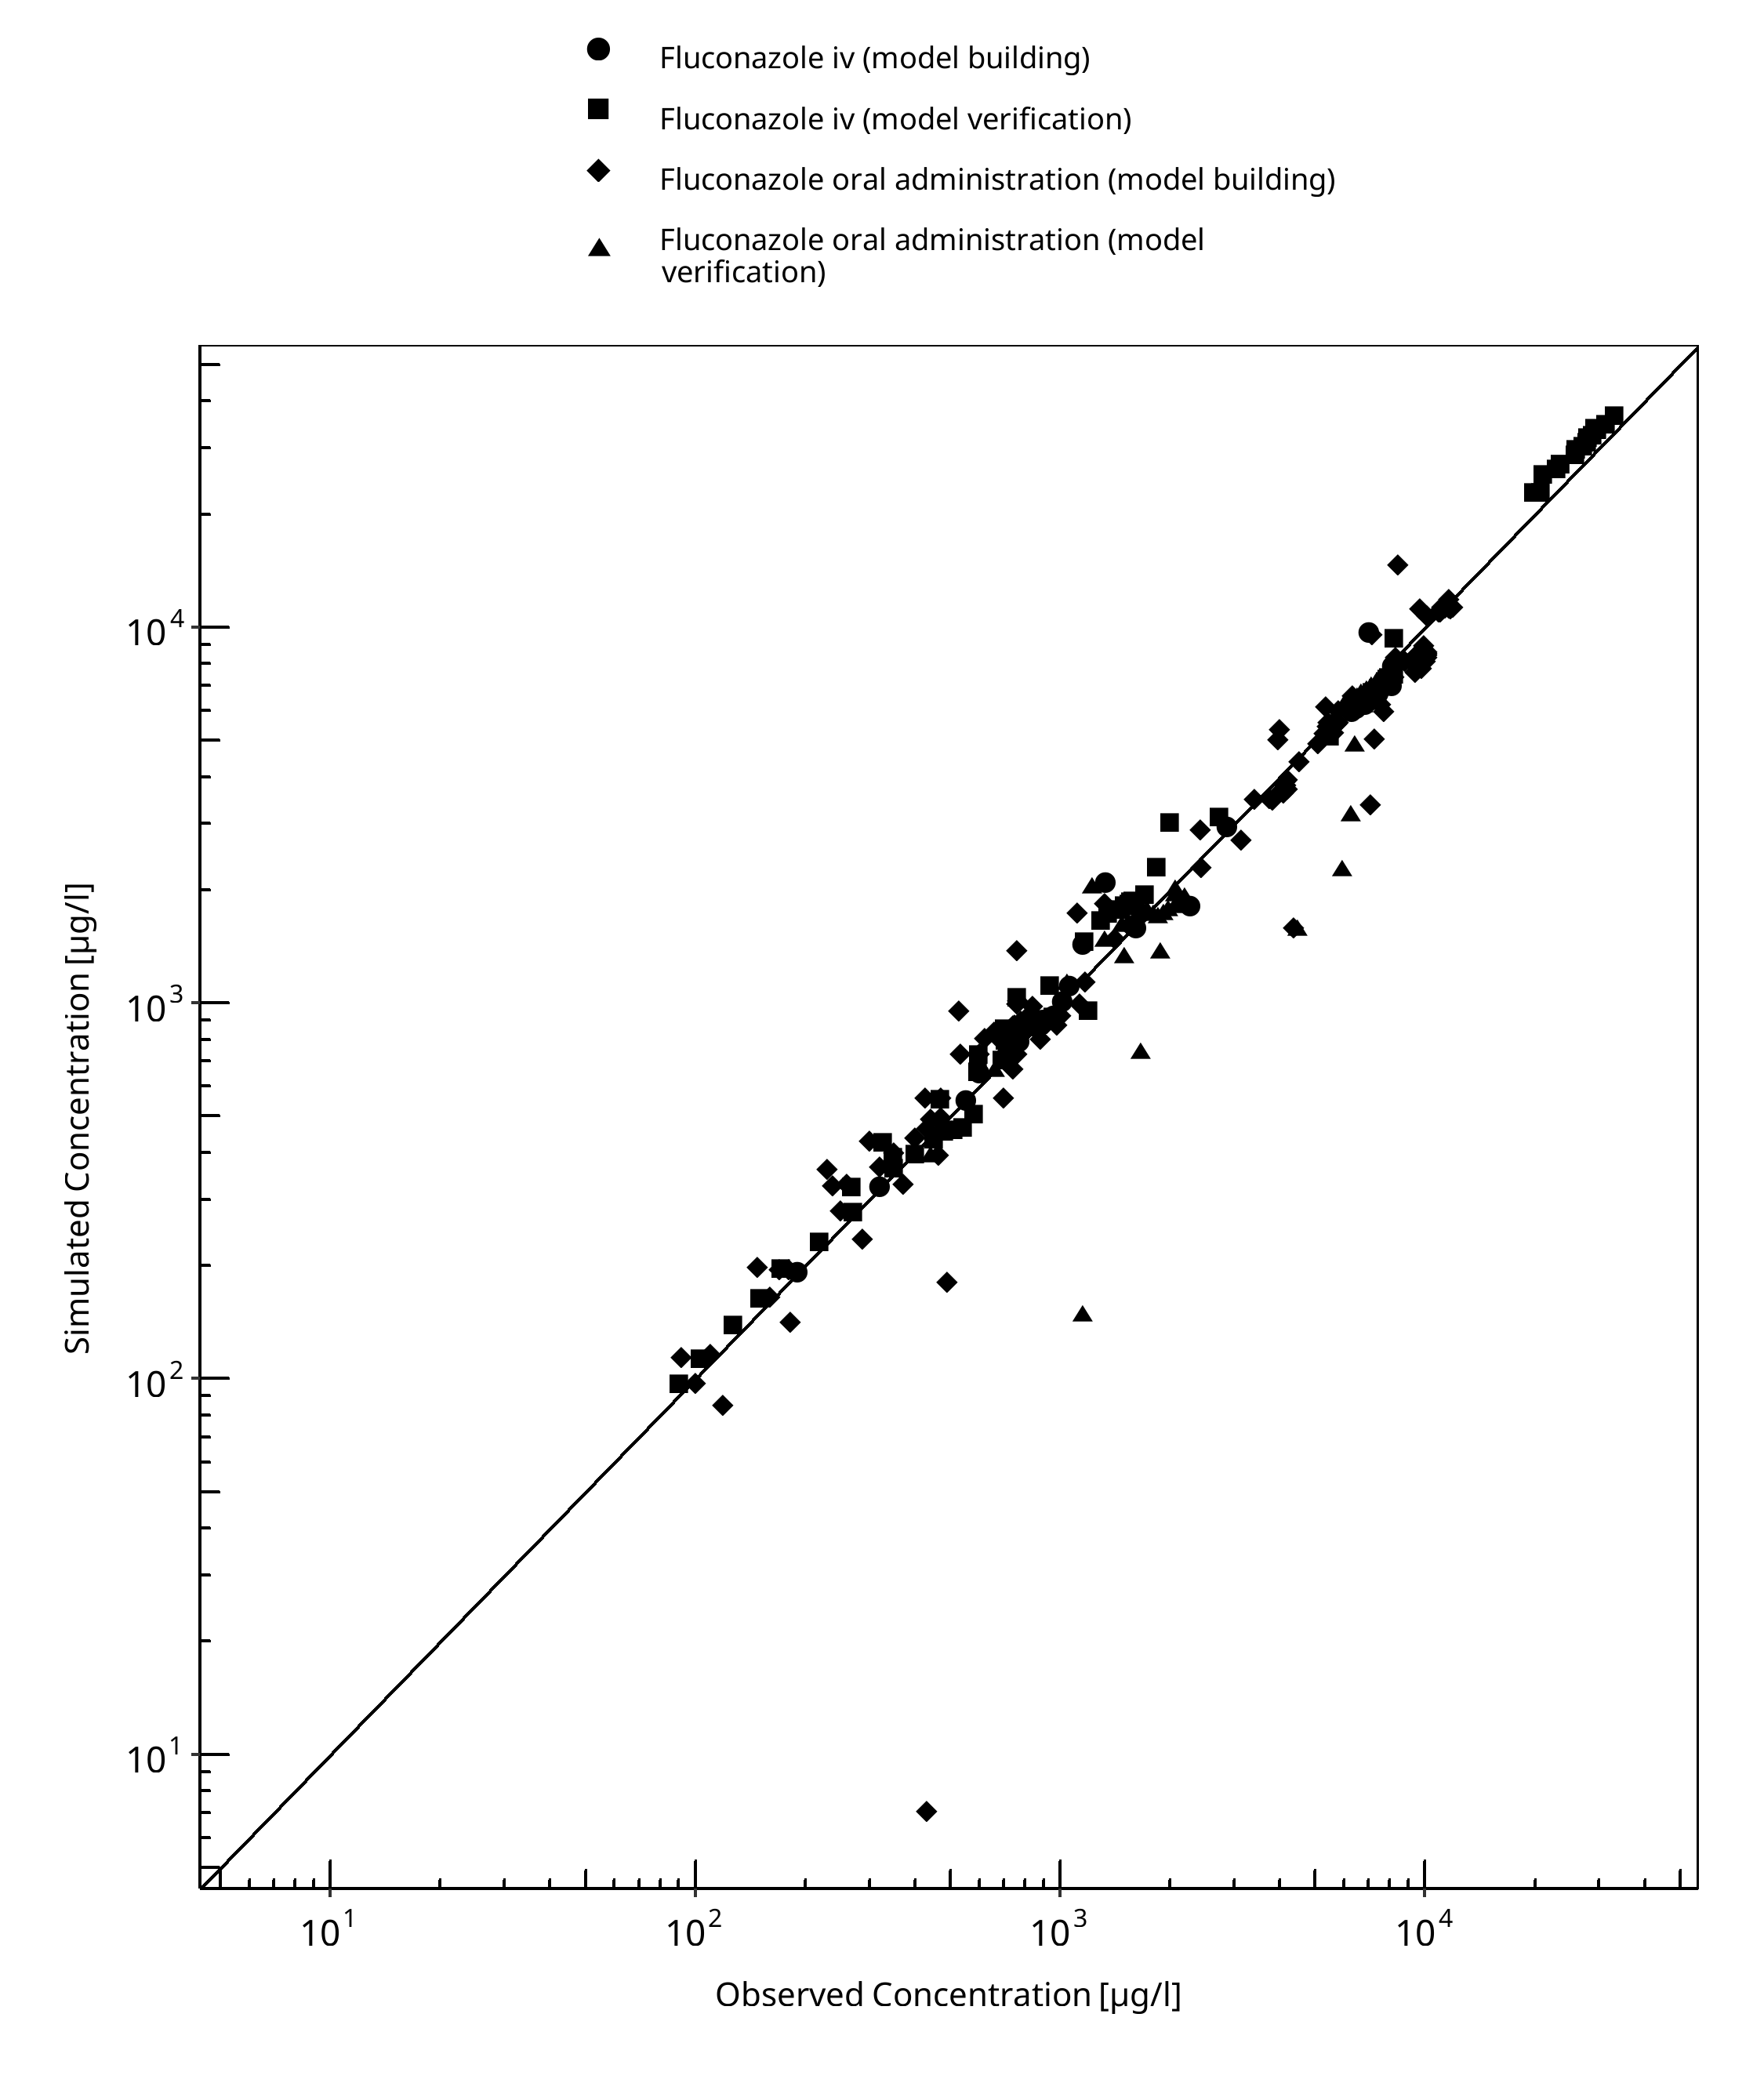
Figure 3-1: Goodness of fit plot for concentration in plasma.
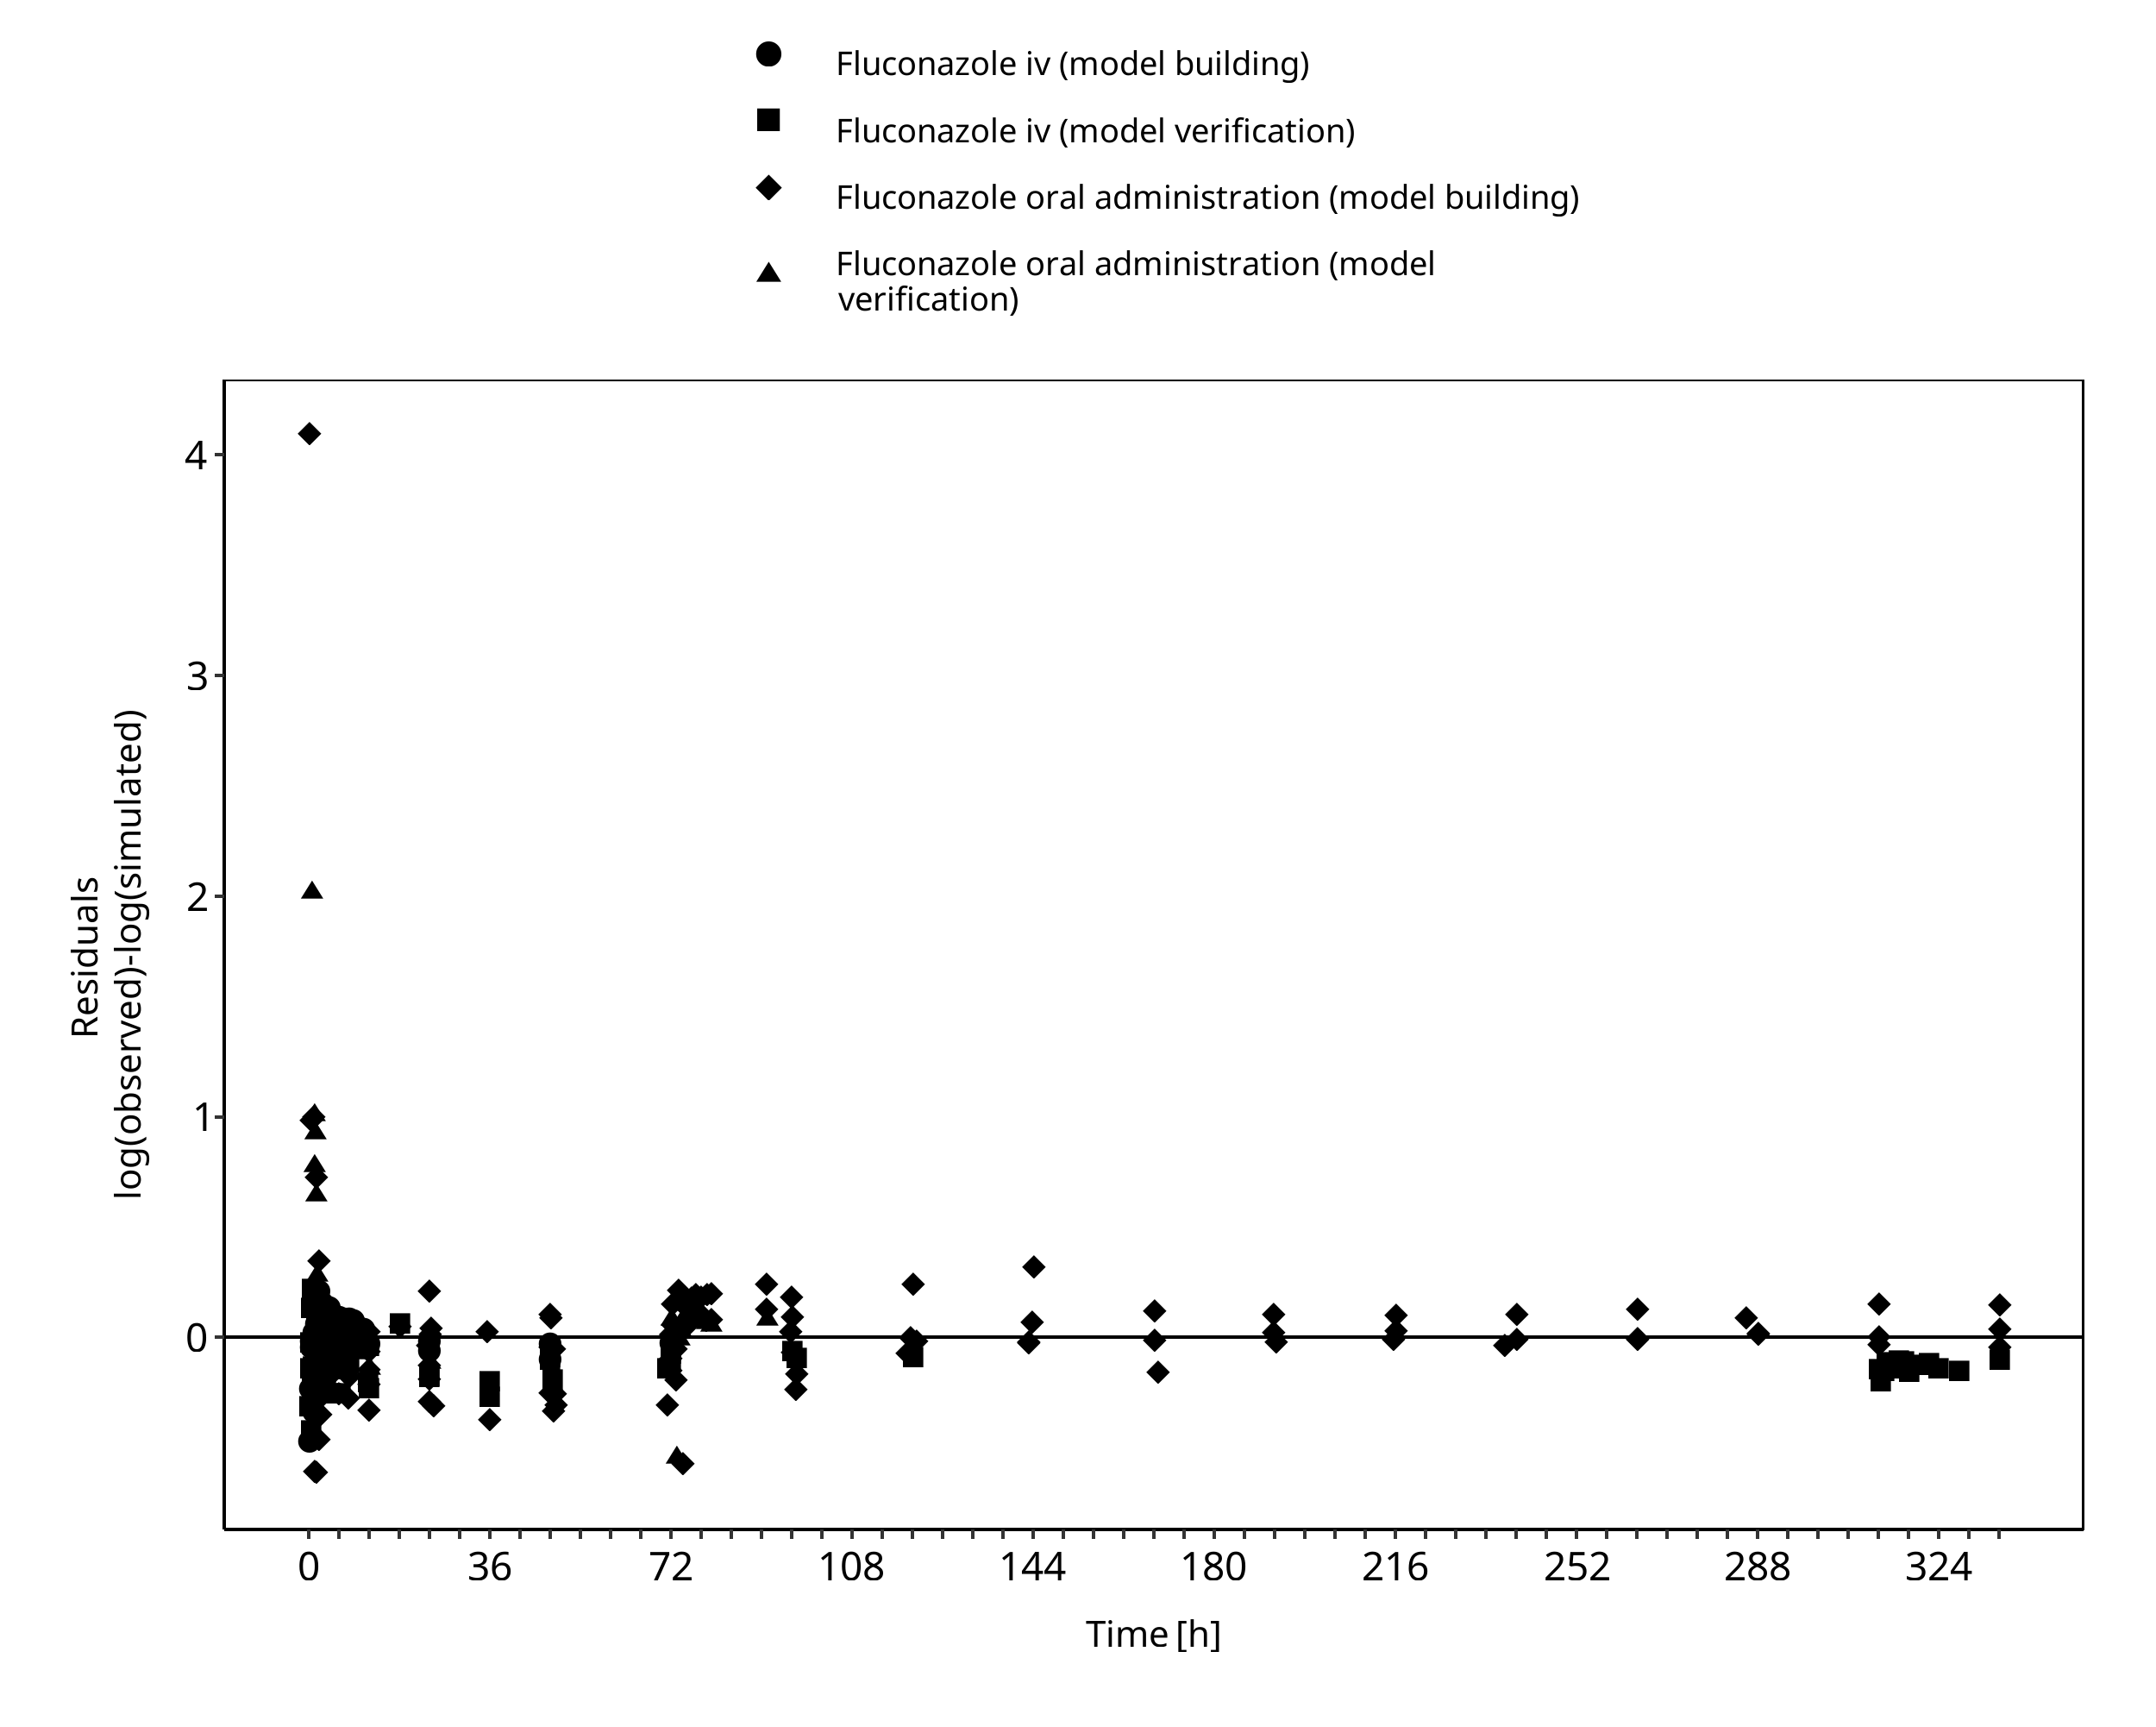
Figure 3-2: Goodness of fit plot for concentration in plasma.
3.3 Concentration-Time Profiles
Simulated versus observed concentration-time profiles of all data listed in Section 2.2.2 are presented below.
3.3.1 Model Building
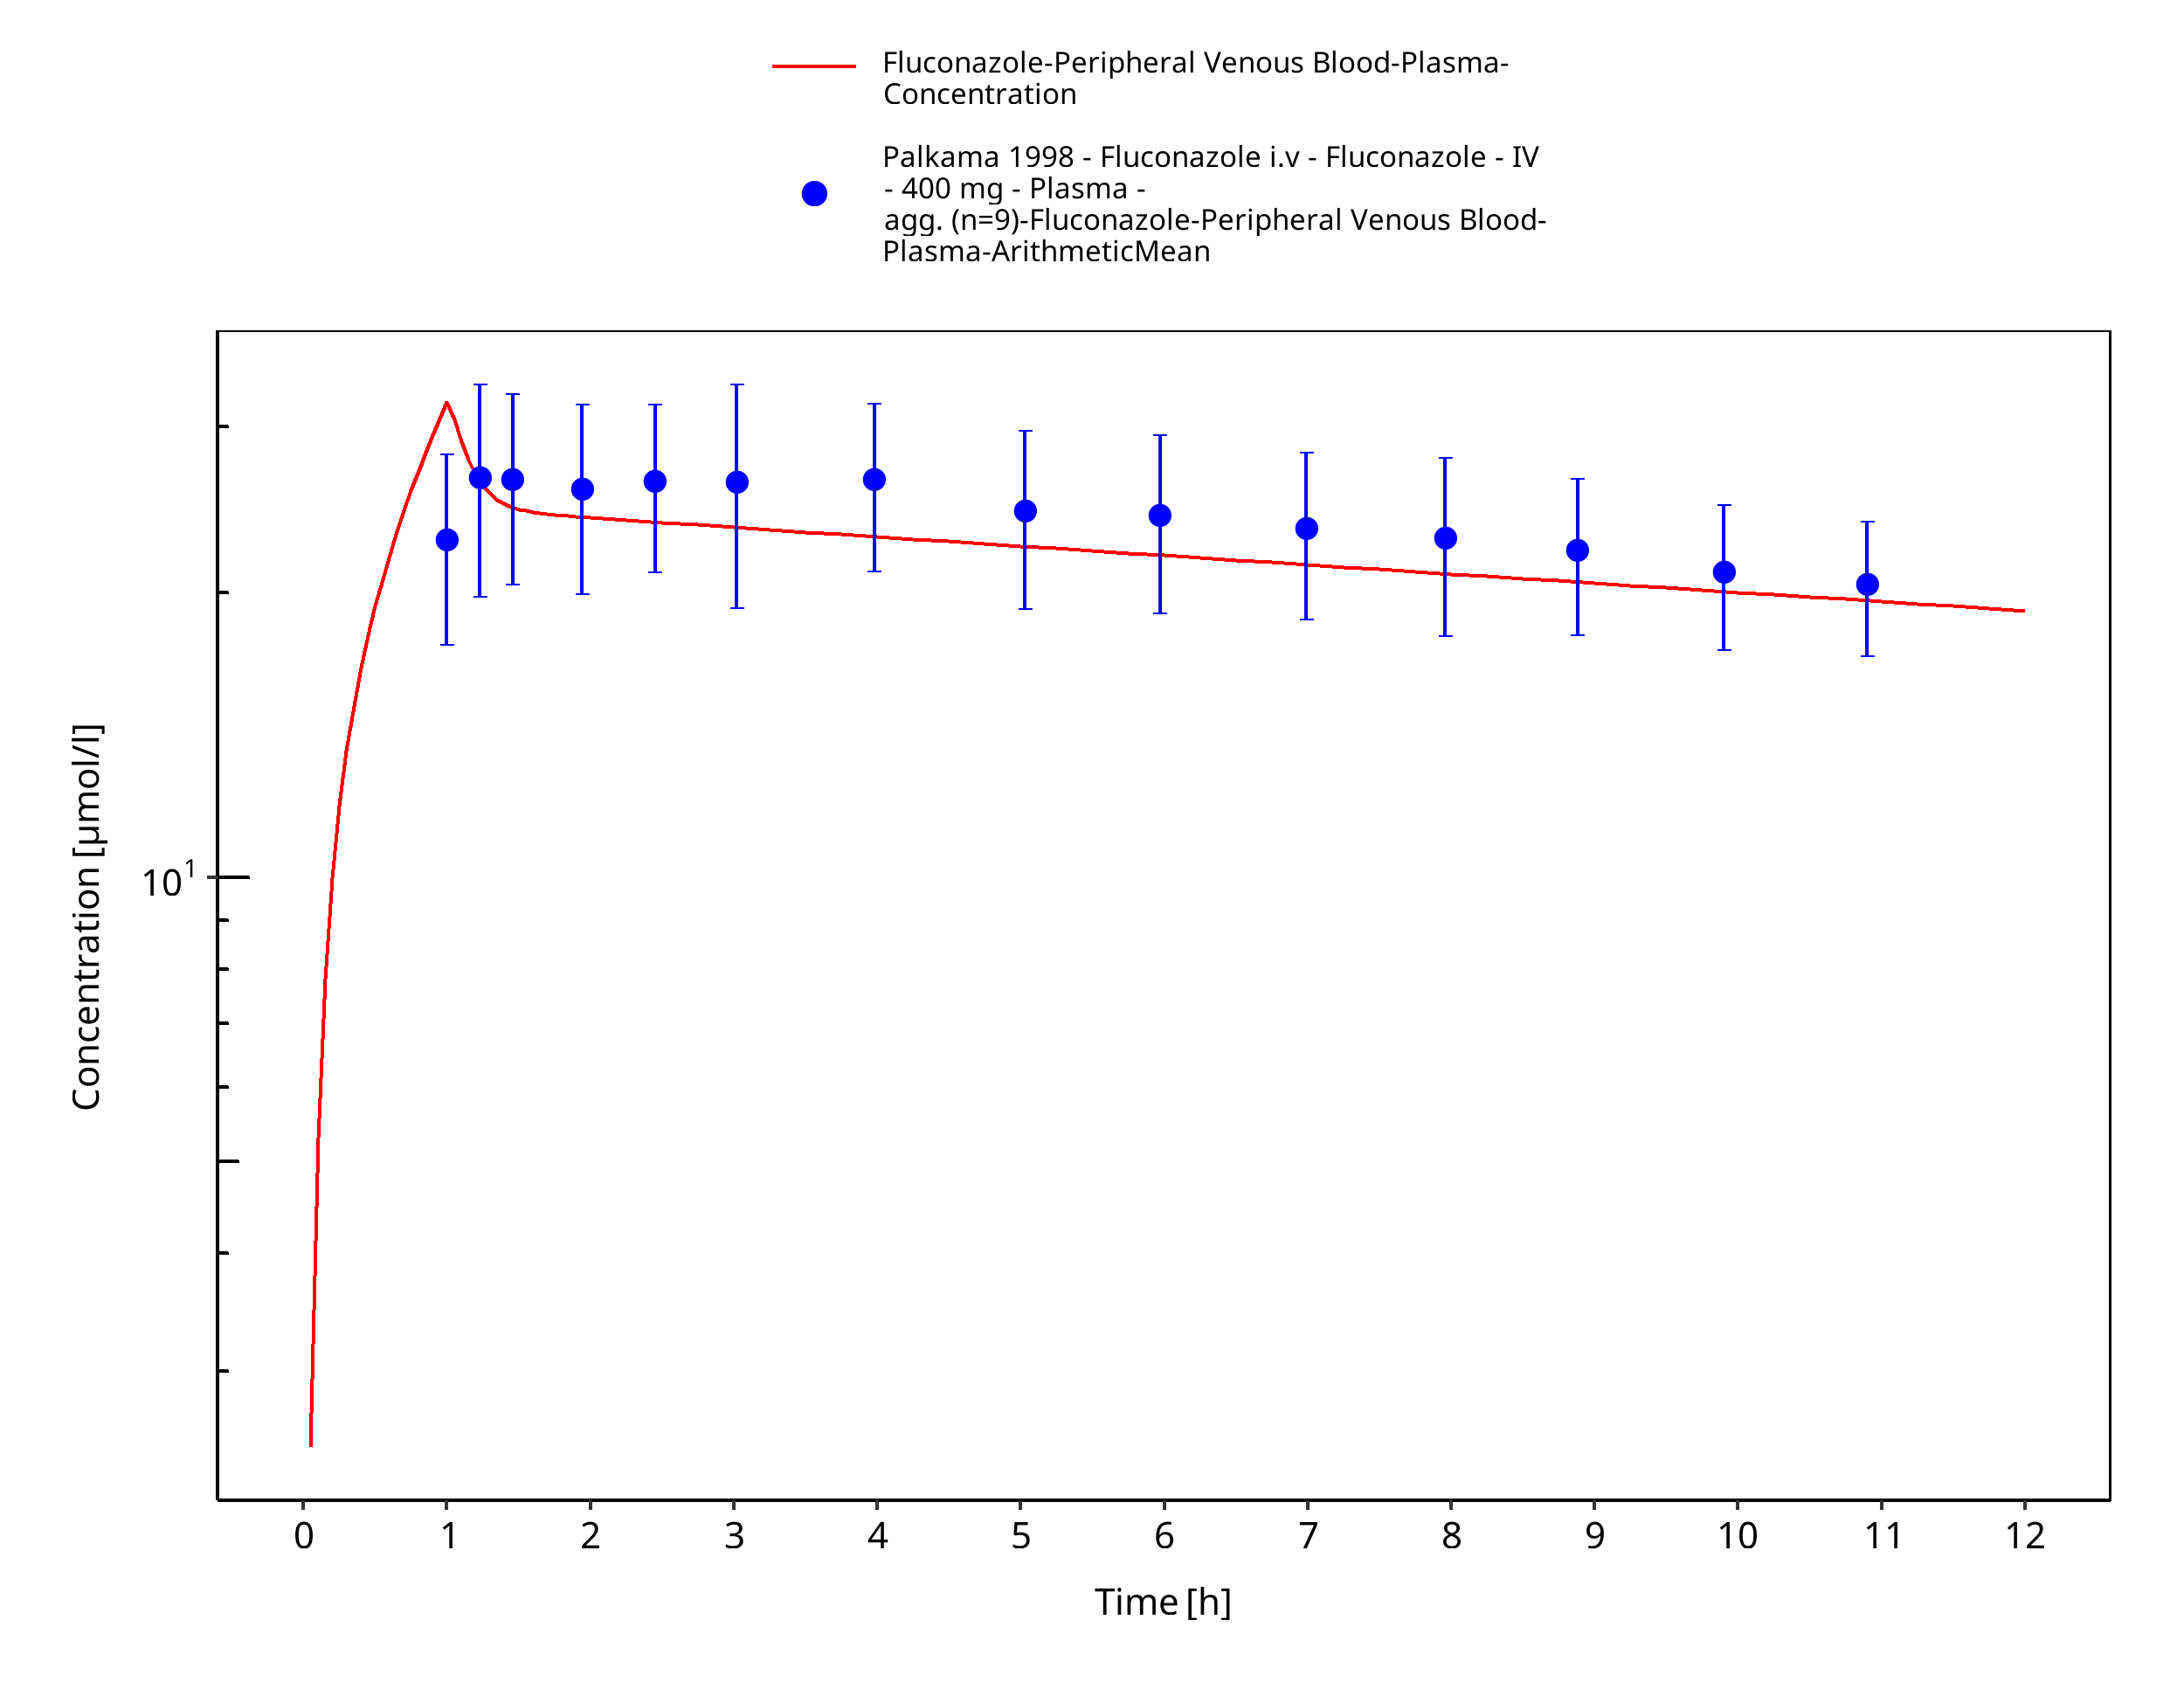
Figure 3-3: Time Profile Analysis
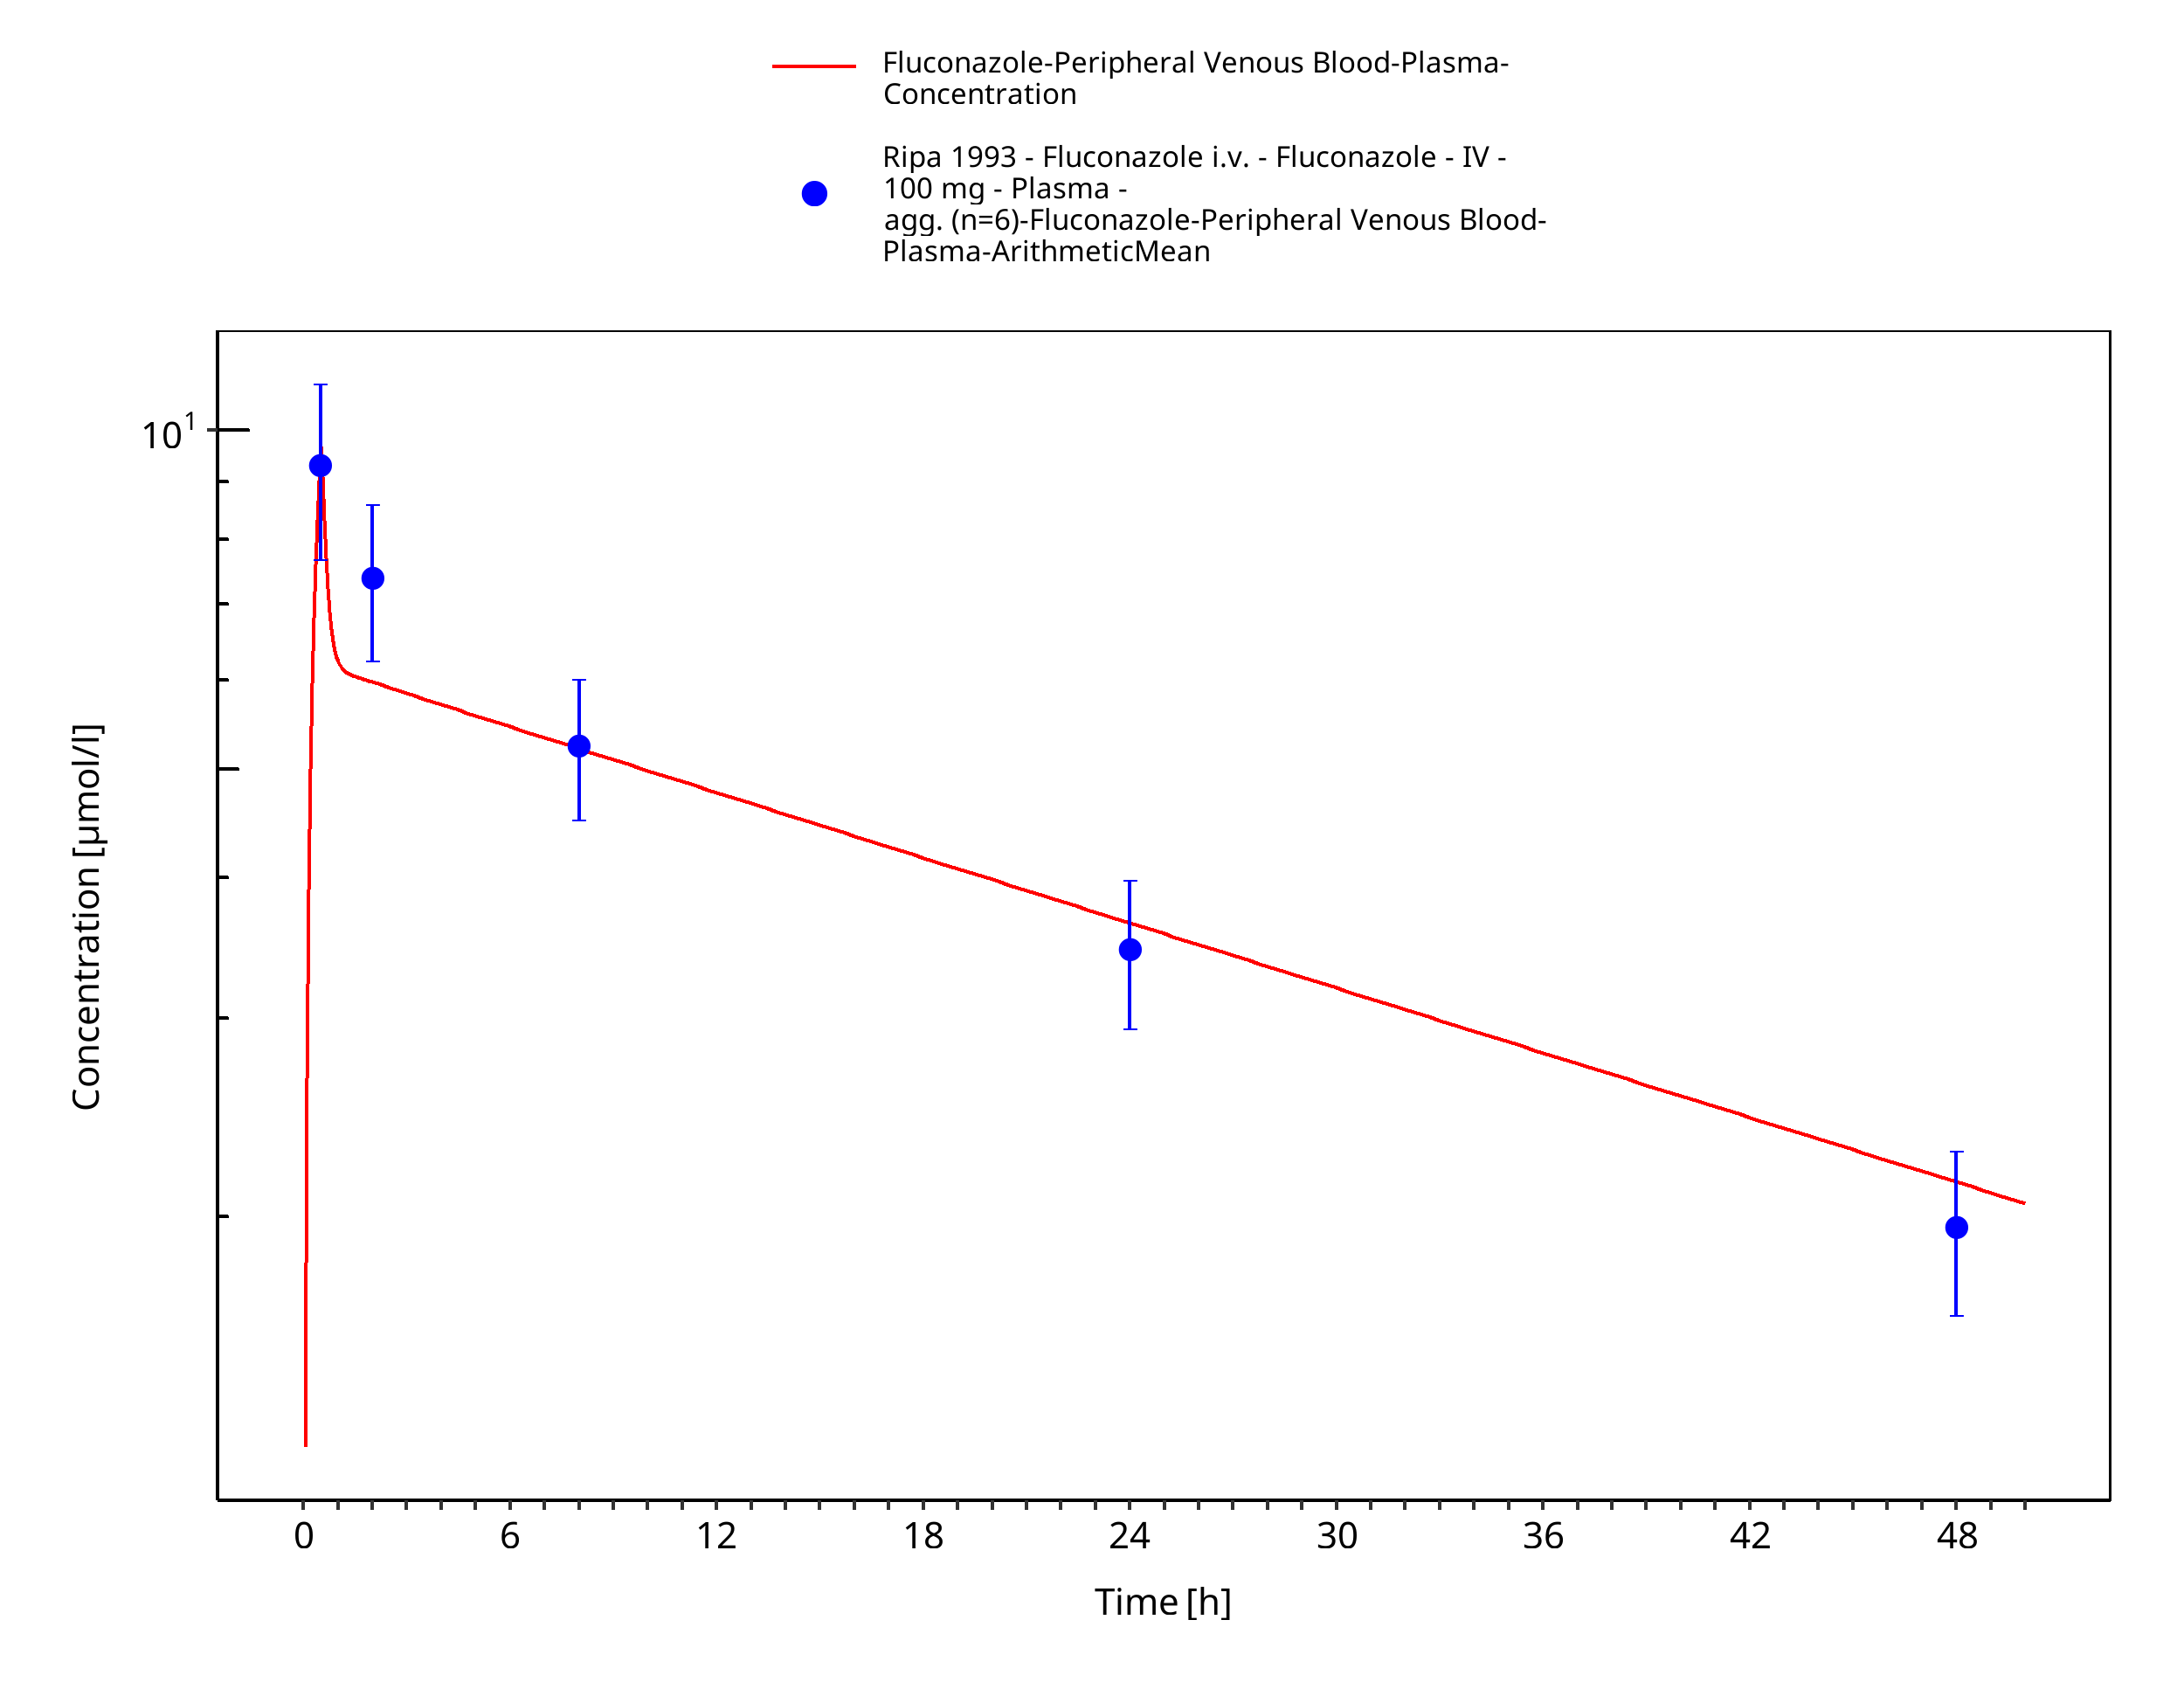
Figure 3-4: Time Profile Analysis
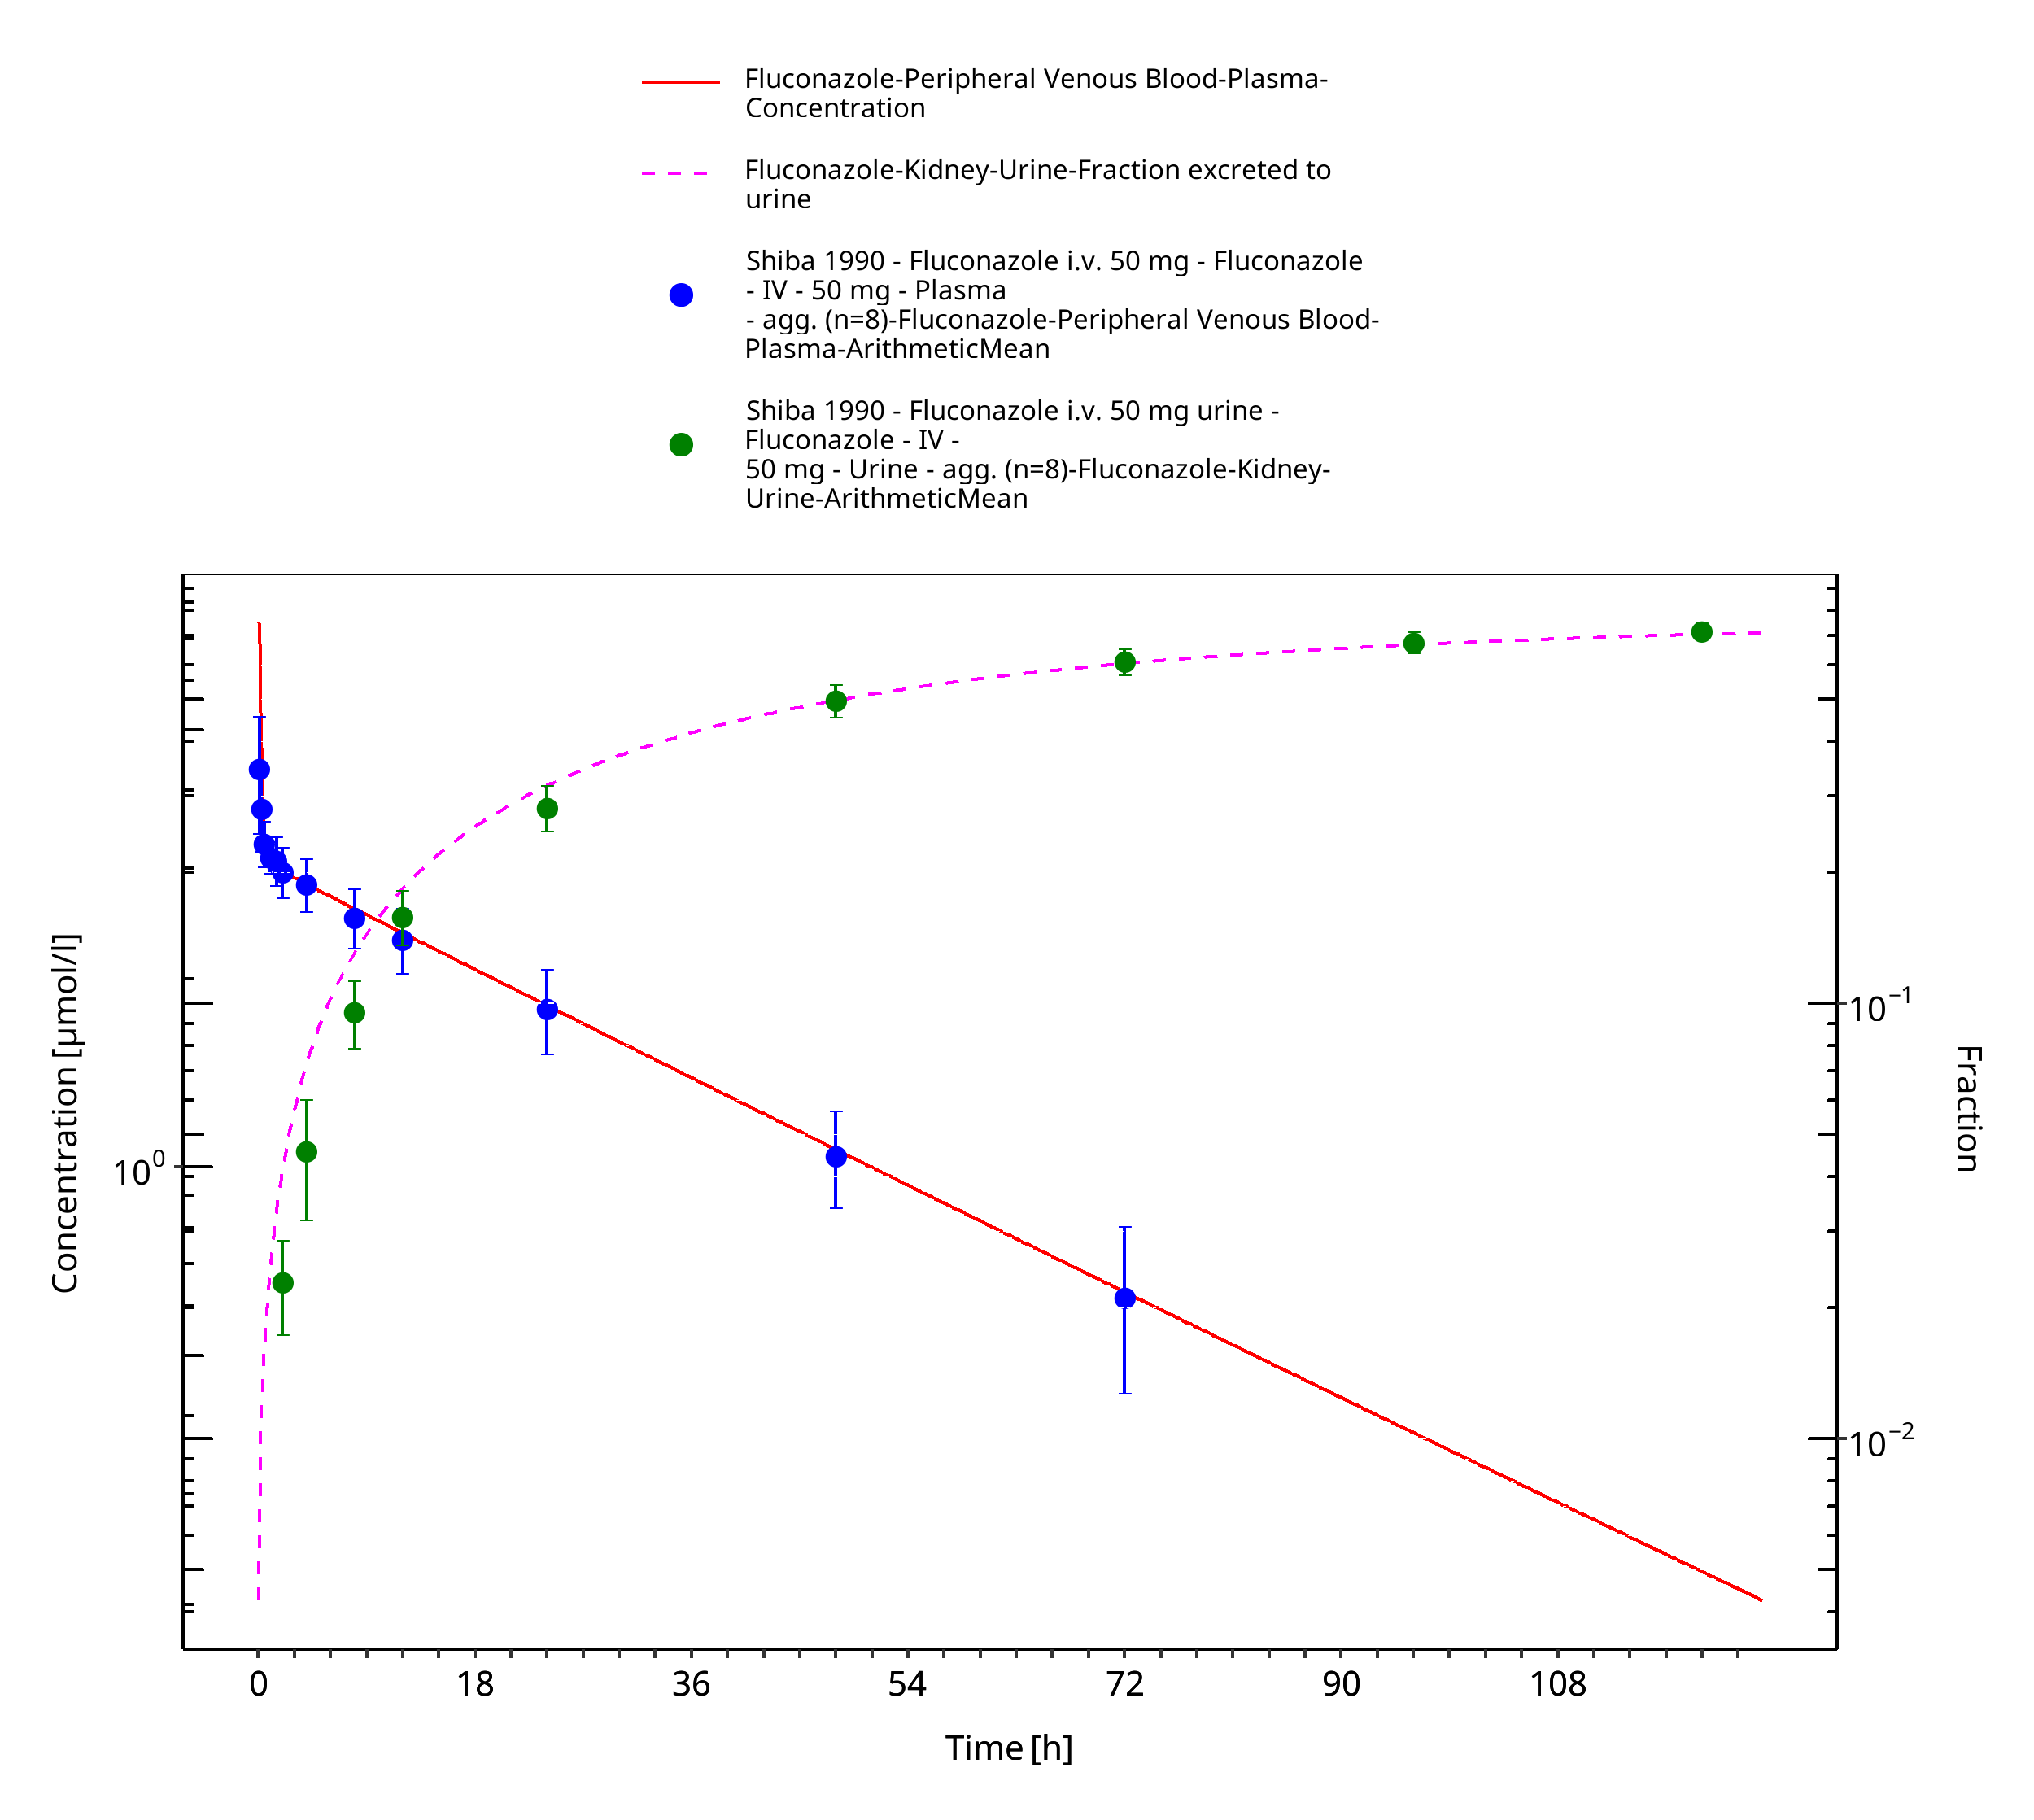
Figure 3-5: Time Profile Analysis
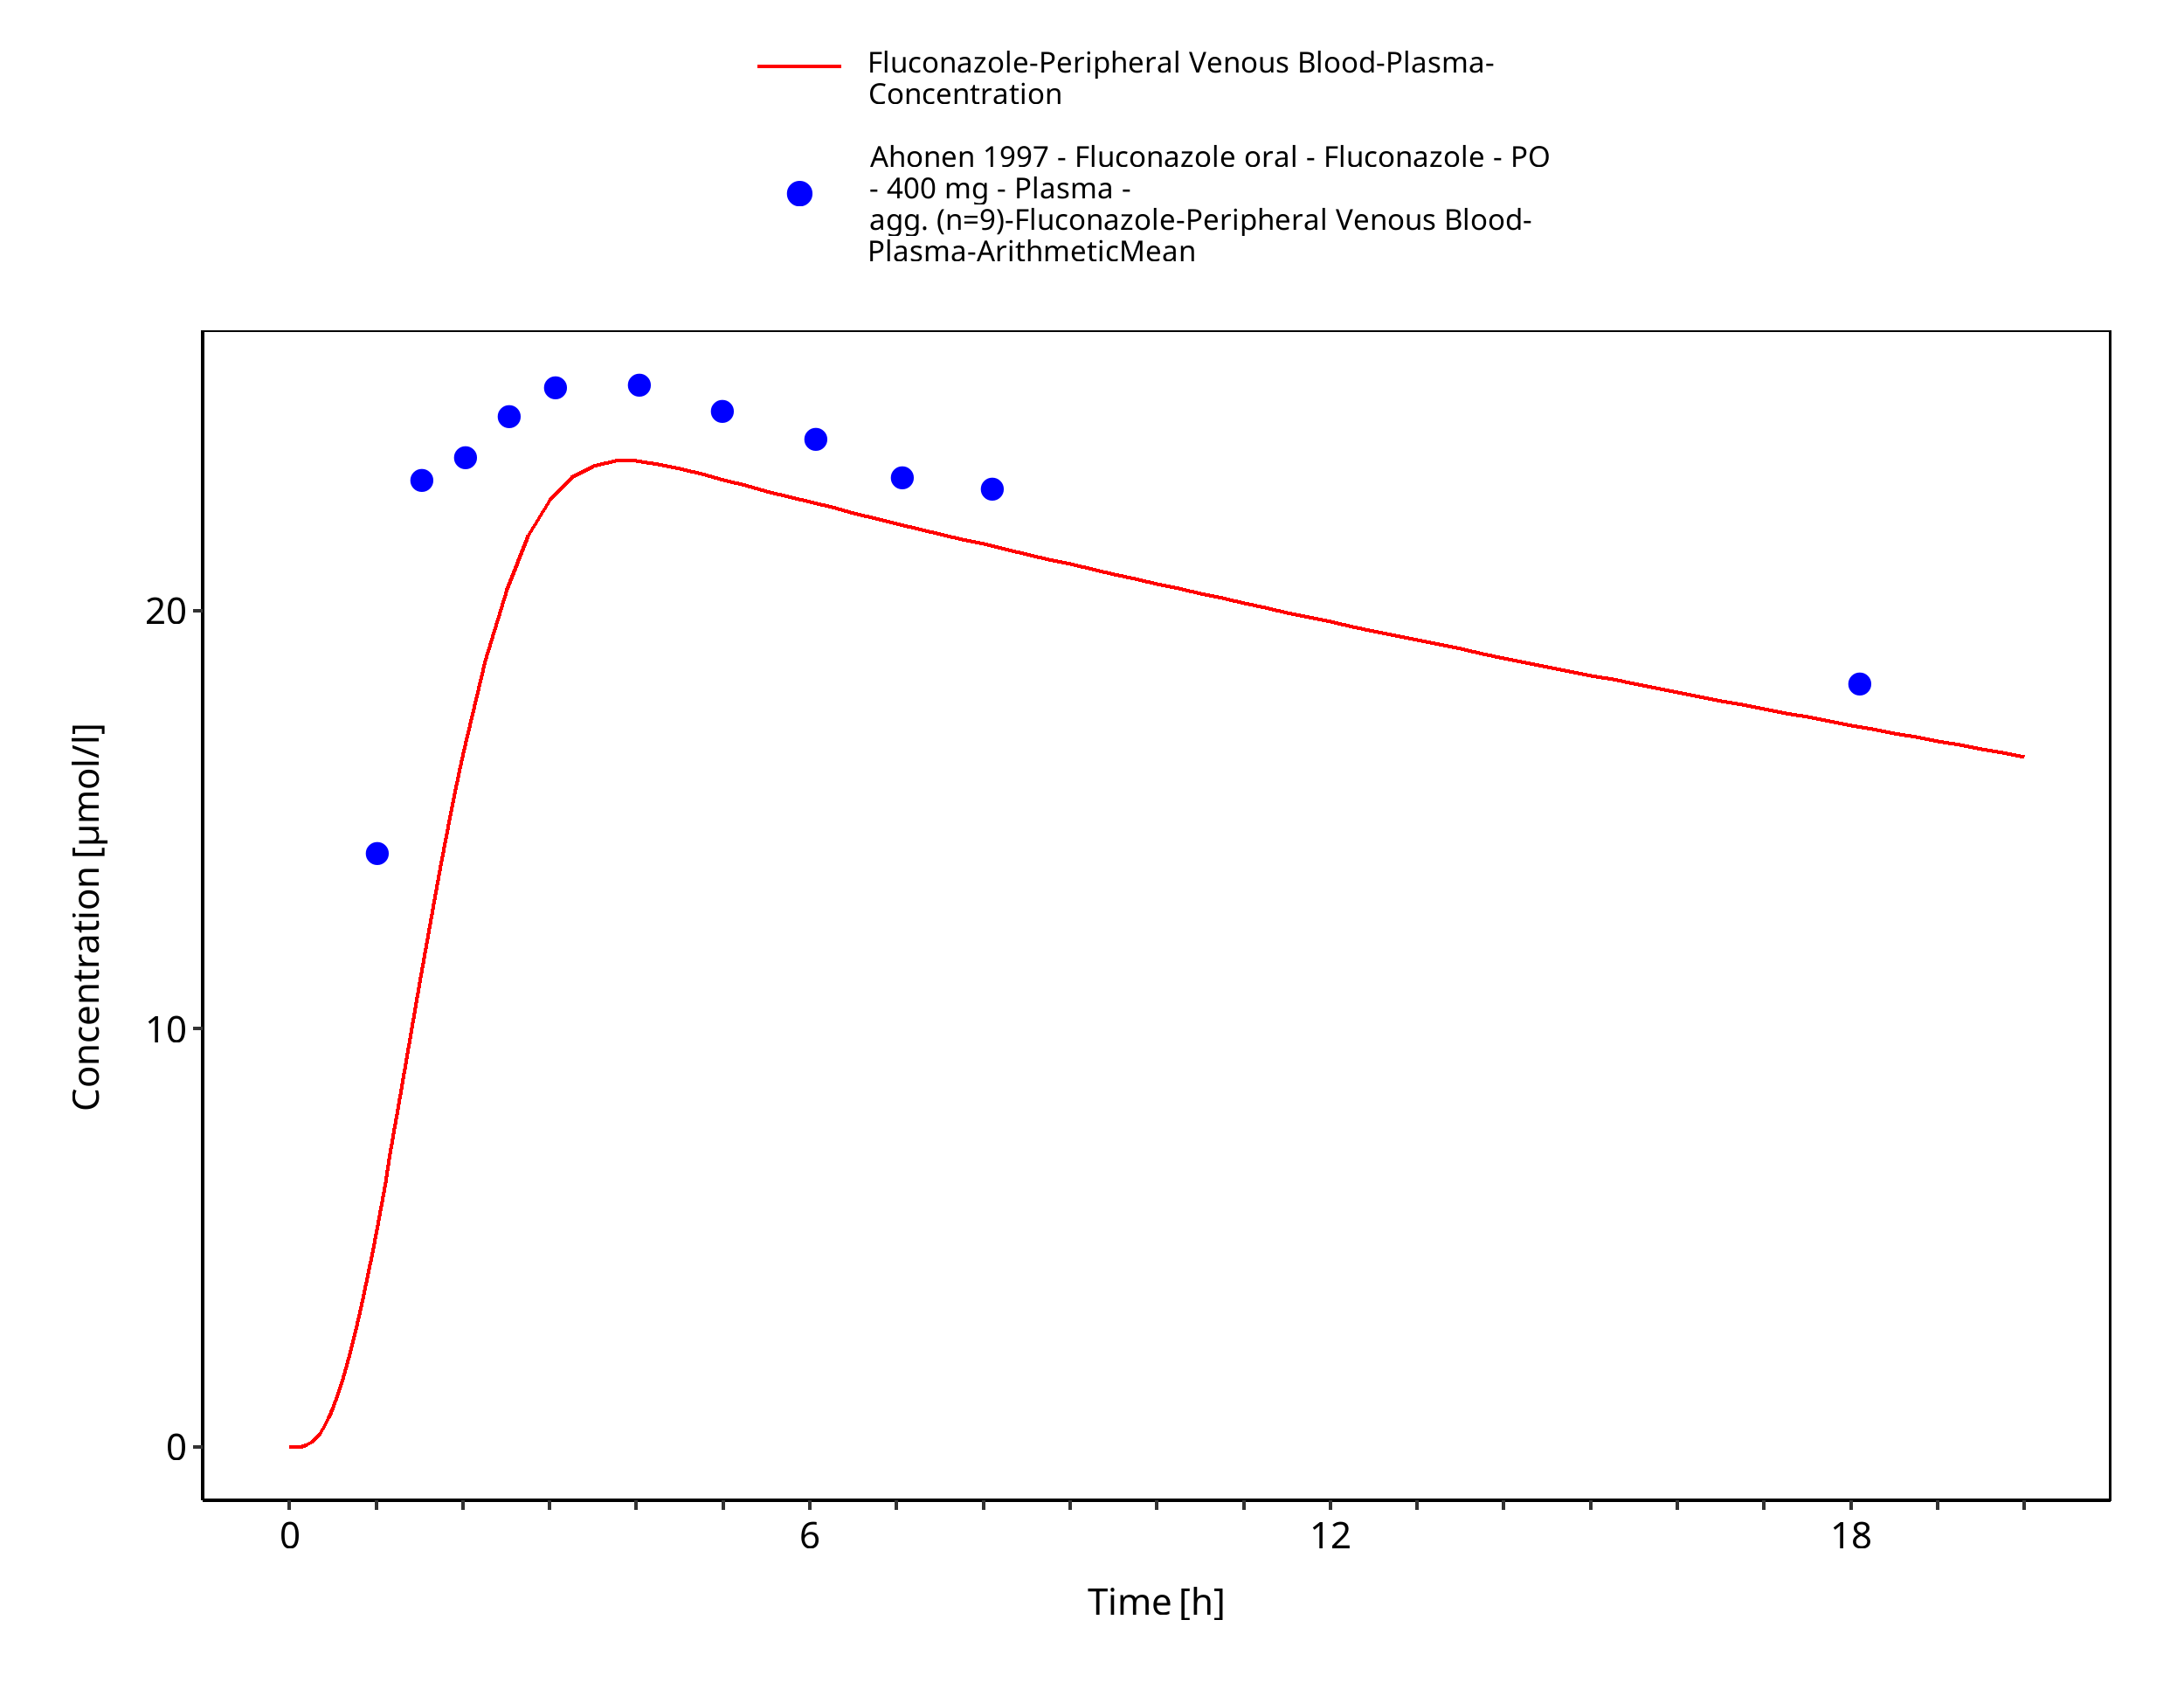
Figure 3-6: Time Profile Analysis
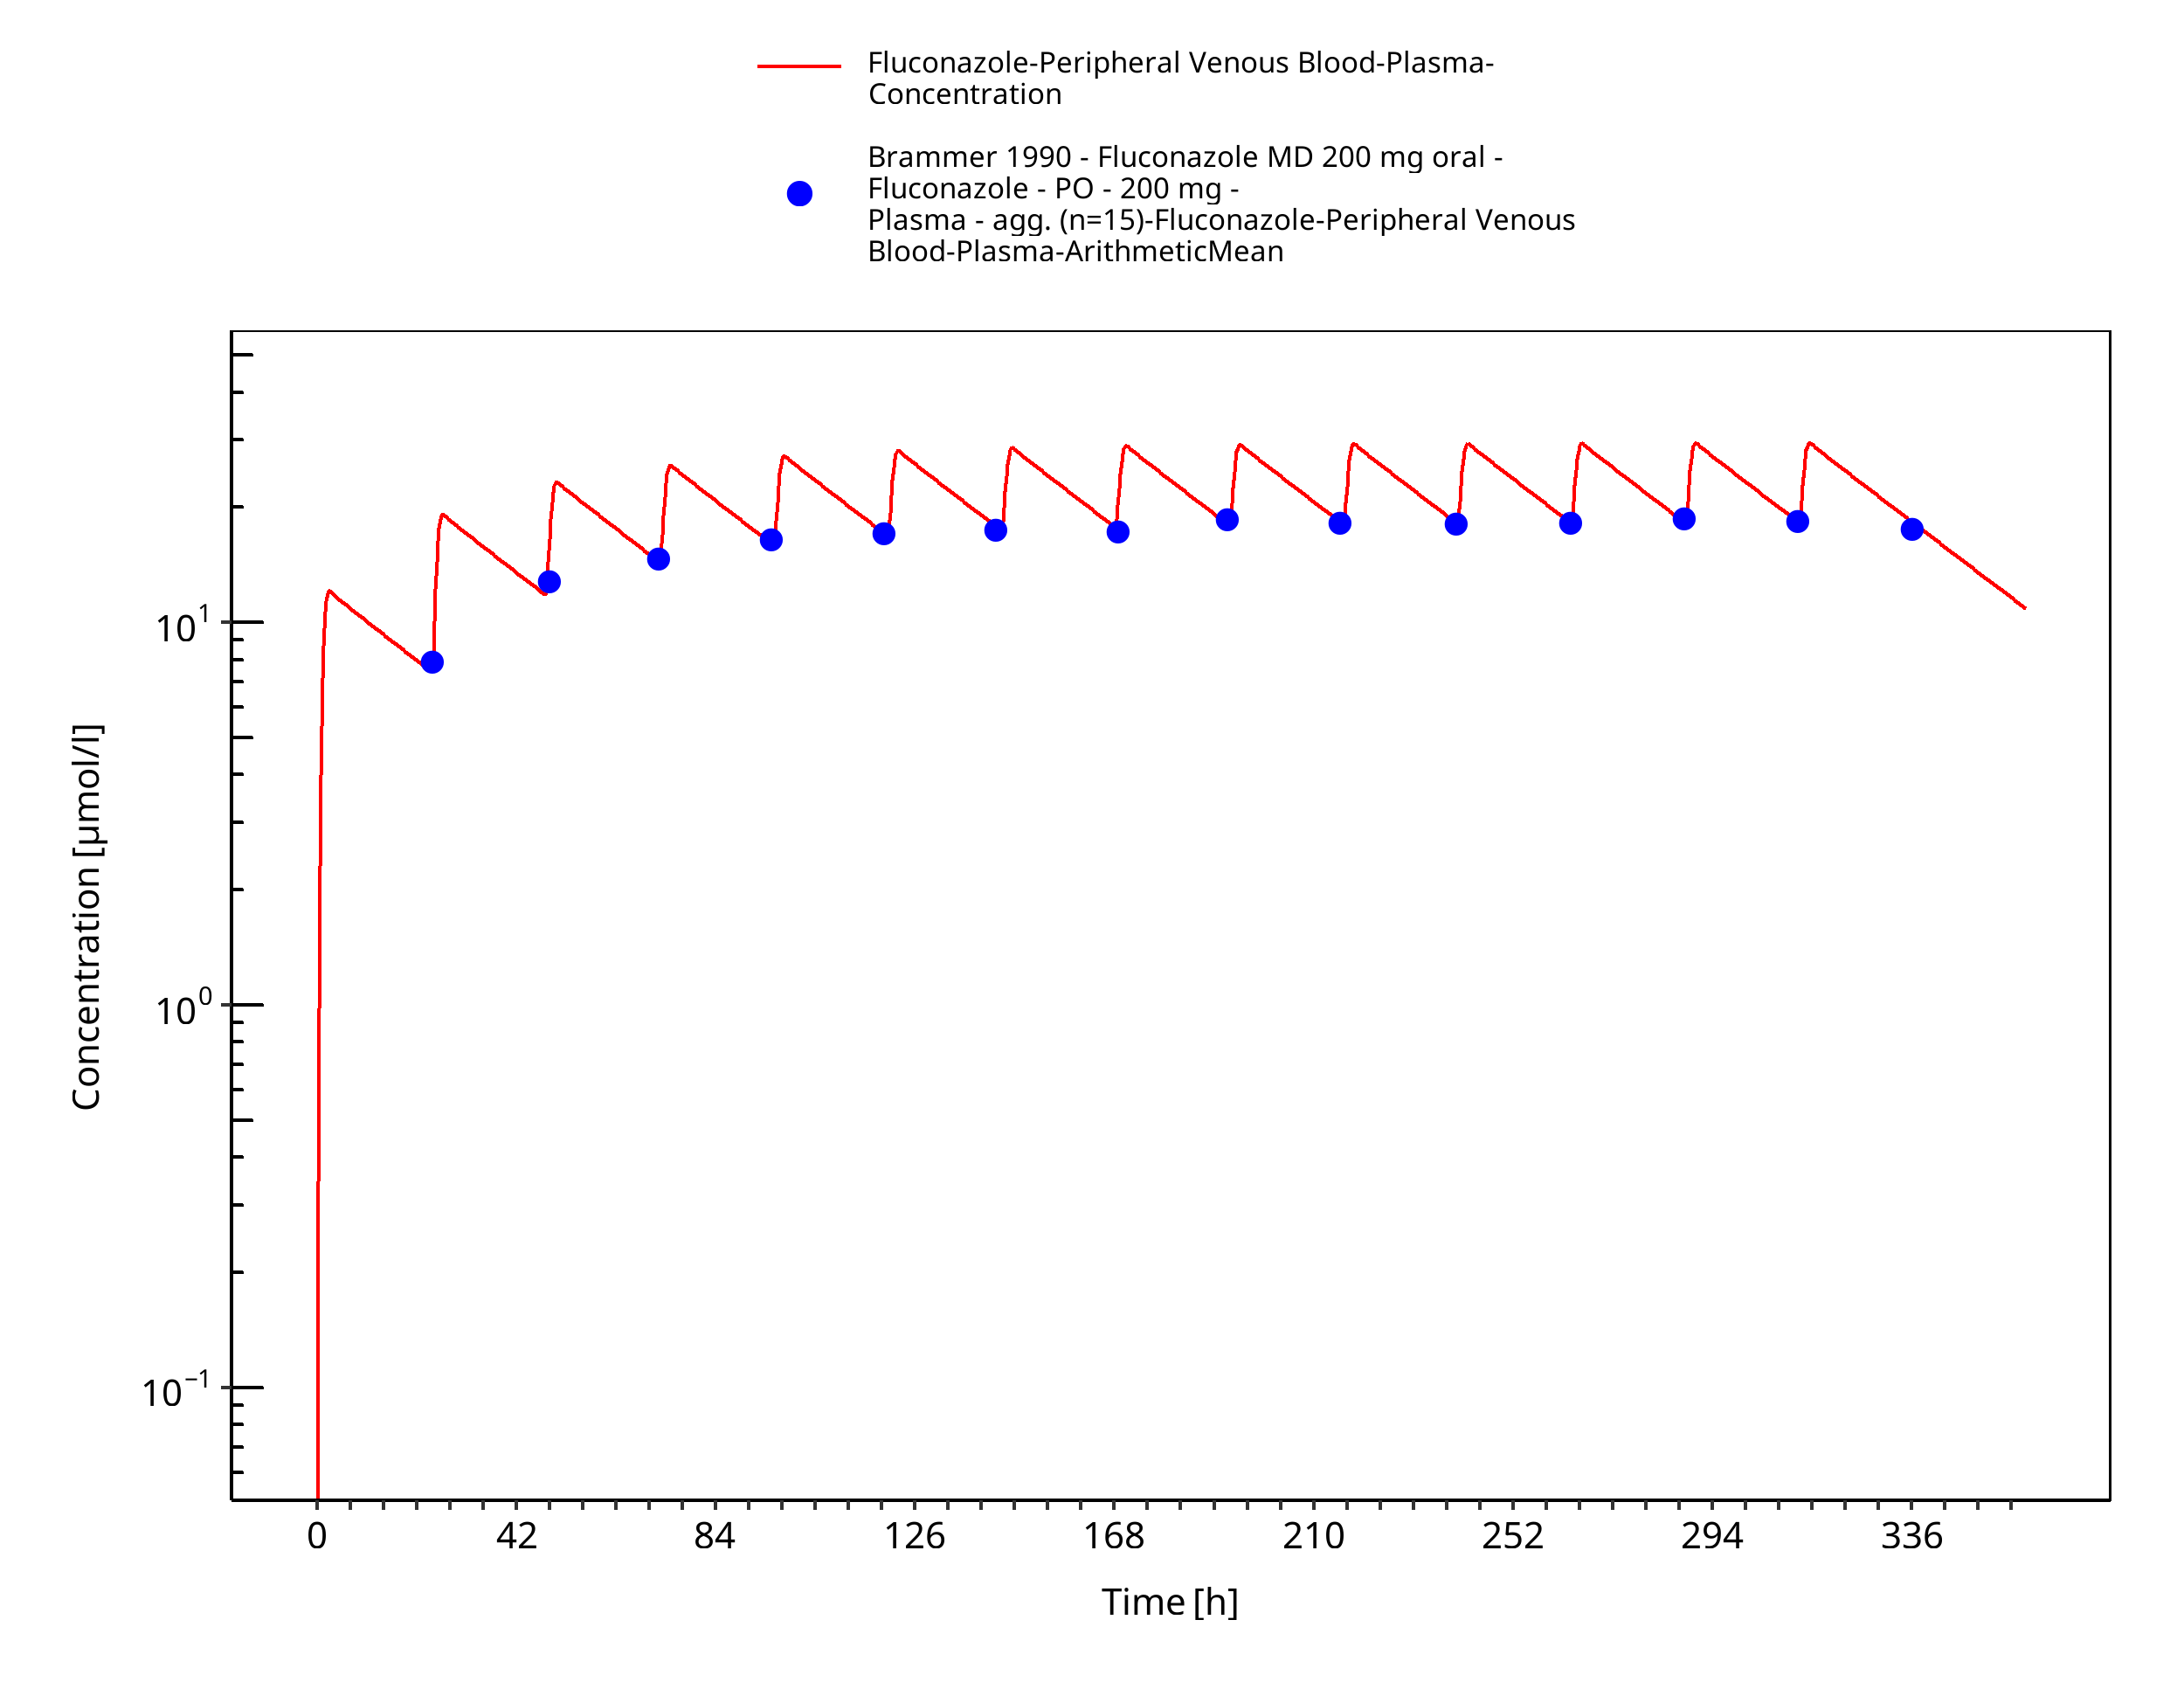
Figure 3-7: Time Profile Analysis
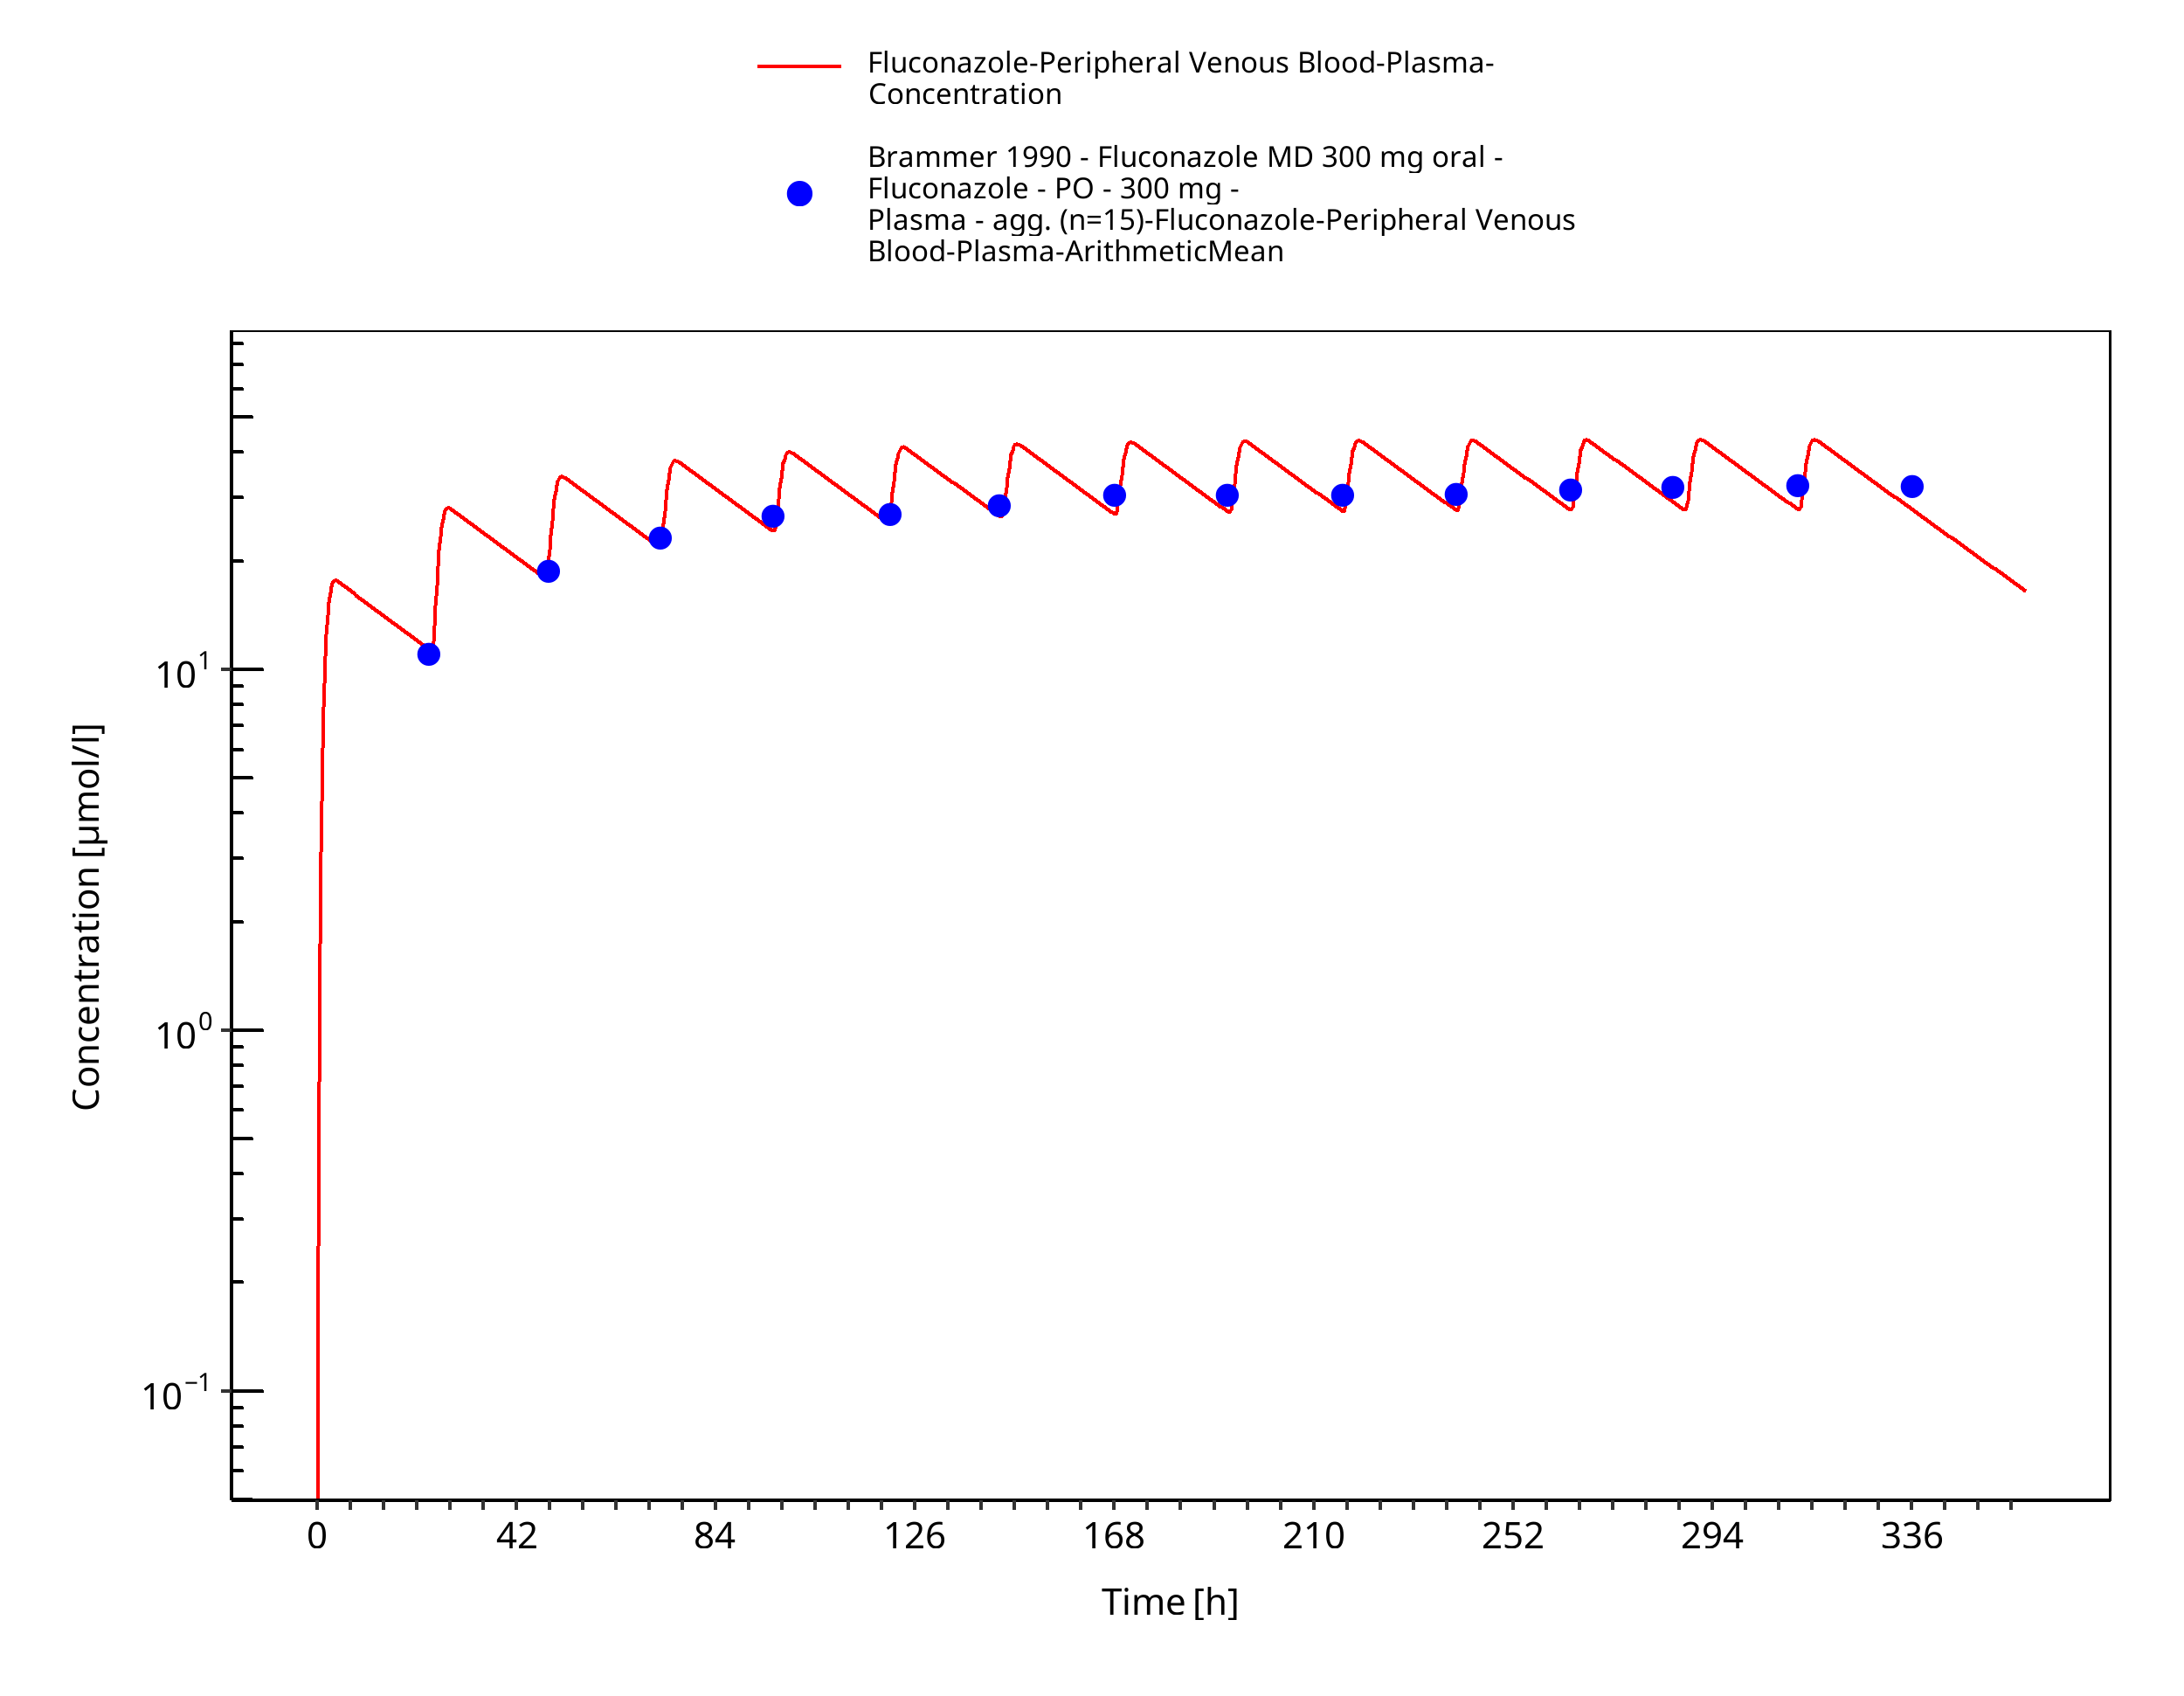
Figure 3-8: Time Profile Analysis
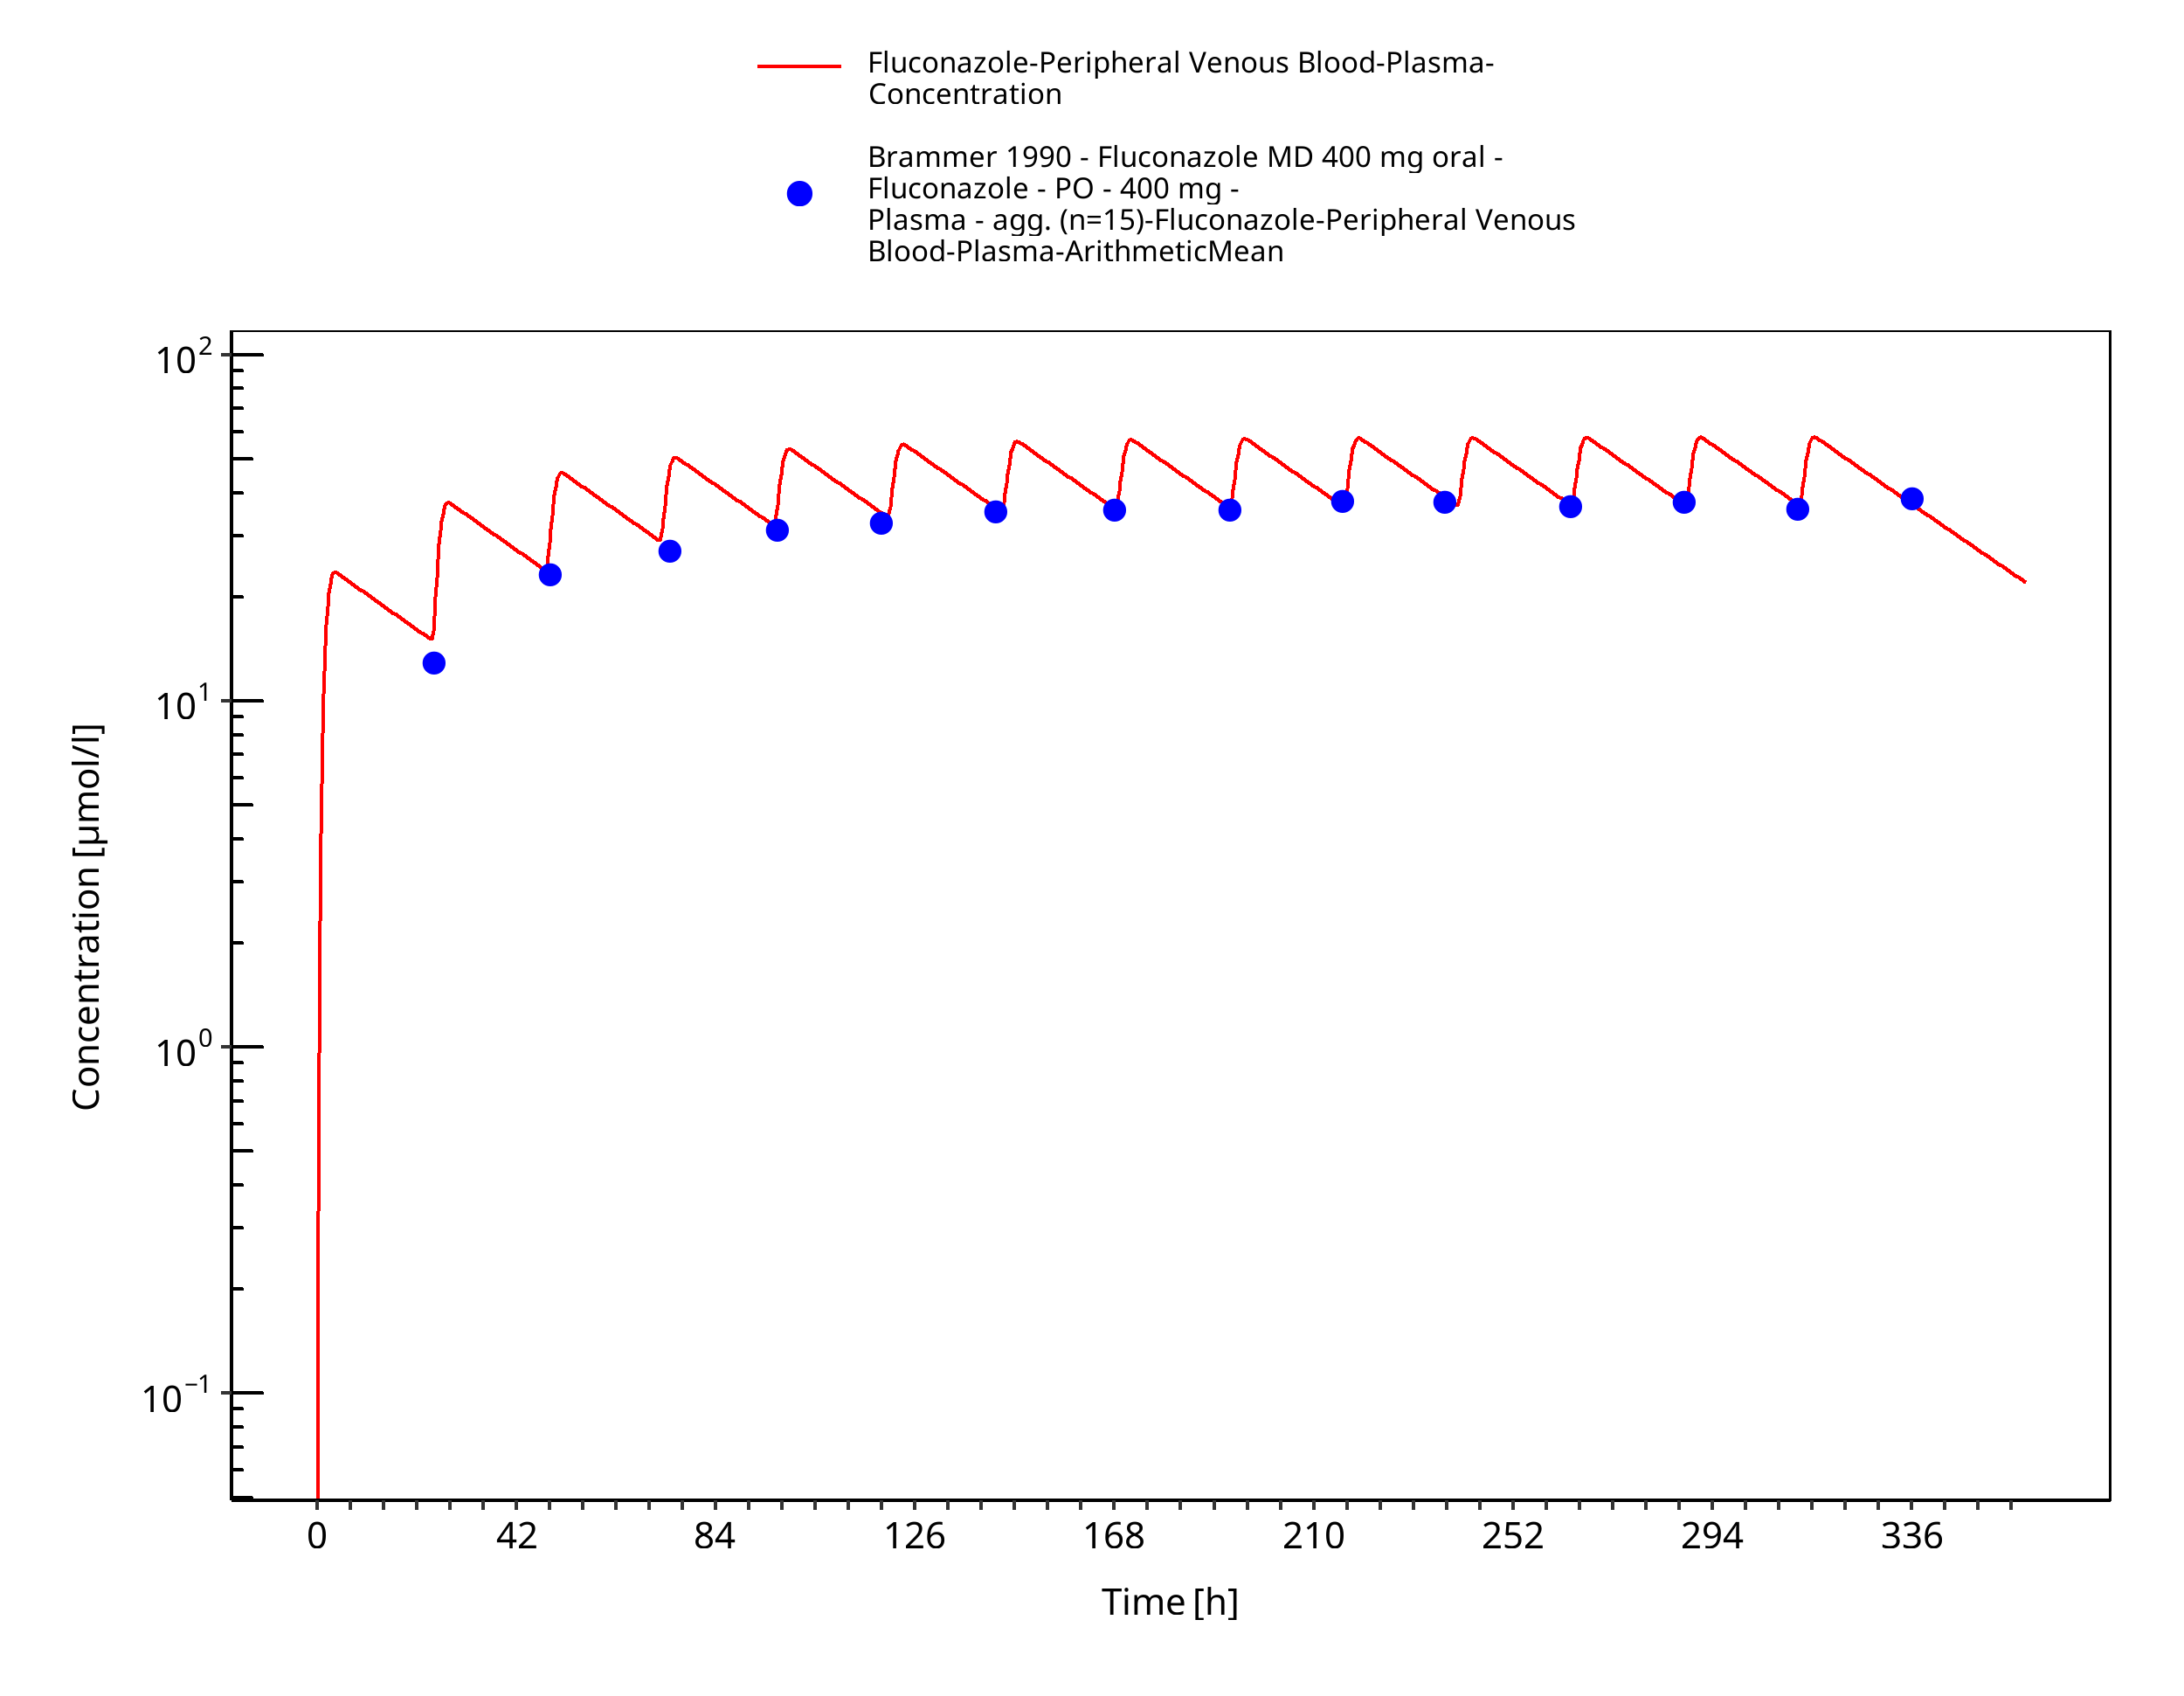
Figure 3-9: Time Profile Analysis
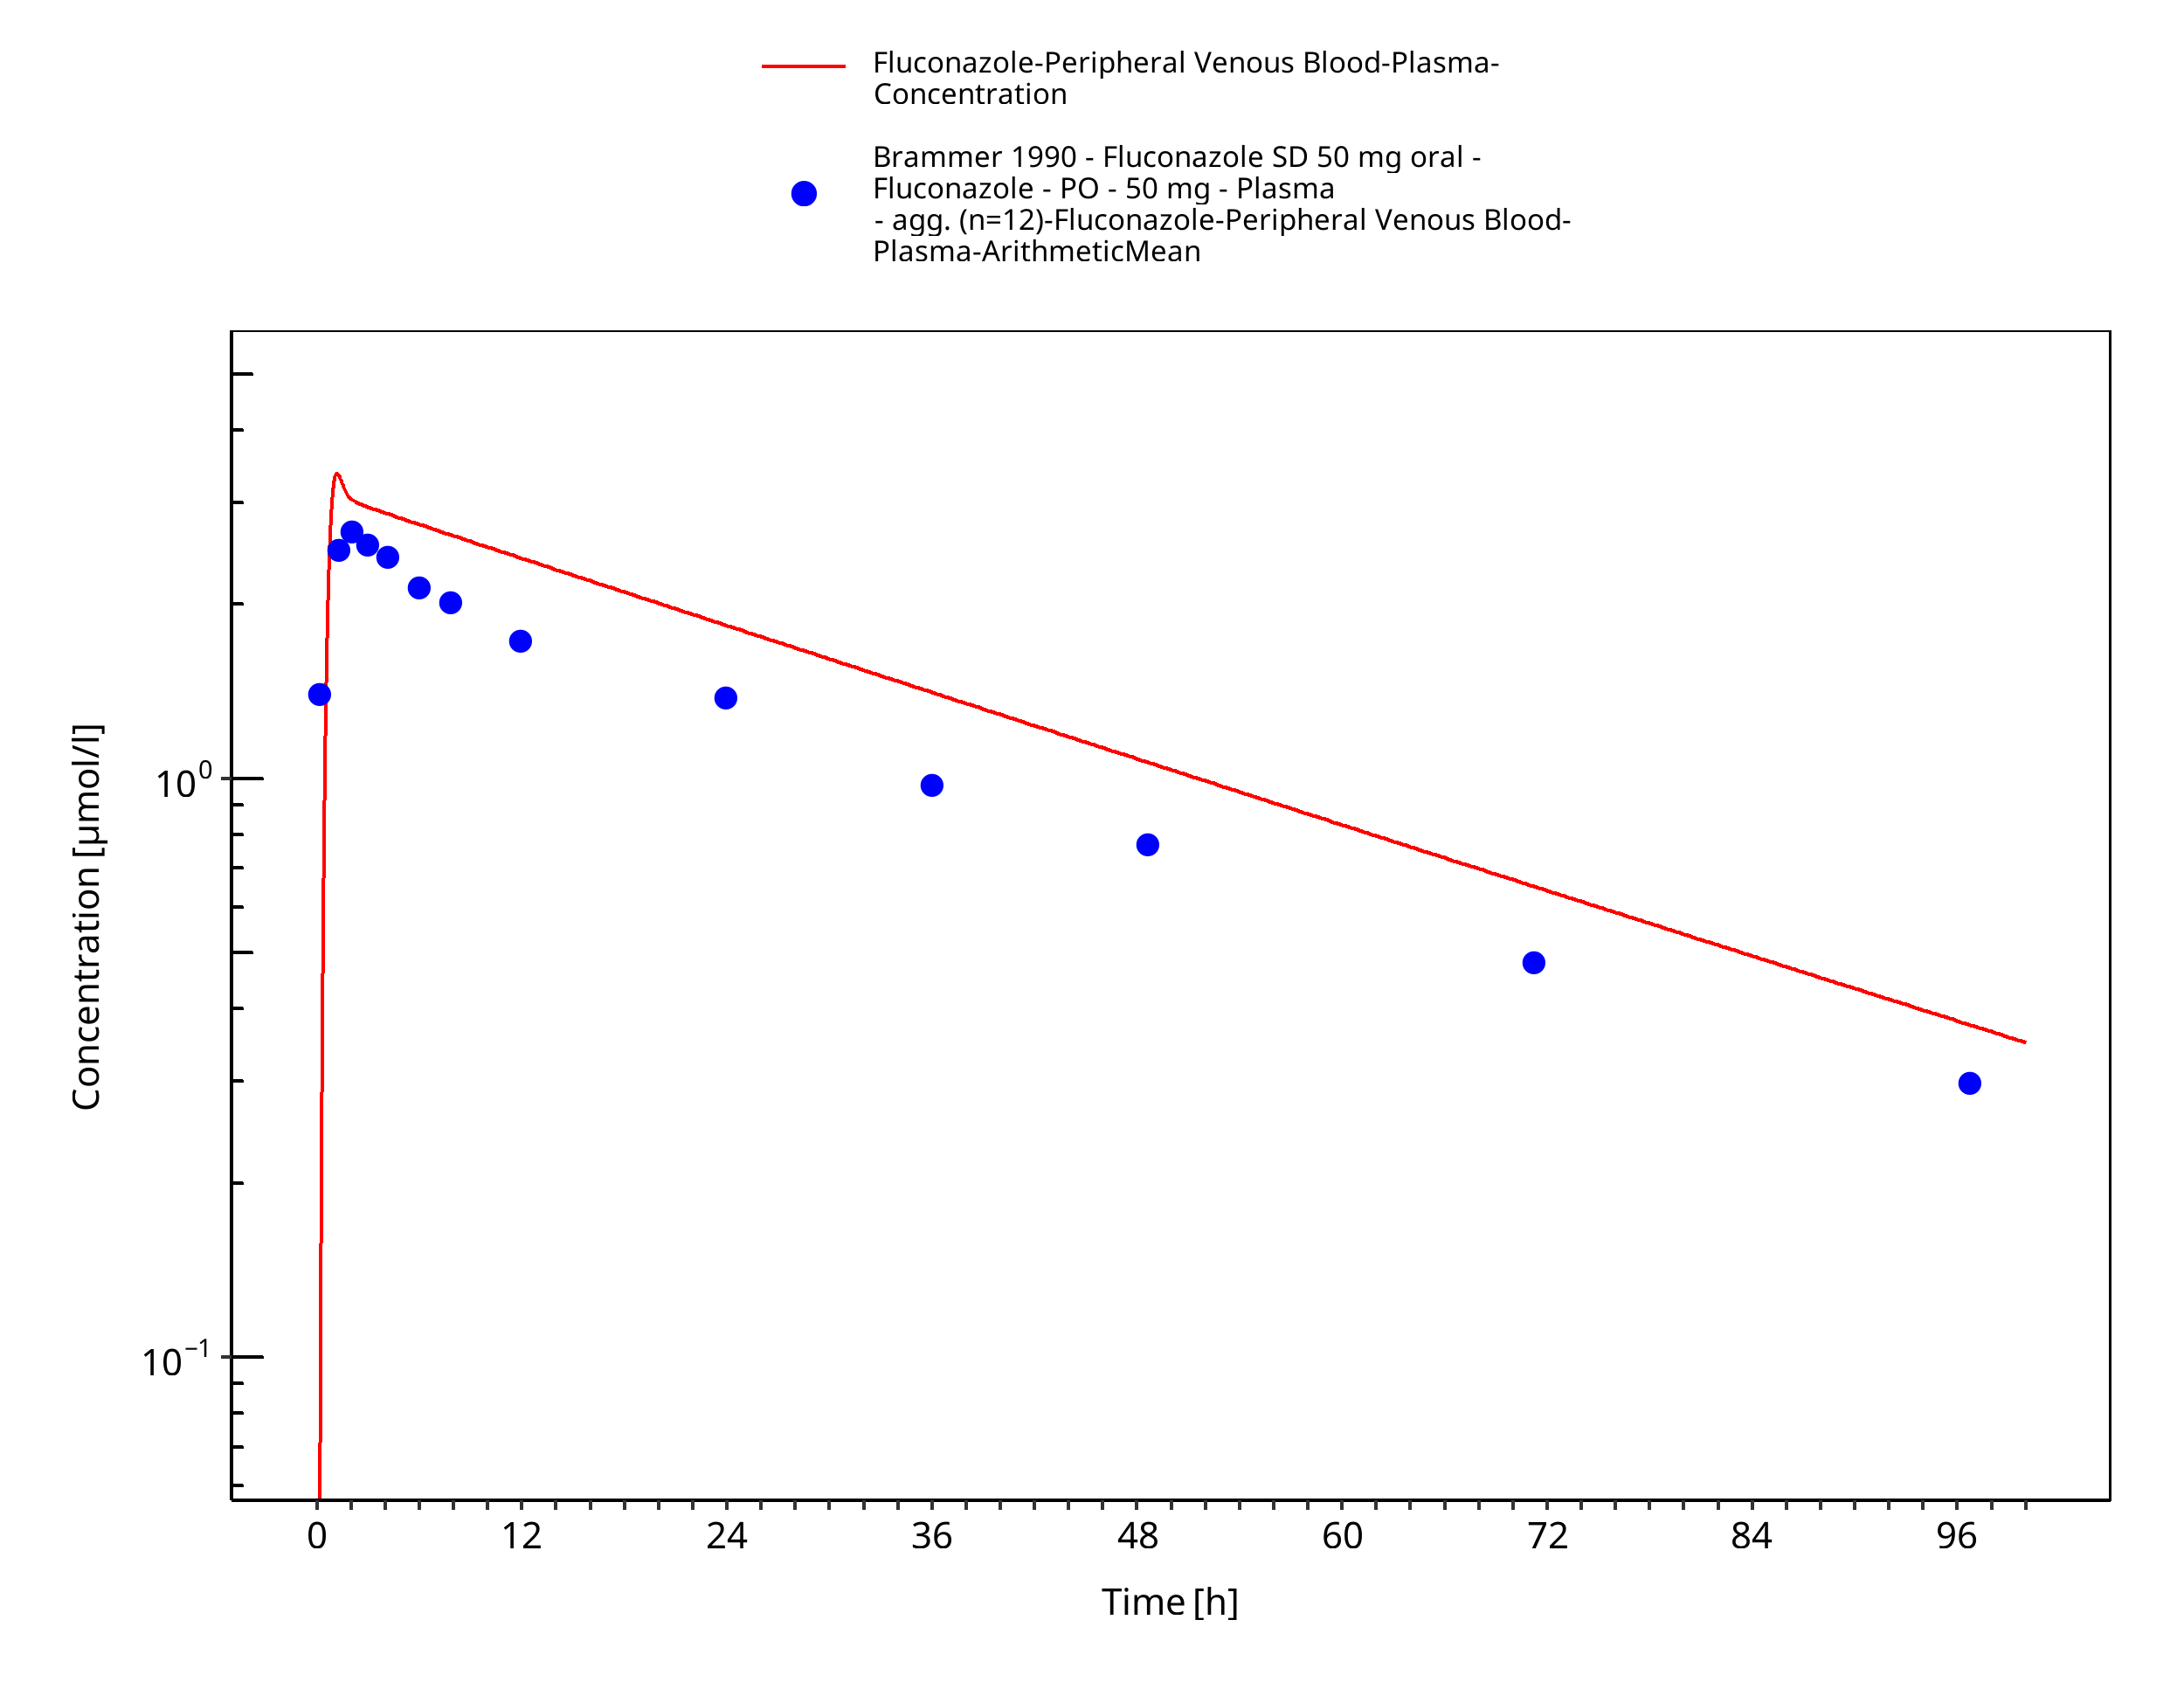
Figure 3-10: Time Profile Analysis
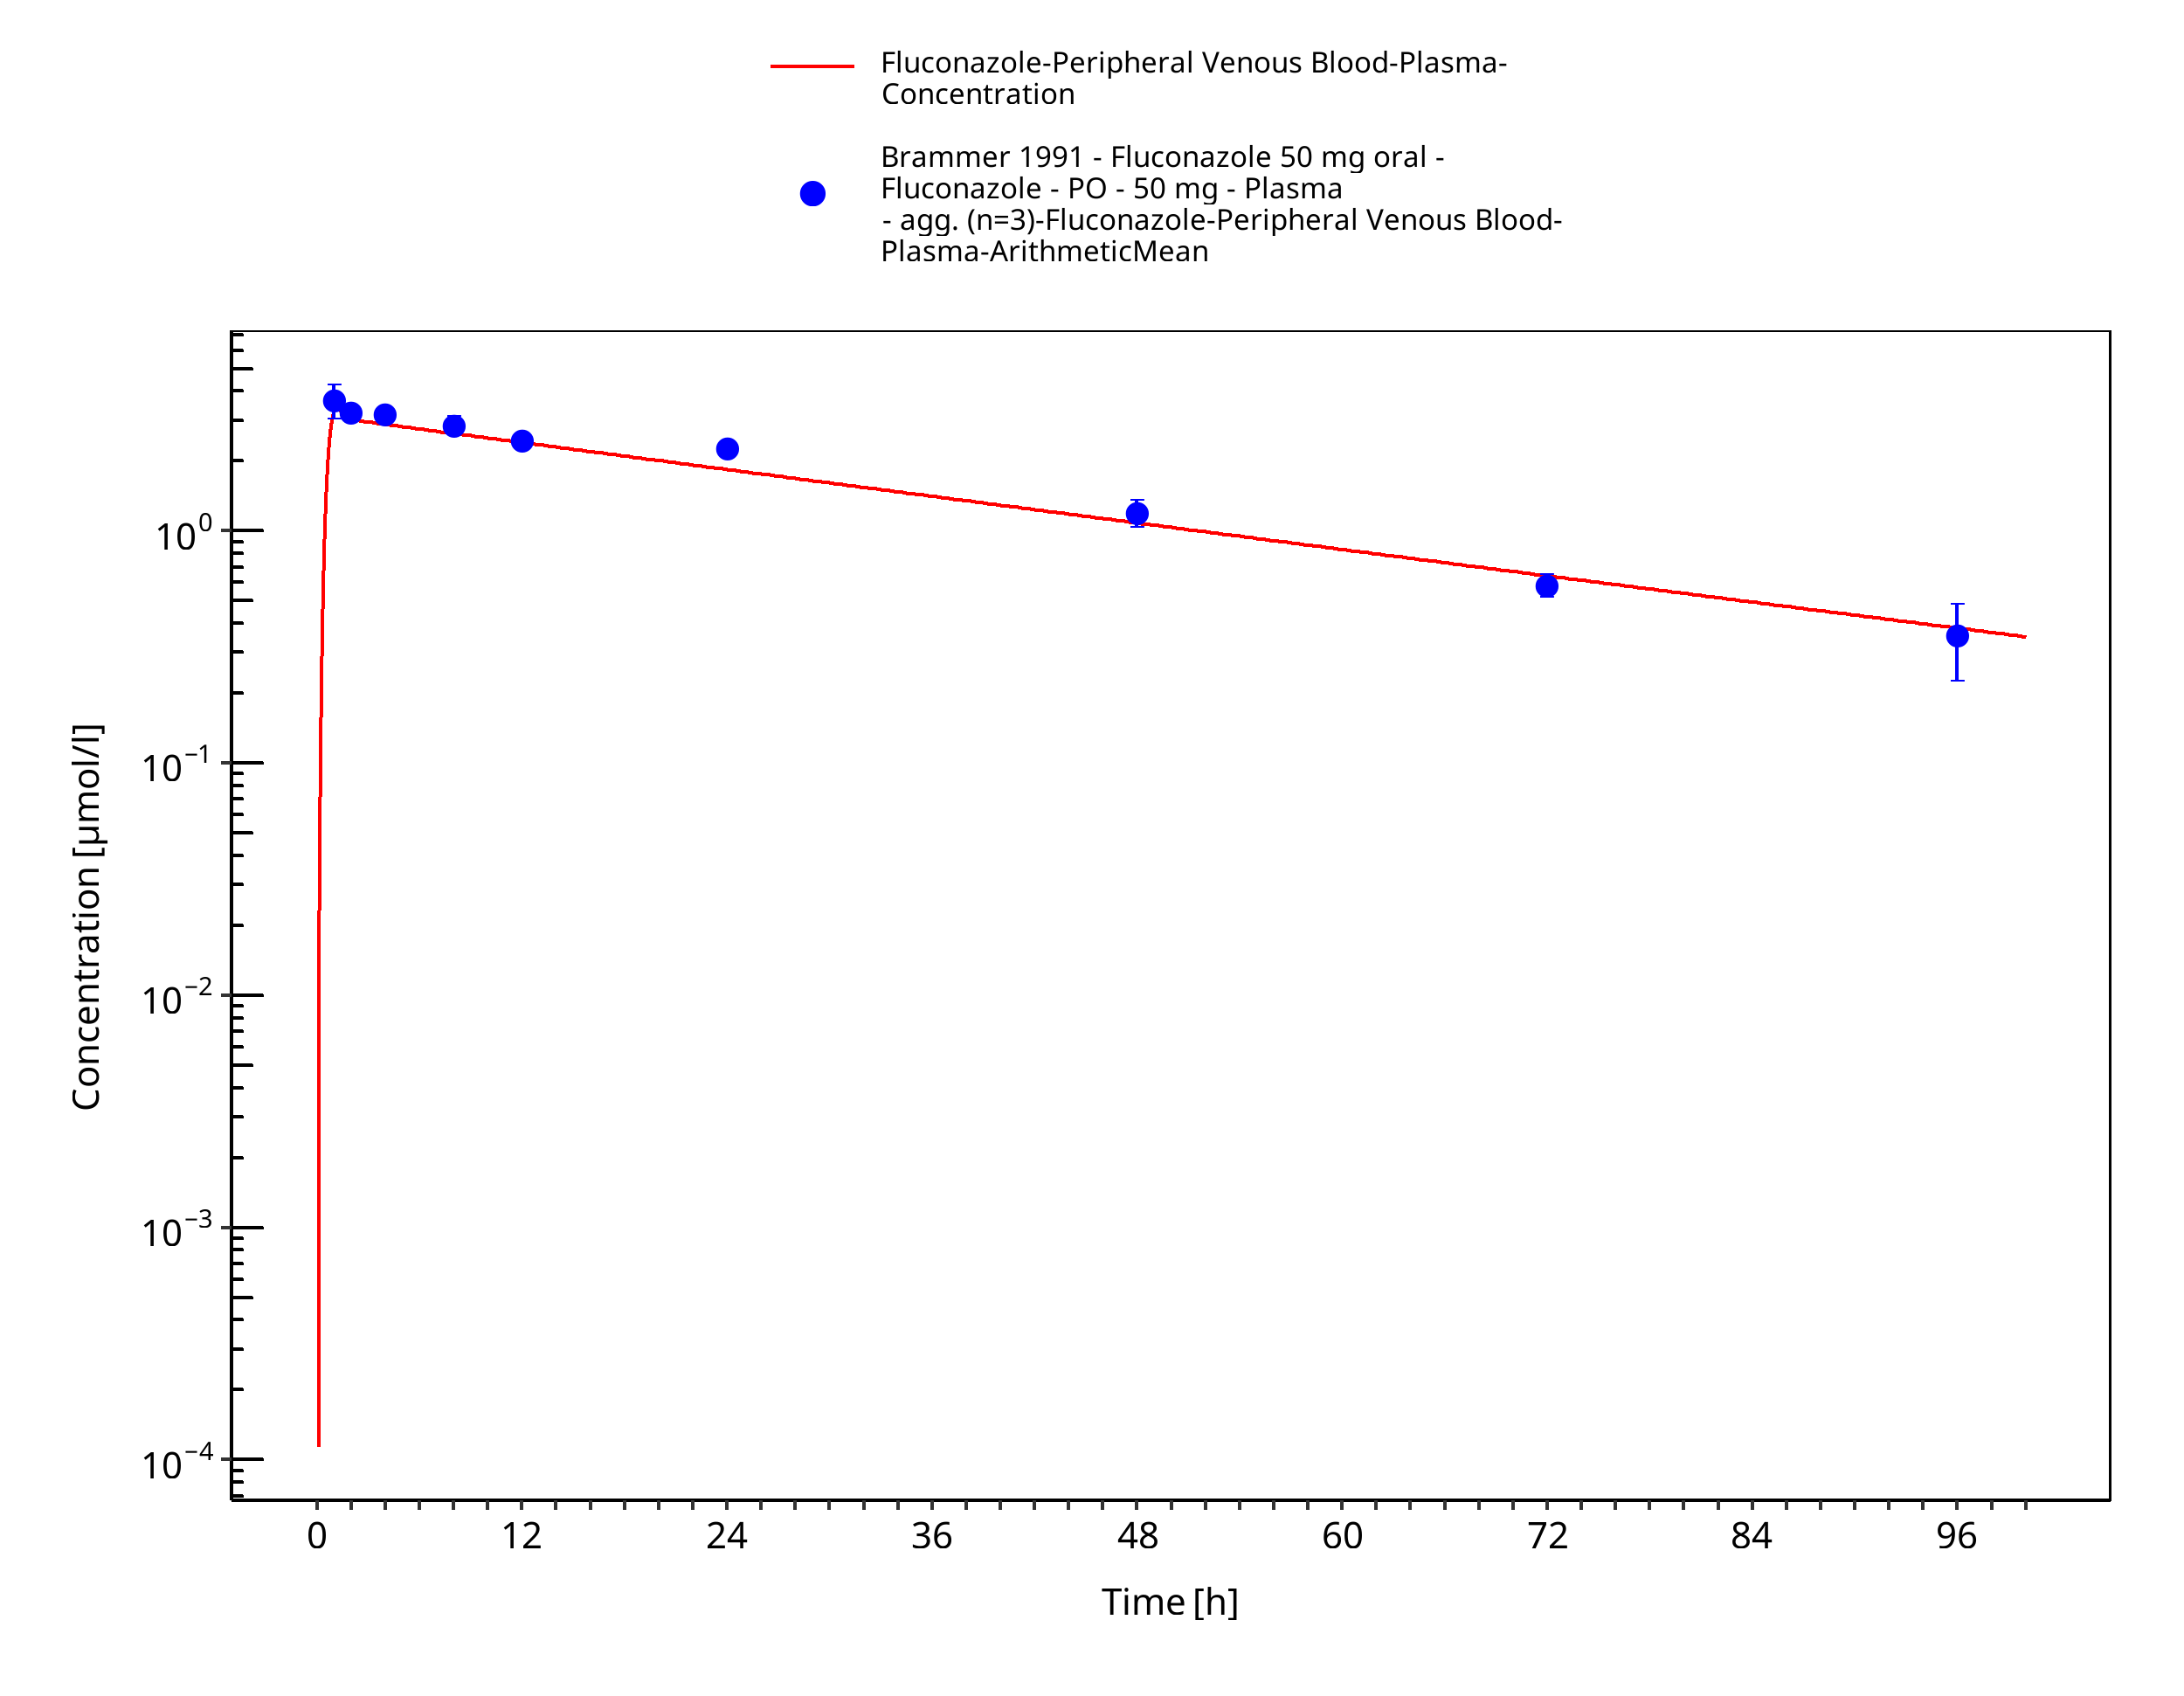
Figure 3-11: Time Profile Analysis
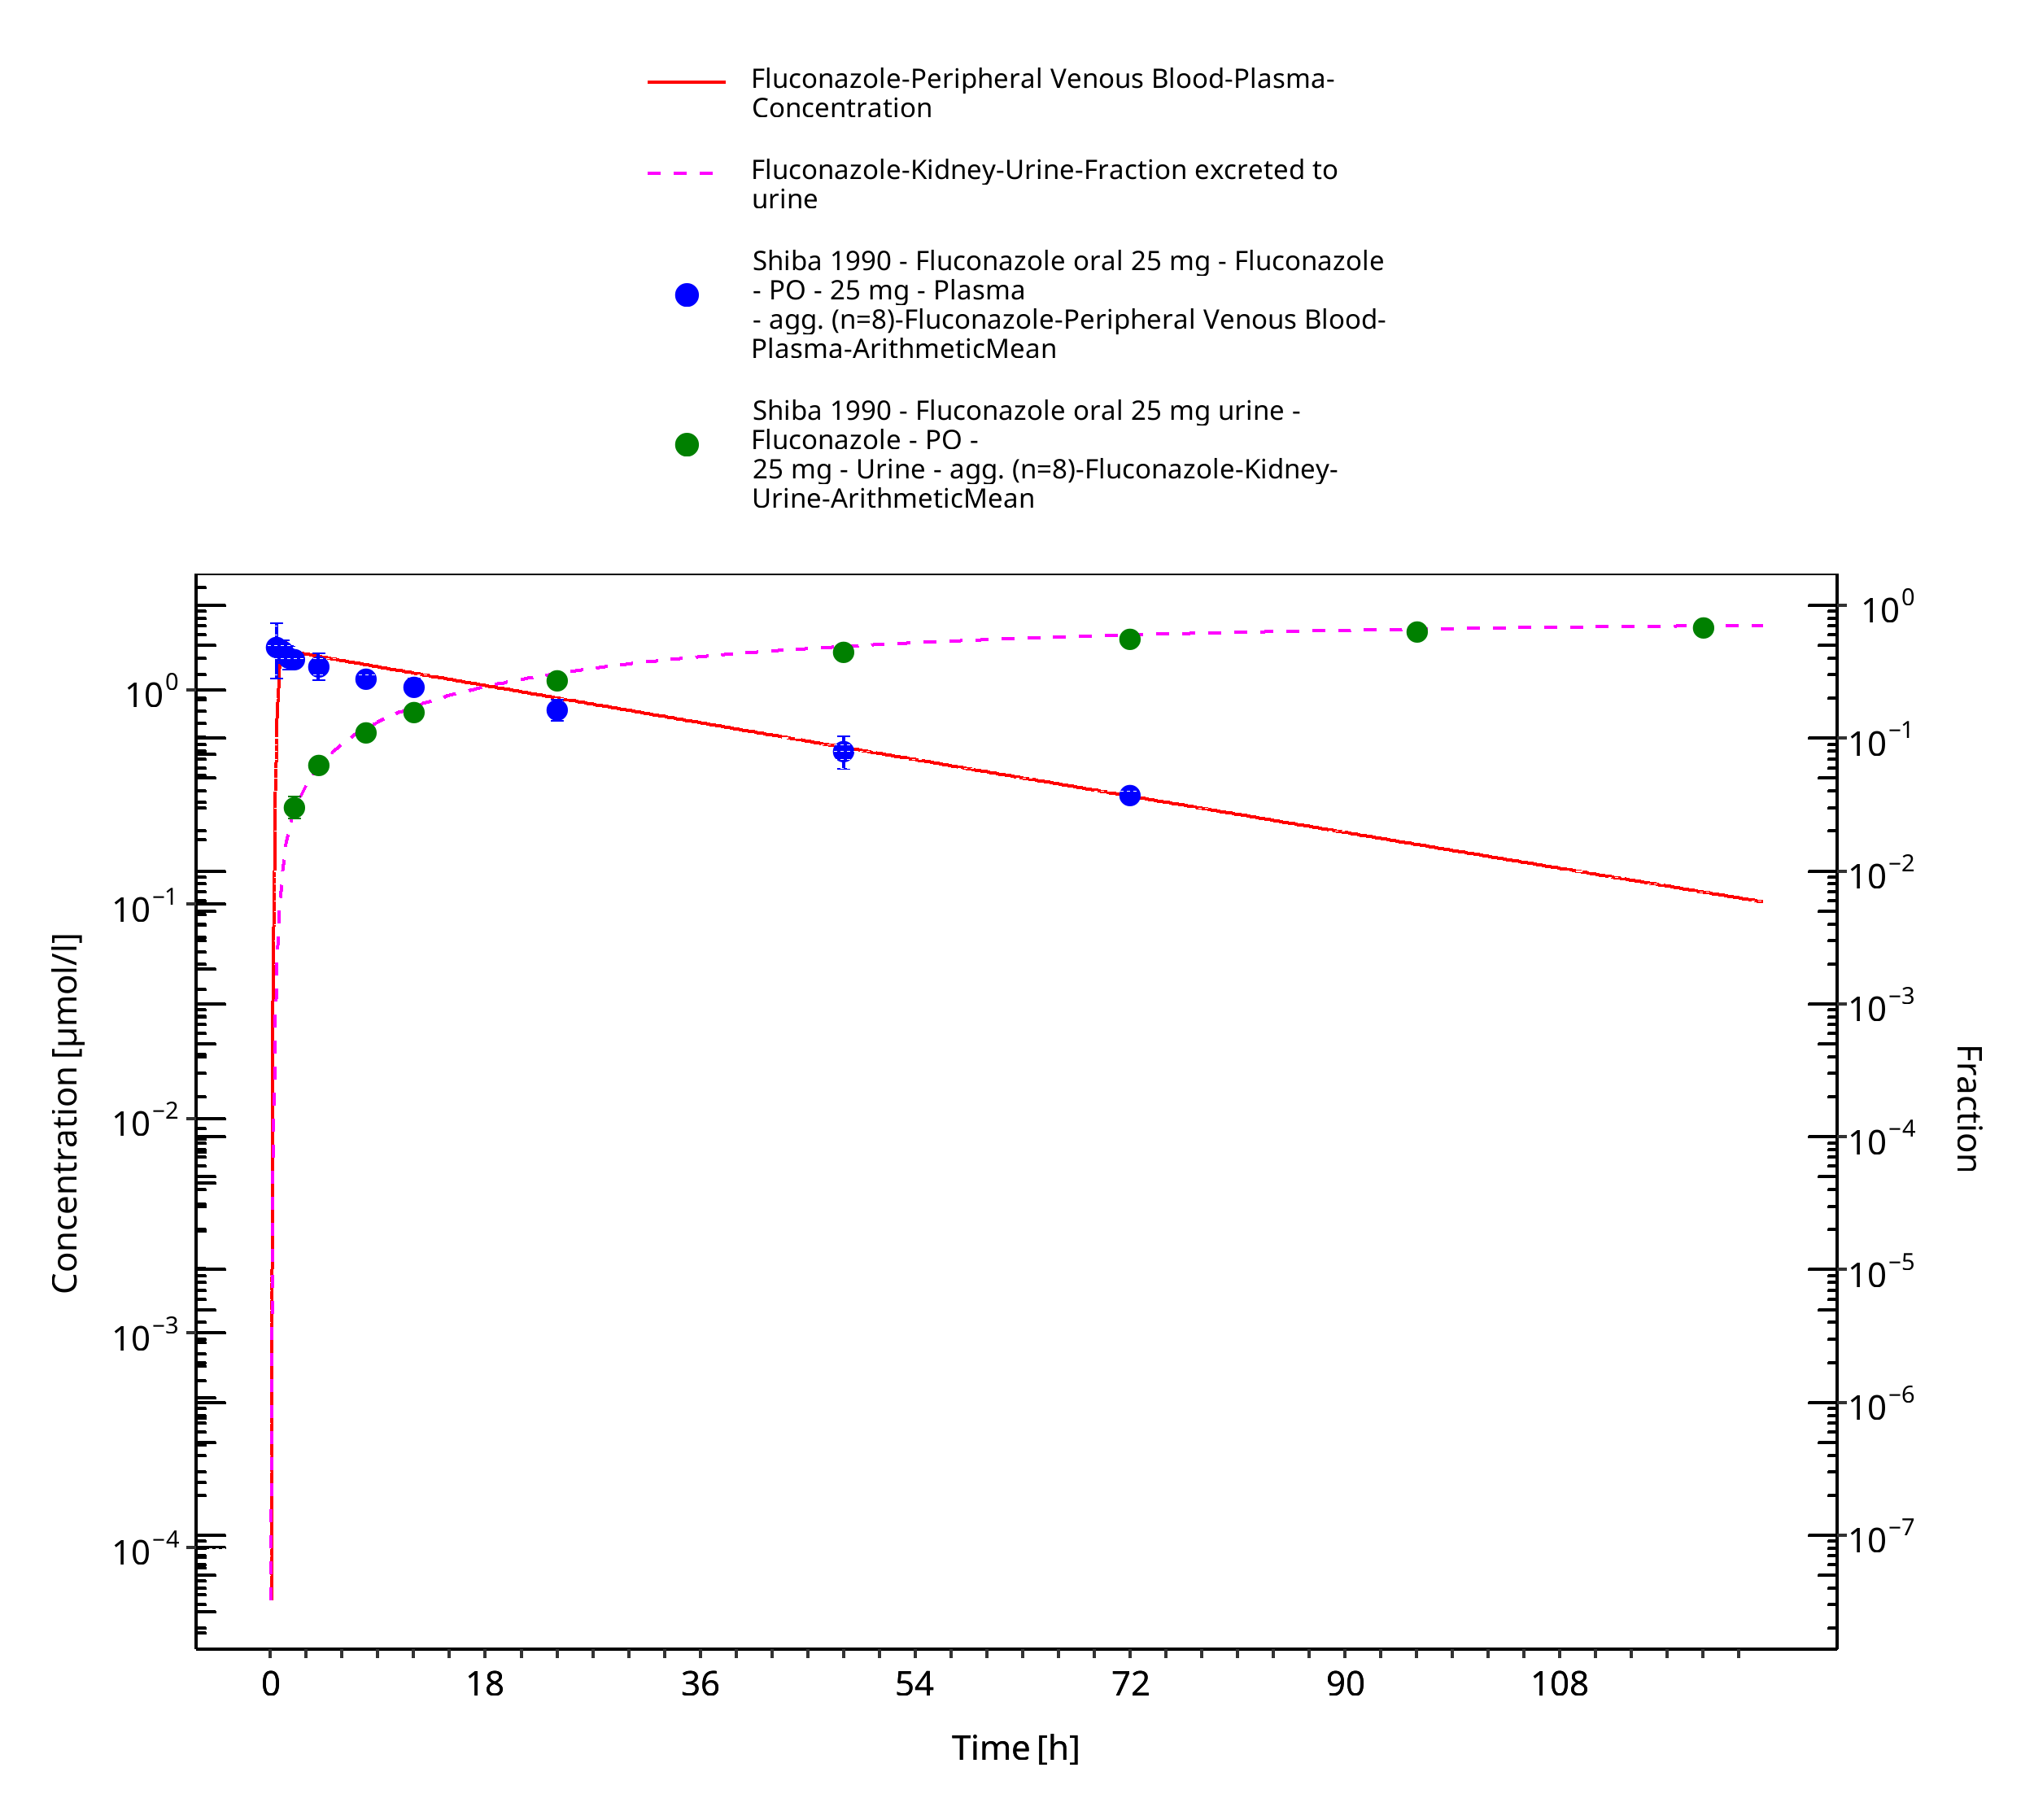
Figure 3-12: Time Profile Analysis
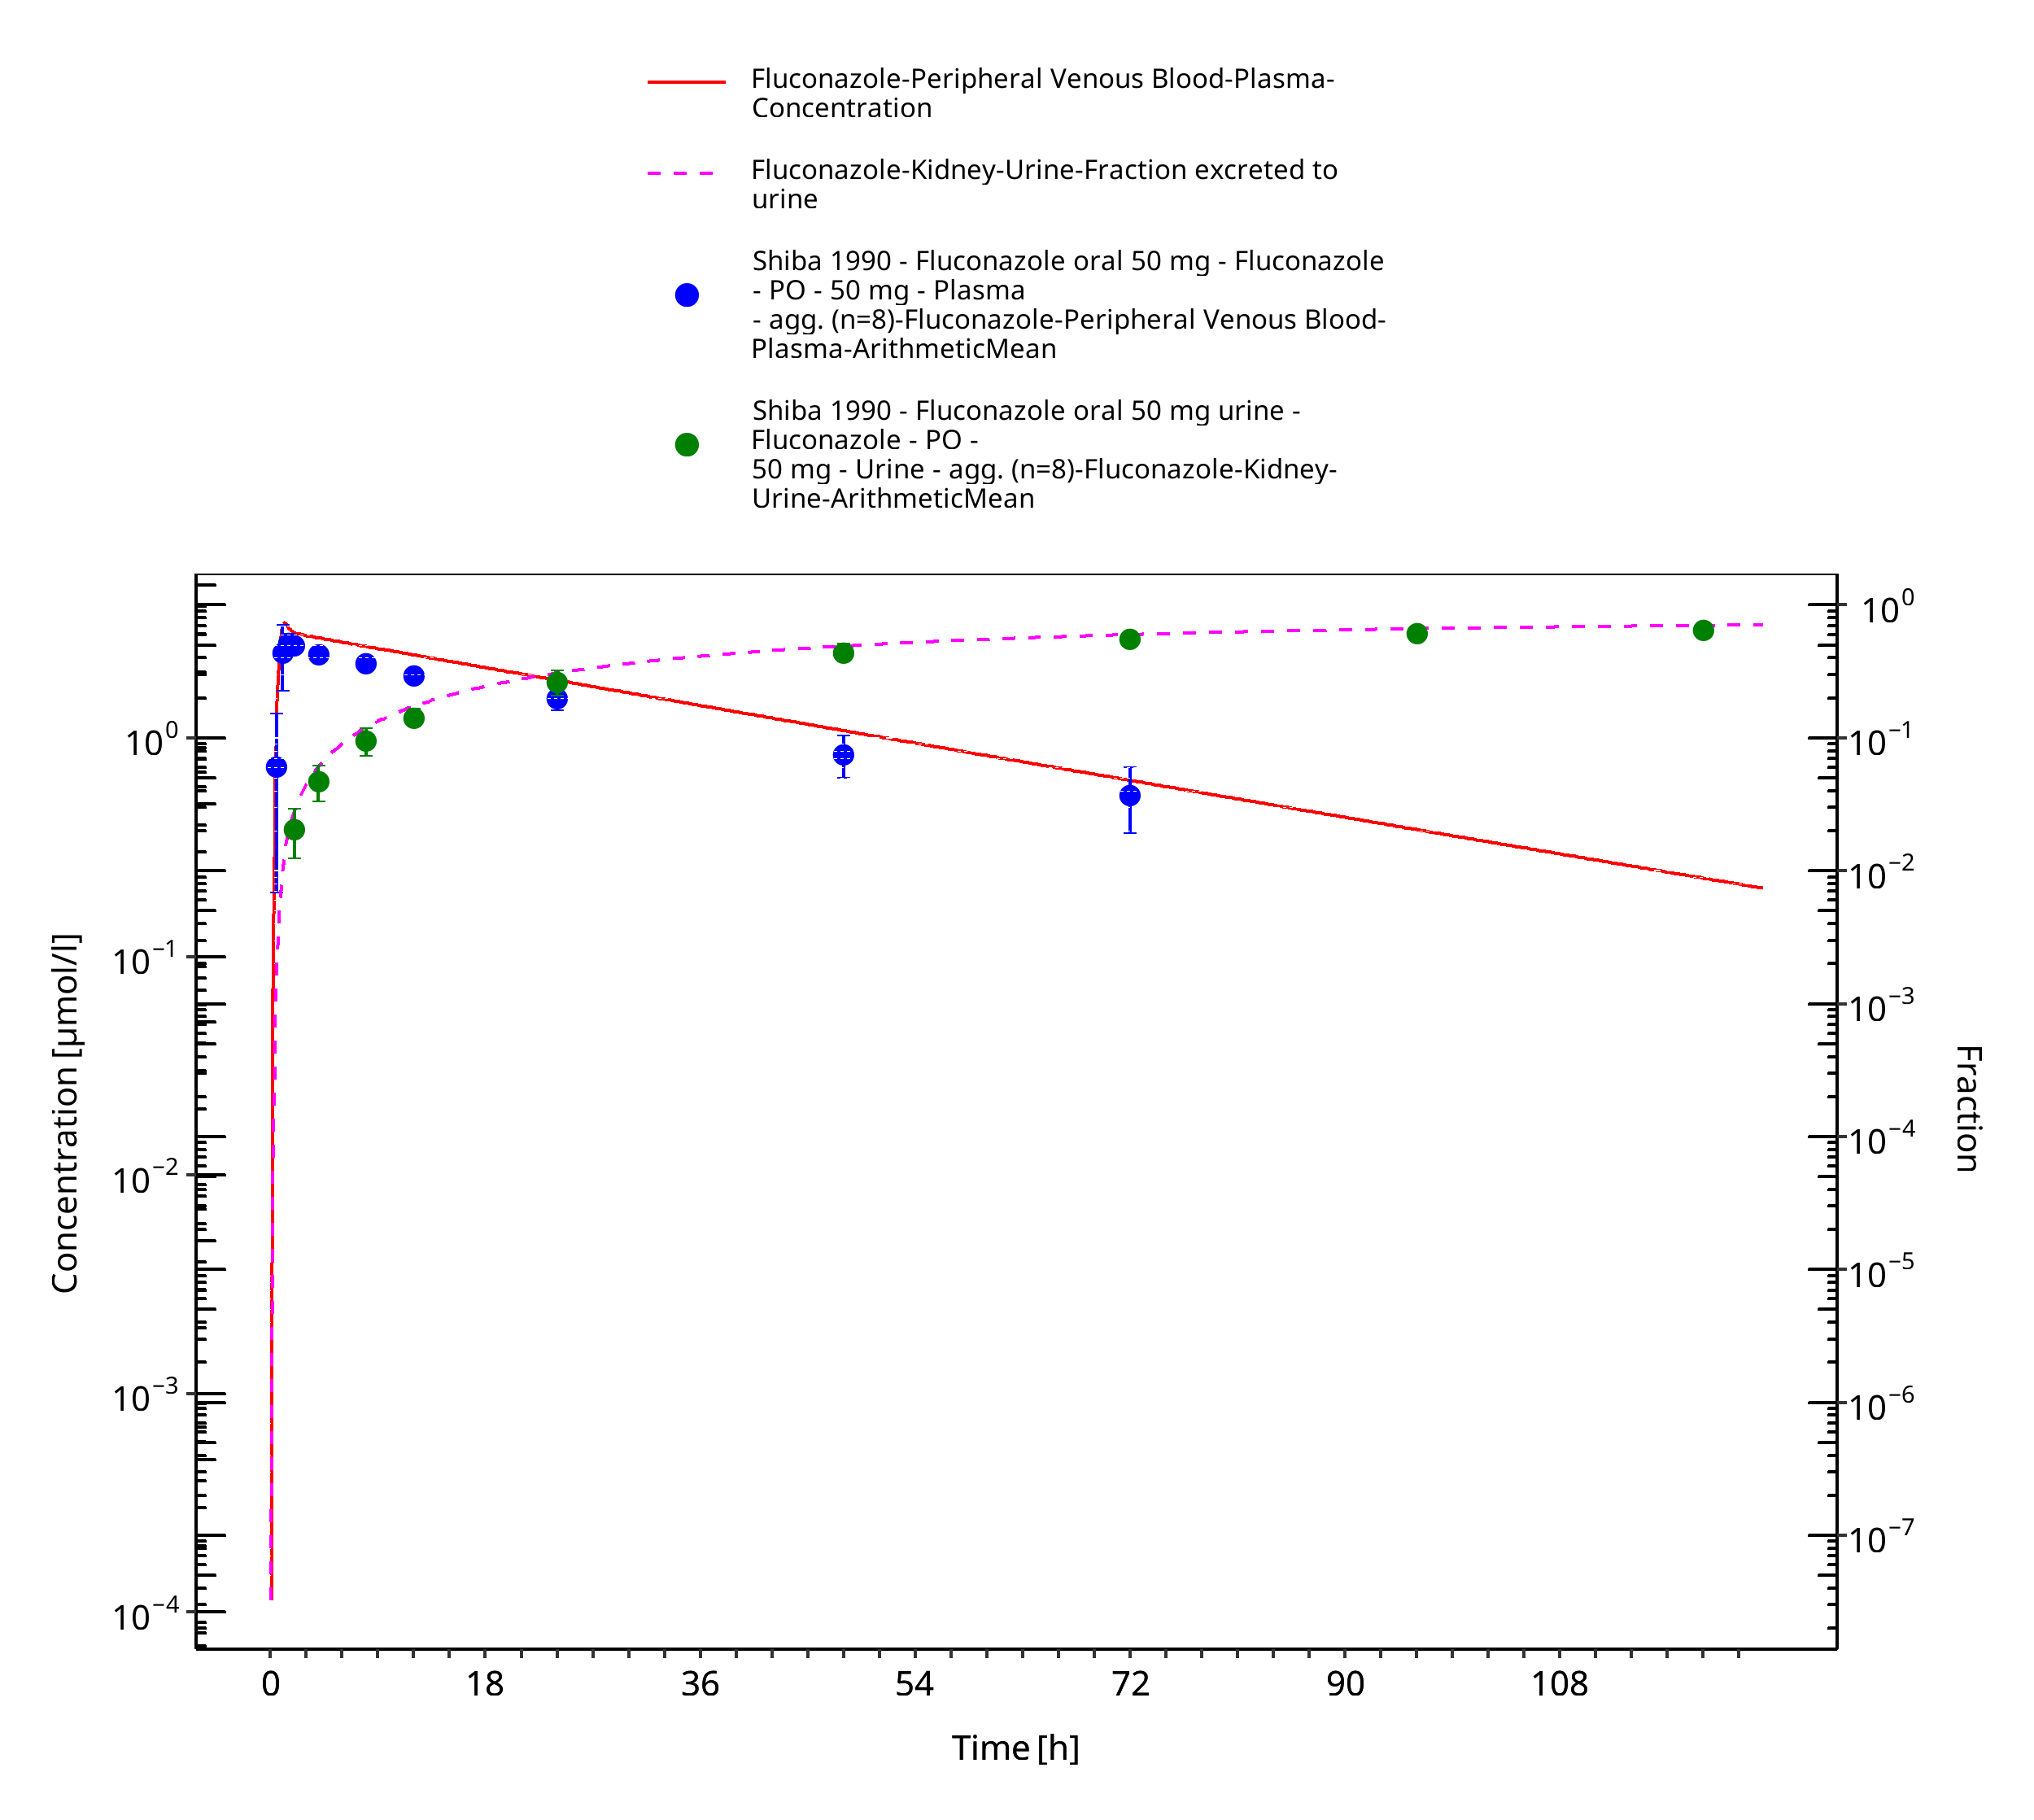
Figure 3-13: Time Profile Analysis
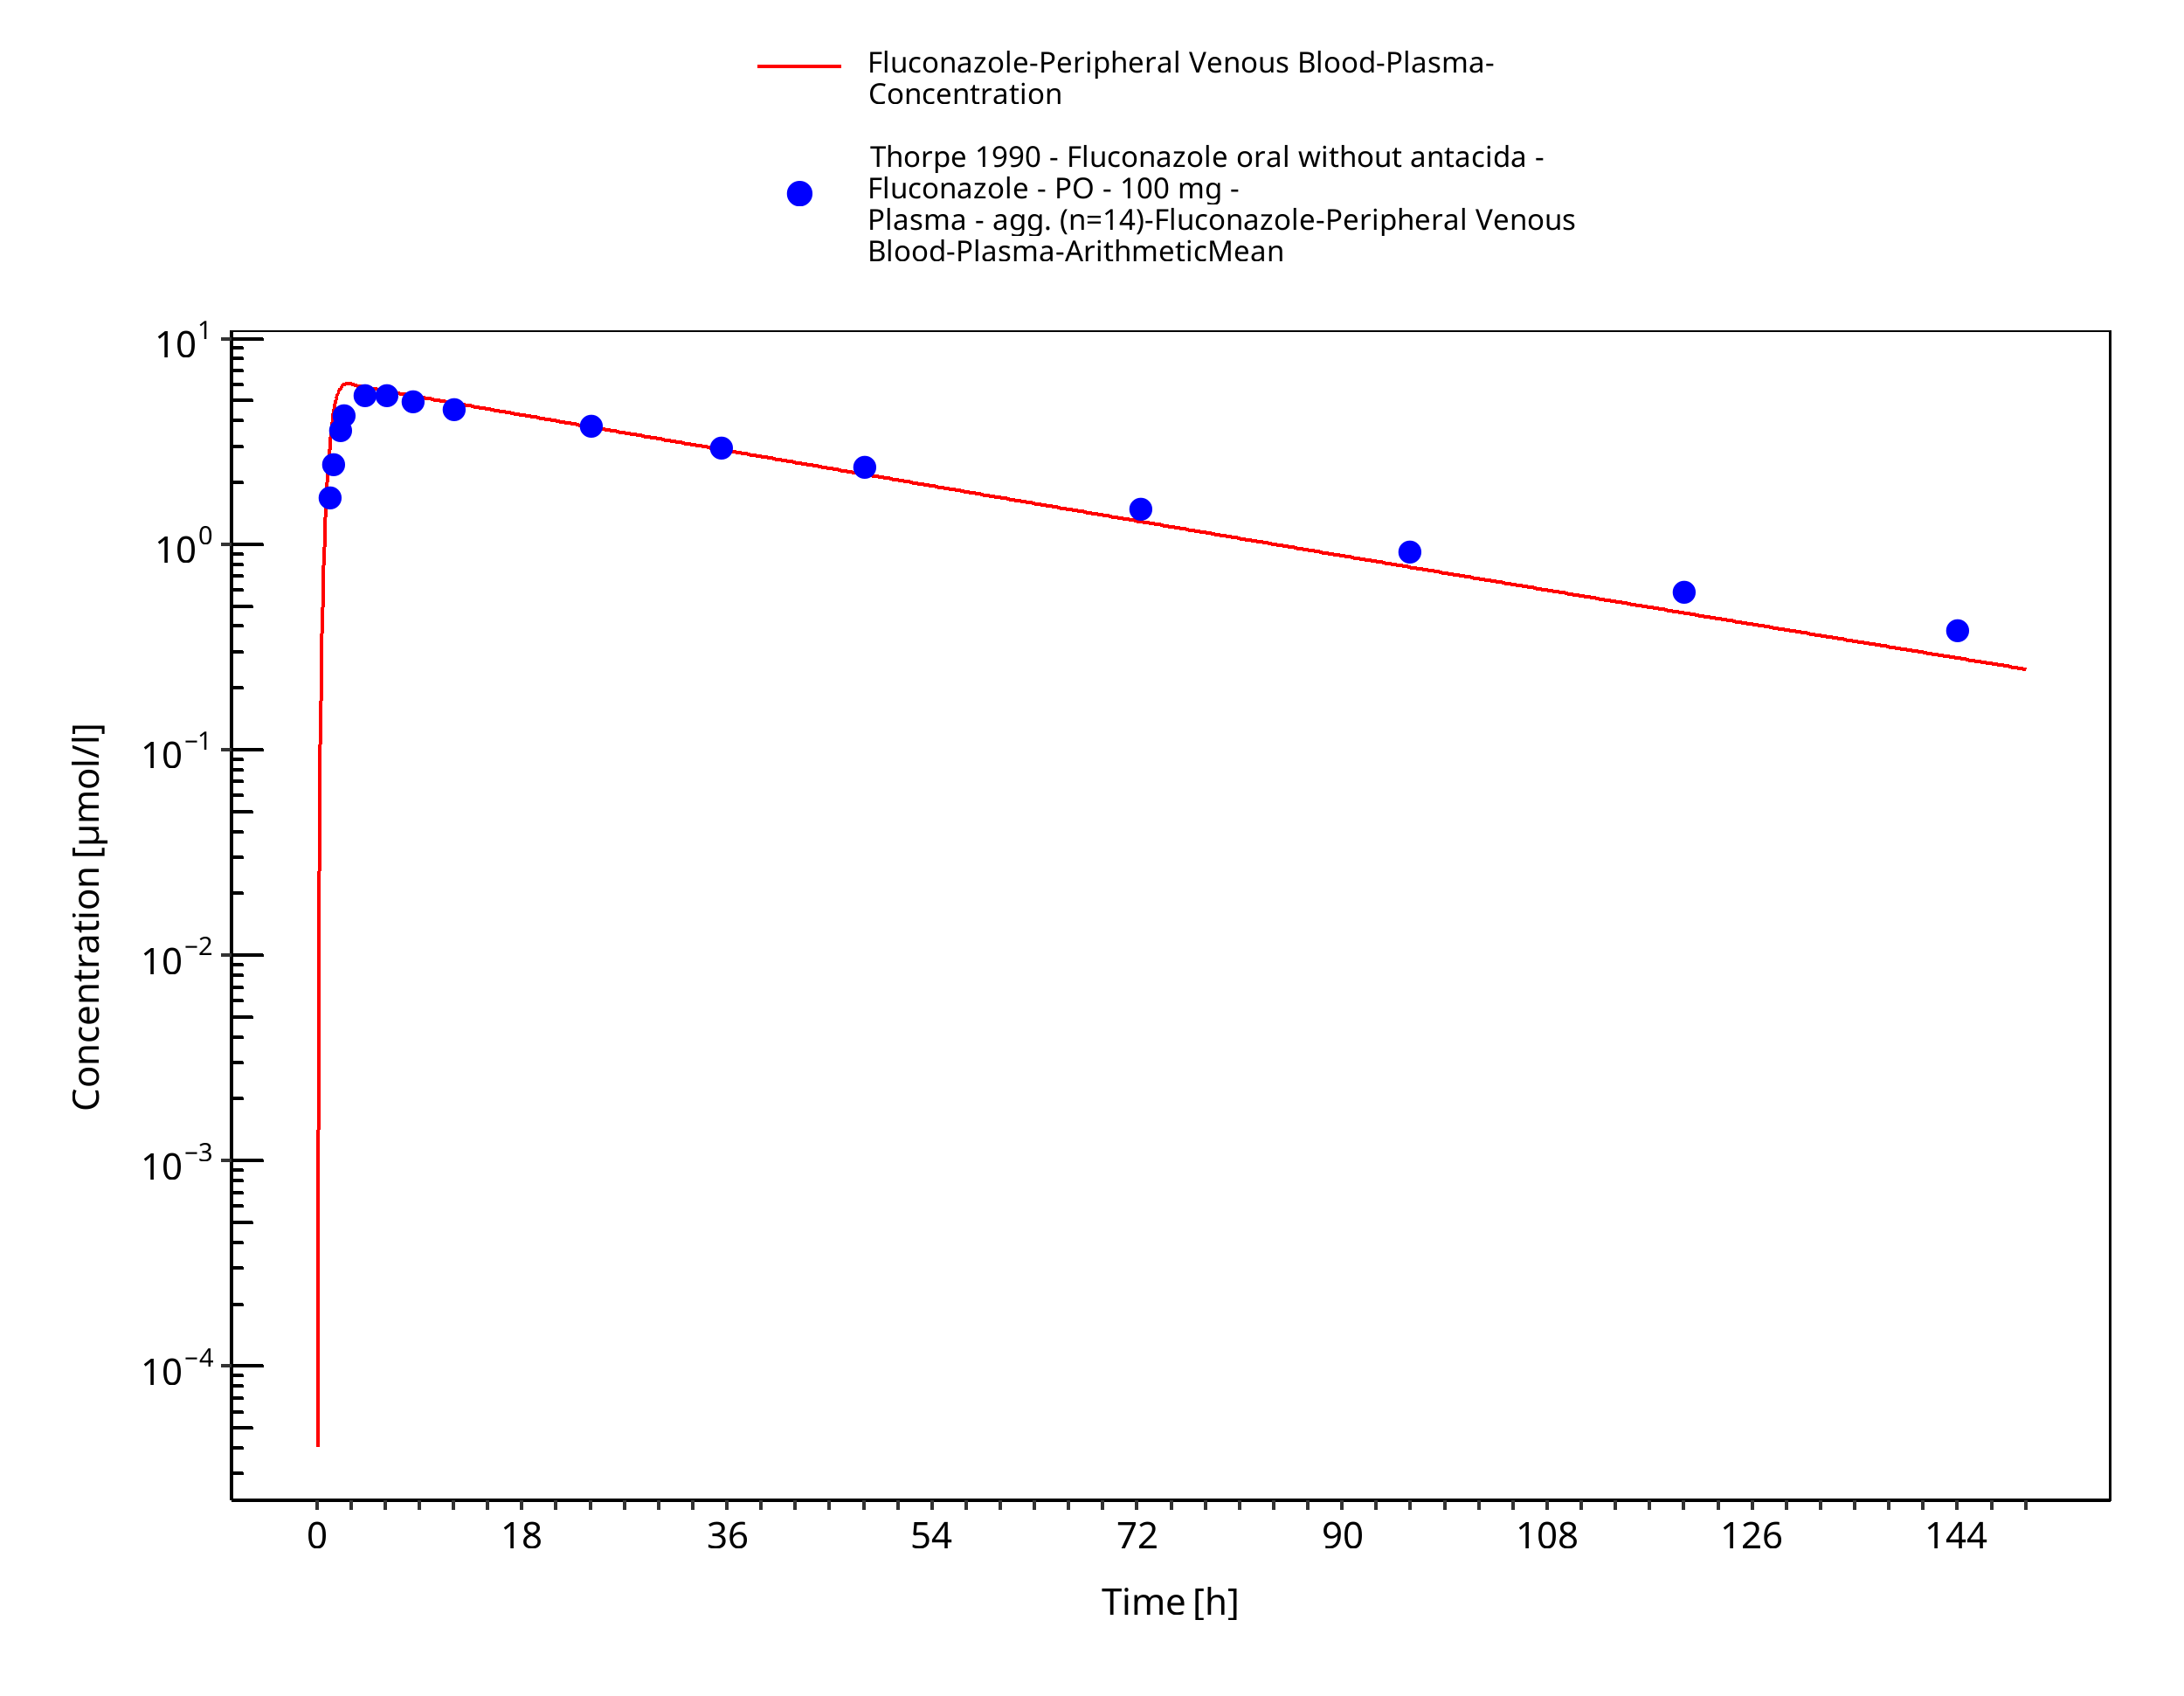
Figure 3-14: Time Profile Analysis
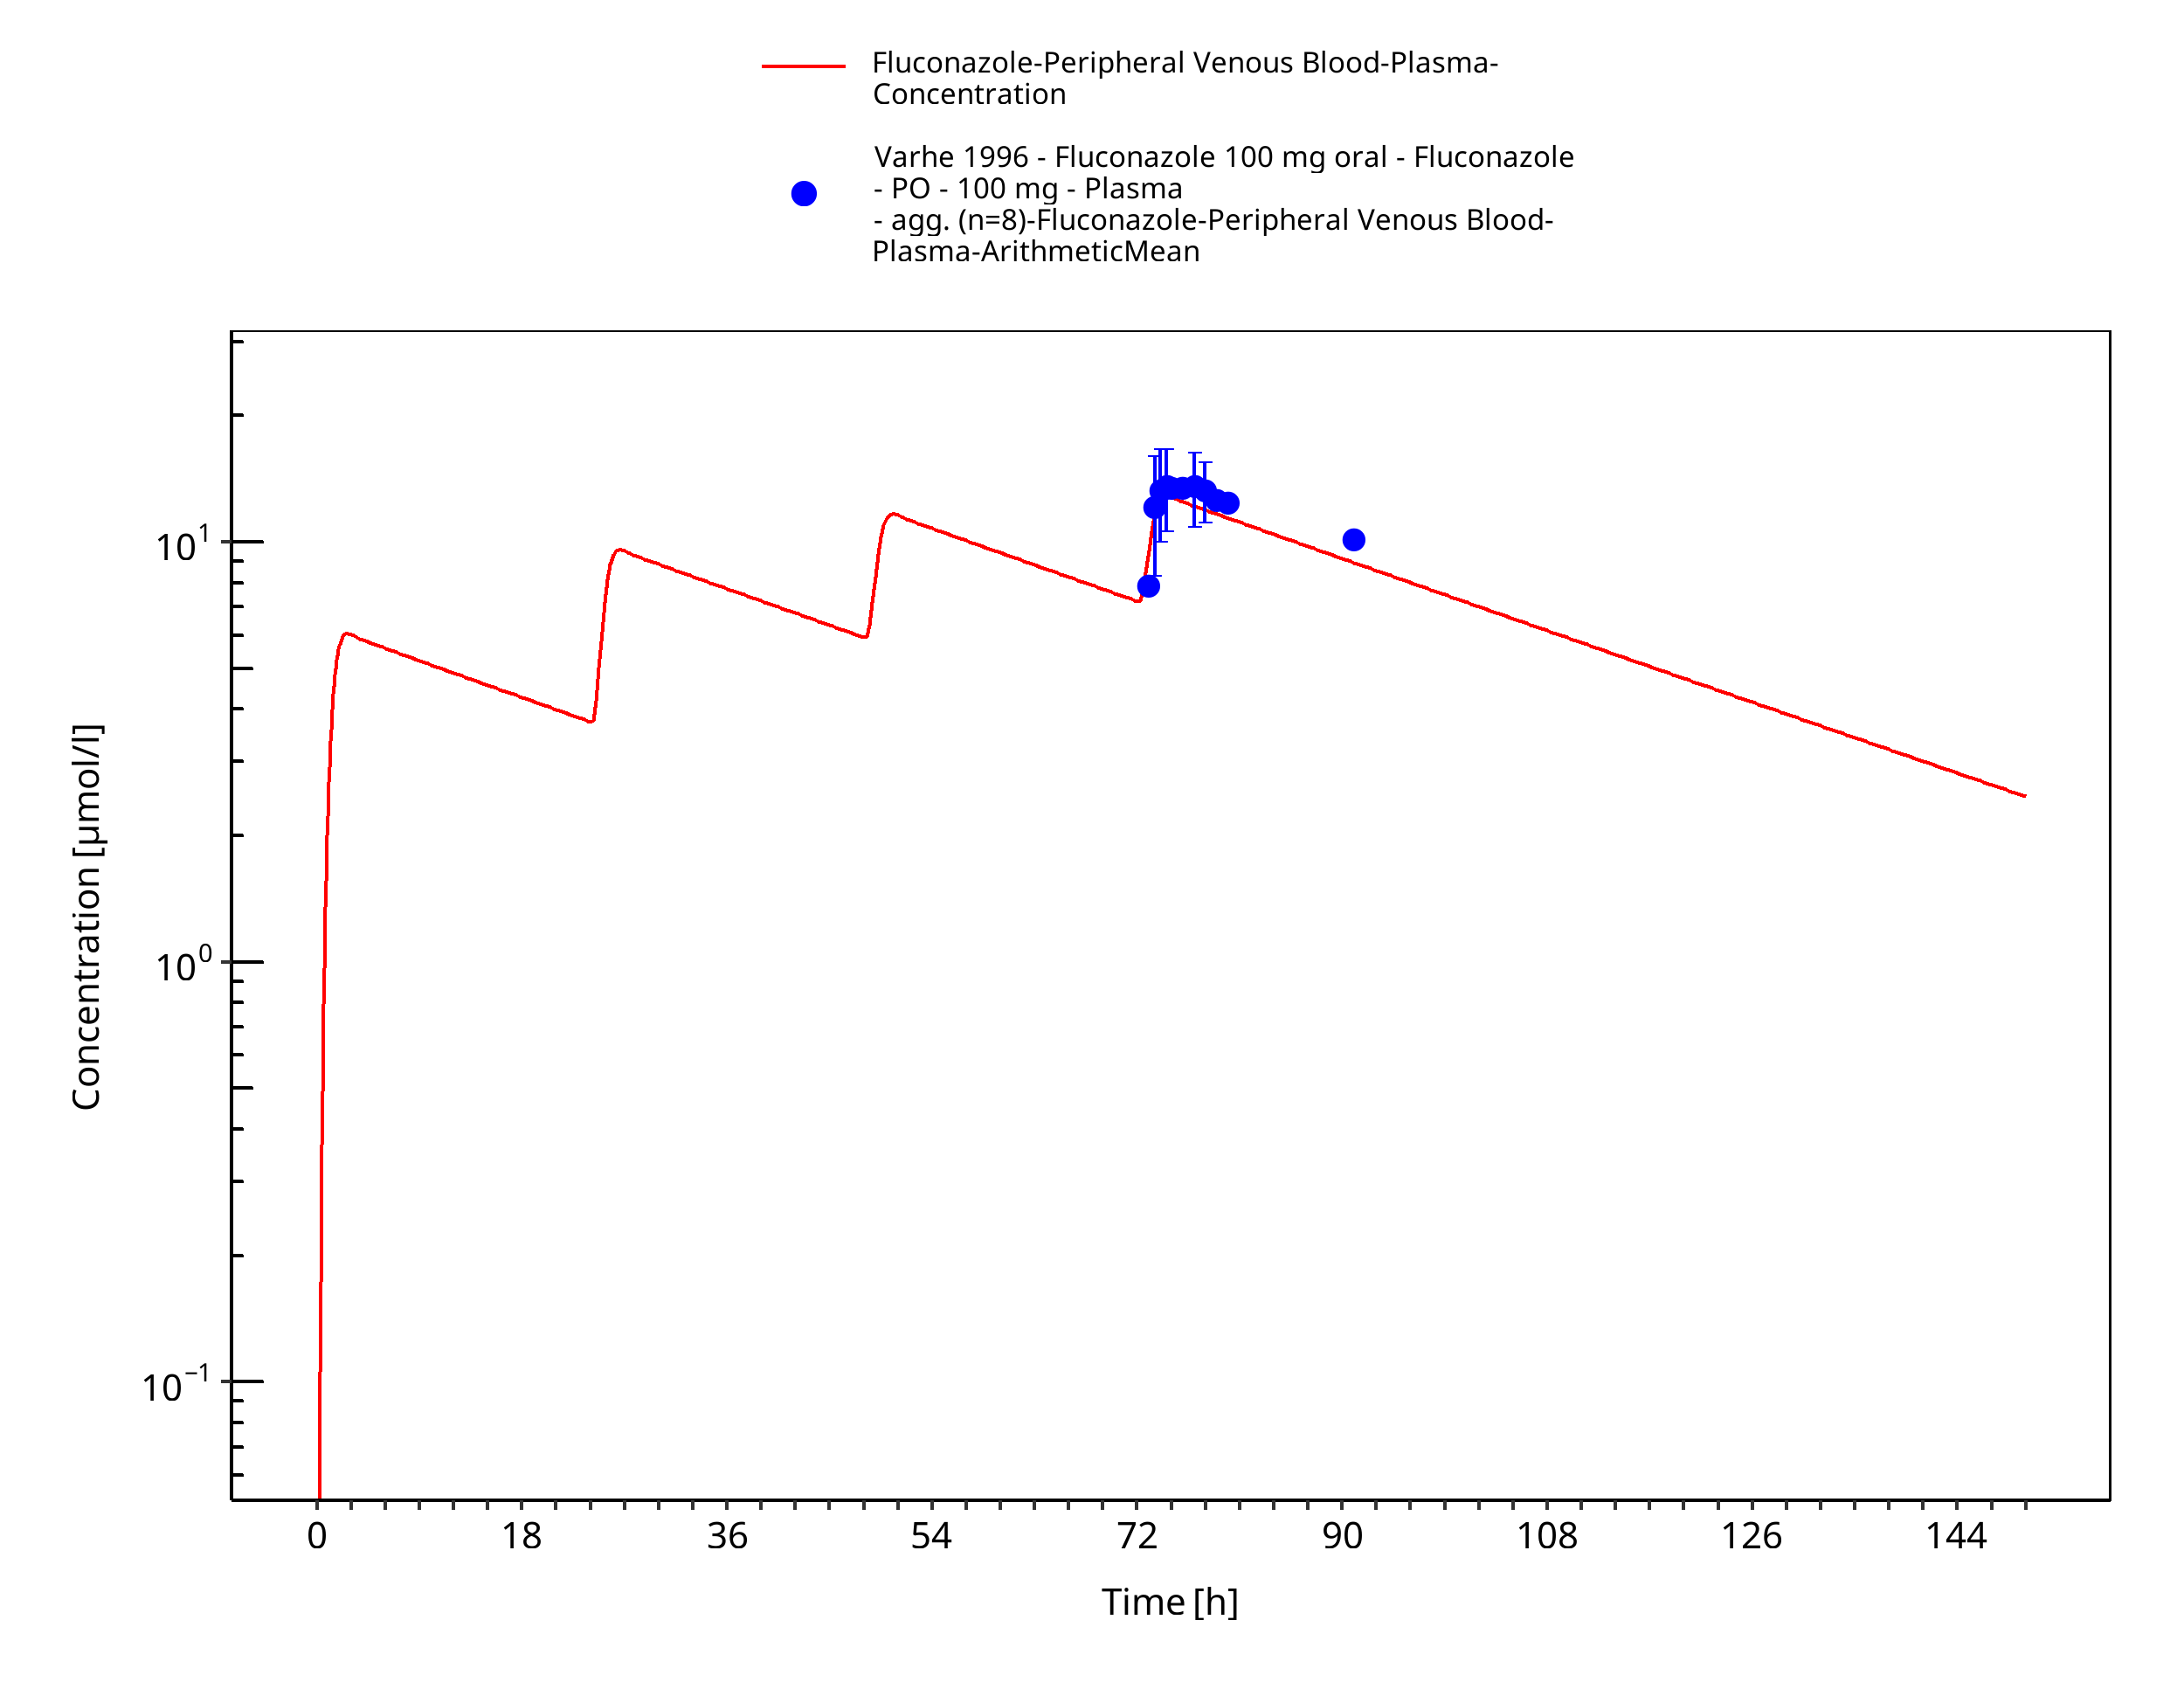
Figure 3-15: Time Profile Analysis
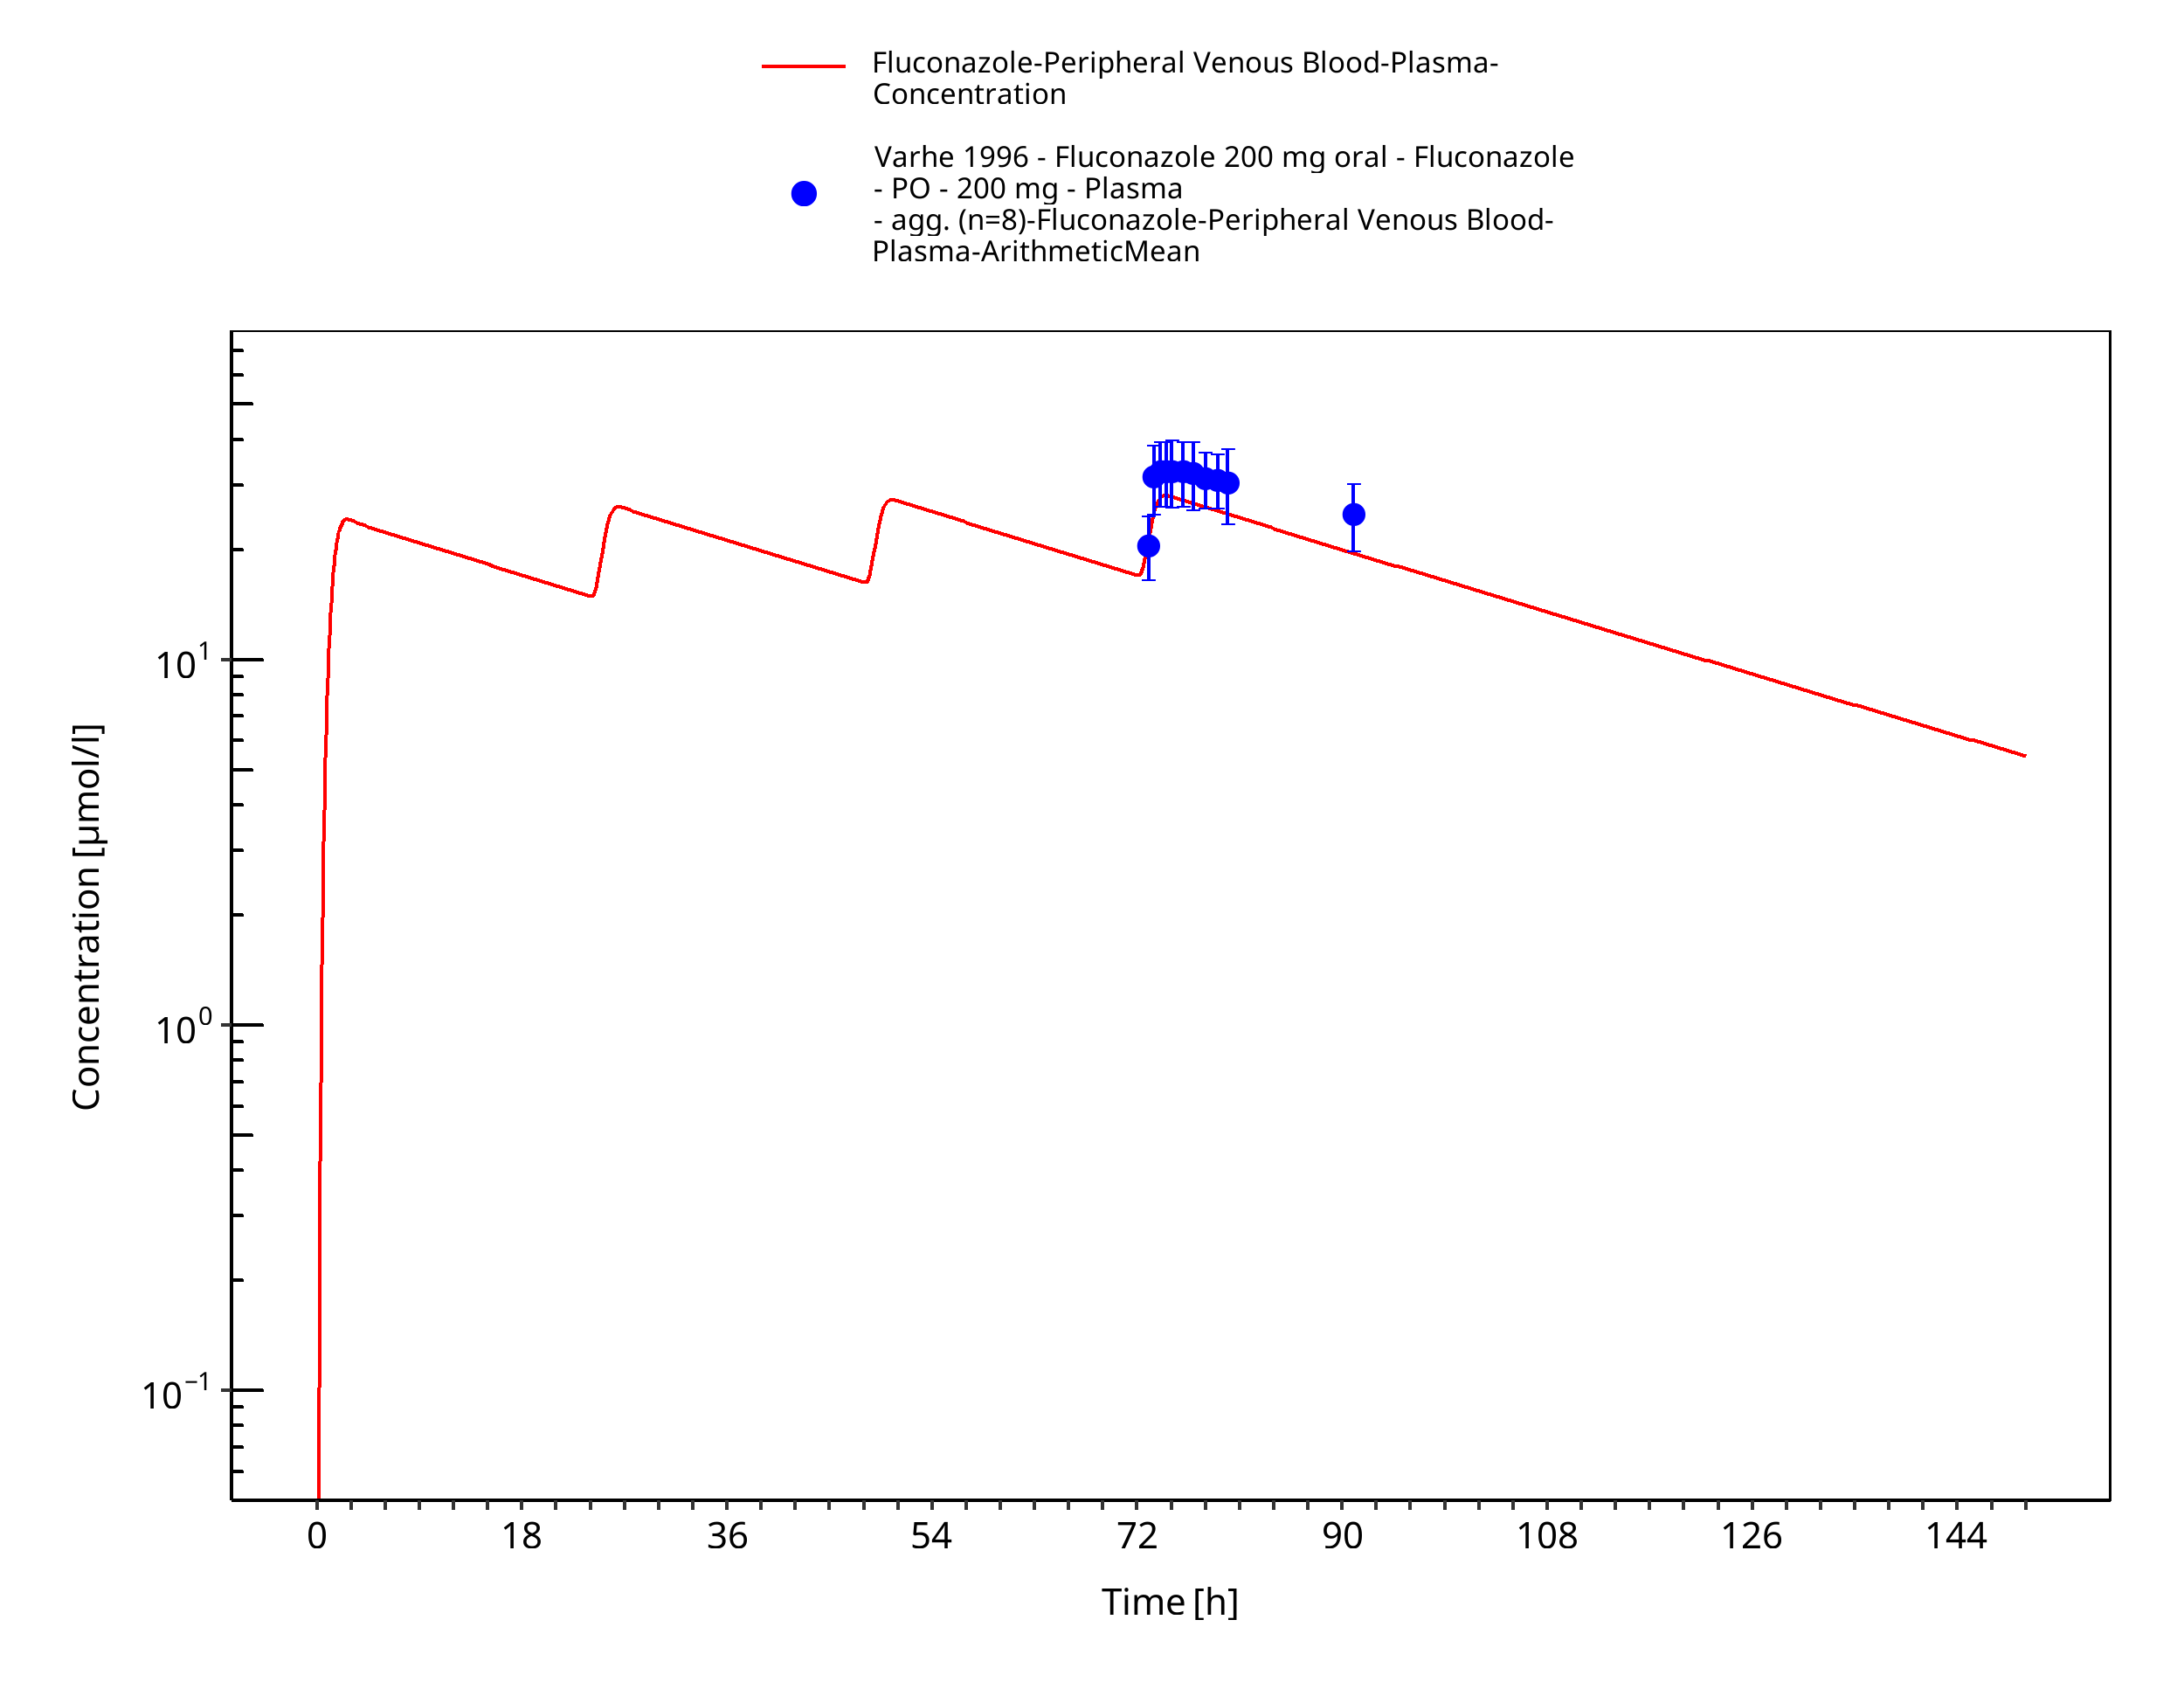
Figure 3-16: Time Profile Analysis
3.3.2 Model Verification
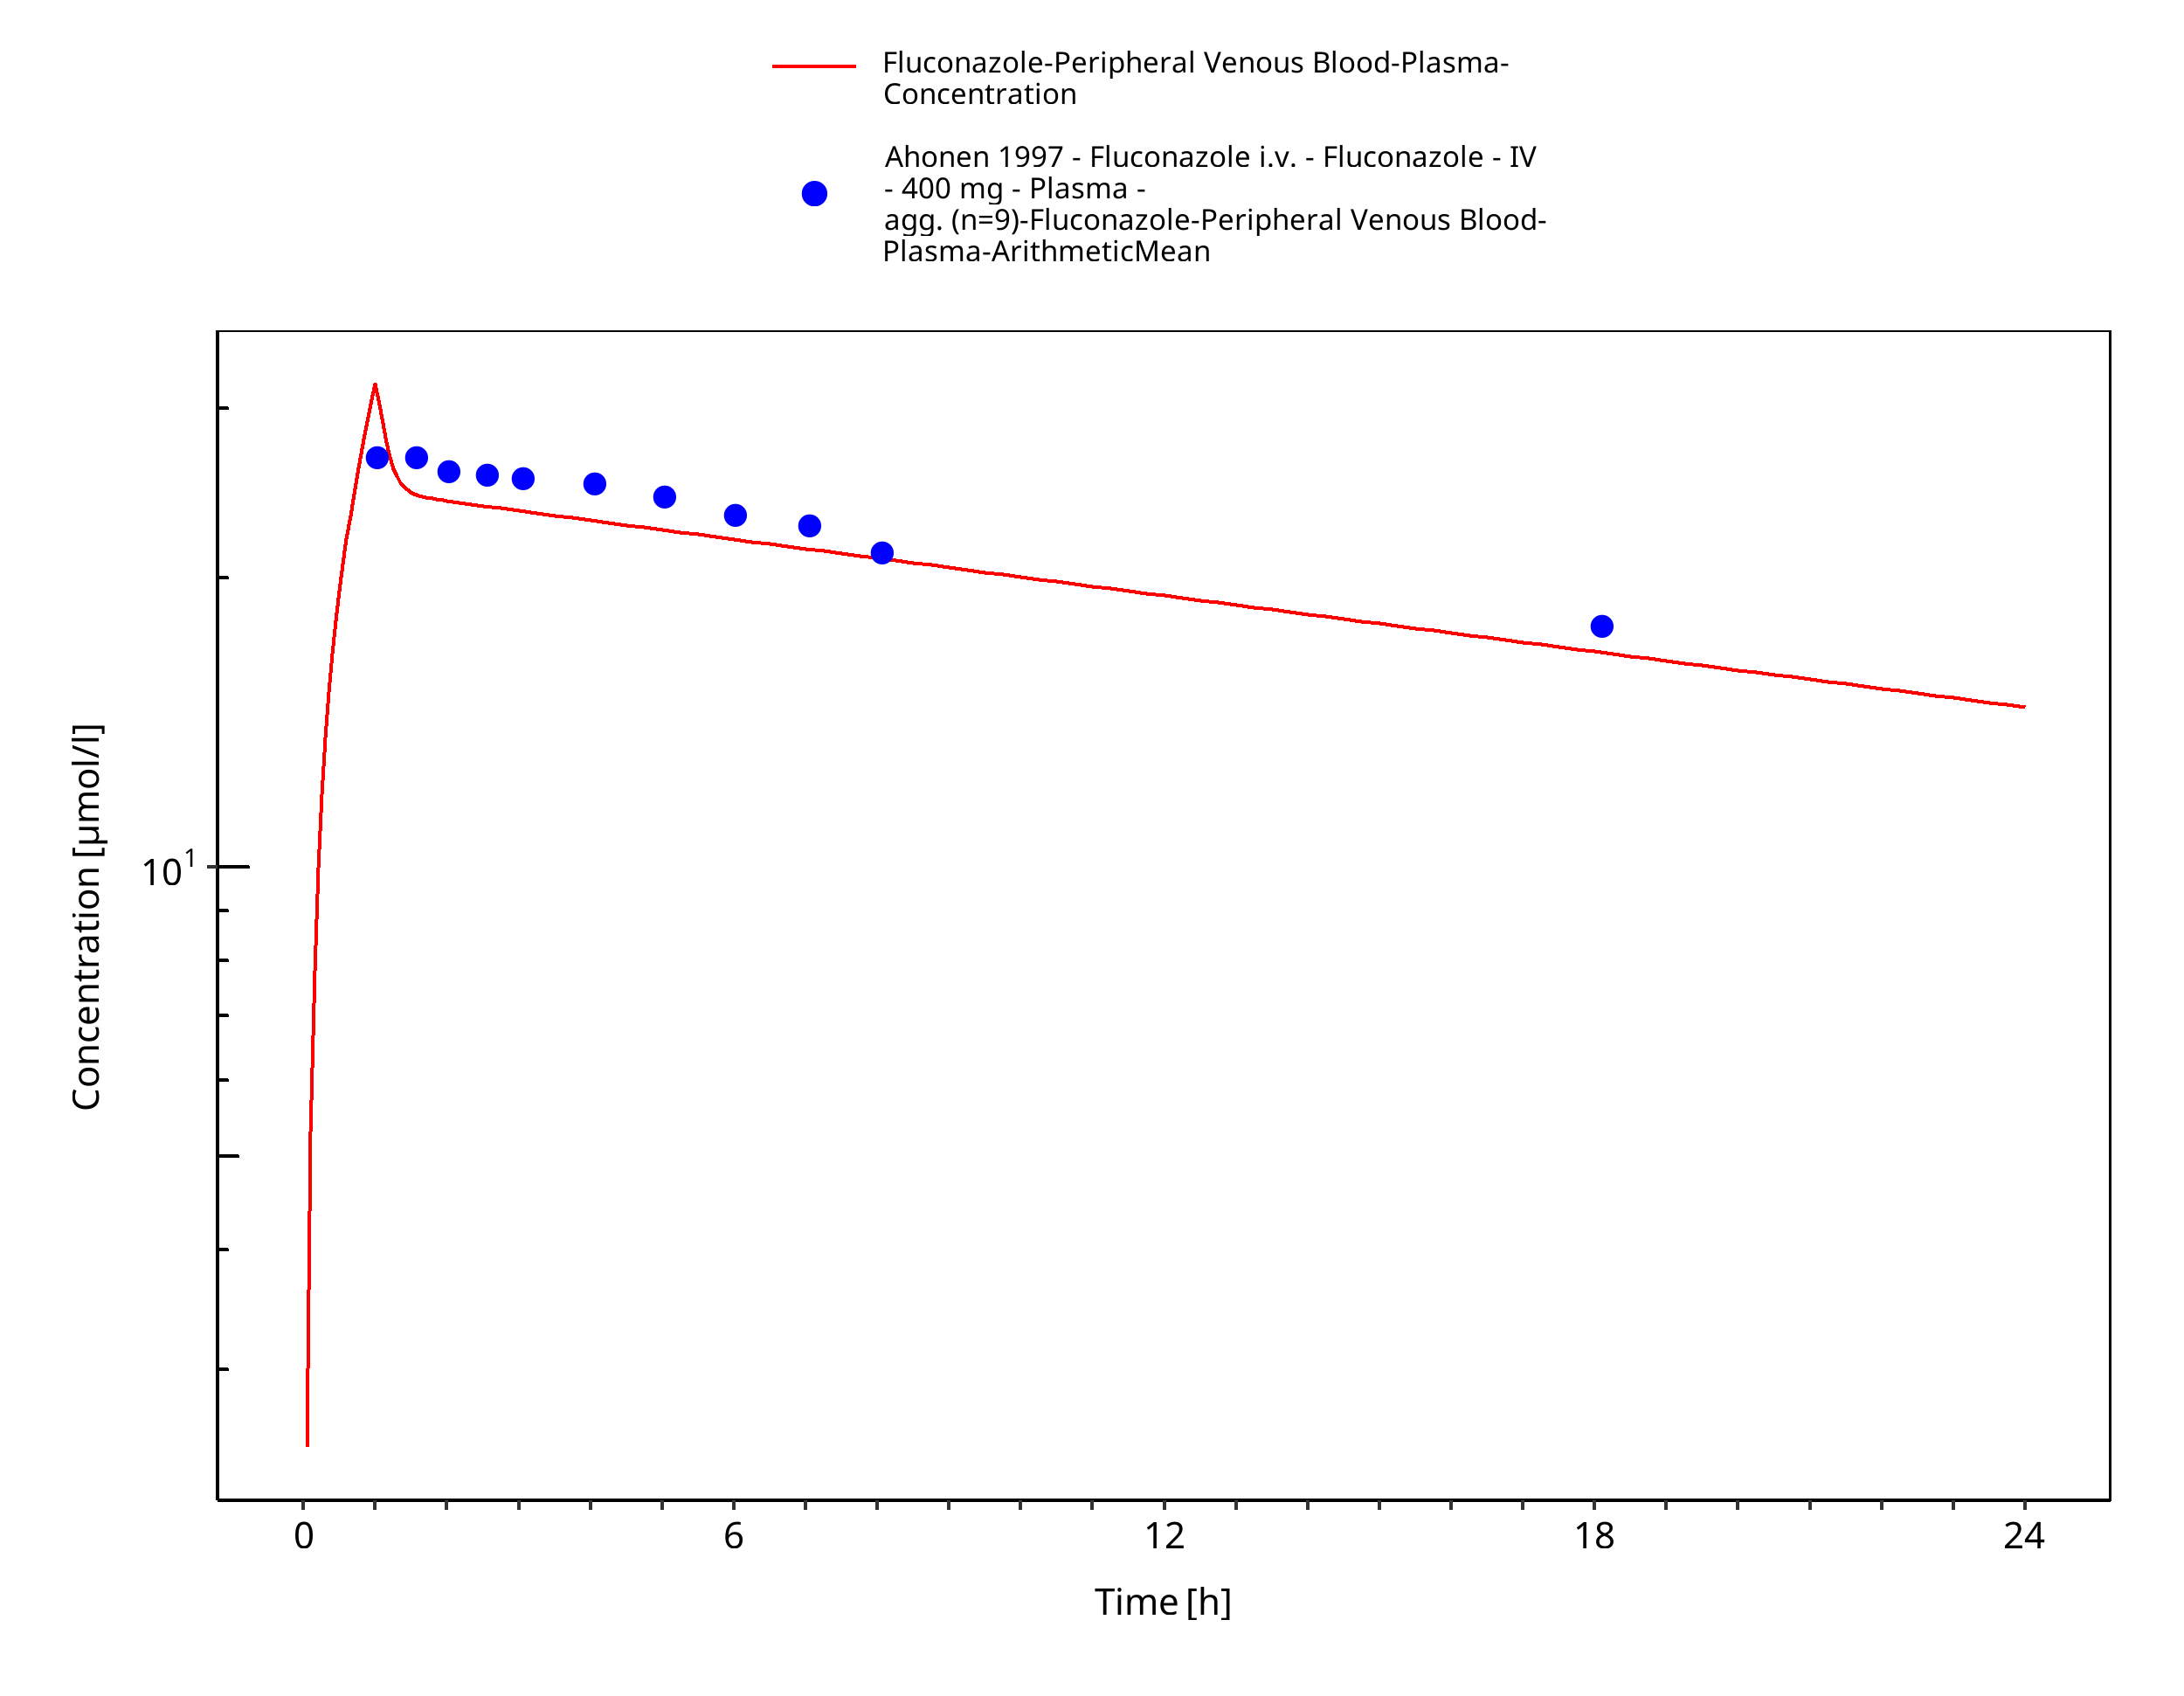
Figure 3-17: Time Profile Analysis
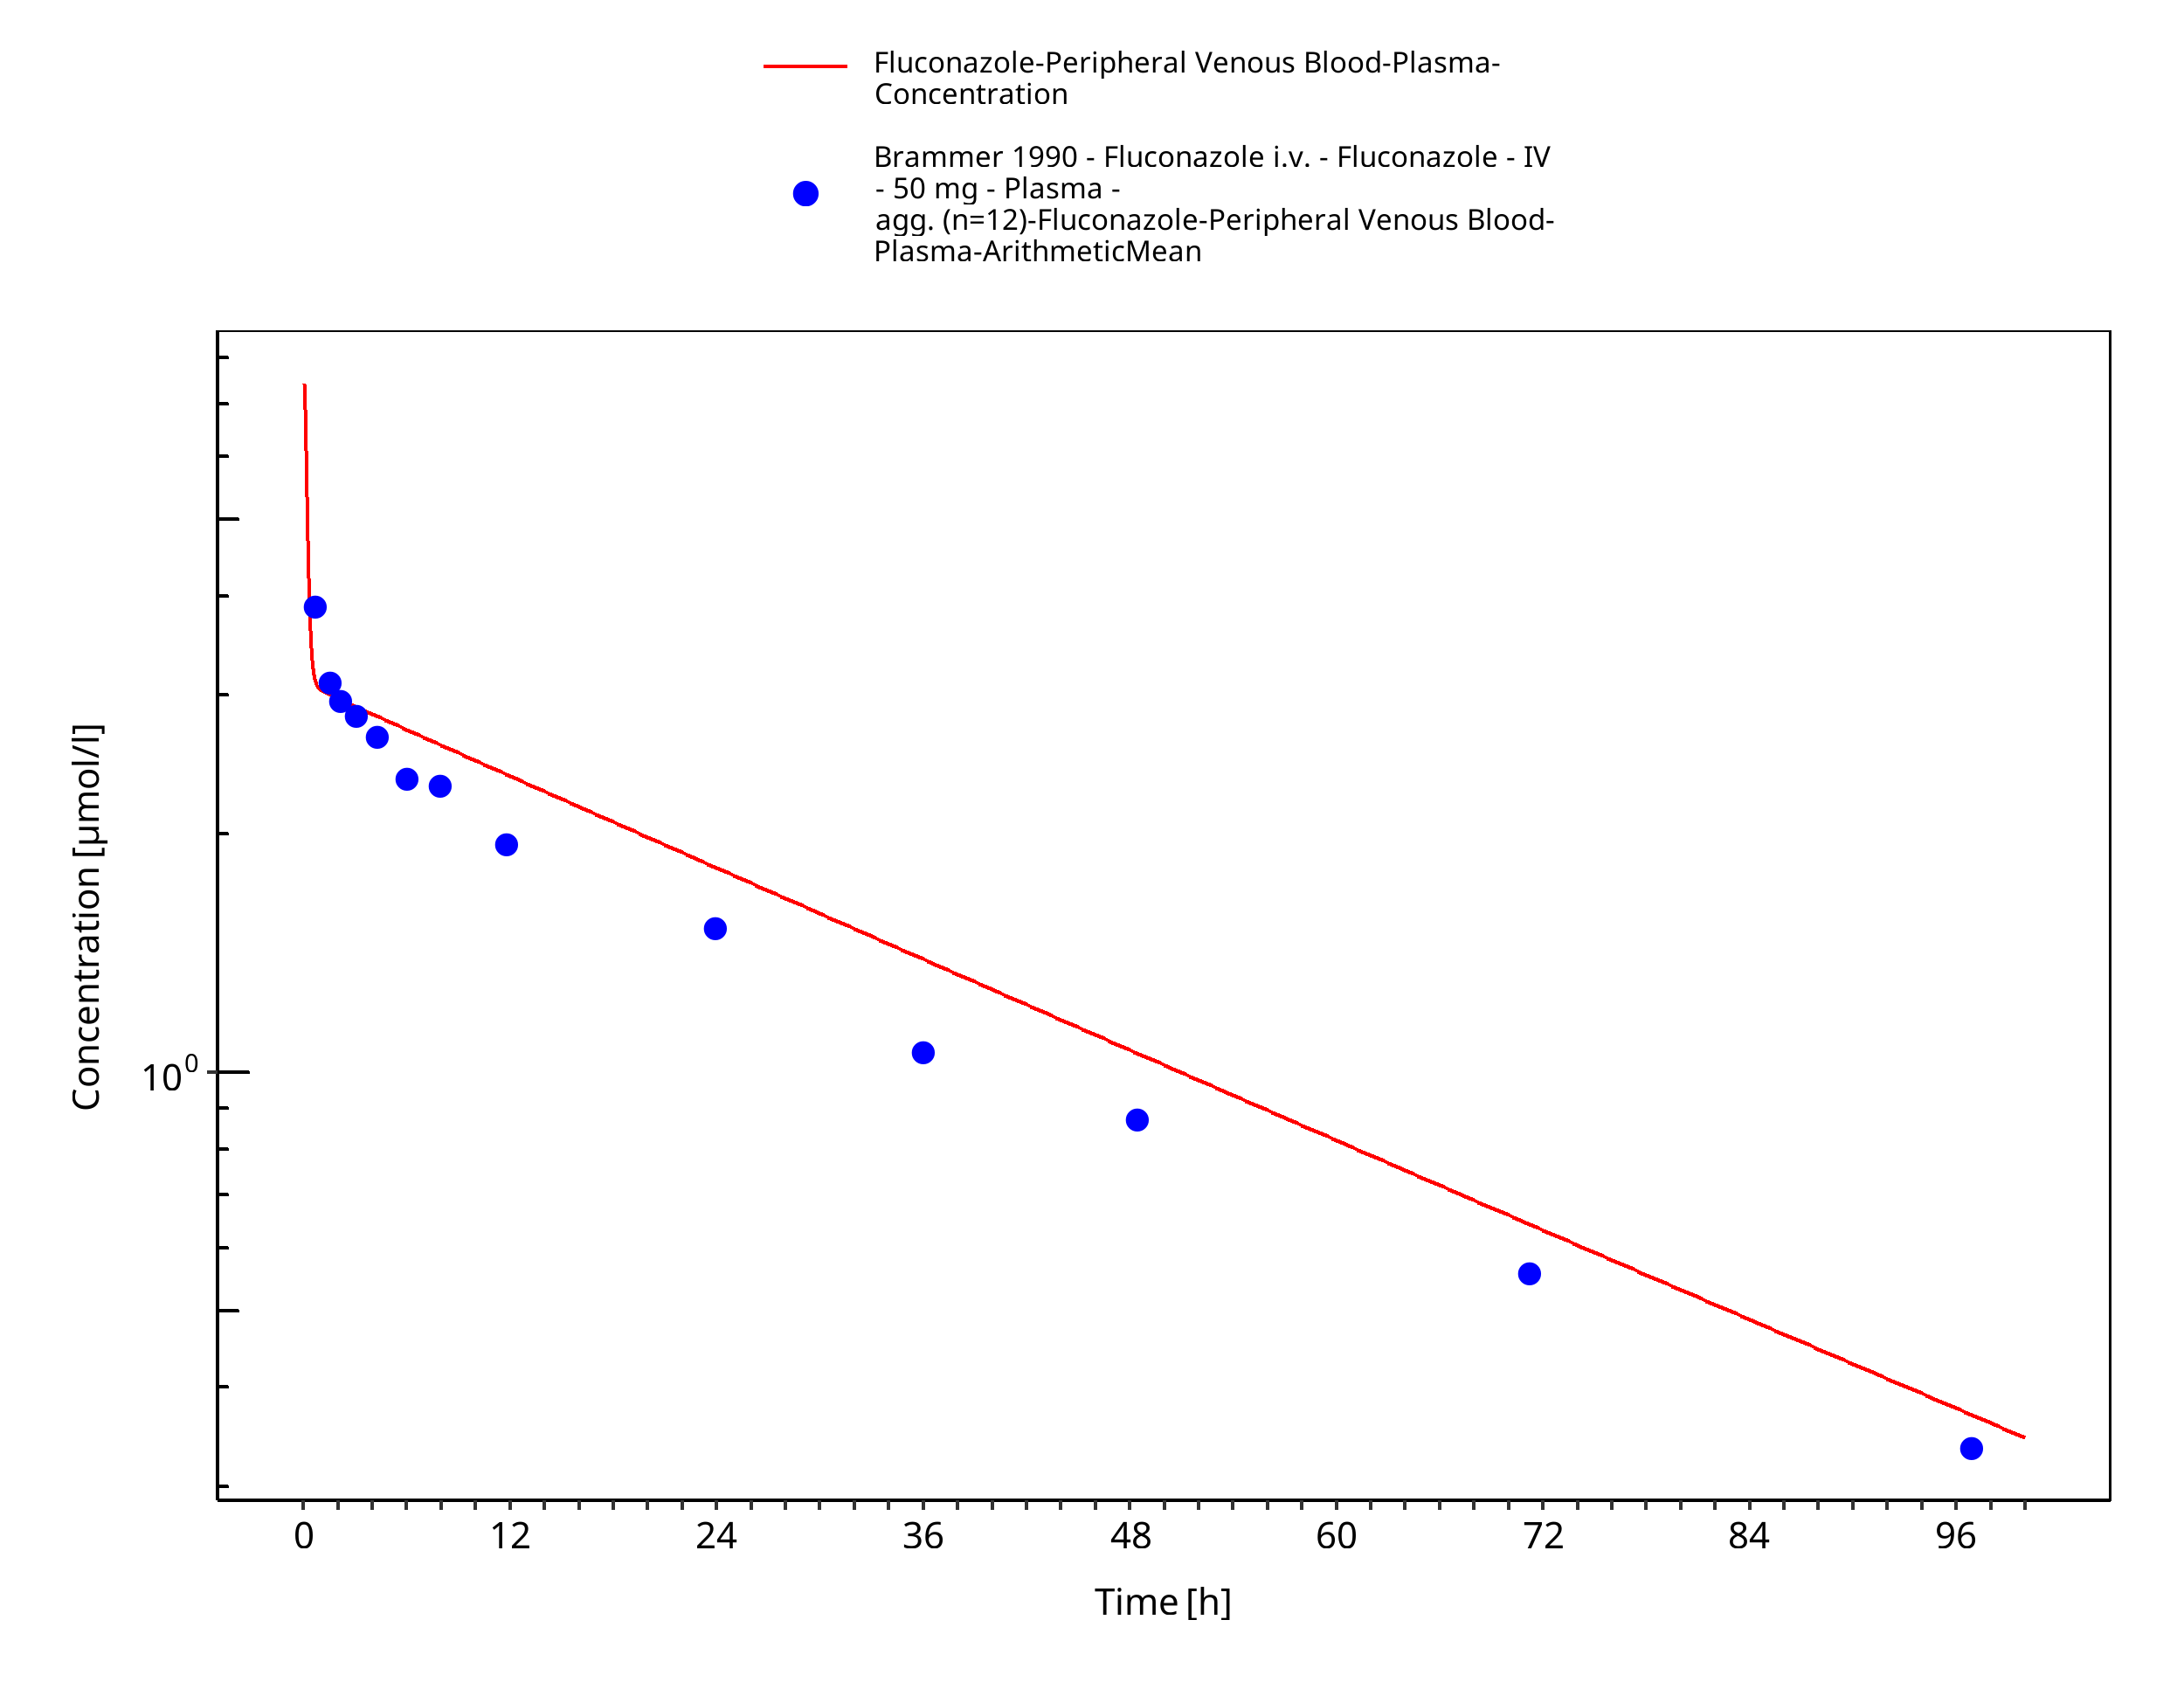
Figure 3-18: Time Profile Analysis
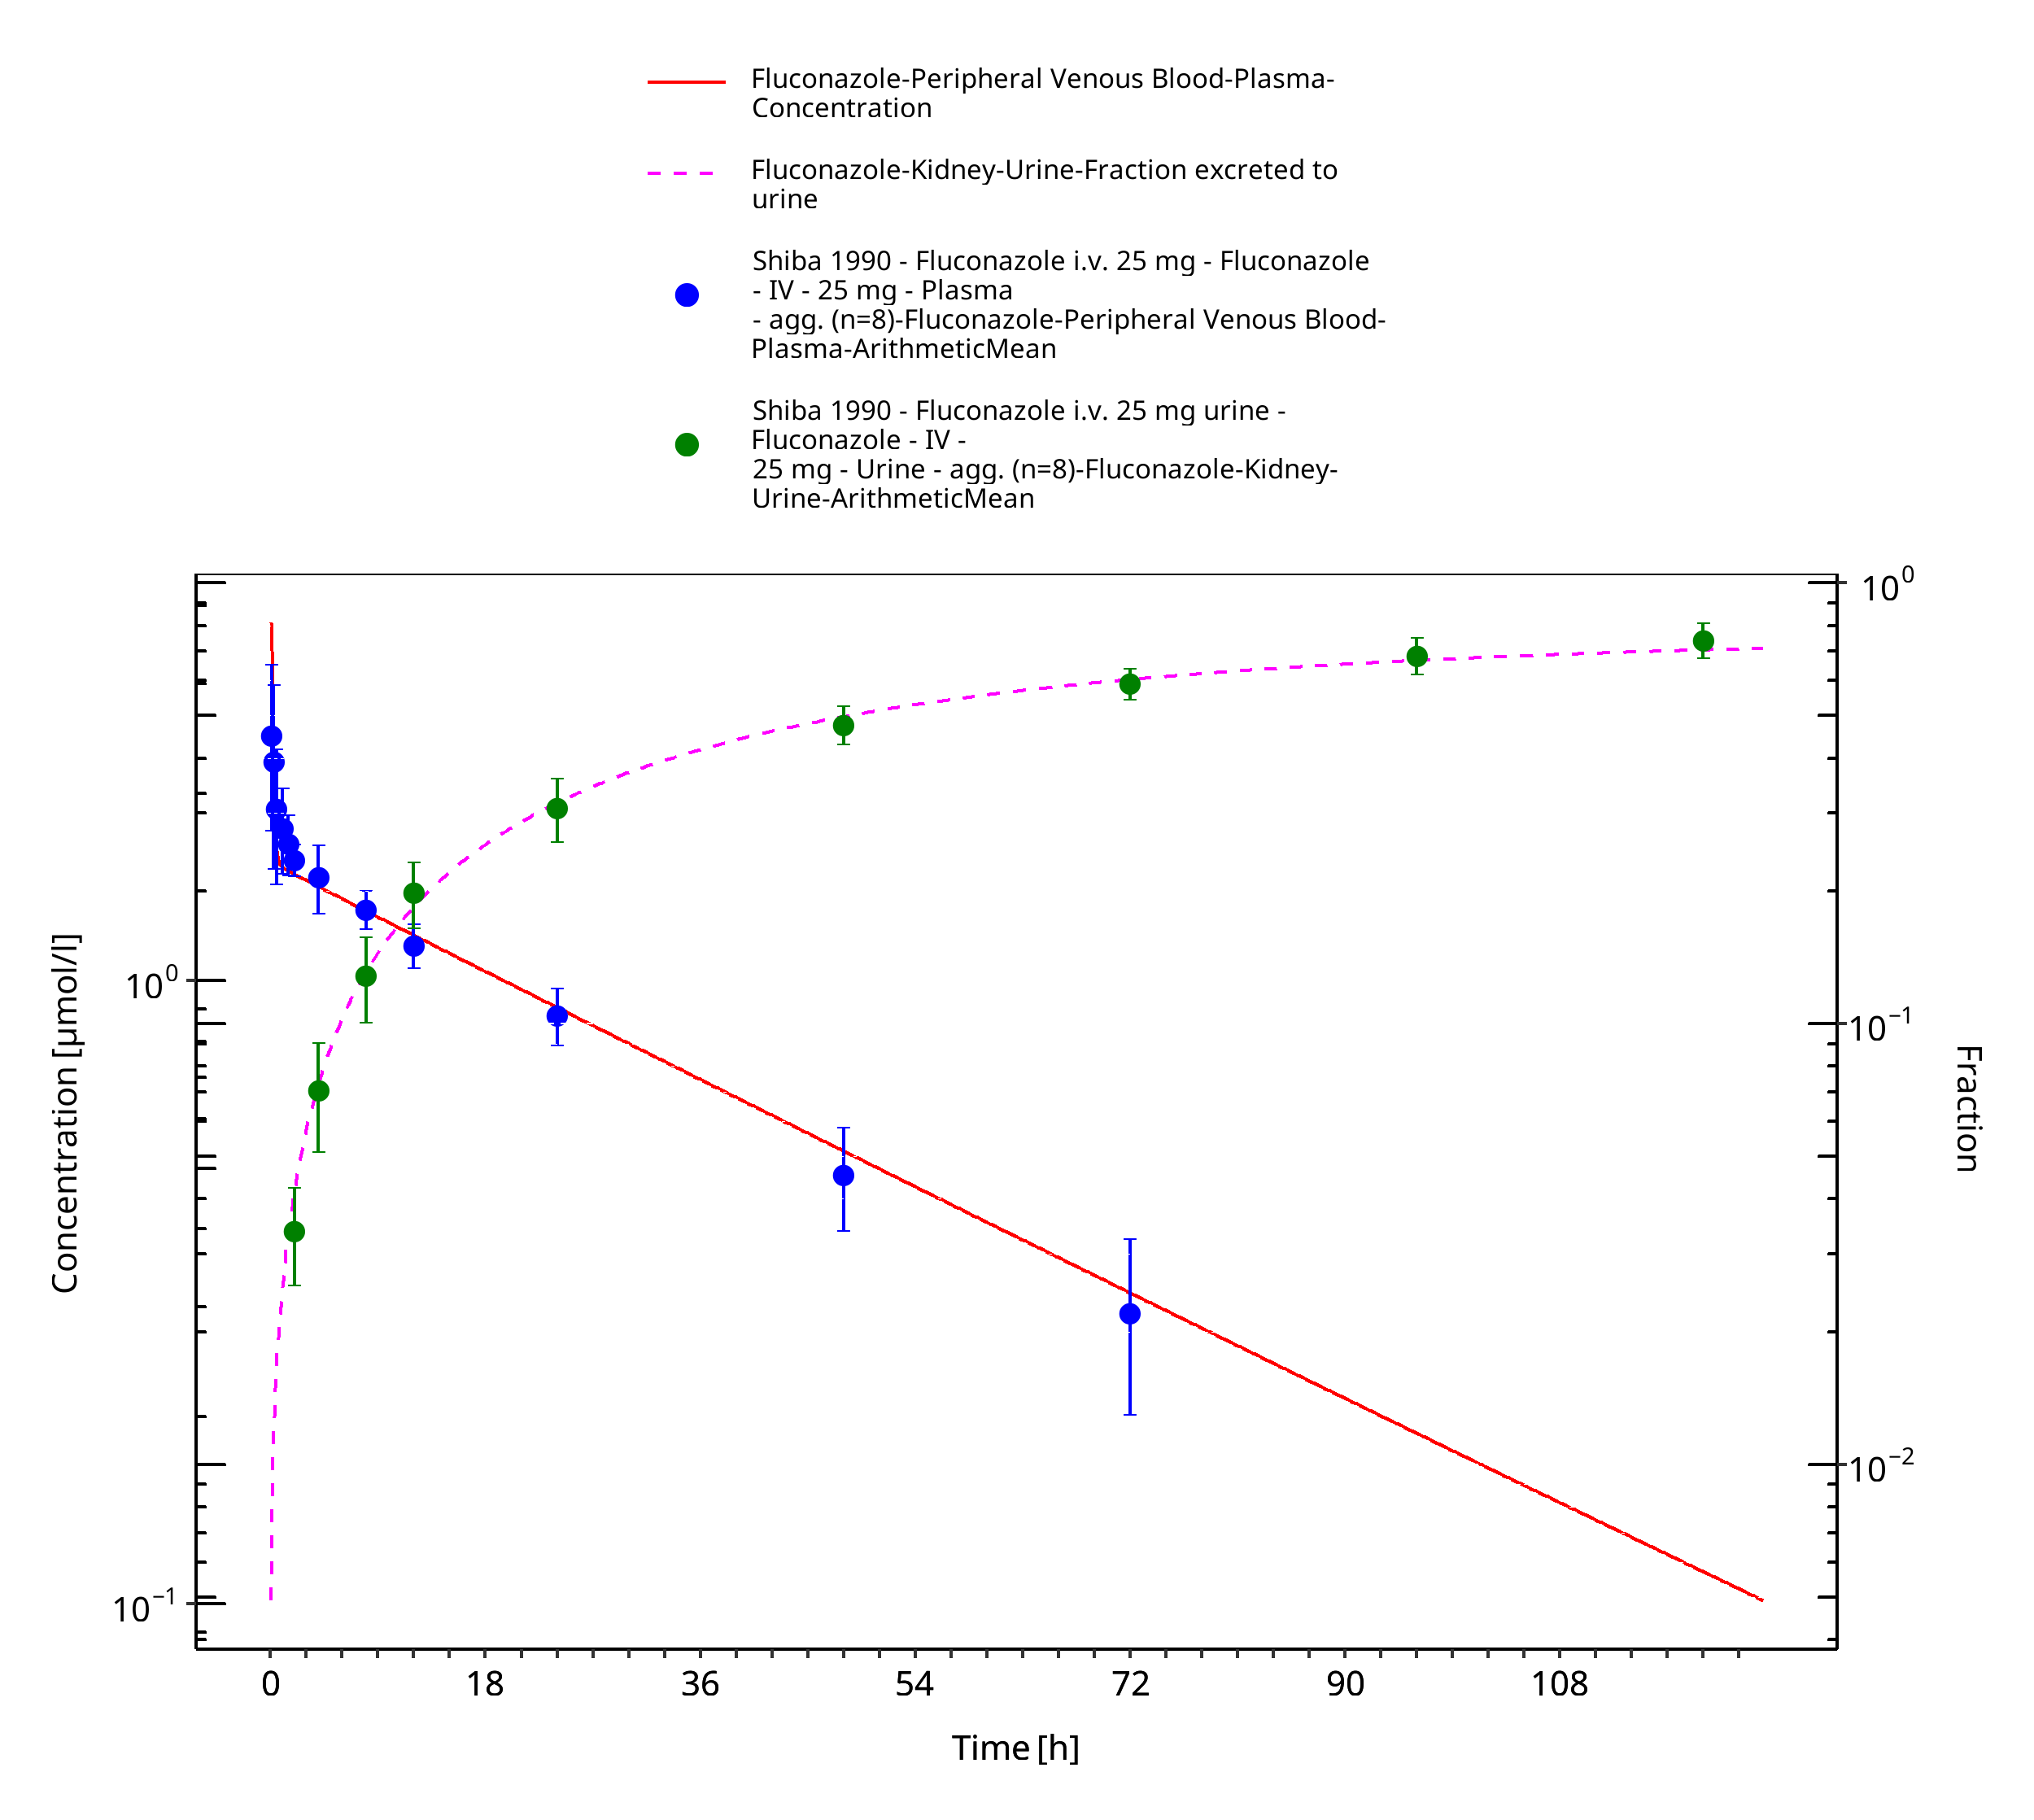
Figure 3-19: Time Profile Analysis
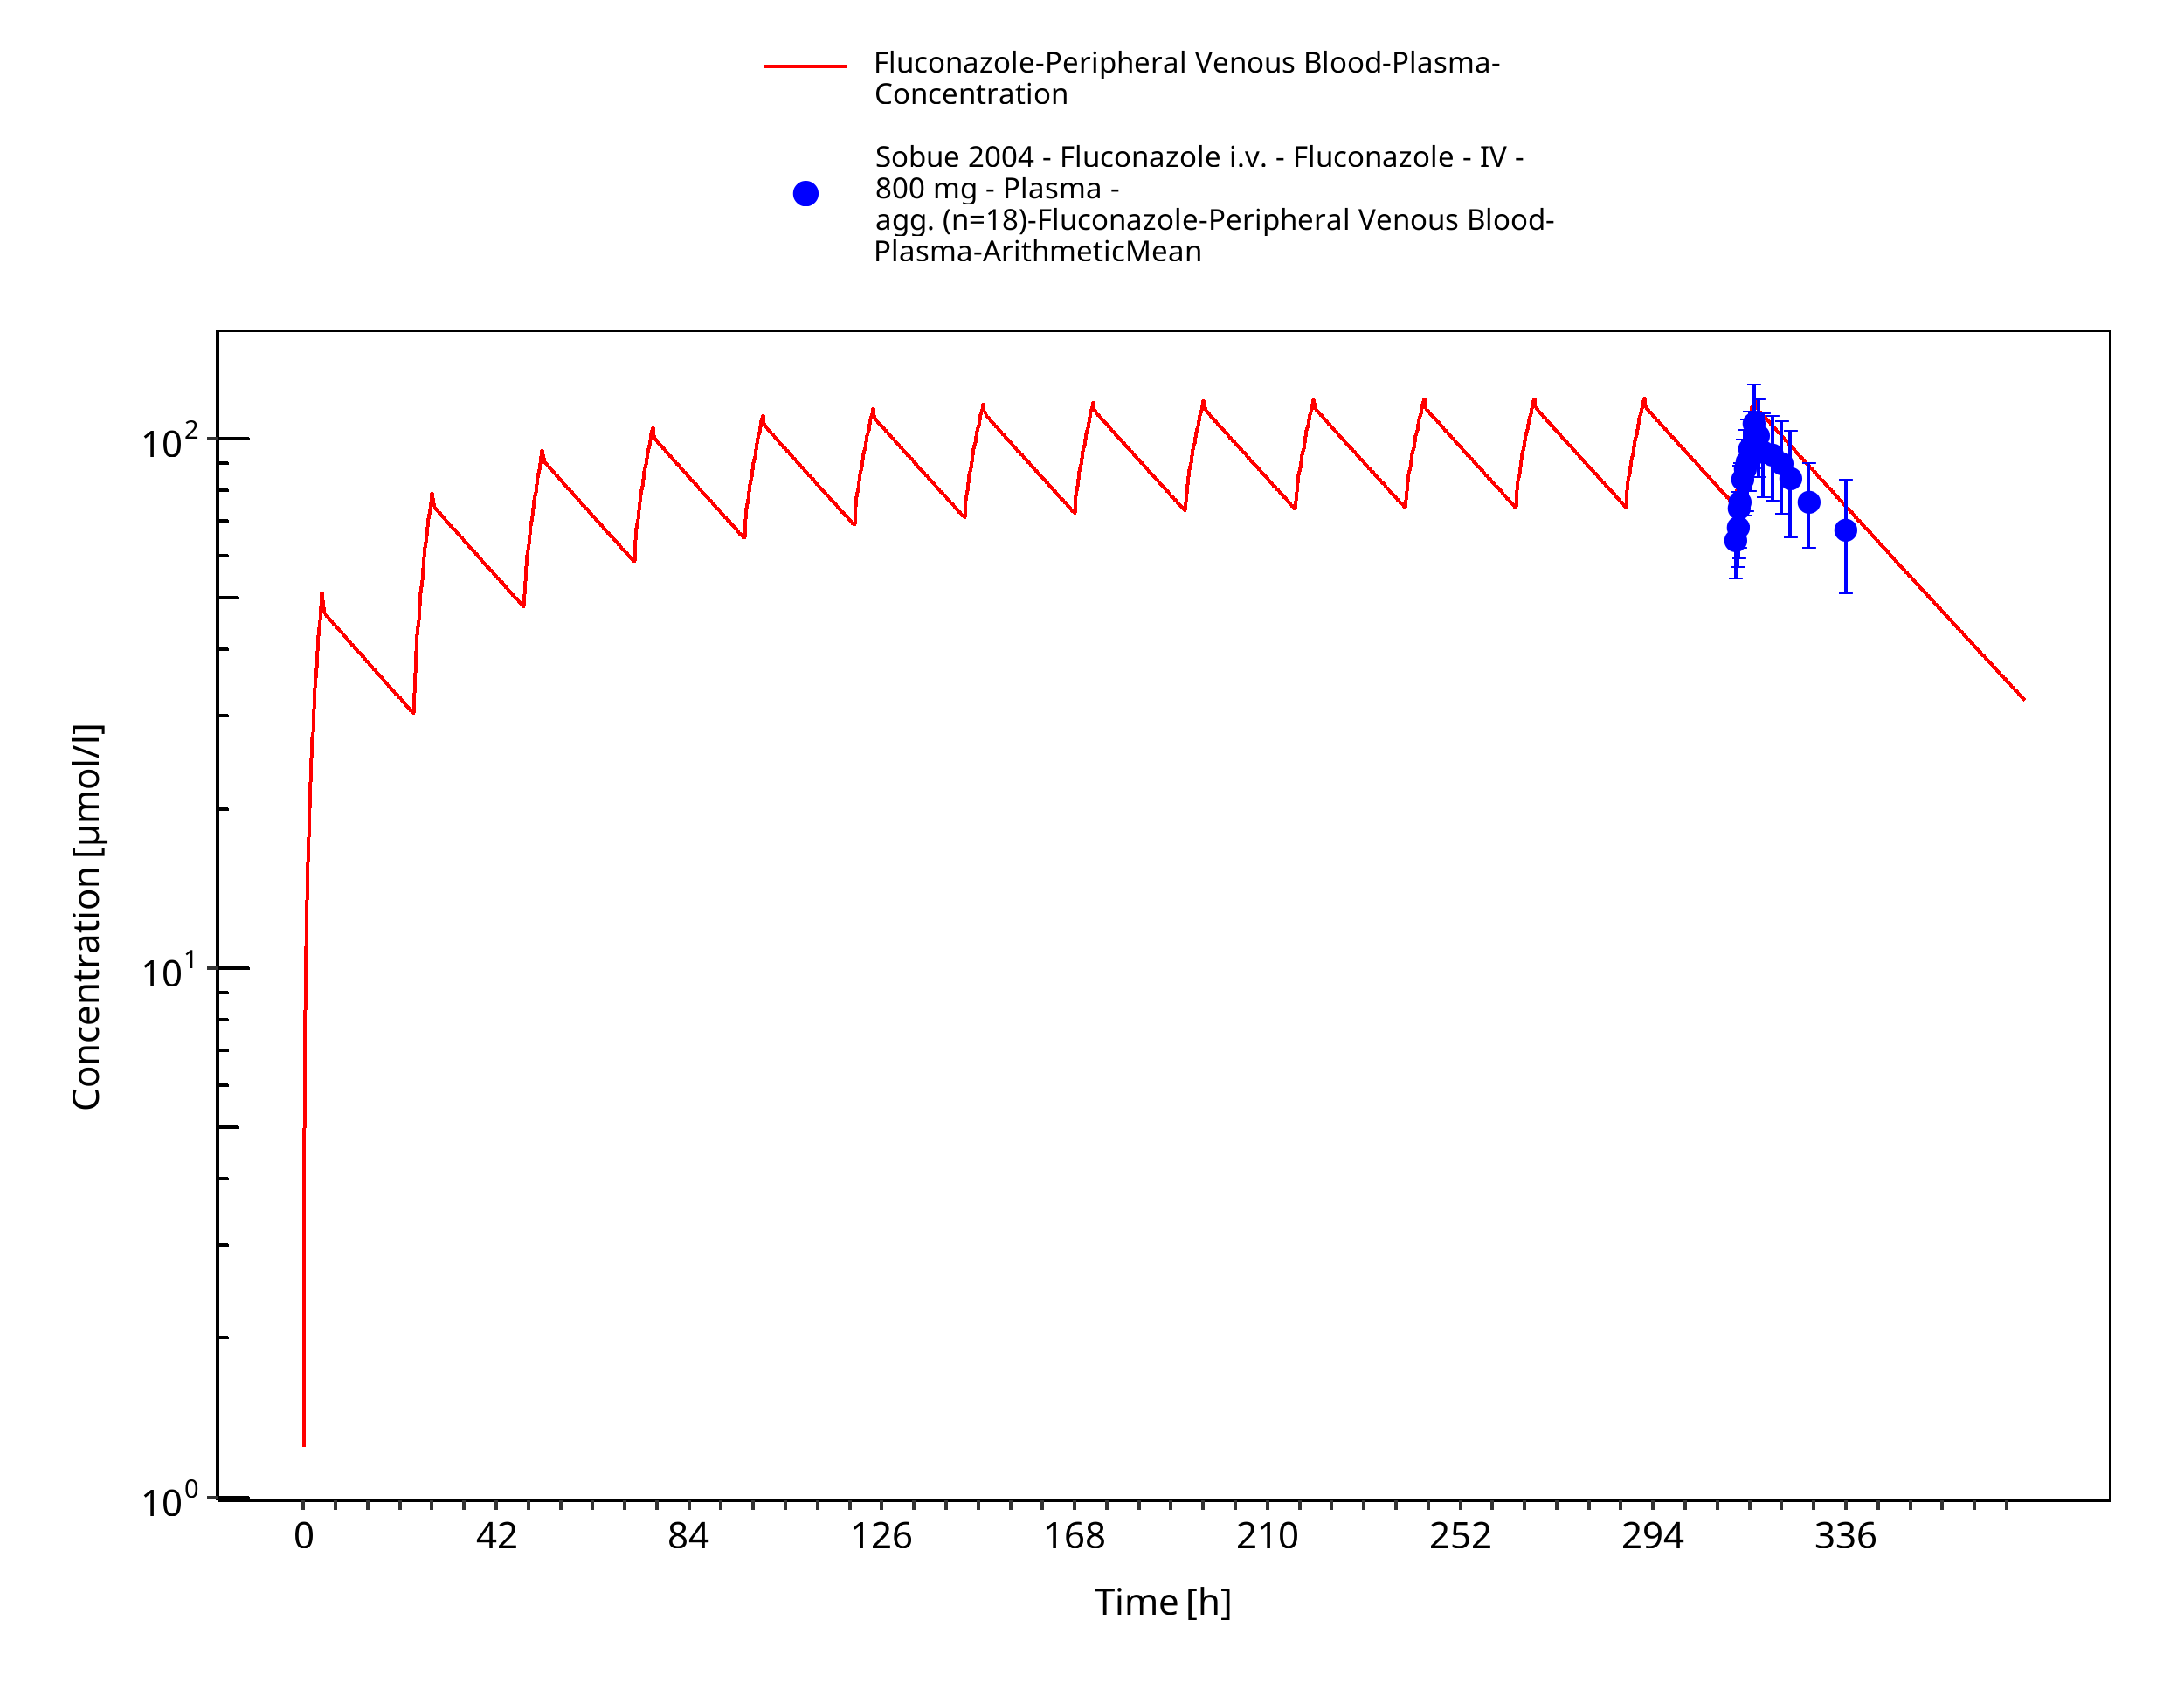
Figure 3-20: Time Profile Analysis
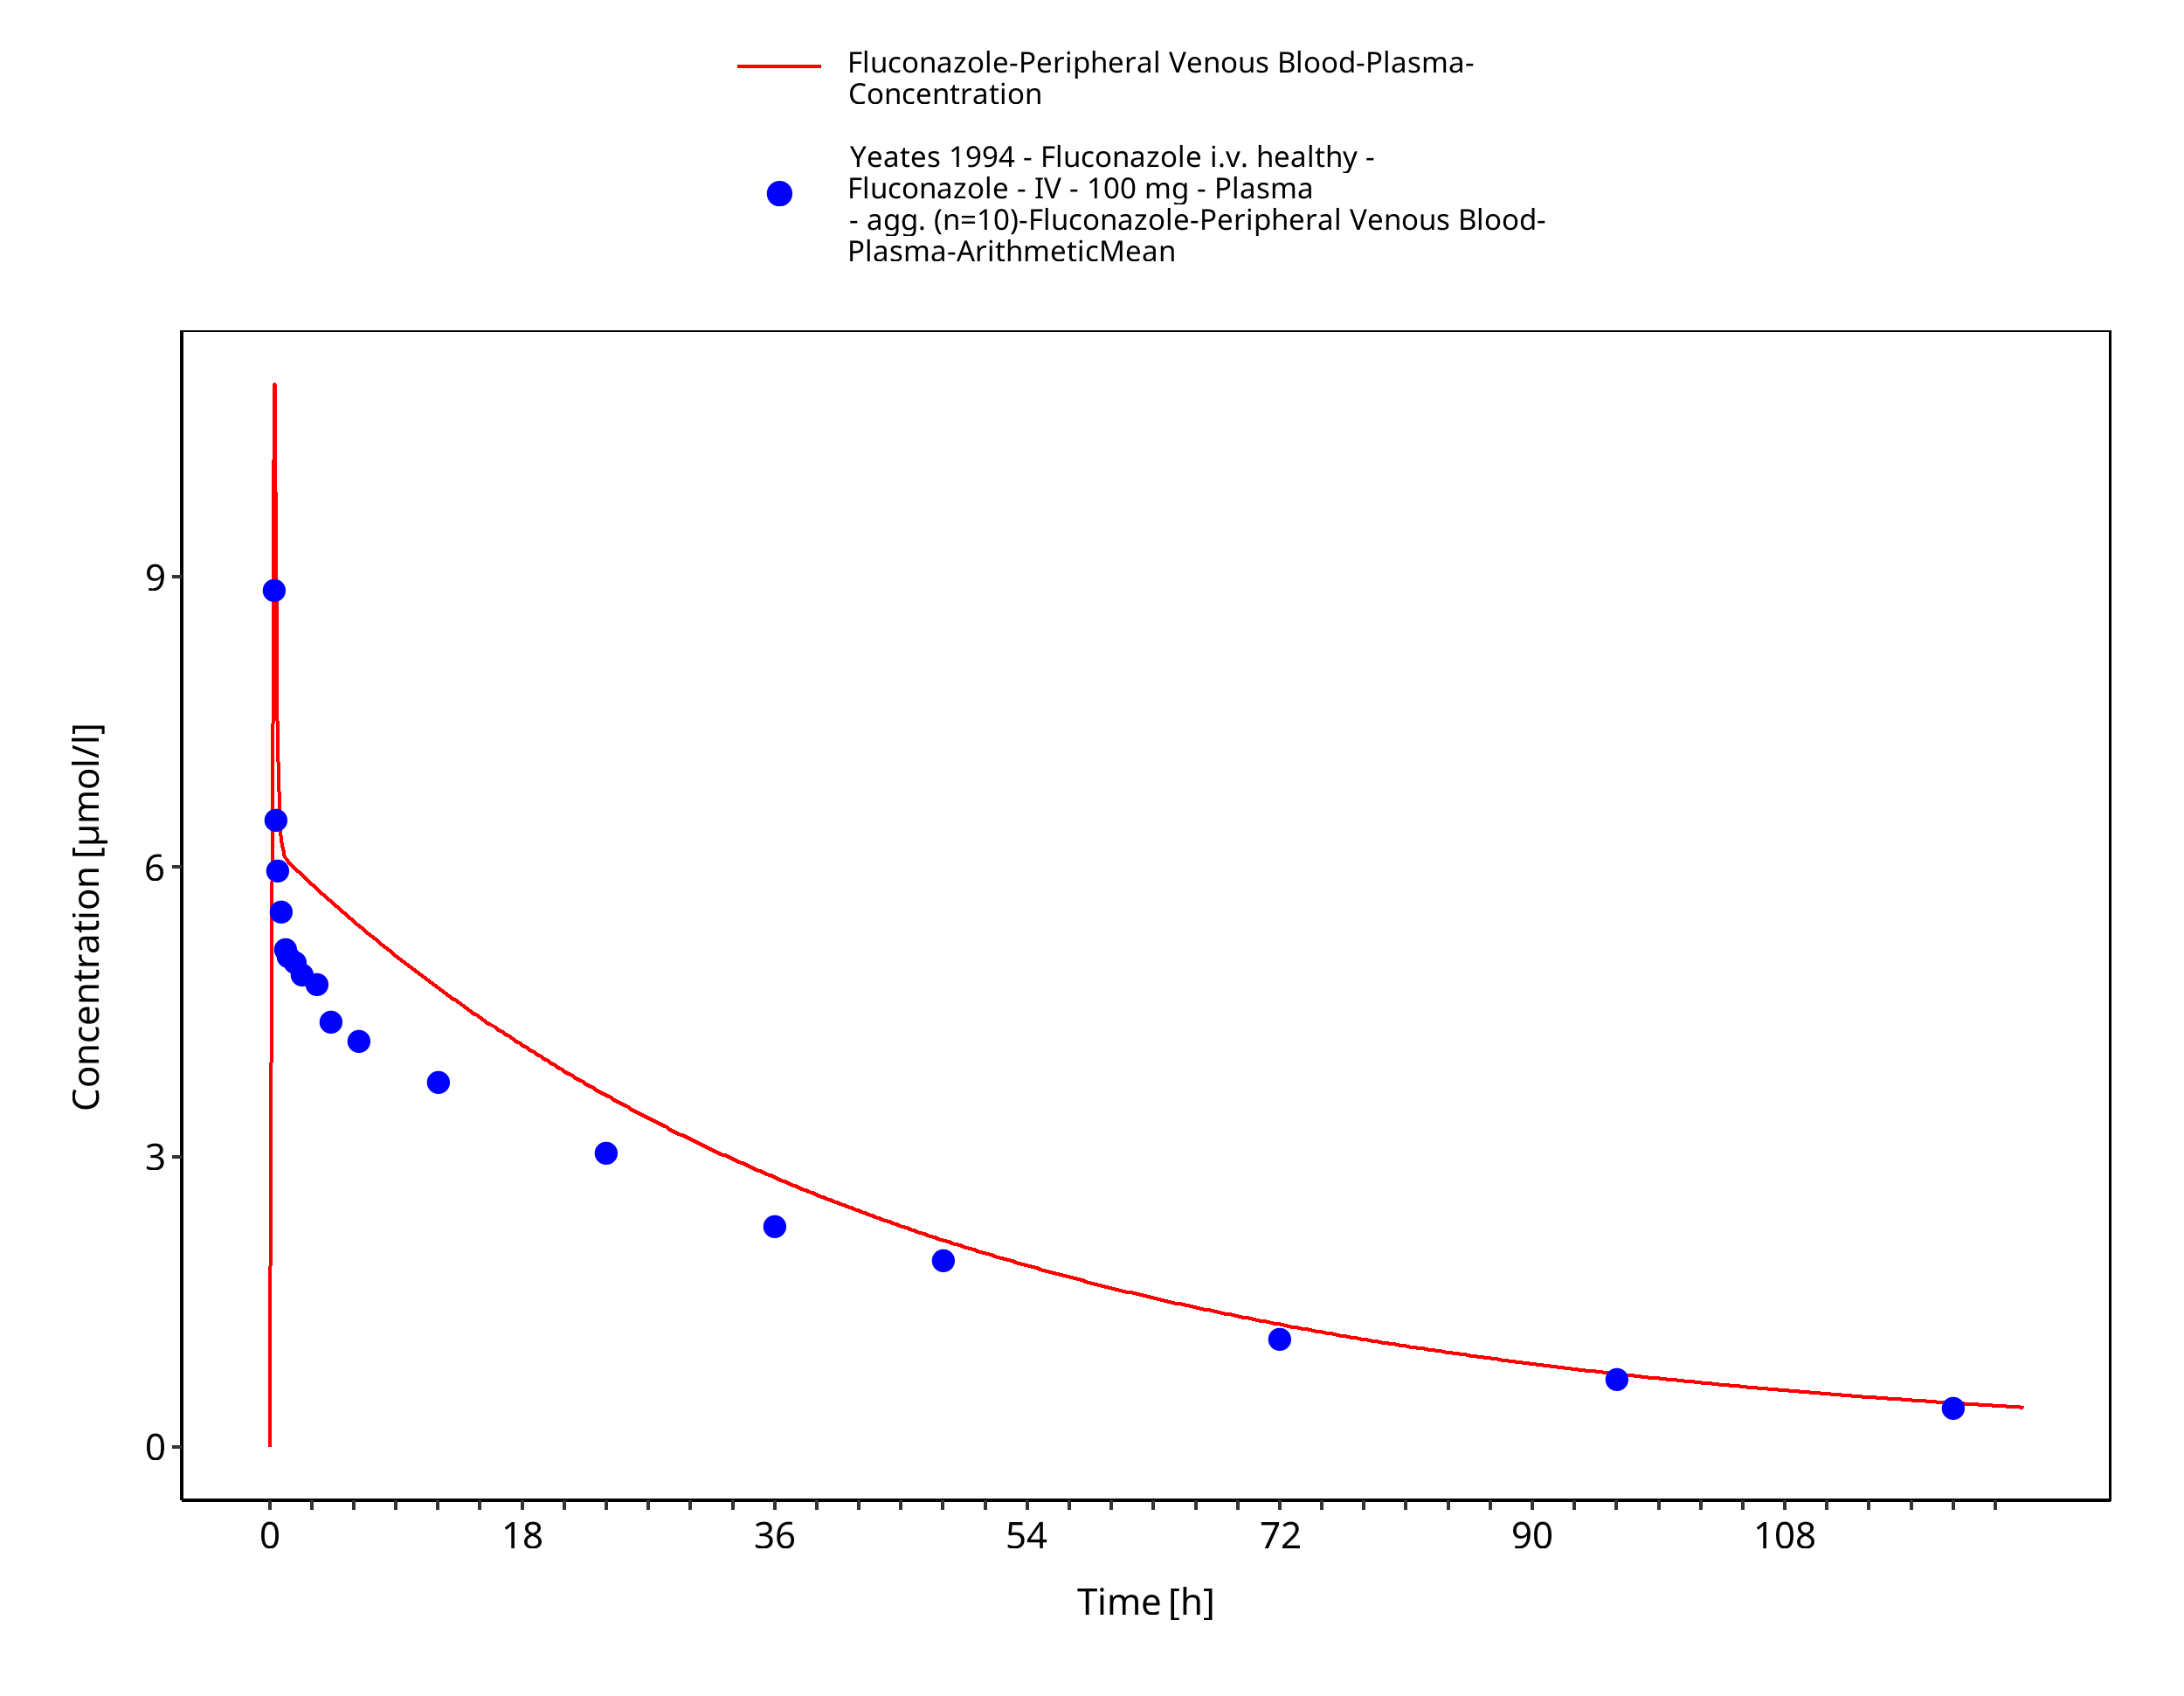
Figure 3-21: Time Profile Analysis
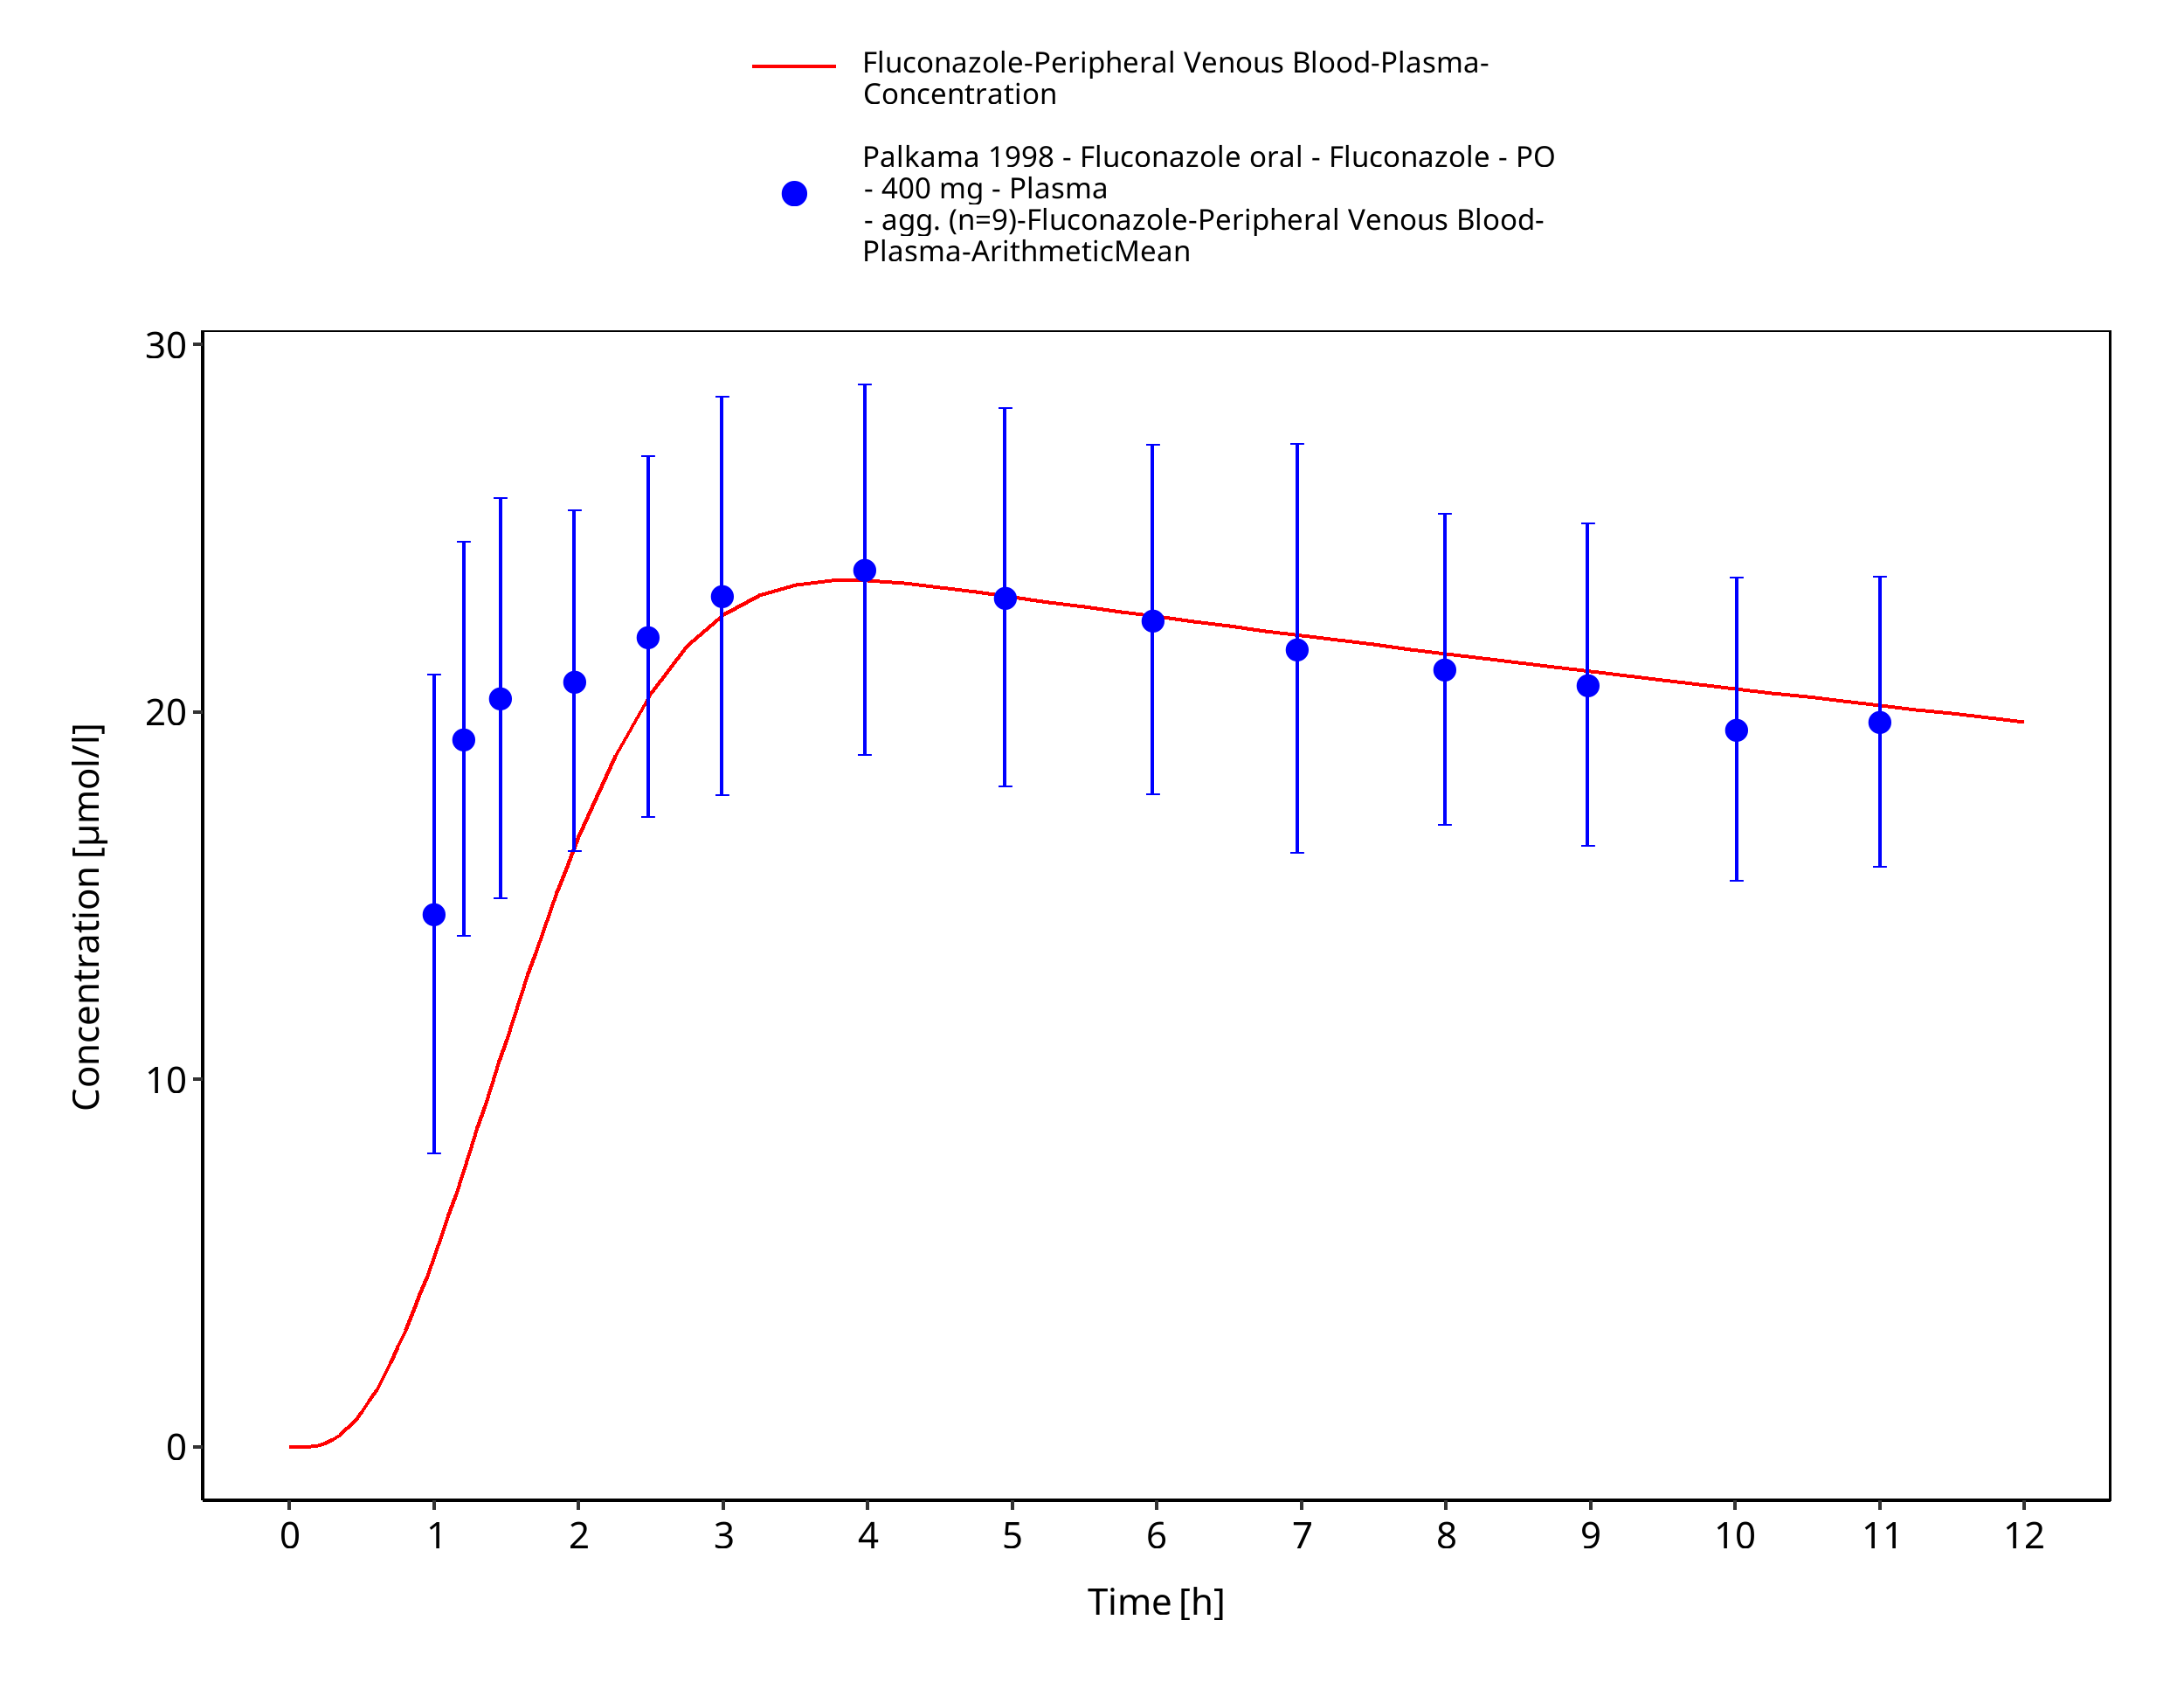
Figure 3-22: Time Profile Analysis
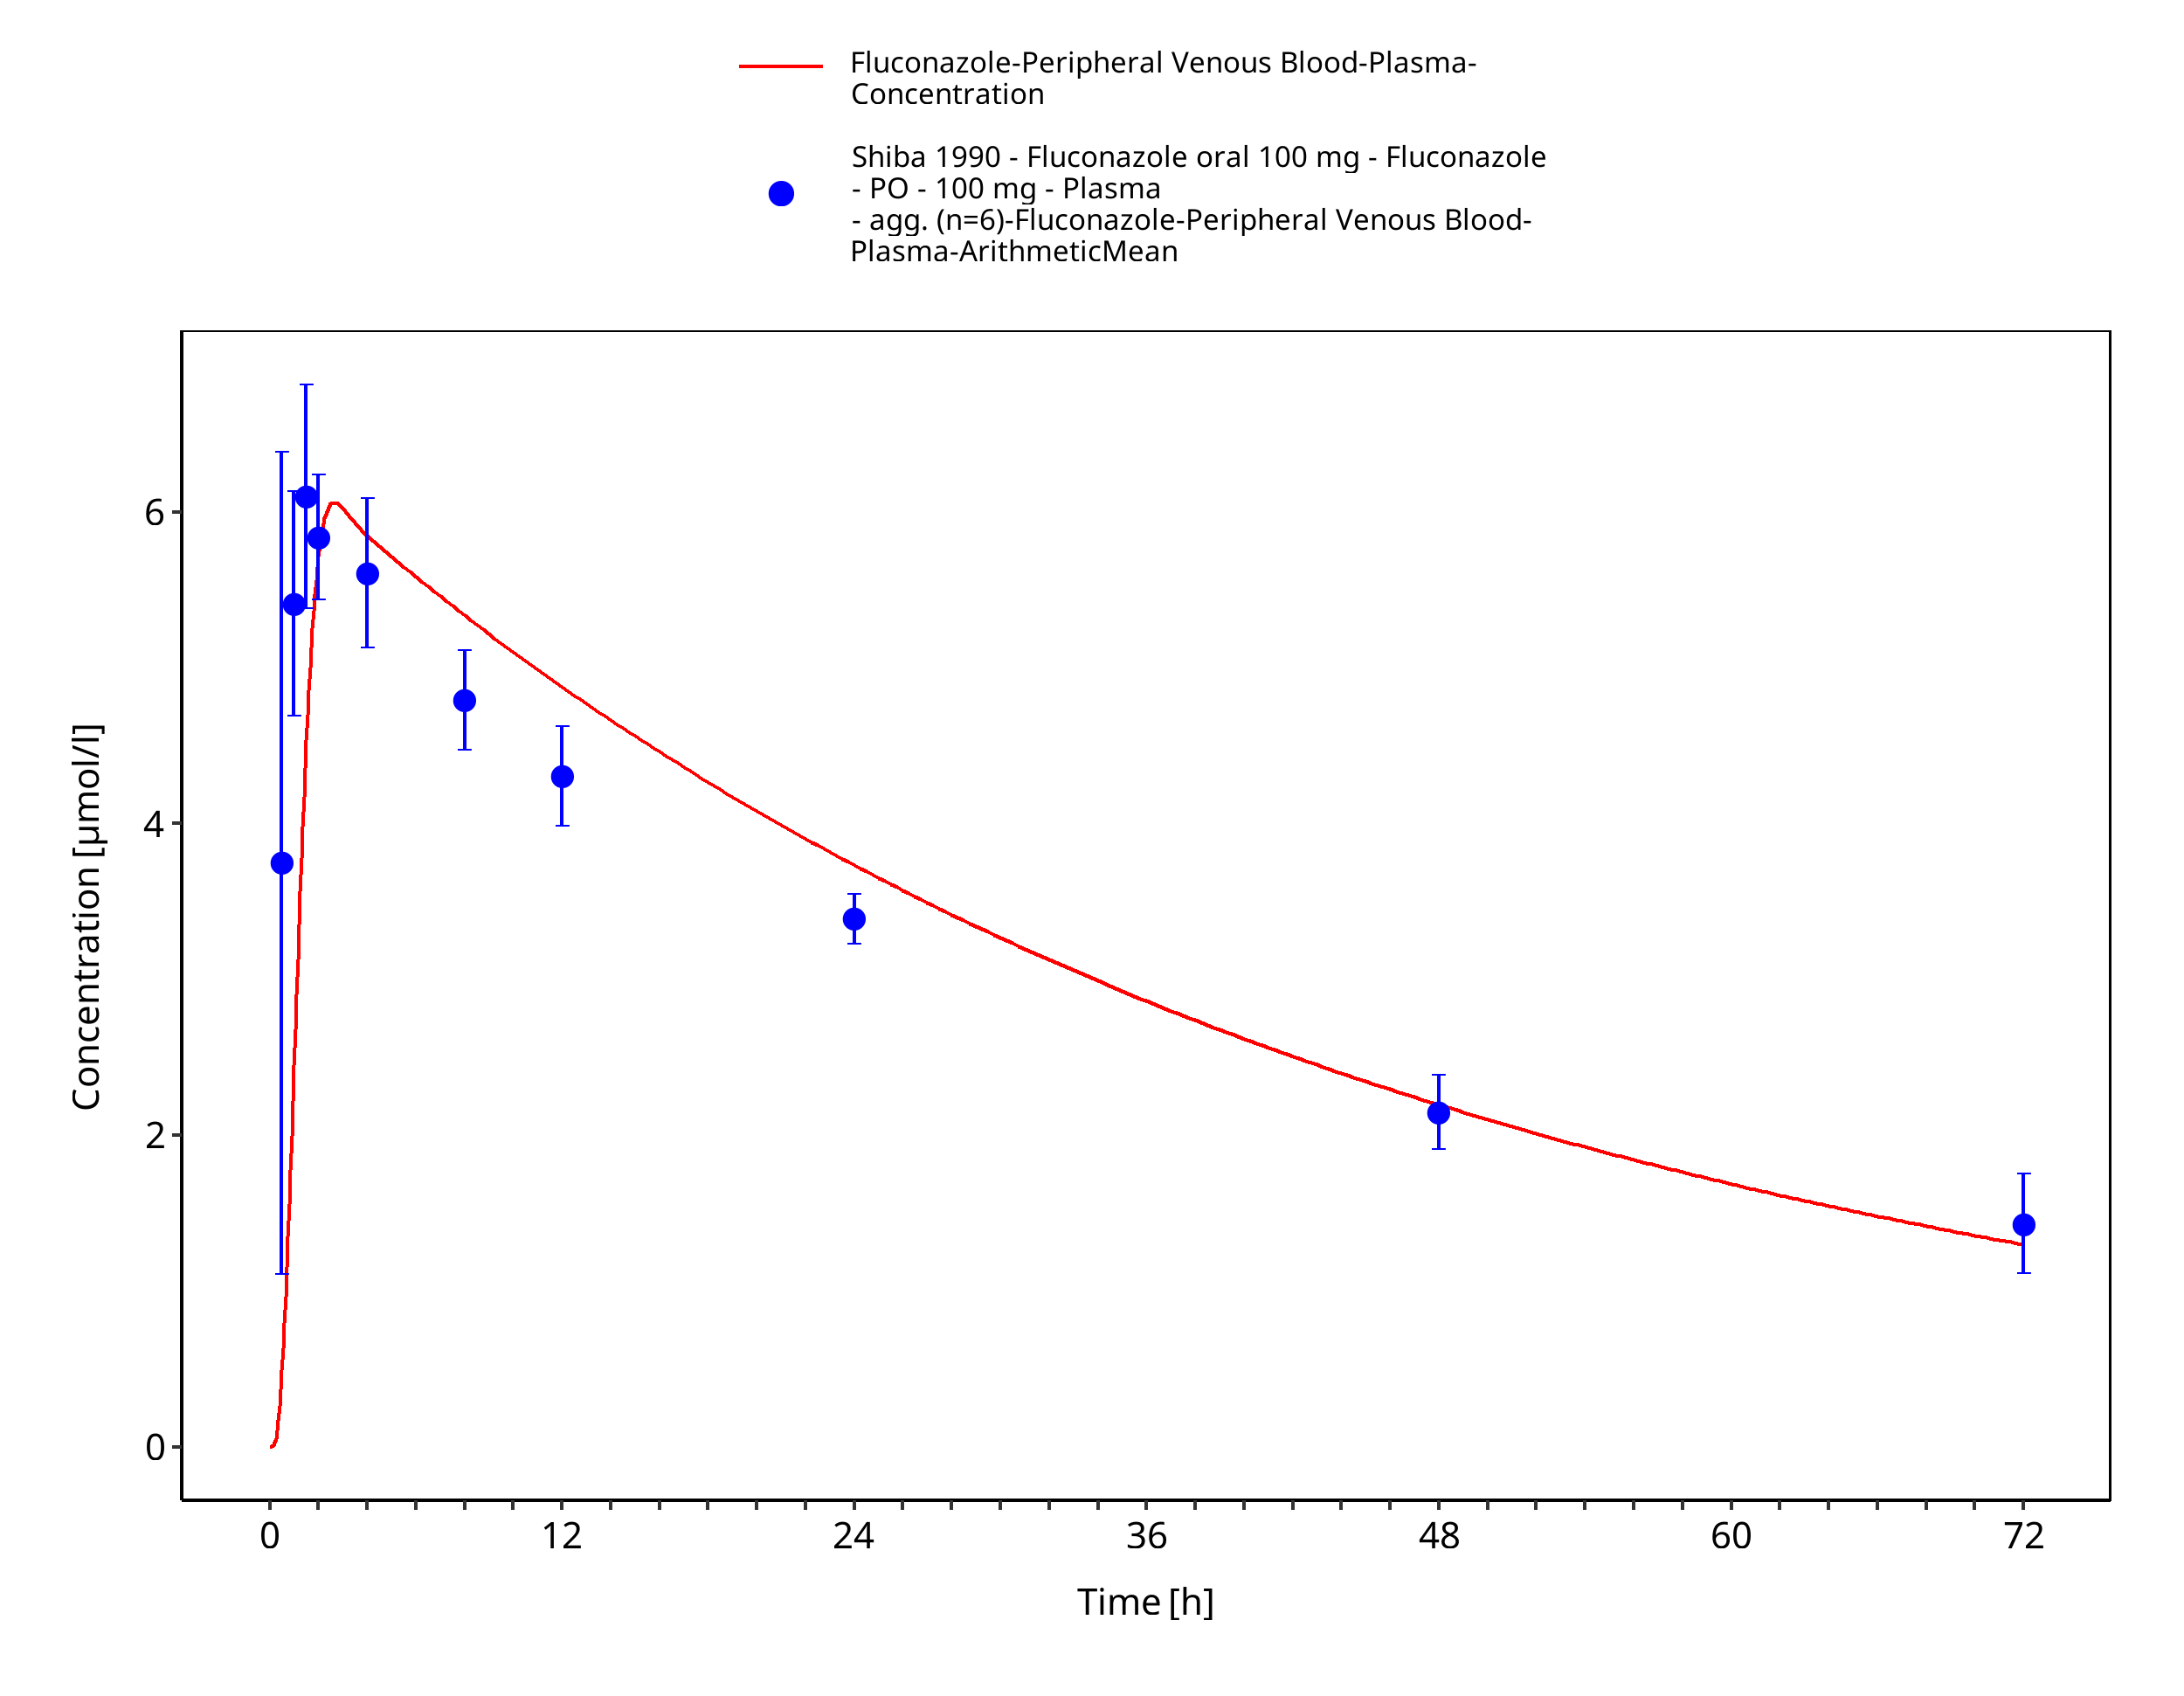
Figure 3-23: Time Profile Analysis
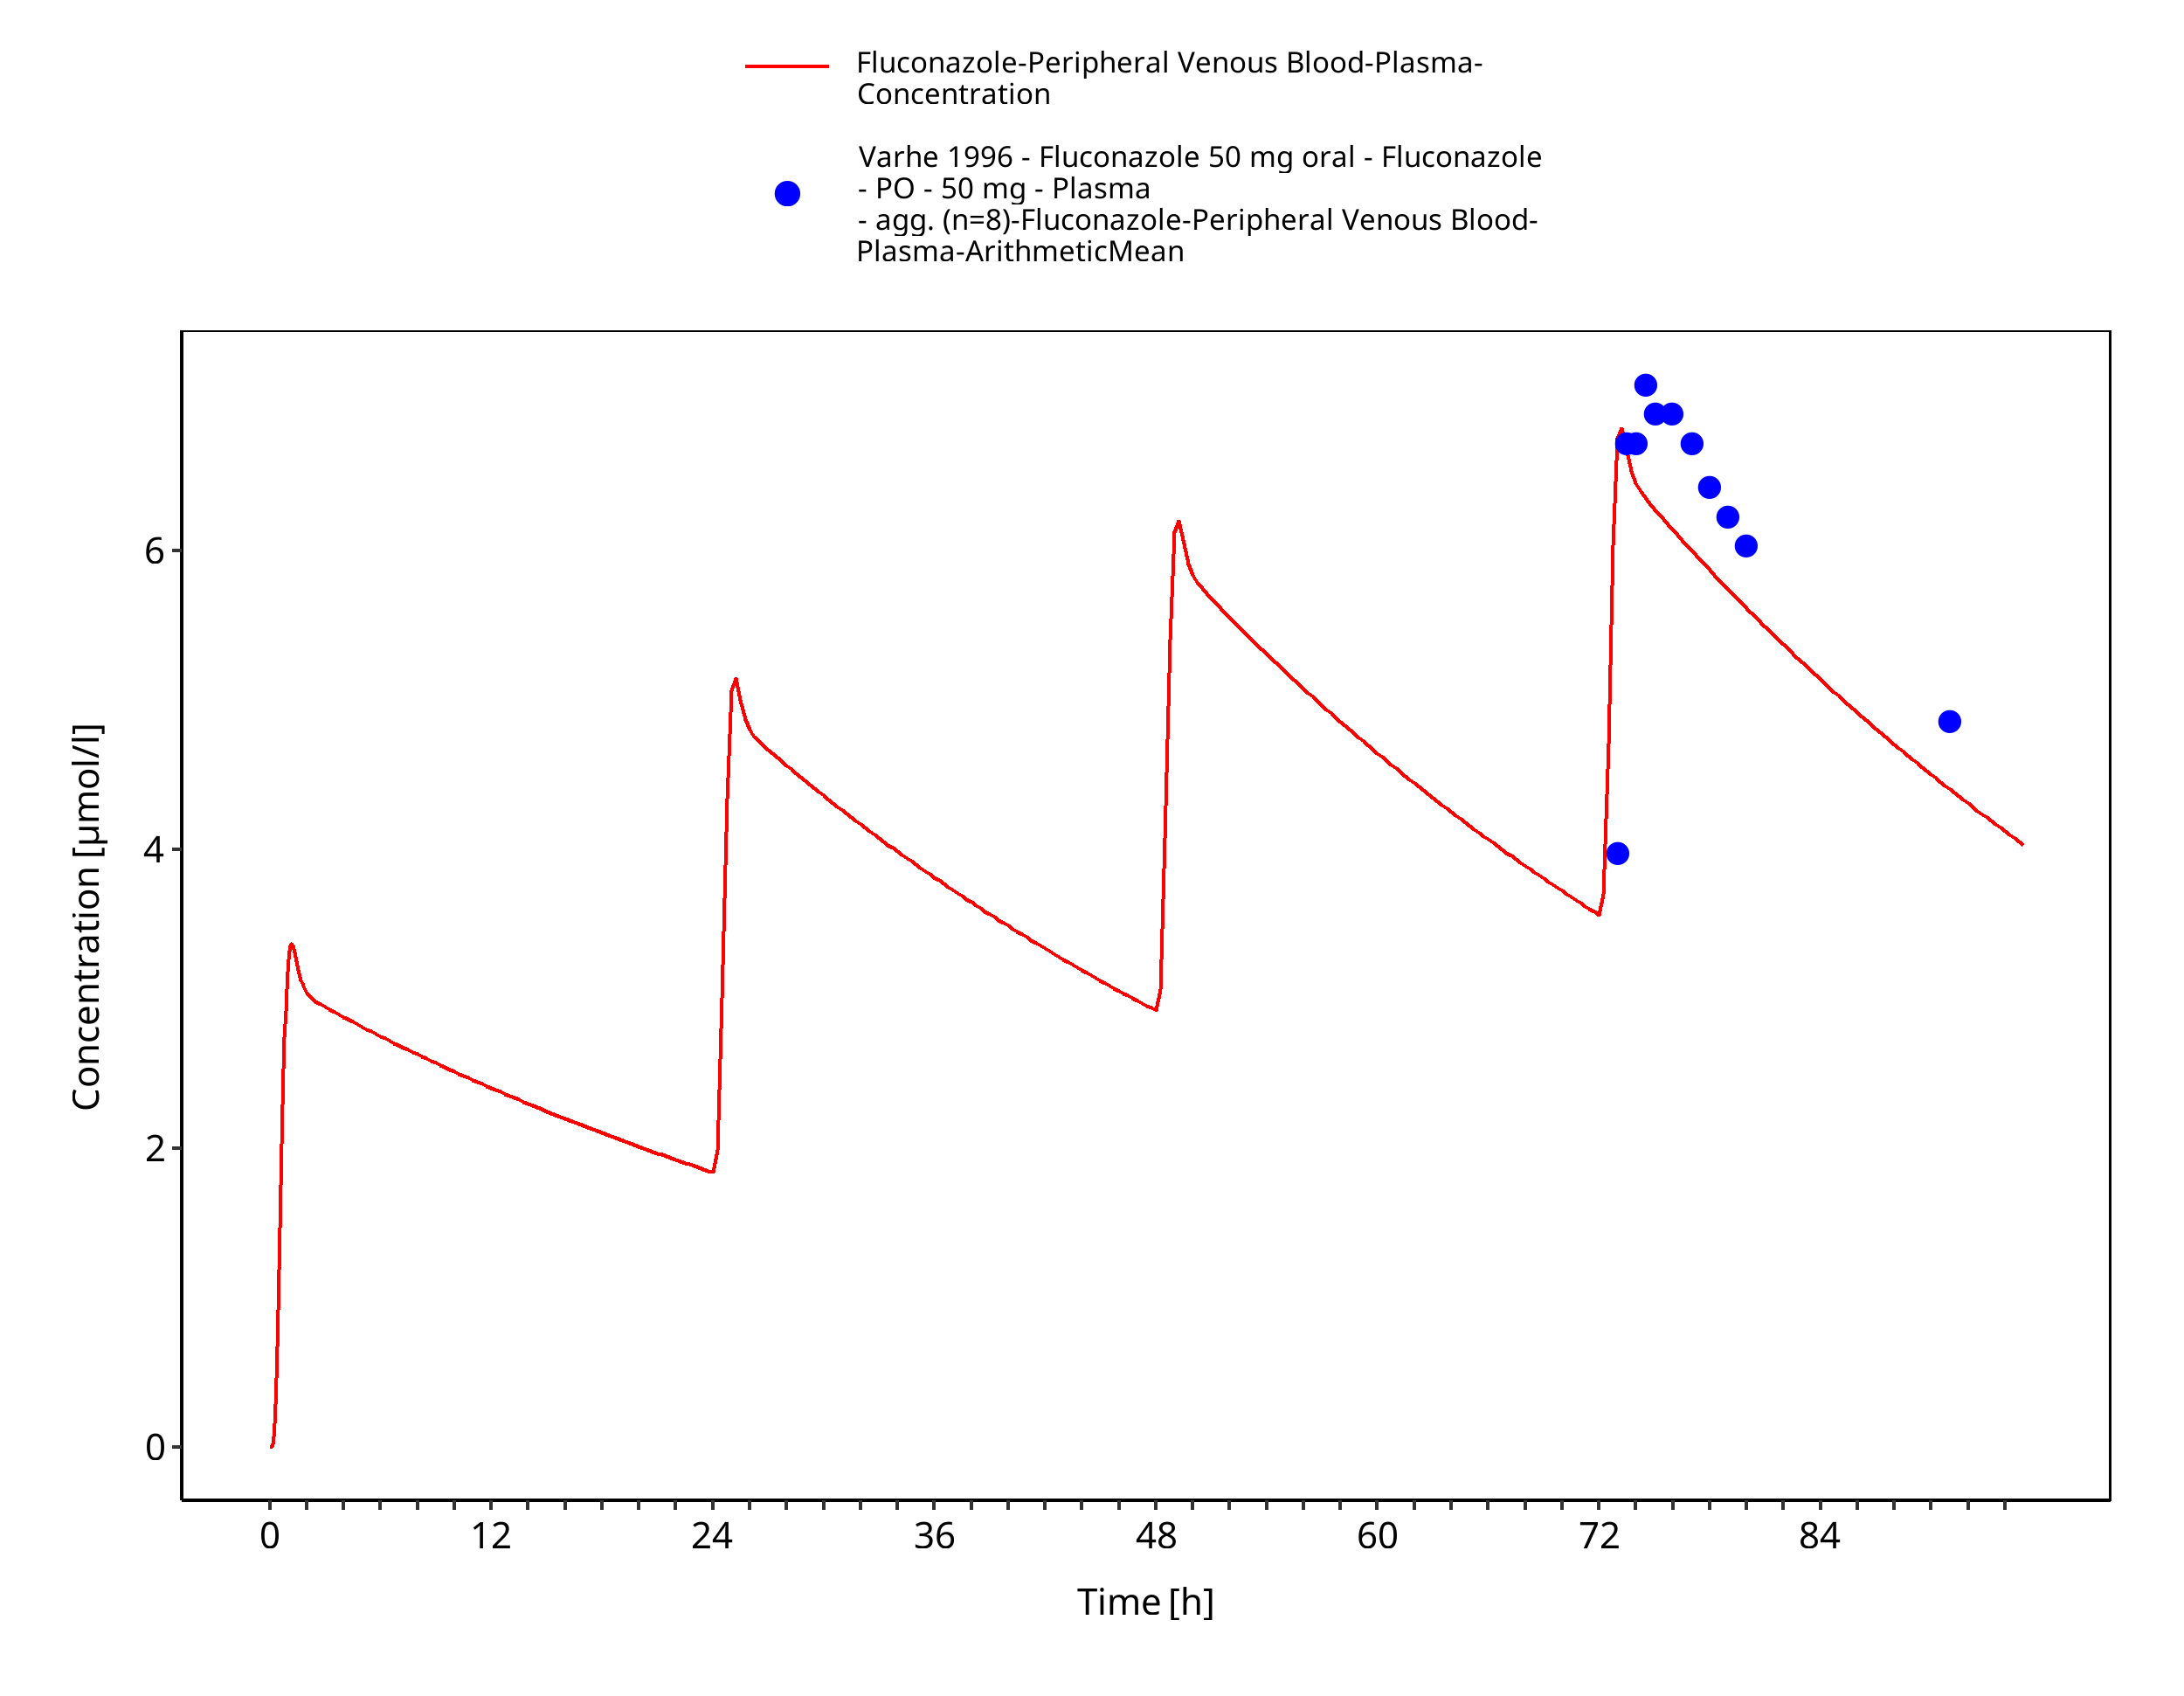
Figure 3-24: Time Profile Analysis
4 Conclusion
The presented PBPK model adequately describes the intravenous and oral pharmacokinetics of fluconazole in adults.
5 References
Ahonen 1997 Ahonen, Jouni, Klaus T. Olkkola, and Pertti J. Neuvonen. (1997). Effect of route of administration of fluconazole on the interaction between fluconazole and midazolam. European journal of clinical pharmacology 51.5, 415-419.
Brammer 1990 Brammer, K. W., P. R. Farrow, and J. K. Faulkner. (1990). Pharmacokinetics and tissue penetration of fluconazole in humans. Reviews of infectious diseases 12.Supplement_3, S318-S326.
Brammer 1991 Brammer, K. W., Coakley, A. J., Jezequel, S. G., & Tarbit, M. H. (1991). The disposition and metabolism of [14C] fluconazole in humans. Drug metabolism and disposition 19.4, 764-767.
Charoo 2014 Charoo, N., Cristofoletti, R., Graham, A., Lartey, P., Abrahamsson, B., Groot, D. W., ... & Dressman, J. (2014). Biowaiver monograph for immediate-release solid oral dosage forms: fluconazole. Journal of pharmaceutical sciences, 103(12), 3843-3858.
Cristofoletti 2016 Cristofoletti, R., Charoo, N. A., & Dressman, J. B. (2016). Exploratory investigation of the limiting steps of oral absorption of fluconazole and ketoconazole in children using an in silico pediatric absorption model. Journal of pharmaceutical sciences, 105(9), 2794-2803.
Debruyne 1993 Debruyne, D., & Ryckelynck, J. P. (1993). Clinical pharmacokinetics of fluconazole. Clinical pharmacokinetics, 24(1), 10-27.
Kuepfer 2016 Kuepfer L, Niederalt C, Wendl T, Schlender JF, Willmann S, Lippert J, Block M, Eissing T, Teutonico D. (2016). Applied Concepts in PBPK Modeling: How to Build a PBPK/PD Model. CPT Pharmacometrics Syst Pharmacol. Oct;5(10), 516-531.
Meyer 2012 Meyer M, Schneckener S, Ludewig B, Kuepfer L, Lippert J. (2012). Using expression data for quantification of active processes in physiologically based pharmacokinetic modeling. Drug Metab Dispos. May;40(5), 892-901.
Nishimura 2003 Nishimura M, Yaguti H, Yoshitsugu H, Naito S, Satoh T. (2003). Tissue distribution of mRNA expression of human cytochrome P450 isoforms assessed by high-sensitivity real-time reverse transcription PCR. Yakugaku Zasshi. May;123(5), 369-75.
Palkama 1998 Palkama, V. J., Isohanni, M. H., Neuvonen, P. J., & Olkkola, K. T. (1998). The effect of intravenous and oral fluconazole on the pharmacokinetics and pharmacodynamics of intravenous alfentanil. Anesthesia & Analgesia, 87(1), 190-194.
Ripa 1993 Ripa, S., Ferrante, L., & Prenna, M. (1993). Pharmacokinetics of fluconazole in normal volunteers. Chemotherapy, 39(1), 6-12.
Sakaeda 2005 Sakaeda, T., Iwaki, K., Kakumoto, M., Nishikawa, M., Niwa, T., Jin, J. (2005). Effect of micafungin on cytochrome P450 3A4 and multidrug resistance protein 1 activities, and its comparison with azole antifungal drugs. J Pharm Pharmacol, 57, 759-764.
Shiba 1990 Shiba, K., Saito, A., & Miyahara, T. (1990). Safety and pharmacokinetics of single oral and intravenous doses of fluconazole in healthy subjects. Clinical therapeutics, 12(3), 206-215.
Sobue 2004 Sobue, S., Tan, K., Layton, G., Eve, M., & Sanderson, J. B. (2004). Pharmacokinetics of fosfluconazole and fluconazole following multiple intravenous administration of fosfluconazole in healthy male volunteers. British journal of clinical pharmacology, 58(1), 20-25.
Thorpe 1990 Thorpe, J. E., Baker, N., & Bromet-Petit, M. (1990). Effect of oral antacid administration on the pharmacokinetics of oral fluconazole. Antimicrobial agents and chemotherapy, 34(10), 2032-2033.
Varhe 1996 Varhe, A., Olkkola, K. T., & Neuvonen, P. J. (1996). Effect of fluconazole dose on the extent of fluconazole‐triazolam interaction. British journal of clinical pharmacology, 42(4), 465-470.
Watt 2018 Watt, K. M., Cohen‐Wolkowiez, M., Barrett, J. S., Sevestre, M., Zhao, P., Brouwer, K. L., & Edginton, A. N. (2018). Physiologically based pharmacokinetic approach to determine dosing on extracorporeal life support: fluconazole in children on ECMO. CPT: pharmacometrics & systems pharmacology, 7(10), 629-637.
Willmann 2007 Willmann S, Höhn K, Edginton A, Sevestre M, Solodenko J, Weiss W, Lippert J, Schmitt W. (2007). Development of a physiology-based whole-body population model for assessing the influence of individual variability on the pharmacokinetics of drugs. J Pharmacokinet Pharmacodyn. 34(3), 401-431.
Yeates 1994 Yeates, R. A., Ruhnke, M., Pfaff, G., Hartmann, A., Trautmann, M., & Sarnow, E. (1994). The pharmacokinetics of fluconazole after a single intravenous dose in AIDS patients. British journal of clinical pharmacology, 38(1), 77-79.
Related Models
Explore other Cardiovascular Agents models in this library:
- Cimetidine - PBPK model and evaluation report
- Dapagliflozin - PBPK model and evaluation report
- Digoxin - PBPK model and evaluation report
- Felodipine - PBPK model and evaluation report
- Itraconazole - PBPK model and evaluation report