Building and evaluation of a PBPK model for Midazolam in healthy adults
| Version | 2.0-OSP12.3 |
|---|---|
| based on Model Snapshot and Evaluation Plan | https://github.com/Open-Systems-Pharmacology/Midazolam-Model/releases/tag/v2.0 |
| OSP Version | 12.3 |
| Qualification Framework Version | 3.7 |
This evaluation report and the corresponding PK-Sim project file are filed at:
https://github.com/Open-Systems-Pharmacology/OSP-PBPK-Model-Library/
Table of Contents
- 1 Introduction
- 2 Methods
- 2.1 Modeling Strategy
- 2.2 Data
- 2.3 Model Parameters and Assumptions
- 3 Results and Discussion
- 3.1 Final input parameters
- 3.2 Diagnostics Plots
- 3.3 Concentration-Time Profiles
- 4 Conclusion
- 5 References
1 Introduction
Midazolam is a widely-used sedative, approved as premedication before surgical interventions. It is almost exclusively metabolized by CYP3A4 making it a sensitive probe and victim drug for the investigation of CYP3A4 activity in vivo. Midazolam shows substantial first pass metabolism resulting in a bioavailability of under 50%. Less than 1% of a midazolam dose is excreted unchanged in urine.
The herein presented model represents an update of the midazolam model published by Hanke et al. (Hanke 2018). The model has been developed using in particular published pharmacokinetic clinical data by Hohmann et al. (Hohmann 2015), Hyland et al. 2009 (Hyland 2009) and Thummel et al. 1996 (Thummel 1996). It has then been evaluated by comparing observed data to simulations of a large number of clinical studies covering a dose range of 0.05 mg/kg to 20 mg after intravenous and oral administrations. Furthermore, it has been evaluated within a CYP3A4 DDI modeling network as a victim drug.
Model features include:
- metabolism by CYP3A4
- (direct) metabolism by UGT1A4
- excretion into urine via glomerular filtration
- a decrease in the permeability between the intracellular and interstitial space (model parameters
P (intracellular->interstitial)andP (interstitial->intracellular)) in intestinal mucosa to optimize quantitatively the extent of gut wall metabolism - and binding to a hypothetical binding partner in the brain to optimize a late redistribution phase in midazolam plasma concentrations.
2 Methods
2.1 Modeling Strategy
The general concept of building a PBPK model has previously been described by Kuepfer et al. (Kuepfer 2016). Relevant information on anthropometric (height, weight) and physiological parameters (e.g. blood flows, organ volumes, binding protein concentrations, hematocrit, cardiac output) in adults was gathered from the literature and has been previously published (Willmann 2007). The information was incorporated into PK-Sim® and was used as default values for the simulations in adults.
The applied activity and variability of plasma proteins and active processes that are integrated into PK-Sim® are described in the publicly available PK-Sim® Ontogeny Database Version 7.3 (PK-Sim Ontogeny Database Version 7.3) or otherwise referenced for the specific process.
First, a mean model was built using clinical data from single dose studies with intravenous and oral administration of midazolam by Hohmann et al. (Hohmann 2015) (reporting plasma concentrations), Hyland et al. 2009 (Hyland 2009) (reporting the dose fraction metabolized via UGT1A4), and Thummel et al. 1996 (Thummel 1996) (reporting the dose fraction excreted into urine of unchanged drug). The mean PBPK model was developed using a typical European individual. The relative tissue-specific expressions of enzymes predominantly being involved in the metabolism of midazolam (CYP3A4 and UGT1A4) were considered (Meyer 2012).
A specific set of parameters (see below) was optimized using the Parameter Identification module provided in PK-Sim®. Structural model selection was mainly guided by visual inspection of the resulting description of data and biological plausibility.
Once the appropriate structural model was identified, additional parameters for tablet formulations were identified.
The model was then verified by simulating further clinical studies reporting pharmacokinetic concentration-time profiles of midazolam.
Details about input data (physicochemical, in vitro and clinical) can be found in Section 2.2.
Details about the structural model and its parameters can be found in Section 2.3.
2.2 Data
2.2.1 In vitro and physicochemical data
A literature search was performed to collect available information on physicochemical properties of midazolam. The obtained information from literature is summarized in the table below, and is used for model building.
| Parameter | Unit | Value | Source | Description |
|---|---|---|---|---|
| MW | g/mol | 325.78 | DrugBank DB00683 | Molecular weight |
| pKa1 | 10.95 | Wang 2019 | acid dissociation constant of conjugate acid; compound type: ampholyte | |
| pKa2 | 6.2 | Wang 2019 | acid dissociation constant of conjugate acid; compound type: ampholyte | |
| Solubility (pH) | mg/mL | 0.13 (5) |
Heikkinen 2012 | Aqueous Solubility |
| 0.049 (6.5) |
Heikkinen 2012 | FaSSIF (fasted state simulated intestinal fluid) solubility | ||
| 0.09 (5) |
Heikkinen 2012 | FeSSIF (fed state simulated intestinal fluid) solubility | ||
| logP | 3.53 | Wang 2019 | Partition coefficient between octanol and water | |
| 3.0 | Dagenais 2009 | Partition coefficient between octanol and water | ||
| 3.37 | Bolger 2006 | Partition coefficient between octanol and water | ||
| 3.1 | Rodgers 2006 | Partition coefficient between octanol and water | ||
| fu | % | 3.1 | Gertz 2010 | Fraction unbound in plasma |
| % | 3.2 | Wang 2019 | Fraction unbound in plasma | |
| % | 2.2 | Lown 1995 | Fraction unbound in plasma | |
| % | 3.1 | Björkman 2001 | Fraction unbound in plasma in men | |
| % | 3.1 | Björkman 2001 | Fraction unbound in plasma in women | |
| Vmax, Km CYP3A4 | pmol/min/pmol, µmol/L |
1.96 2.69 |
Galentin 2004 | CYP3A4 supersomes Michaelis-Menten kinetics (alpha-hydroxylation) |
| Vmax, Km CYP3A4 | pmol/min/mg, µmol/L |
850 4 |
Bolger 2006 | CYP3A liver microsomes Michaelis-Menten kinetics |
| Vmax, Km CYP3A4 | nmol/min/mg, µmol/L |
4.41 3.8 |
Ito 2003 | CYP3A liver microsomes Michaelis-Menten kinetics (alpha-hydroxylation) |
| Vmax, Km CYP3A4 | nmol/min/mg, µmol/L |
0.18 3.9 |
Patki 2003 | CYP3A liver microsomes Michaelis-Menten kinetics (alpha-hydroxylation) |
| Vmax, Km CYP3A4 | pmol/min/pmol, µmol/L |
5.23 2.16 |
Wang 2019 | CYP3A4 supersomes Michaelis-Menten kinetics (alpha-hydroxylation) |
| Vmax, Km UGT1A4 | pmol/min/mg, µmol/L |
276 37.8 |
Klieber 2008 | UGT1A4 liver microsomes Michaelis-Menten kinetics |
| KD GABRG2 | nmol/L | 1.8 | Buhr 1997 | Binding affinity to GABRG2 (Gamma-Aminobutyric Acid Type A Receptor Subunit Gamma2) |
2.2.2 Clinical data
A literature search was performed to collect available clinical data on midazolam in adults.
The following publications were found in adults for model building:
| Publication | Arm / Treatment / Information used for model building |
|---|---|
| Hohmann 2015 | Plasma PK profiles in healthy subjects after single dose administrations of midazolam solutions: - intravenous 0.001 mg - intravenous 1 mg - oral 0.003 mg - oral 3 mg |
| Hyland 2009 | Quantification of direct UGT1A4-formed midazolam-N-glucuronide (in urine) after administration of a 3 mg oral and 1 mg intravenous dose of midazolam. See table below for summary of data. |
| Thummel 1996 | Quantification of unchanged midazolam in urine after administration of a 2 mg oral and 1 mg intravenous dose of midazolam. See table below for summary of data. |
| Ahonen 1995 | Plasma PK profiles in healthy subjects with single dose administrations of a midazolam 7.5 mg tablet (in the absence of itraconazole) |
| Olkkola 1994 | Plasma PK profiles in healthy subjects with single dose administrations of a midazolam 7.5 mg tablet (in the absence of itraconazole) |
| Olkkola 1996 | Plasma PK profiles in healthy subjects with single dose administrations of a midazolam 7.5 mg tablet (in the absence of itraconazole) |
| Saari 2006 | Plasma PK profiles in healthy subjects with single dose administrations of a midazolam 7.5 mg tablet (in the absence of voriconazole) |
| Link 2008 | Plasma PK profiles in healthy subjects with single dose administrations of a midazolam 7.5 mg tablet (in the absence of rifampicin) |
The following table shows the data from the excretion studies (Thummel 1996, Hyland 2009) used for model building:
| Observer | Value |
|---|---|
| Fraction excreted to urine of unchanged midazolam after iv administration (female) | 0.27% |
| Fraction excreted to urine of unchanged midazolam after iv administration (male) | 0.28% |
| Fraction excreted to urine of unchanged midazolam after po administration (female) | 0.31% |
| Fraction excreted to urine of unchanged midazolam after po administration (male) | 0.47% |
| Fraction metabolized UGT1A4 (to midazolam-N-glucuronide) after iv administration | 2.16% |
| Fraction metabolized UGT1A4 (to midazolam-N-glucuronide) after po administration | 1.29% |
The following dosing scenarios were simulated and compared to respective data for model verification:
| Scenario | Data reference |
|---|---|
| iv 0.05 mg/kg (2 min) | Olkkola 1993 |
| iv 0.05 mg/kg (30 min) | Gorski 1998 |
| Gorski 2003 | |
| Quinney 2008 | |
| iv 0.05 mg/kg (bolus) | Szalat 2007 |
| iv 0.075 mg/kg (1 min) | Allonen 1981 |
| Swart 2002 | |
| iv 0.15 mg/kg (bolus) | Heizmann 1983 |
| iv 1 mg (bolus) | Kharasch 1997 |
| Kharasch 2004 | |
| Kharasch 2011 | |
| Phimmasone 2001 | |
| Shin 2013 | |
| Shin 2016 | |
| iv 1 mg (2 min) Corean CYP3A5*3/*3 only, CYP3A4 reference concentration adjusted |
Yu 2004 |
| iv 2 mg (bolus) | Darwish 2008 |
| iv 5 mg (30 sec) | Schwagmeier 1998 |
| iv 5 mg (bolus) | Smith 1981 |
| po 0.01 mg (solution) | Prueksaritanont 2017 |
| po 0.075 mg (solution) | Eap 2004 |
| po 0.075 mg/kg (syrup) | Chung 2006 |
| po 1 mg (solution) | van Dyk 2018 |
| Wiesinger 2020 | |
| Chattopadhyay 2018 | |
| po 10 mg (solution) | Lam 2003 |
| Smith 1981 | |
| po 10 mg (tablet) | Heizmann 1983 |
| Smith 1981 | |
| po 15 mg (tablet) | Allonen 1981 |
| Backman 1994 | |
| Backman 1996 | |
| Backman 1998 | |
| Bornemann 1986 | |
| Olkkola 1993 | |
| Yeates 1996 | |
| Zimmermann 1996 | |
| po 15 mg (tablet) - with 1h after high-fat breakfast | Bornemann 1986 |
| po 2 mg (solution) | Templeton 2010 |
| Lutz 2018 | |
| po 20 mg (tablet) | Heizmann 1983 |
| po 3 mg (solution) | Katzenmaier 2010 |
| Kharasch 2004 | |
| Kharasch 2011 | |
| Markert 2013 | |
| po 3.5 mg (solution) | Quinney 2008 |
| po 4 mg (solution) | Gorski 1998 |
| Gorski 2003 | |
| po 40 mg (tablet) | Heizmann 1983 |
| po 5 mg (solution) | Darwish 2008 |
| Okudaira 2007 | |
| Tham 2006 | |
| po 6 mg (solution) | Greenblat 2003 |
| po 7.5 mg (solution) | Eap 2004 |
| po 8 mg (solution) | Gurley 2006 |
| Gurley 2008a | |
| Mikus 2017 (4 mg po solution, followed by 2 mg iv administration 6 hours later) |
Mikus 2017 |
2.3 Model Parameters and Assumptions
2.3.1 Absorption
The model parameter Specific intestinal permeability was optimized to best match clinical data (see Section 2.3.4). The default solubility was assumed to be the measured value in FaSSIF (fasted state simulated intestinal fluid, see Section 2.2.1)
The dissolution of tablets were implemented via an empirical Weibull dissolution tablet. However, dissolution does not seem to be relevant in terms of rate-limiting kinetics; see results of optimization in Section 2.3.4.
2.3.2 Distribution
Midazolam is moderately to highly protein bound (approx. 97 %) in plasma (see Section 2.2.1). A value of 3.1% was used in this PBPK model for Fraction unbound (plasma, reference value). It was assumed that the major binding partner is albumin.
An important parameter influencing the resulting volume of distribution is lipophilicity. The reported experimental logP values are in the range of 3 (see Section 2.2.1) which served as a starting value. Finally, the model parameters Lipophilicity was optimized to match best clinical data (see also Section 2.3.4).
After testing the available organ-plasma partition coefficient and cell permeability calculation methods built in PK-Sim, observed clinical data was best described by choosing the partition coefficient calculation by Rodgers and Rowland and cellular permeability calculation by PK-Sim Standard.
Initial model building showed that the late disposition (approx. 24 hours after administration) could not be well described. This effect was assumed to be (re-)distribution-related. Finally, binding to a hypothetical binding partner in the brain was assumed (motivated by the target of midazolam: GABA receptor). After implementation of in vitro binding affinity to GABRG2 (Gamma-Aminobutyric Acid Type A Receptor Subunit Gamma 2) (see Section 2.2.1), the Reference concentration of GABRG2 was optimized to match best clinical data (see also Section 2.3.4). Note that the respective koff value was assumed to be 1 min-1.
2.3.3 Metabolism and Elimination
Two metabolic pathways were implement into the model via Michaelis-Menten kinetics
- CYP3A4
- UGT1A4
The CYP3A4 expression profiles is based on high-sensitive real-time RT-PCR (Nishimura 2013). UGT1A4 was assumed to be exclusively expressed in the liver. Absolute tissue-specific expressions were obtained by considering the respective absolute concentration in the liver. The PK-Sim database provides a default value for CYP3A4 (compare Rodrigues 1999 and assume 40 mg protein per gram liver). A reference concentration of 2.32 µmol/L in the liver for UGT1A4 was derived from a quantification reported by Achour et al. (Achour 2014) with 58.0 pmol/mg in Human Liver Microsomes (assuming 40 mg protein per gram liver).
Additionally, a renal clearance (assumed to be mainly driven by glomerular filtration) was implemented.
The first model simulations showed that gut wall metabolism was underrepresented in the PBPK model. In order to increase gut wall metabolism, the “mucosa permeability on basolateral side” (jointly the model parameters in the mucosa: P (interstitial->intracellular) and P (intracellular->interstitial)) was estimated. A decrease in this permeability may lead to higher gut wall concentrations and, in turn, to a higher gut wall elimination. This parameter was preferred over other parameters such as relative CYP3A4 expression or fraction unbound (fu) in the gut wall as it is technically not limited to a maximum value of 100%.
2.3.4 Automated Parameter Identification
This is the result of the final parameter identification for the base model:
| Model Parameter | Optimized Value | Unit |
|---|---|---|
Lipophilicity |
2.897 | Log Units |
Specific intestinal permeability |
1.555E-4 | cm/min |
| Basolateral mucosa permeability ( P (interstitial->intracellular), P (intracellular->interstitial)) |
1.924E-3 | cm/min |
Km (CYP3A4) |
4 FIXED (see Section 2.2.1) | µmol/L |
kcat (CYP3A4) |
8.761 | 1/min |
Km (UGT1A4) |
37.8 FIXED (see Section 2.2.1) | µmol/L |
kcat (UGT1A4) |
3.591 | 1/min |
GFR fraction |
0.6401 | |
Reference concentration (GABRG2) |
1.088* | µmol/L |
* The value in the model was updated to 1.041 with the release of PK-Sim 10 to account for the updated calculation method of interstitial concentrations (please refer to the respective release notes of version 10).
This is the result of the final parameter identification for the dissolution parameters of a midazolam tablet:
| Model Parameter | Optimized Value | Unit |
|---|---|---|
Dissolution time (50% dissolved) |
0.0107 | min |
Dissolution shape |
4.3803 |
3 Results and Discussion
The PBPK model for midazolam was developed and verified with clinical pharmacokinetic data.
The model was built and evaluated covering data from studies including in particular
- intravenous (bolus and infusions) and oral administrations (solution and tablets).
- a dose range of 0.001 to 40 mg.
The model quantifies metabolism via CYP3A4 and UGT1A4.
The next sections show:
- the final model input parameters for the building blocks: Section 3.1.
- the overall goodness of fit: Section 3.2.
- simulated vs. observed concentration-time profiles for the clinical studies used for model building and for model verification: Section 3.3.
3.1 Final input parameters
The compound parameter values of the final PBPK model are illustrated below.
Compound: Midazolam
Parameters
| Name | Value | Value Origin | Alternative | Default |
|---|---|---|---|---|
| Solubility at reference pH | 0.13 mg/ml | Publication-In Vitro-Heikkinen 2012 | Aqueous solubility | False |
| Reference pH | 5 | Publication-In Vitro-Heikkinen 2012 | Aqueous solubility | False |
| Solubility at reference pH | 0.049 mg/ml | Publication-In Vitro-Heikkinen 2012 | FaSSIF | True |
| Reference pH | 6.5 | Publication-In Vitro-Heikkinen 2012 | FaSSIF | True |
| Solubility at reference pH | 0.09 mg/ml | Publication-In Vitro-Heikkinen 2012 | FeSSIF | False |
| Reference pH | 5 | Publication-In Vitro-Heikkinen 2012 | FeSSIF | False |
| Lipophilicity | 2.8972038771 Log Units | Parameter Identification-Parameter Identification-Value updated from 'PI Hohmann iv+po, Hyland feUr MDZG, Thummel feUr unchanged - Pint' on 2019-04-09 16:10 | Optimized | True |
| Fraction unbound (plasma, reference value) | 0.031 | Parameter Identification-Parameter Identification-Value updated from 'PI Hohmann iv+po, Hyland feUr MDZG, Thummel feUr unchanged - Pint' on 2019-04-09 16:10 | Gertz et al. 2010 | True |
| Specific intestinal permeability (transcellular) | 0.00015549970673 cm/min | Parameter Identification-Parameter Identification-Value updated from 'PI Hohmann iv+po, Hyland feUr MDZG, Thummel feUr unchanged - Pint' on 2019-04-09 16:10 | Optimized | True |
| Cl | 1 | |||
| F | 1 | |||
| Is small molecule | Yes | |||
| Molecular weight | 325.78 g/mol | |||
| Plasma protein binding partner | Albumin |
Calculation methods
| Name | Value |
|---|---|
| Partition coefficients | Rodgers and Rowland |
| Cellular permeabilities | PK-Sim Standard |
Processes
Specific Binding: GABRG2-Buhr 1997
Molecule: GABRG2
Parameters
| Name | Value | Value Origin |
|---|---|---|
| koff | 1 1/min | Parameter Identification-Parameter Identification-Value updated from 'PI Hohmann iv+po, Hyland feUr MDZG, Thummel feUr unchanged - Pint' on 2019-04-09 16:10 |
| Kd | 1.8 nmol/l |
Systemic Process: Glomerular Filtration-Optimized
Species: Human
Parameters
| Name | Value | Value Origin |
|---|---|---|
| GFR fraction | 0.6401025724 | Parameter Identification-Parameter Identification-Value updated from 'PI Hohmann iv+po, Hyland feUr MDZG, Thummel feUr unchanged - Pint' on 2019-04-09 16:10 |
Metabolizing Enzyme: CYP3A4-Optimized
Molecule: CYP3A4
Parameters
| Name | Value | Value Origin |
|---|---|---|
| In vitro Vmax for liver microsomes | 850 pmol/min/mg mic. protein | |
| Km | 4 µmol/l | Other-In Vitro-aggregated from literature |
| kcat | 8.7607941215 1/min | Parameter Identification-Parameter Identification-Value updated from 'PI Hohmann iv+po, Hyland feUr MDZG, Thummel feUr unchanged - Pint' on 2019-04-09 16:10 |
Metabolizing Enzyme: UGT1A4-Optimized
Molecule: UGT1A4
Parameters
| Name | Value | Value Origin |
|---|---|---|
| In vitro Vmax for liver microsomes | 276 pmol/min/mg mic. protein | Publication-Klieber 2008 |
| Content of CYP proteins in liver microsomes | 58 pmol/mg mic. protein | Publication-Achour 2014 |
| Km | 37.8 µmol/l | Publication-Klieber 2008 |
| kcat | 3.5911771641 1/min | Parameter Identification-Parameter Identification-Value updated from 'PI Hohmann iv+po, Hyland feUr MDZG, Thummel feUr unchanged - Pint' on 2019-04-09 16:10 |
Formulation: Tablet (Dormicum)
Type: Weibull
Parameters
| Name | Value | Value Origin |
|---|---|---|
| Dissolution time (50% dissolved) | 0.0107481462 min | Parameter Identification-Parameter Identification-Value updated from 'PI Tablet 7.5 mg' on 2019-04-09 16:30 |
| Lag time | 0 min | |
| Dissolution shape | 4.3802943225 | Parameter Identification-Parameter Identification-Value updated from 'PI Tablet 7.5 mg' on 2019-04-09 16:30 |
| Use as suspension | Yes |
3.2 Diagnostics Plots
Below you find the goodness-of-fit visual diagnostic plots for the PBPK model performance of all data used presented in Section 2.2.2.
The first plot shows observed versus simulated plasma concentration, the second weighted residuals versus time.
Table 3-1: GMFE for Midazolam concentration in plasma/blood
| Group | GMFE |
|---|---|
| Intravenous administration (model building) | 1.22 |
| Intravenous administration (model verification) | 1.41 |
| Mixed applications | 1.27 |
| Oral administration, solution (model building) | 1.23 |
| Oral administration, solution (model verification) | 1.40 |
| Oral administration, tablet (model building) | 1.27 |
| Oral administration, tablet (model verification) | 1.68 |
| All | 1.45 |
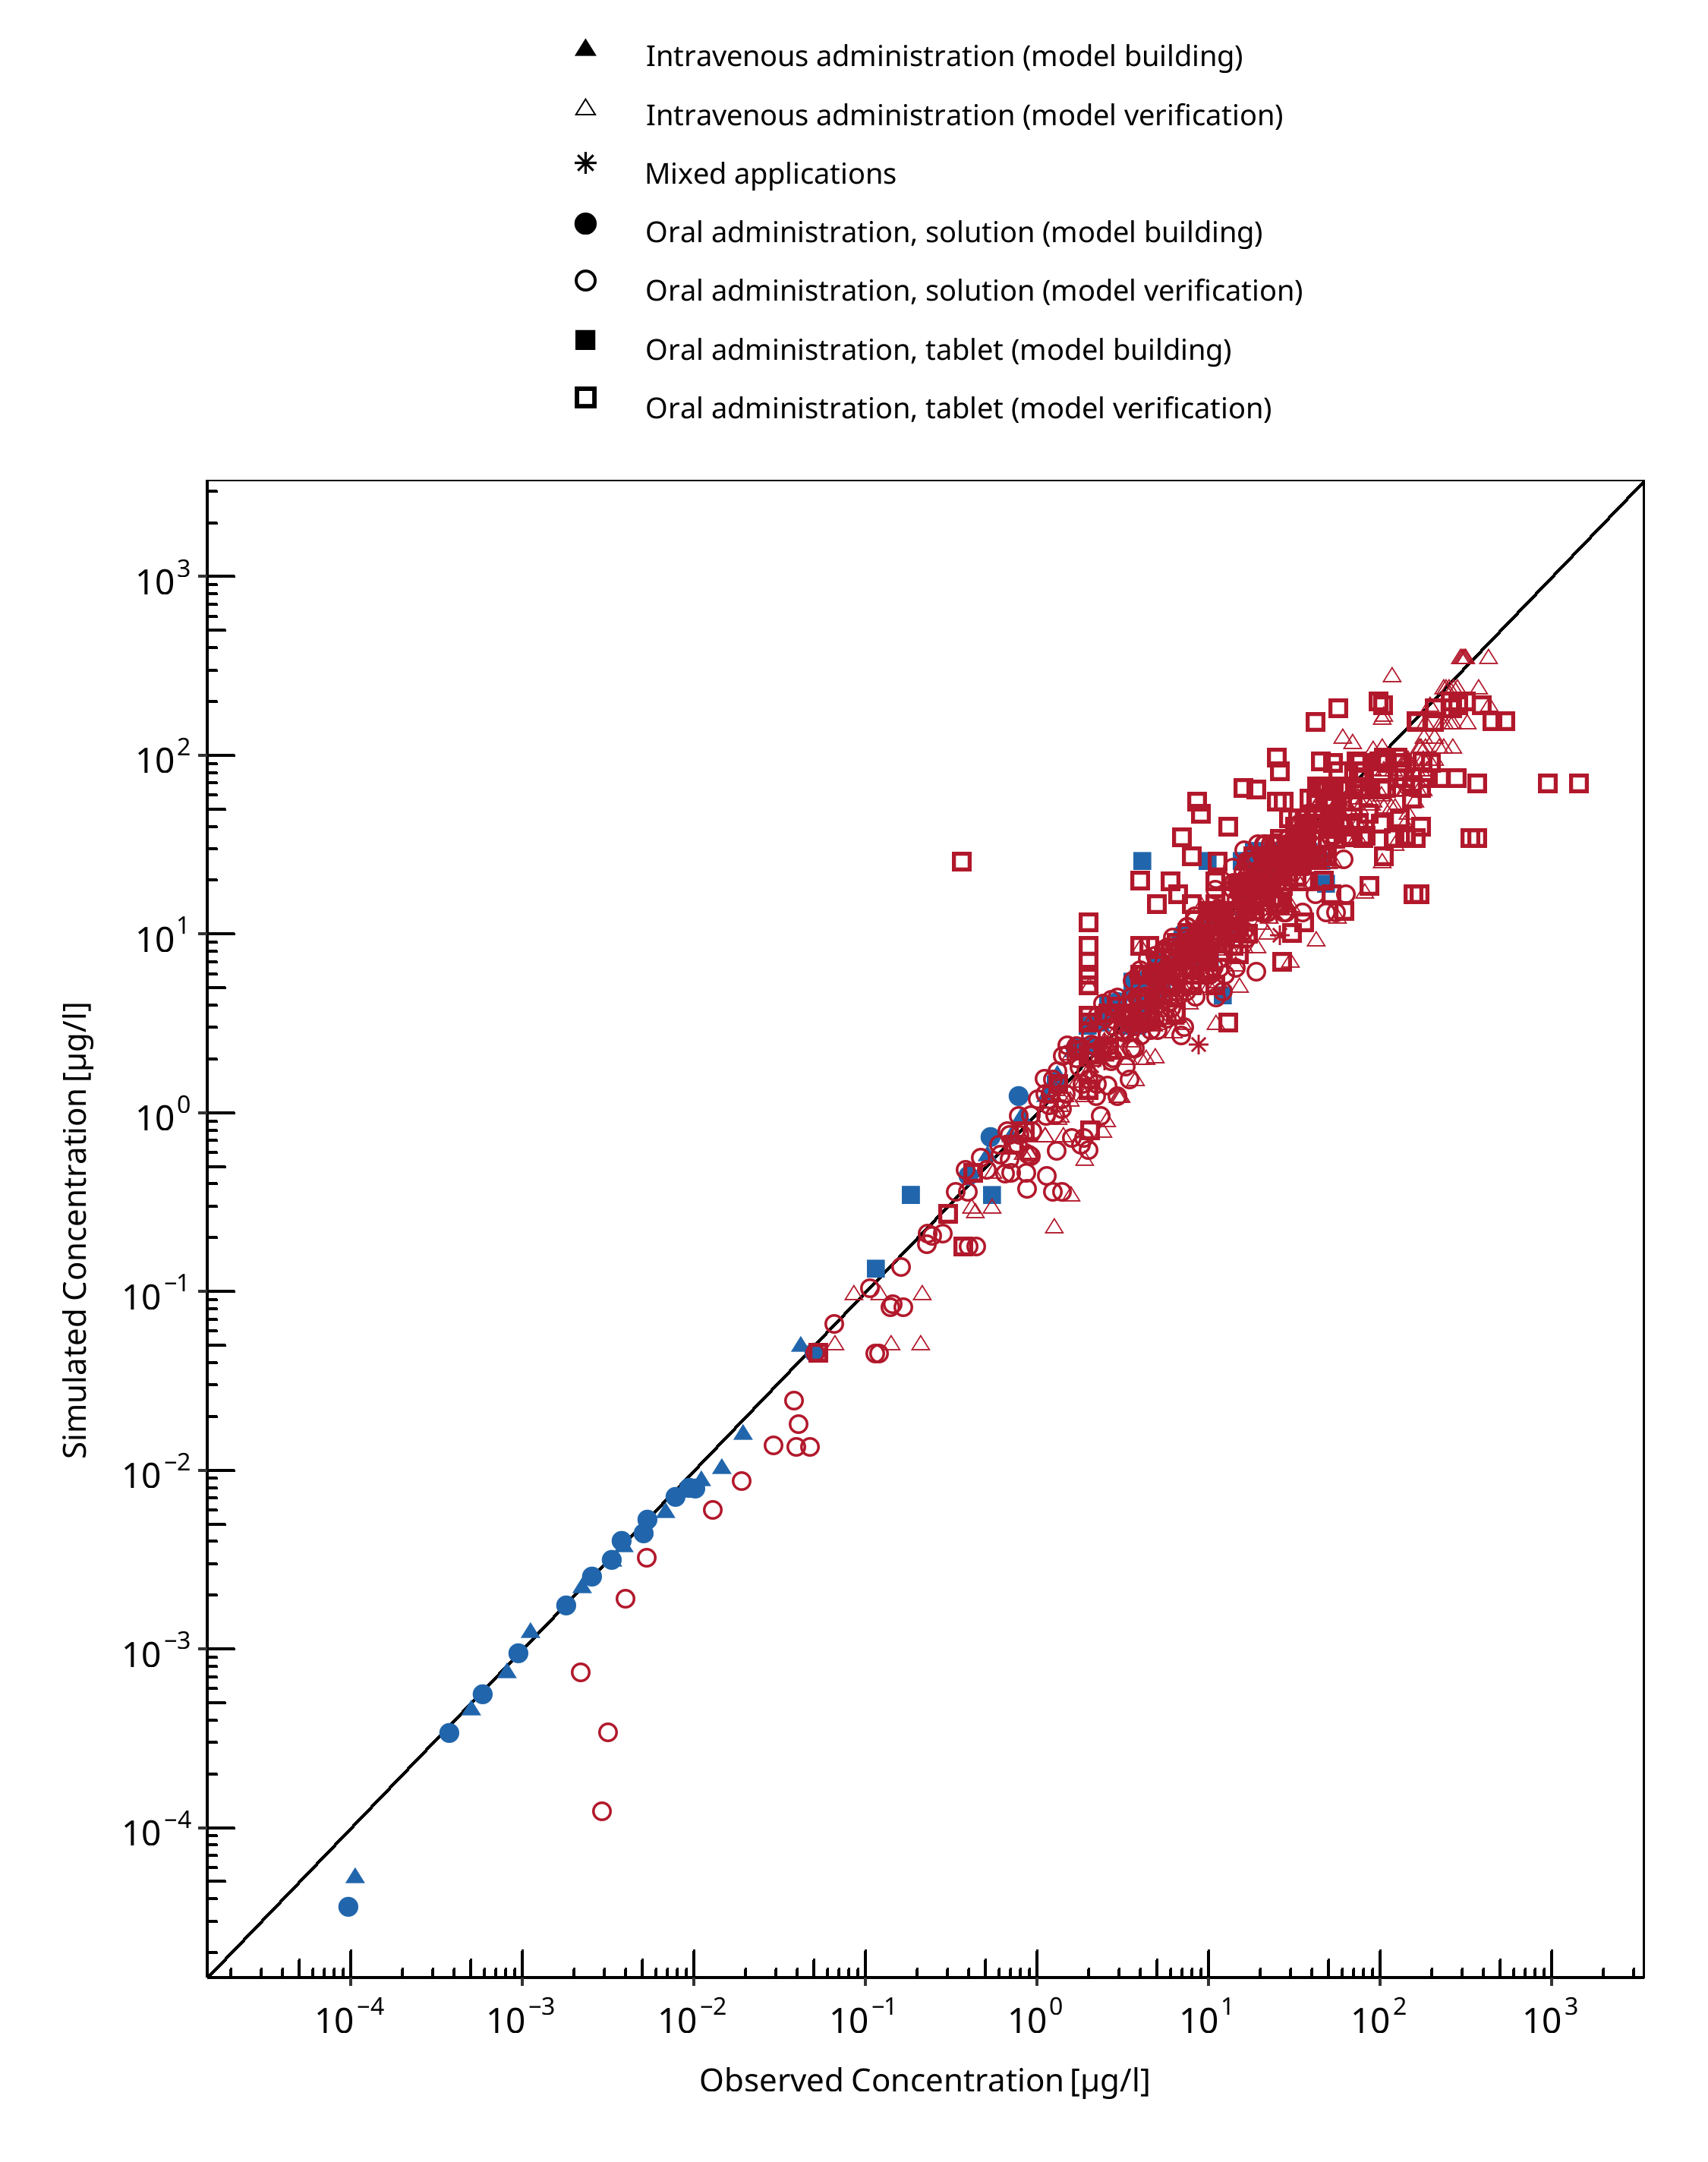
Figure 3-1: Midazolam concentration in plasma/blood
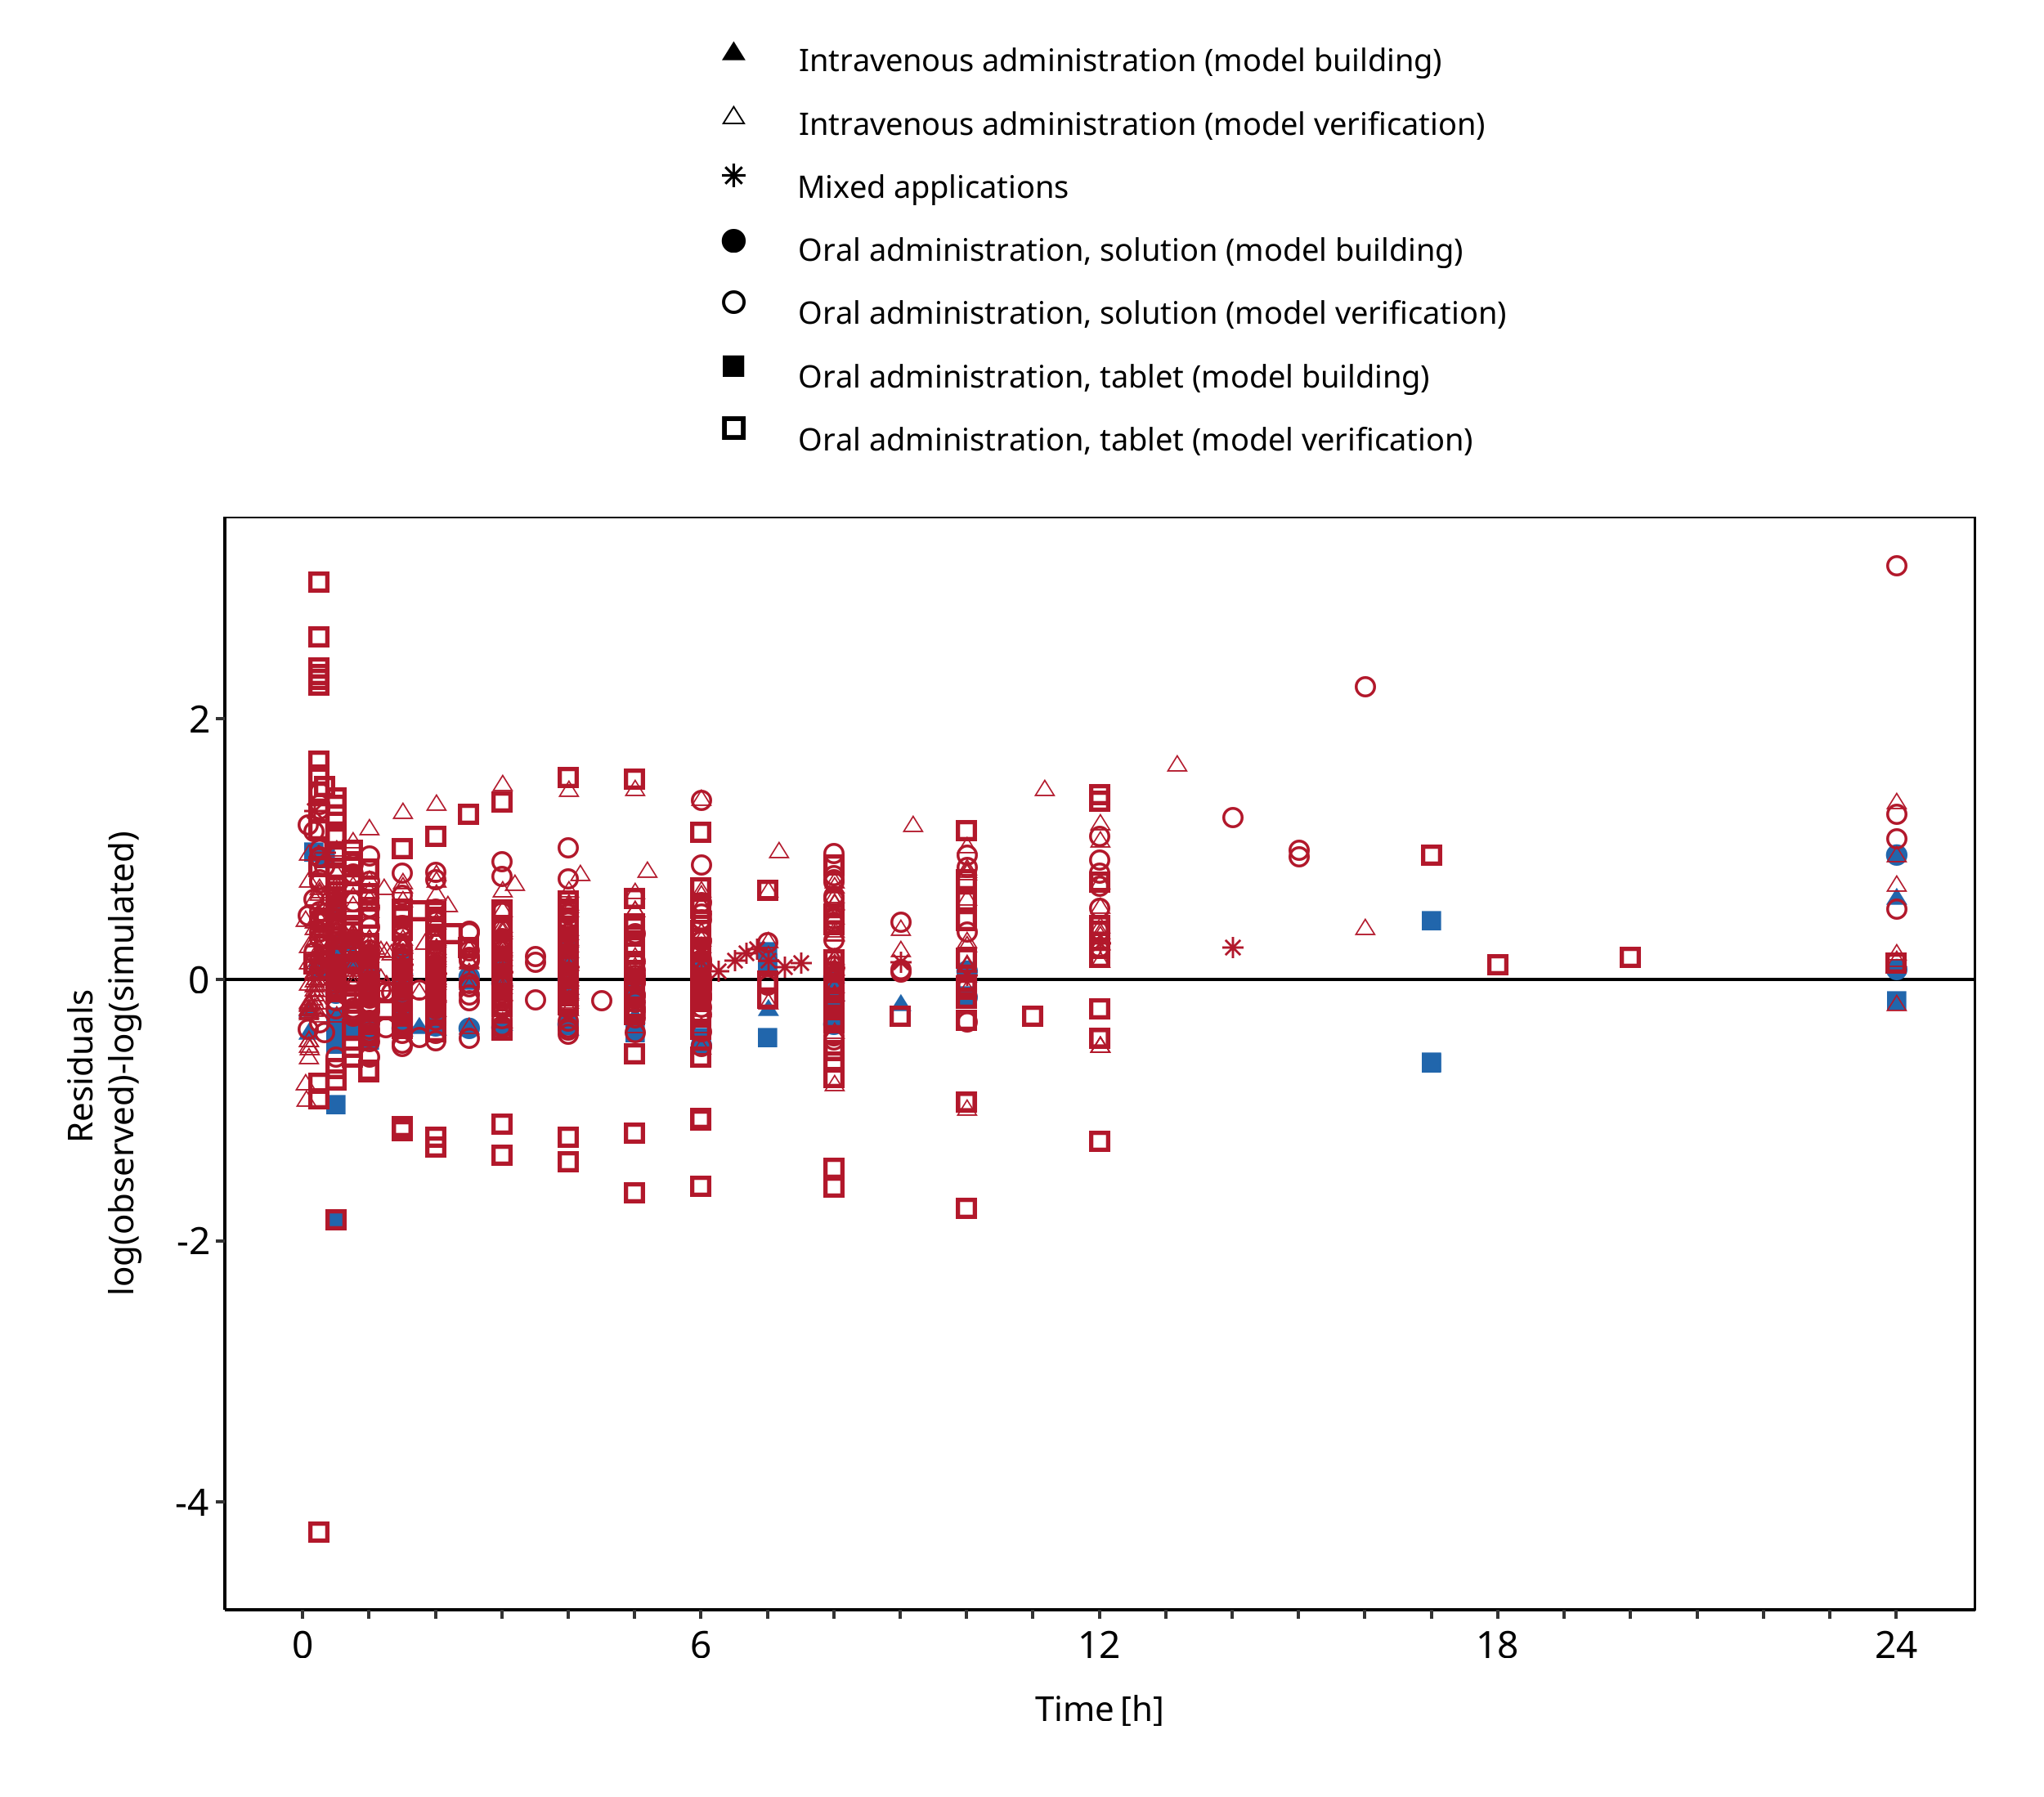
Figure 3-2: Midazolam concentration in plasma/blood
3.3 Concentration-Time Profiles
Simulated versus observed concentration-time profiles of all data listed in Section 2.2.2 are presented below.
3.3.1 Model Building
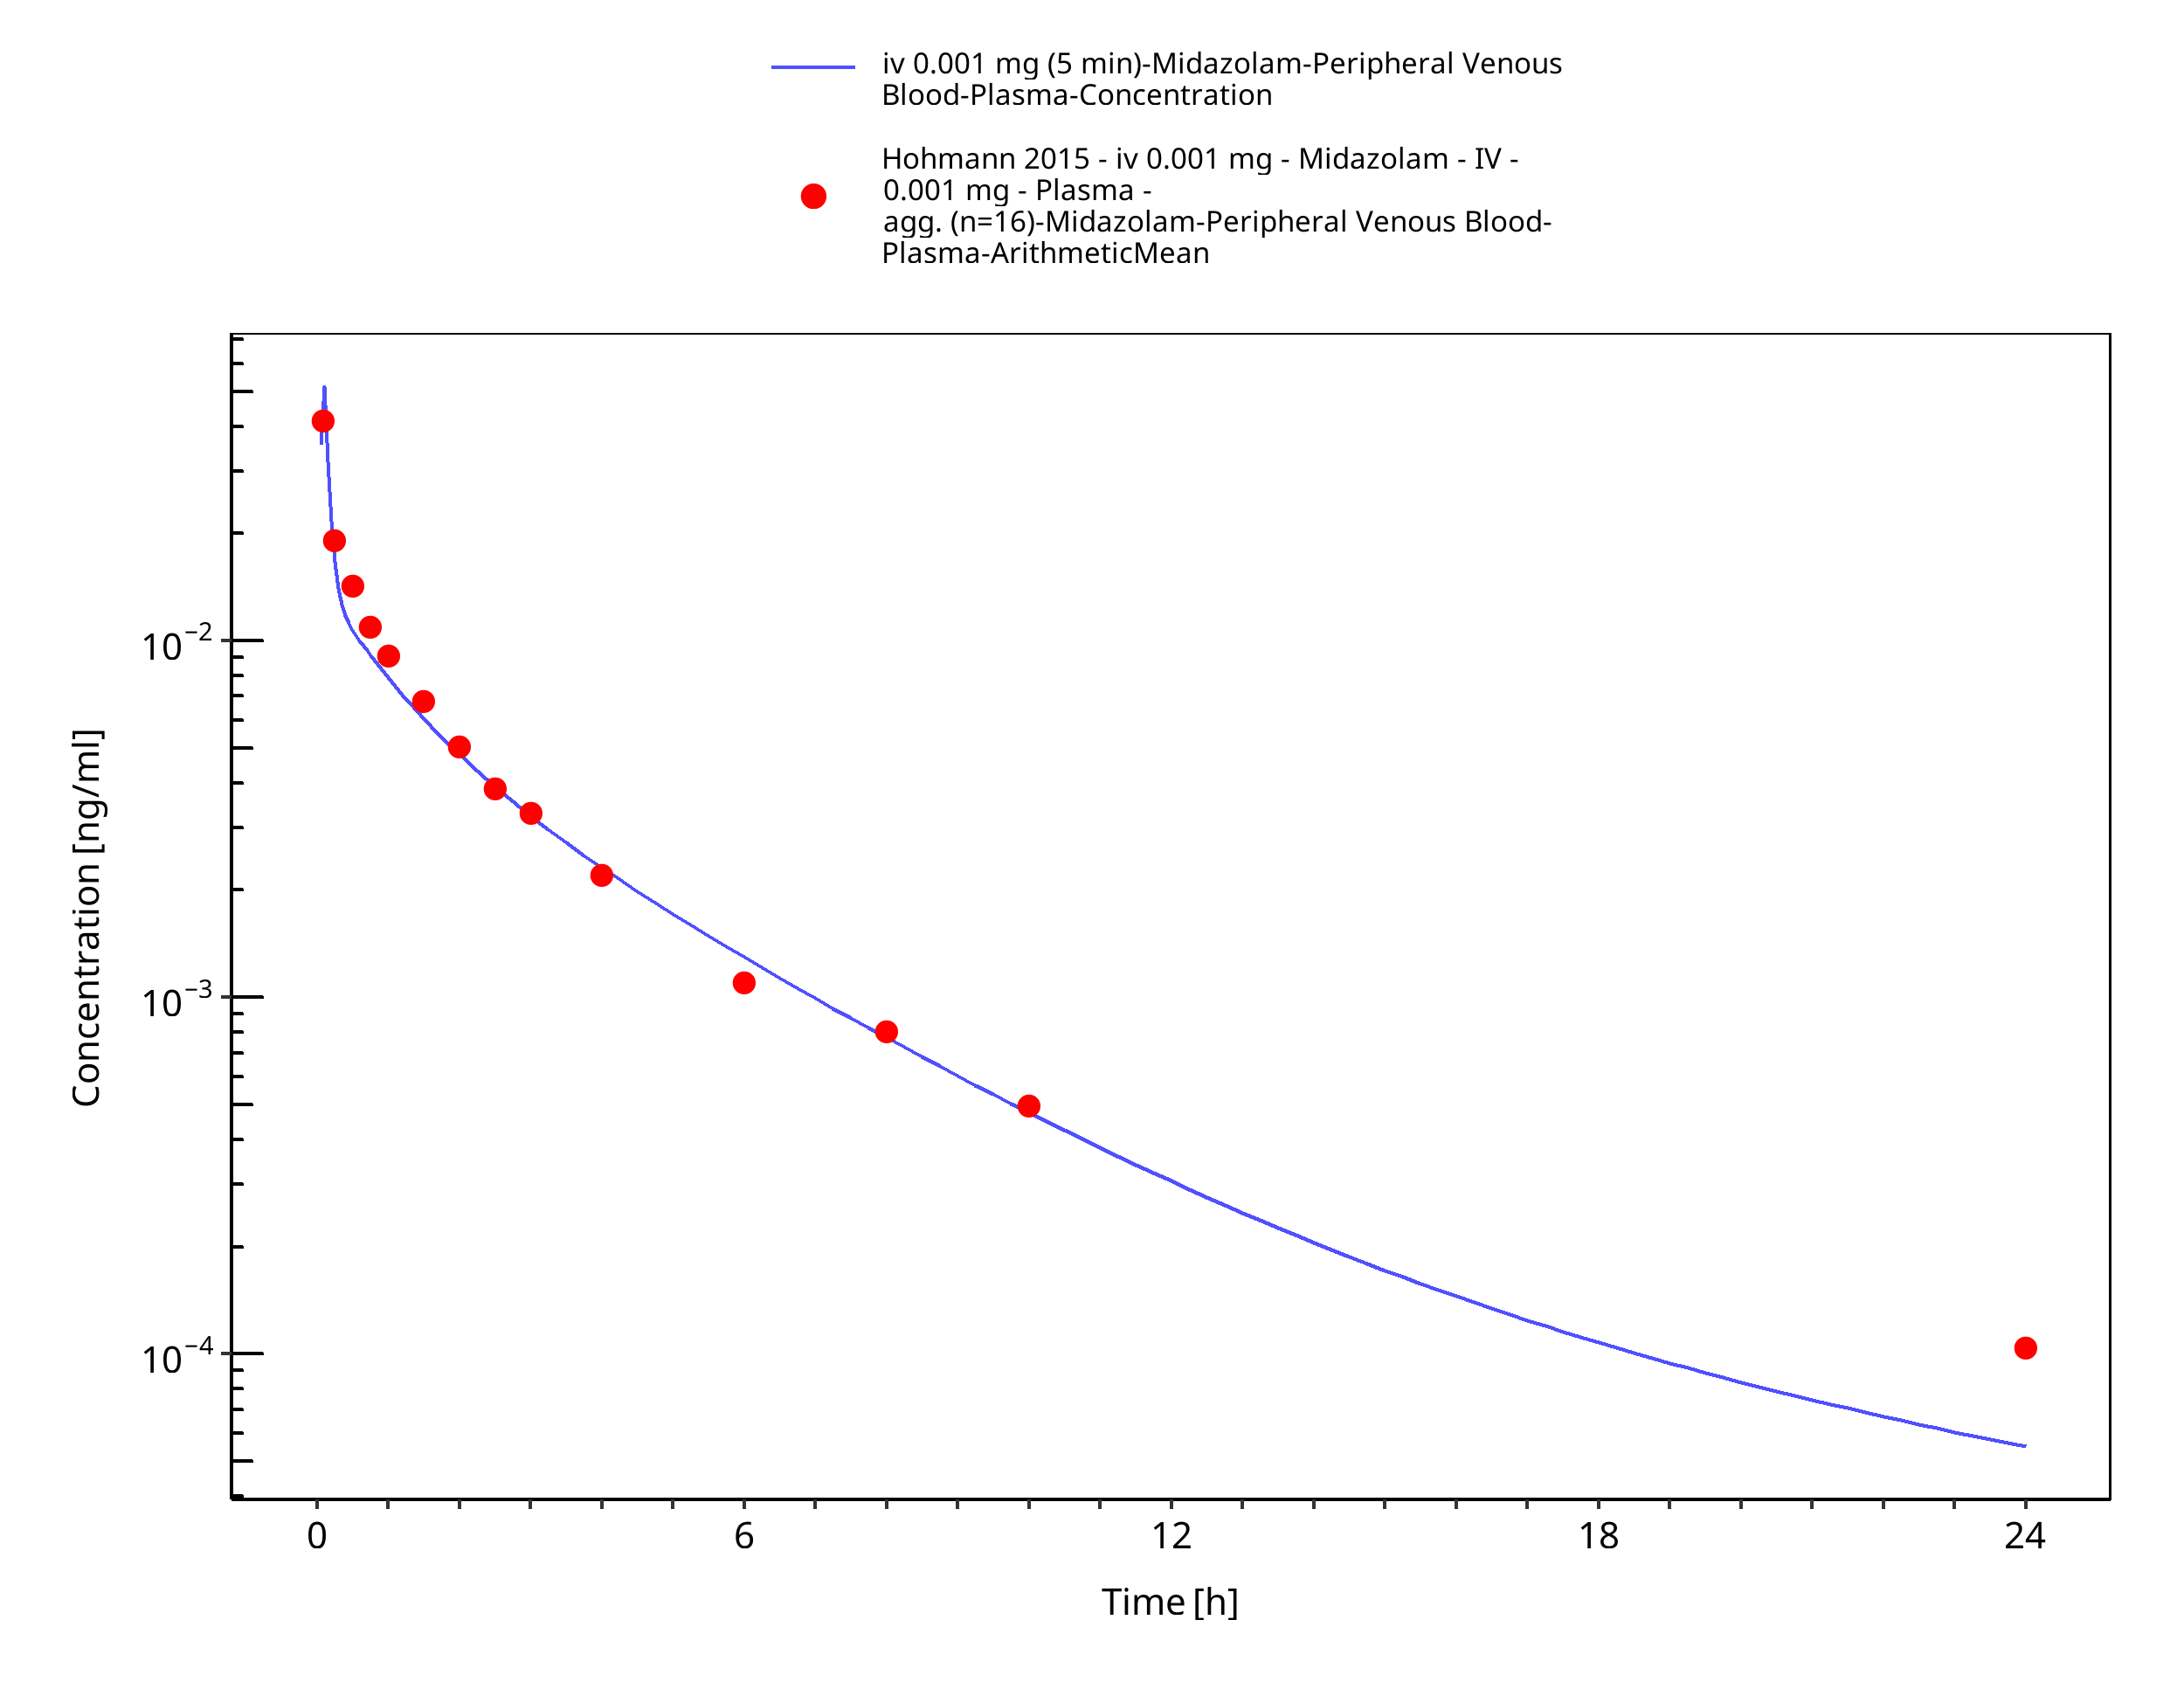
Figure 3-3: iv 0.001 mg (5 min) - Plasma
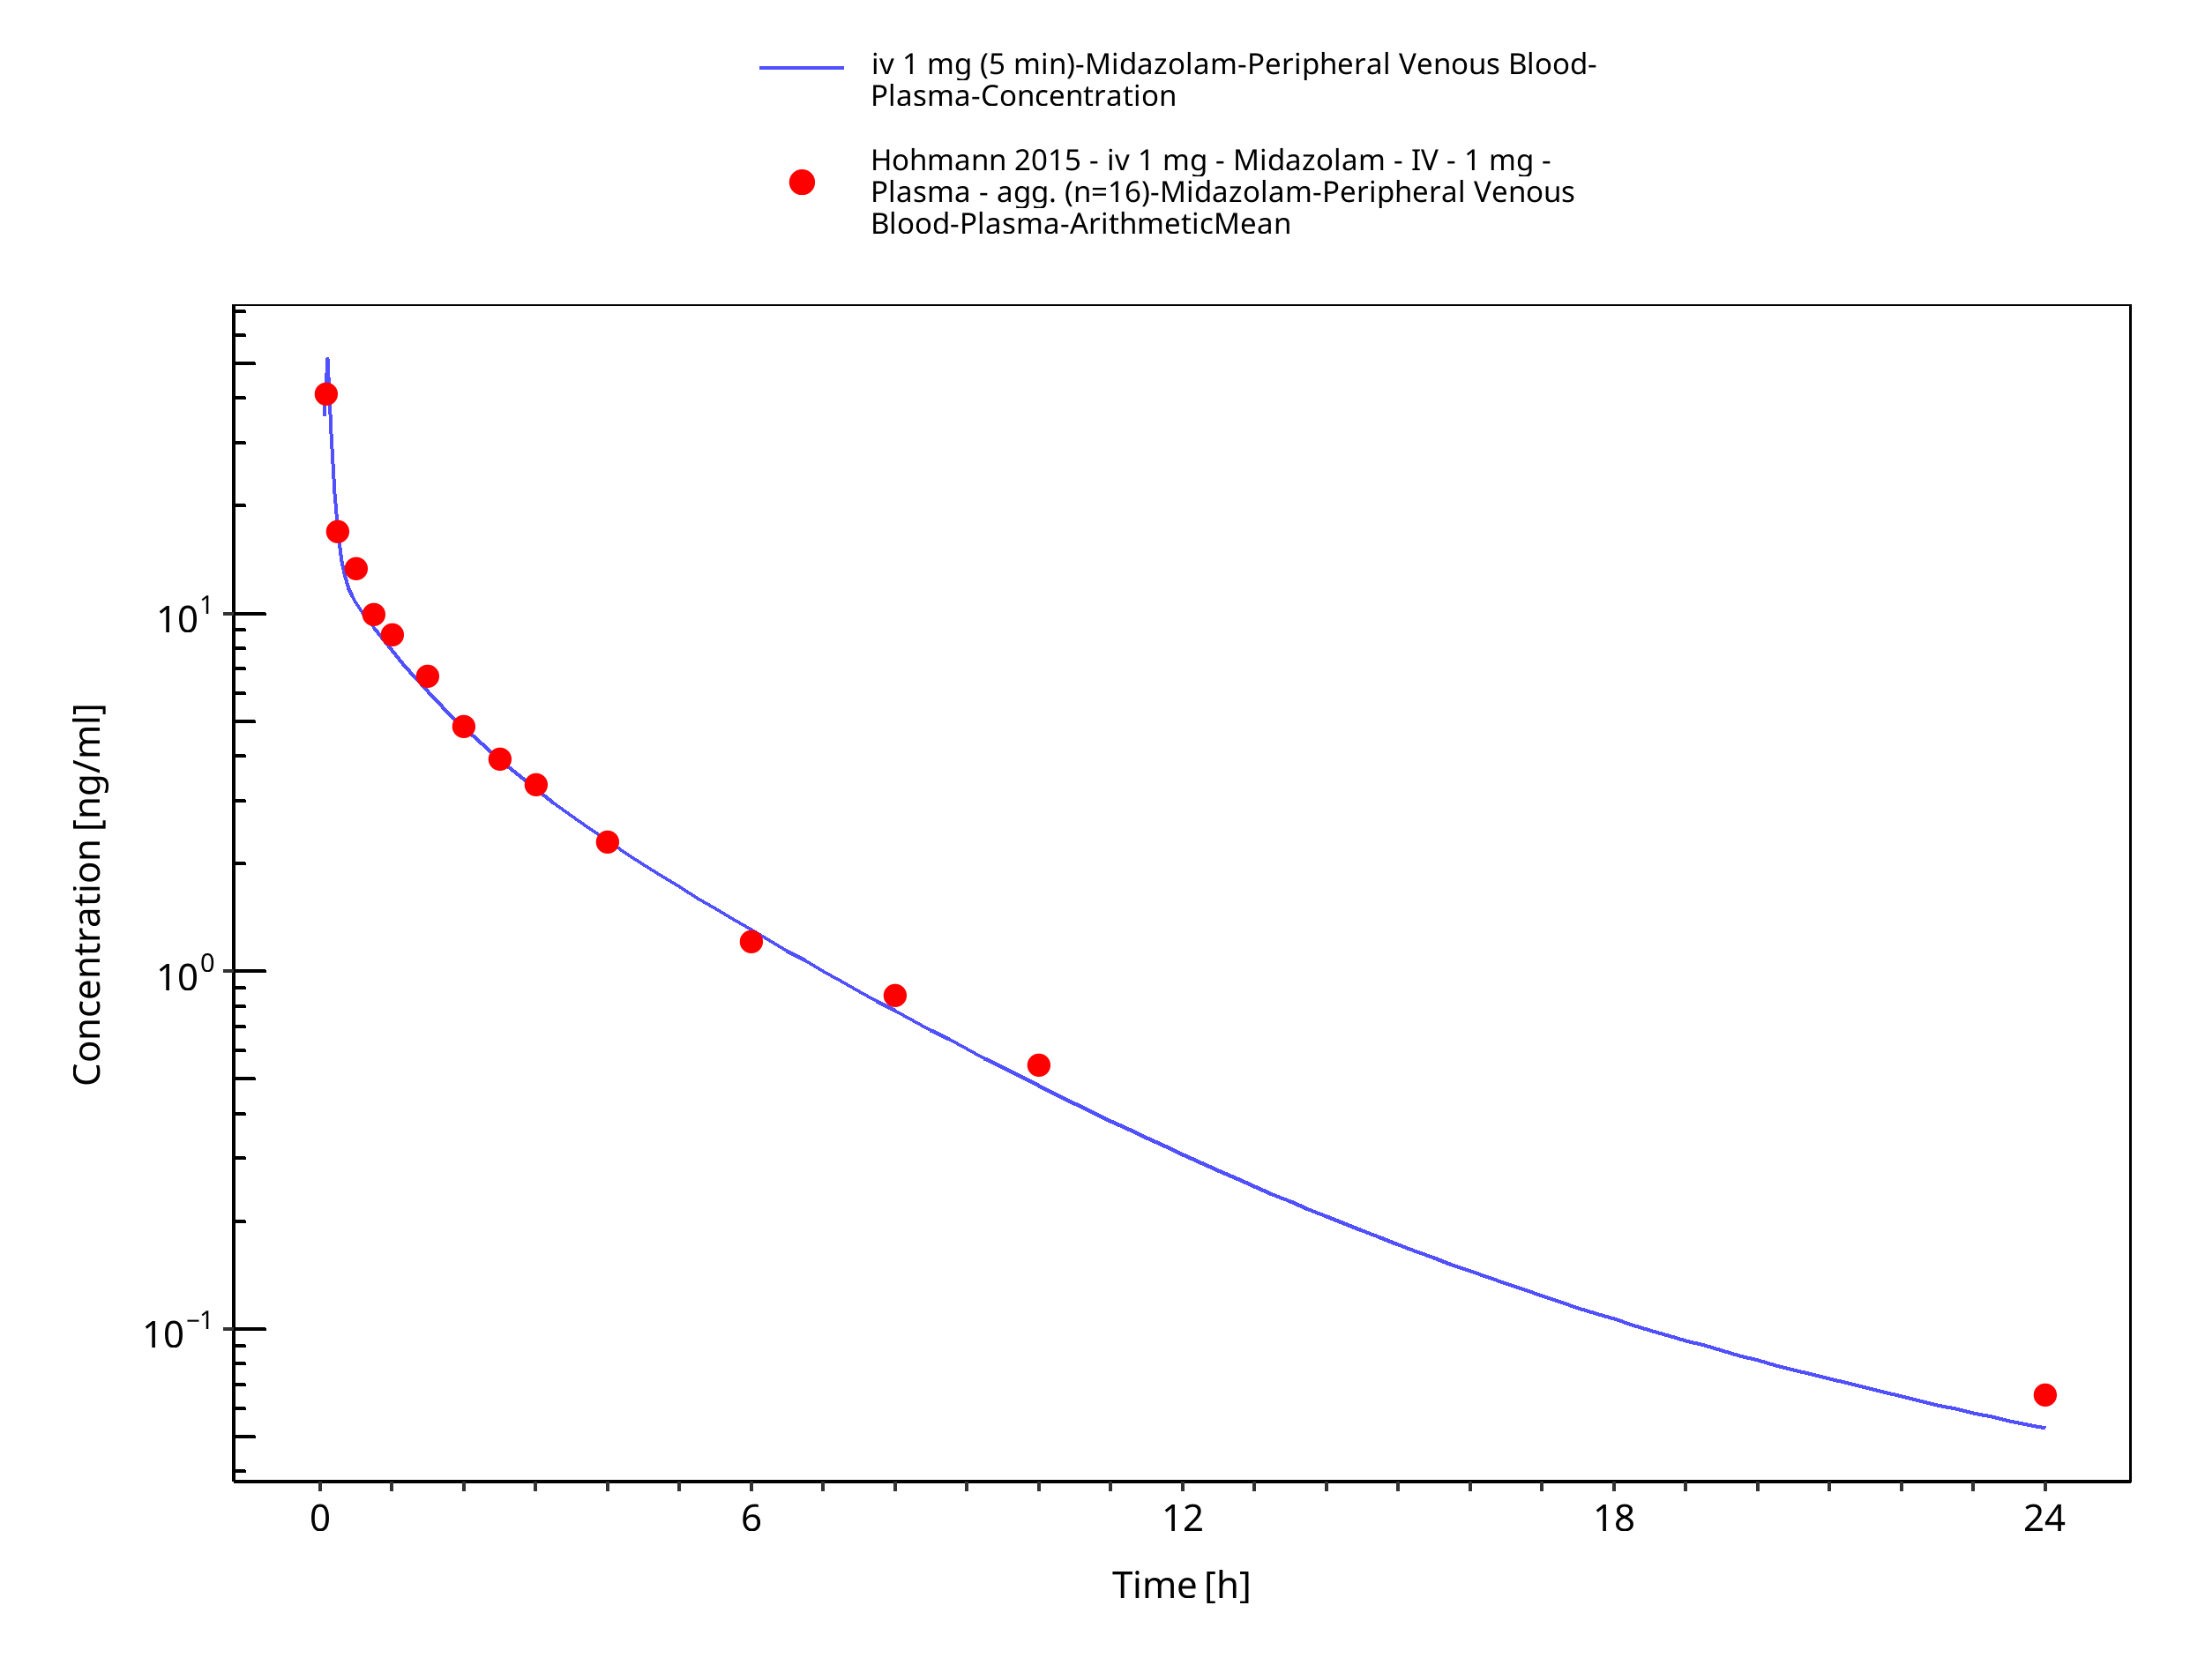
Figure 3-4: iv 1 mg (5 min) - Plasma

Figure 3-5: iv 1 mg (5 min) - Urine
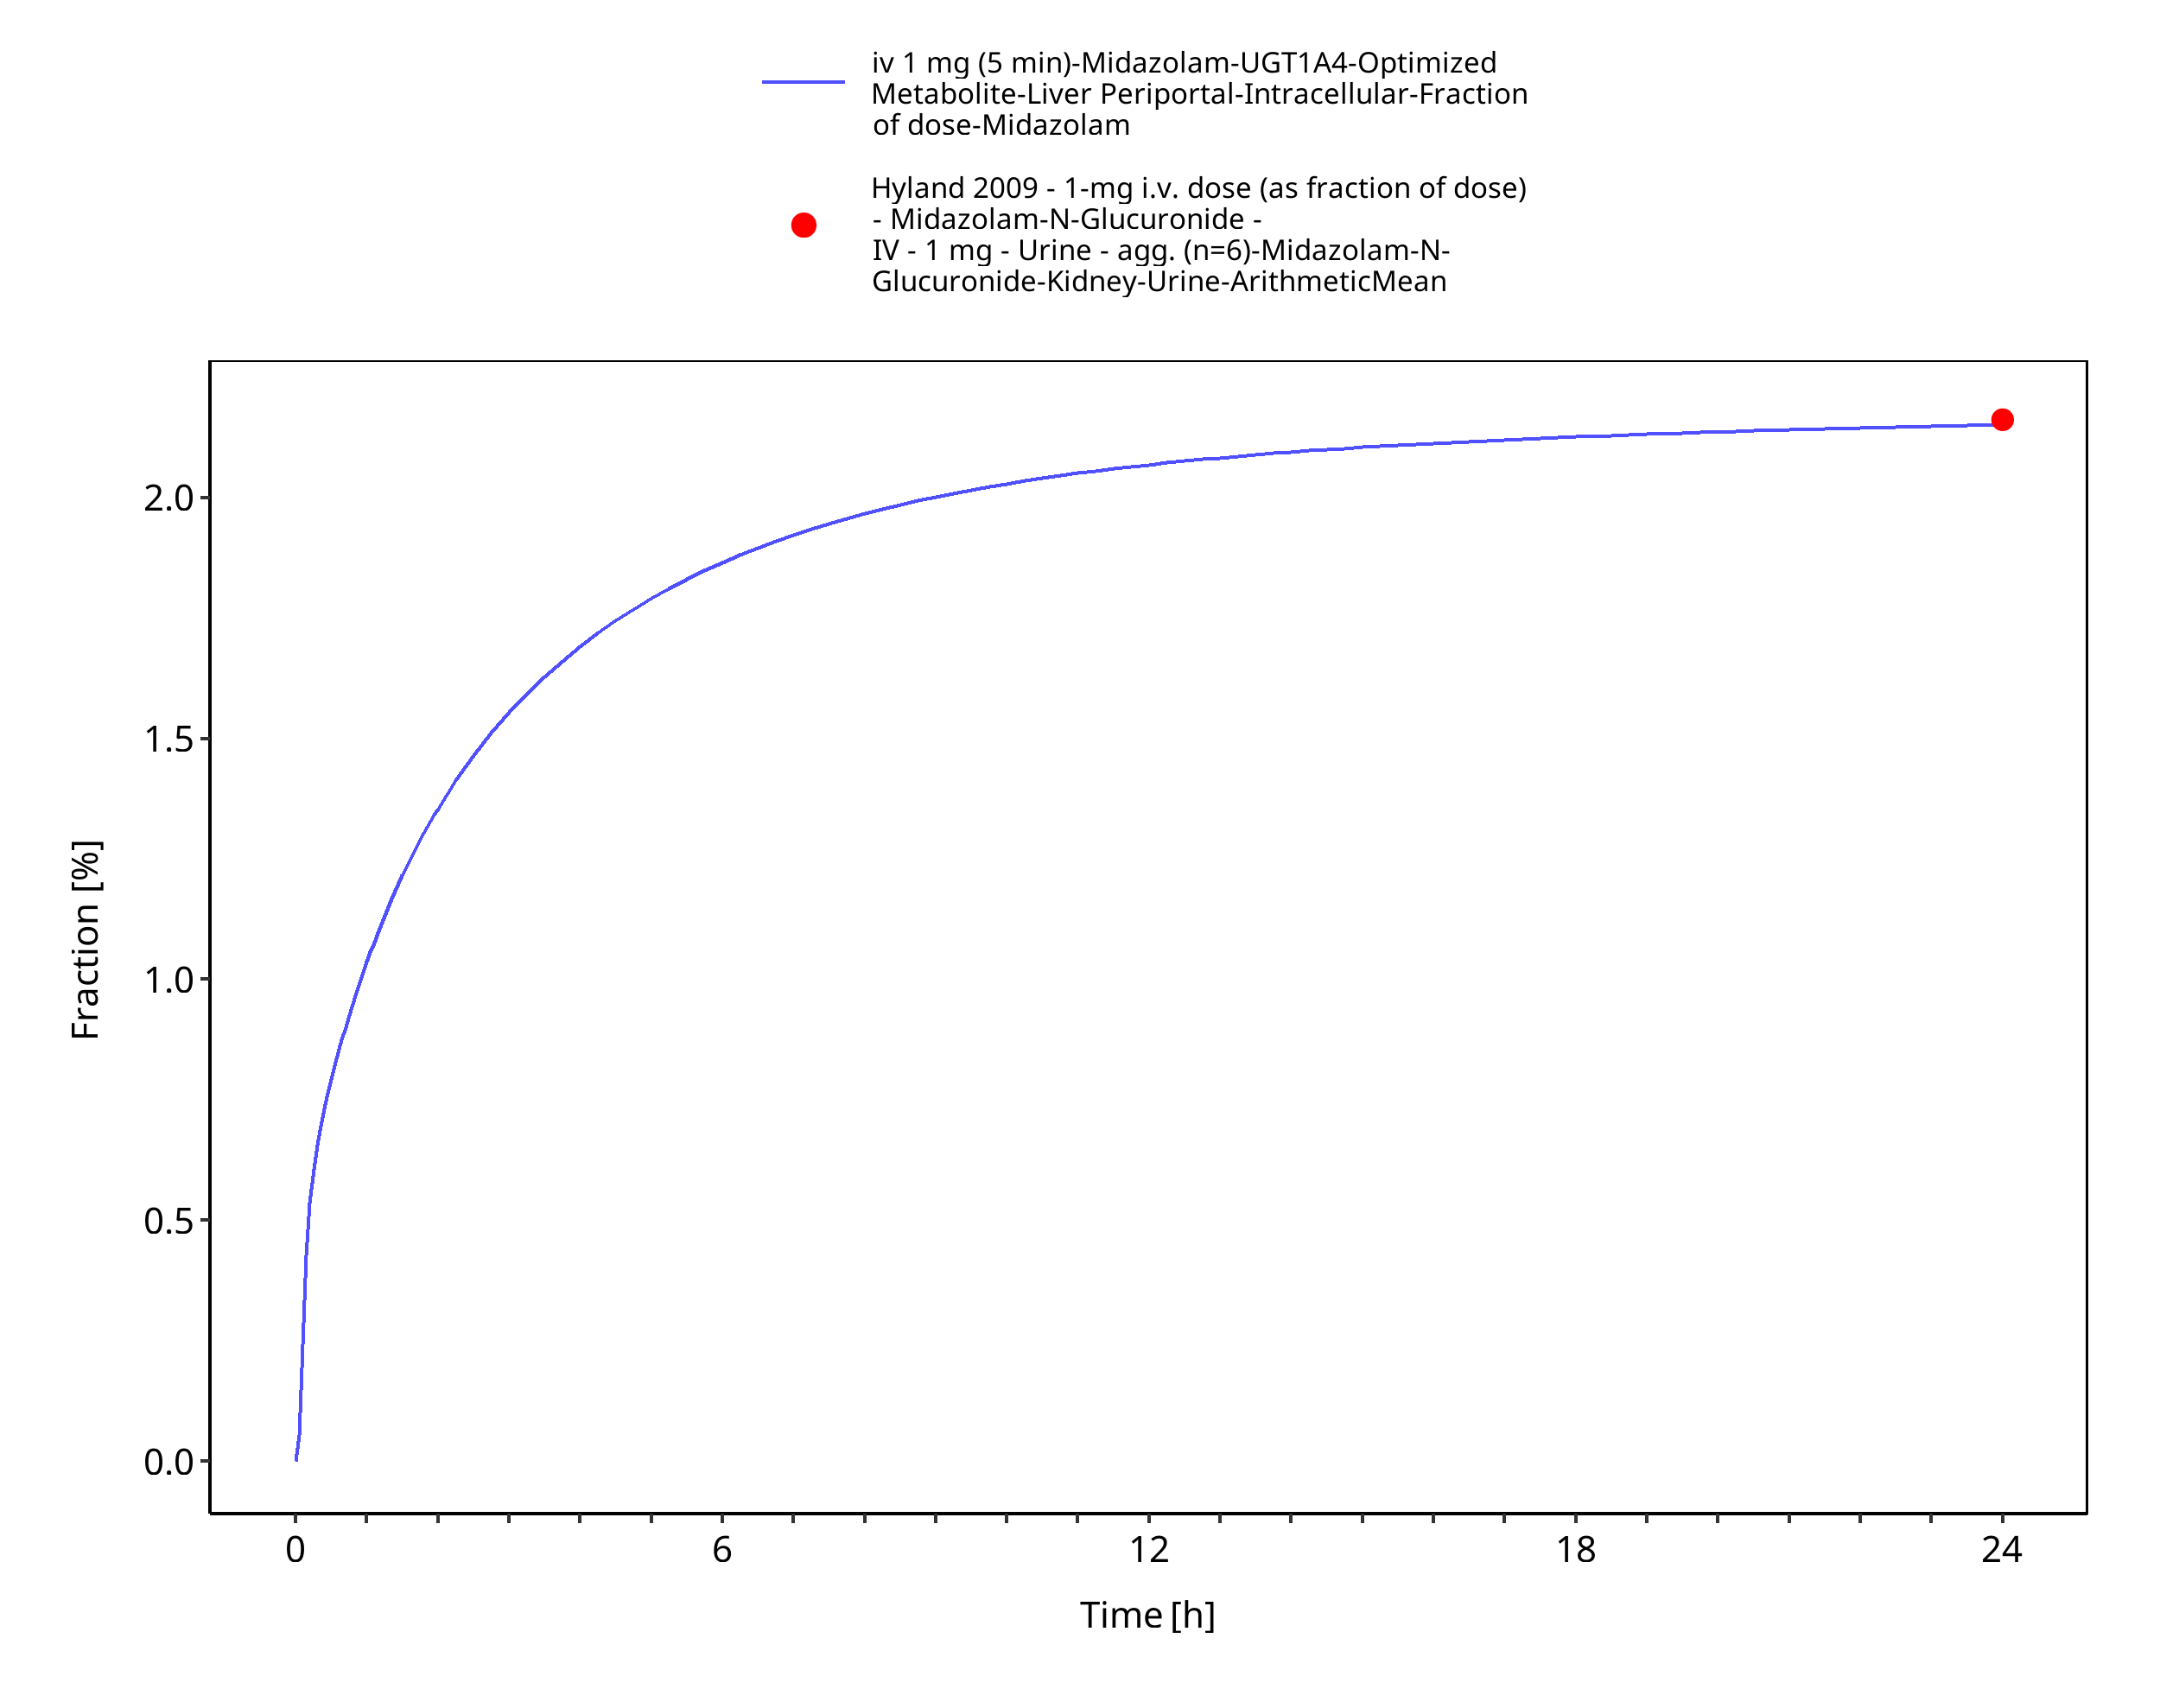
Figure 3-6: iv 1 mg (5 min) - fm UGT1A4
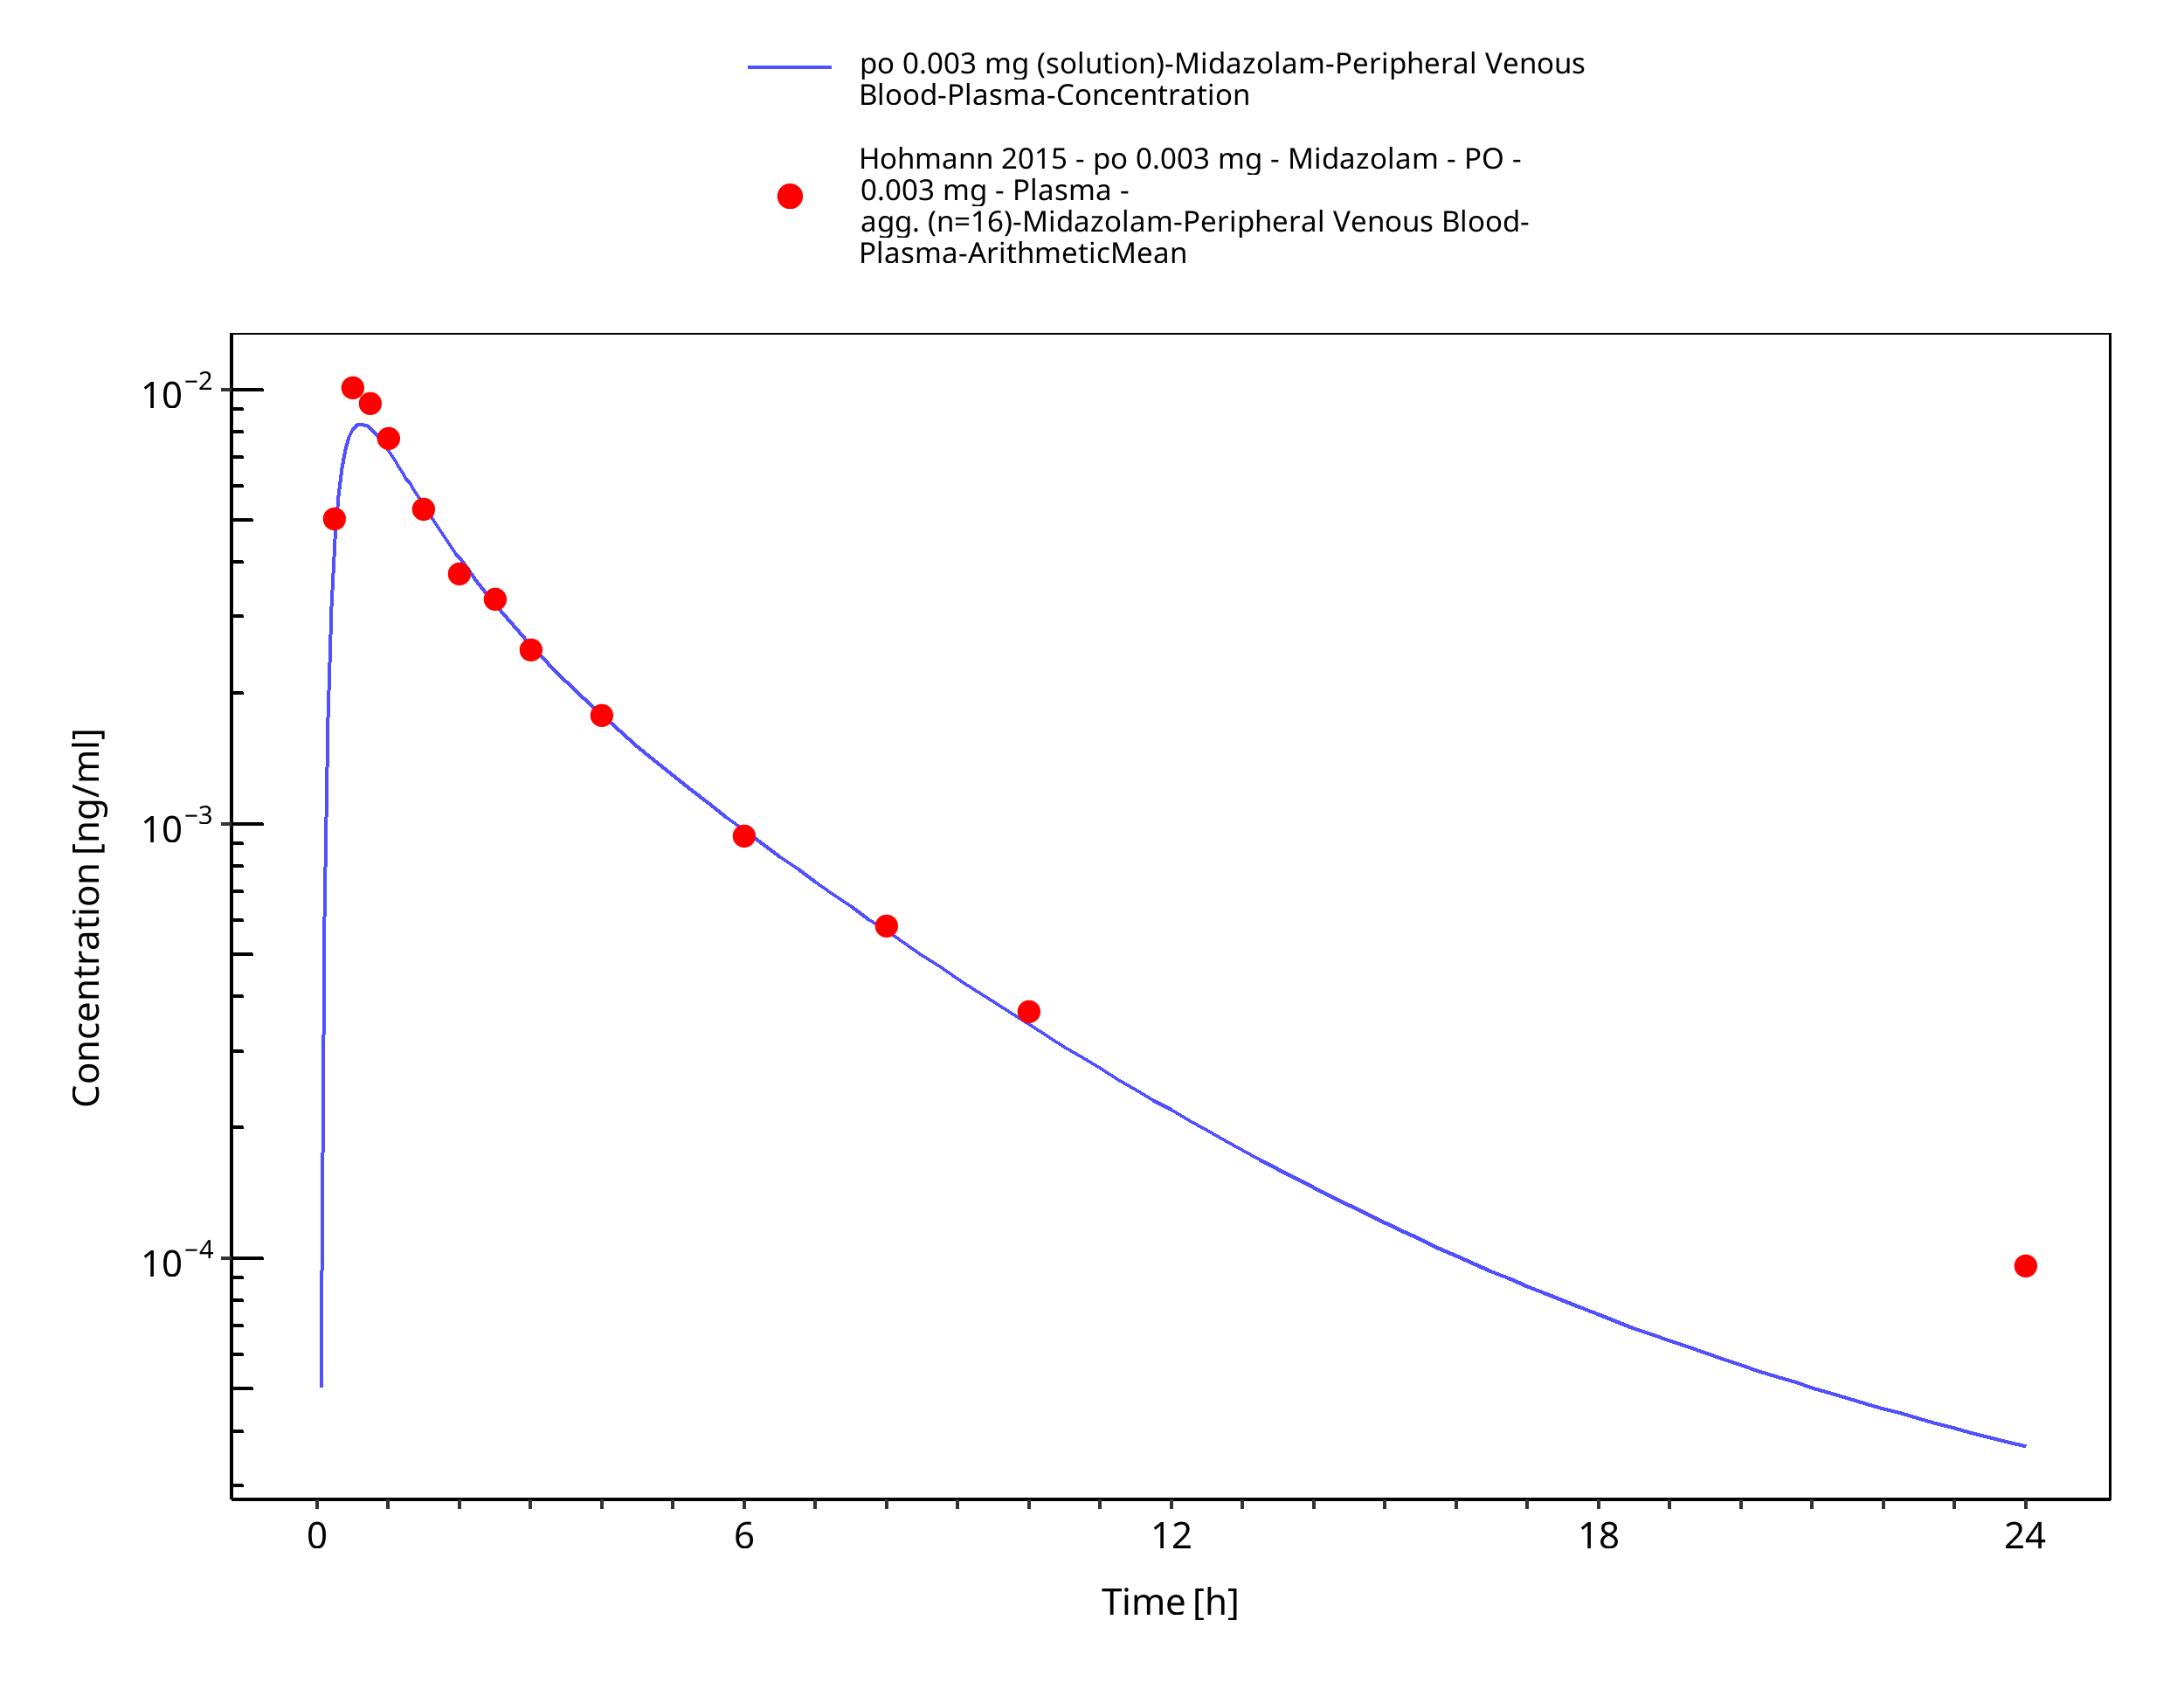
Figure 3-7: po 0.003 mg (solution) - Plasma
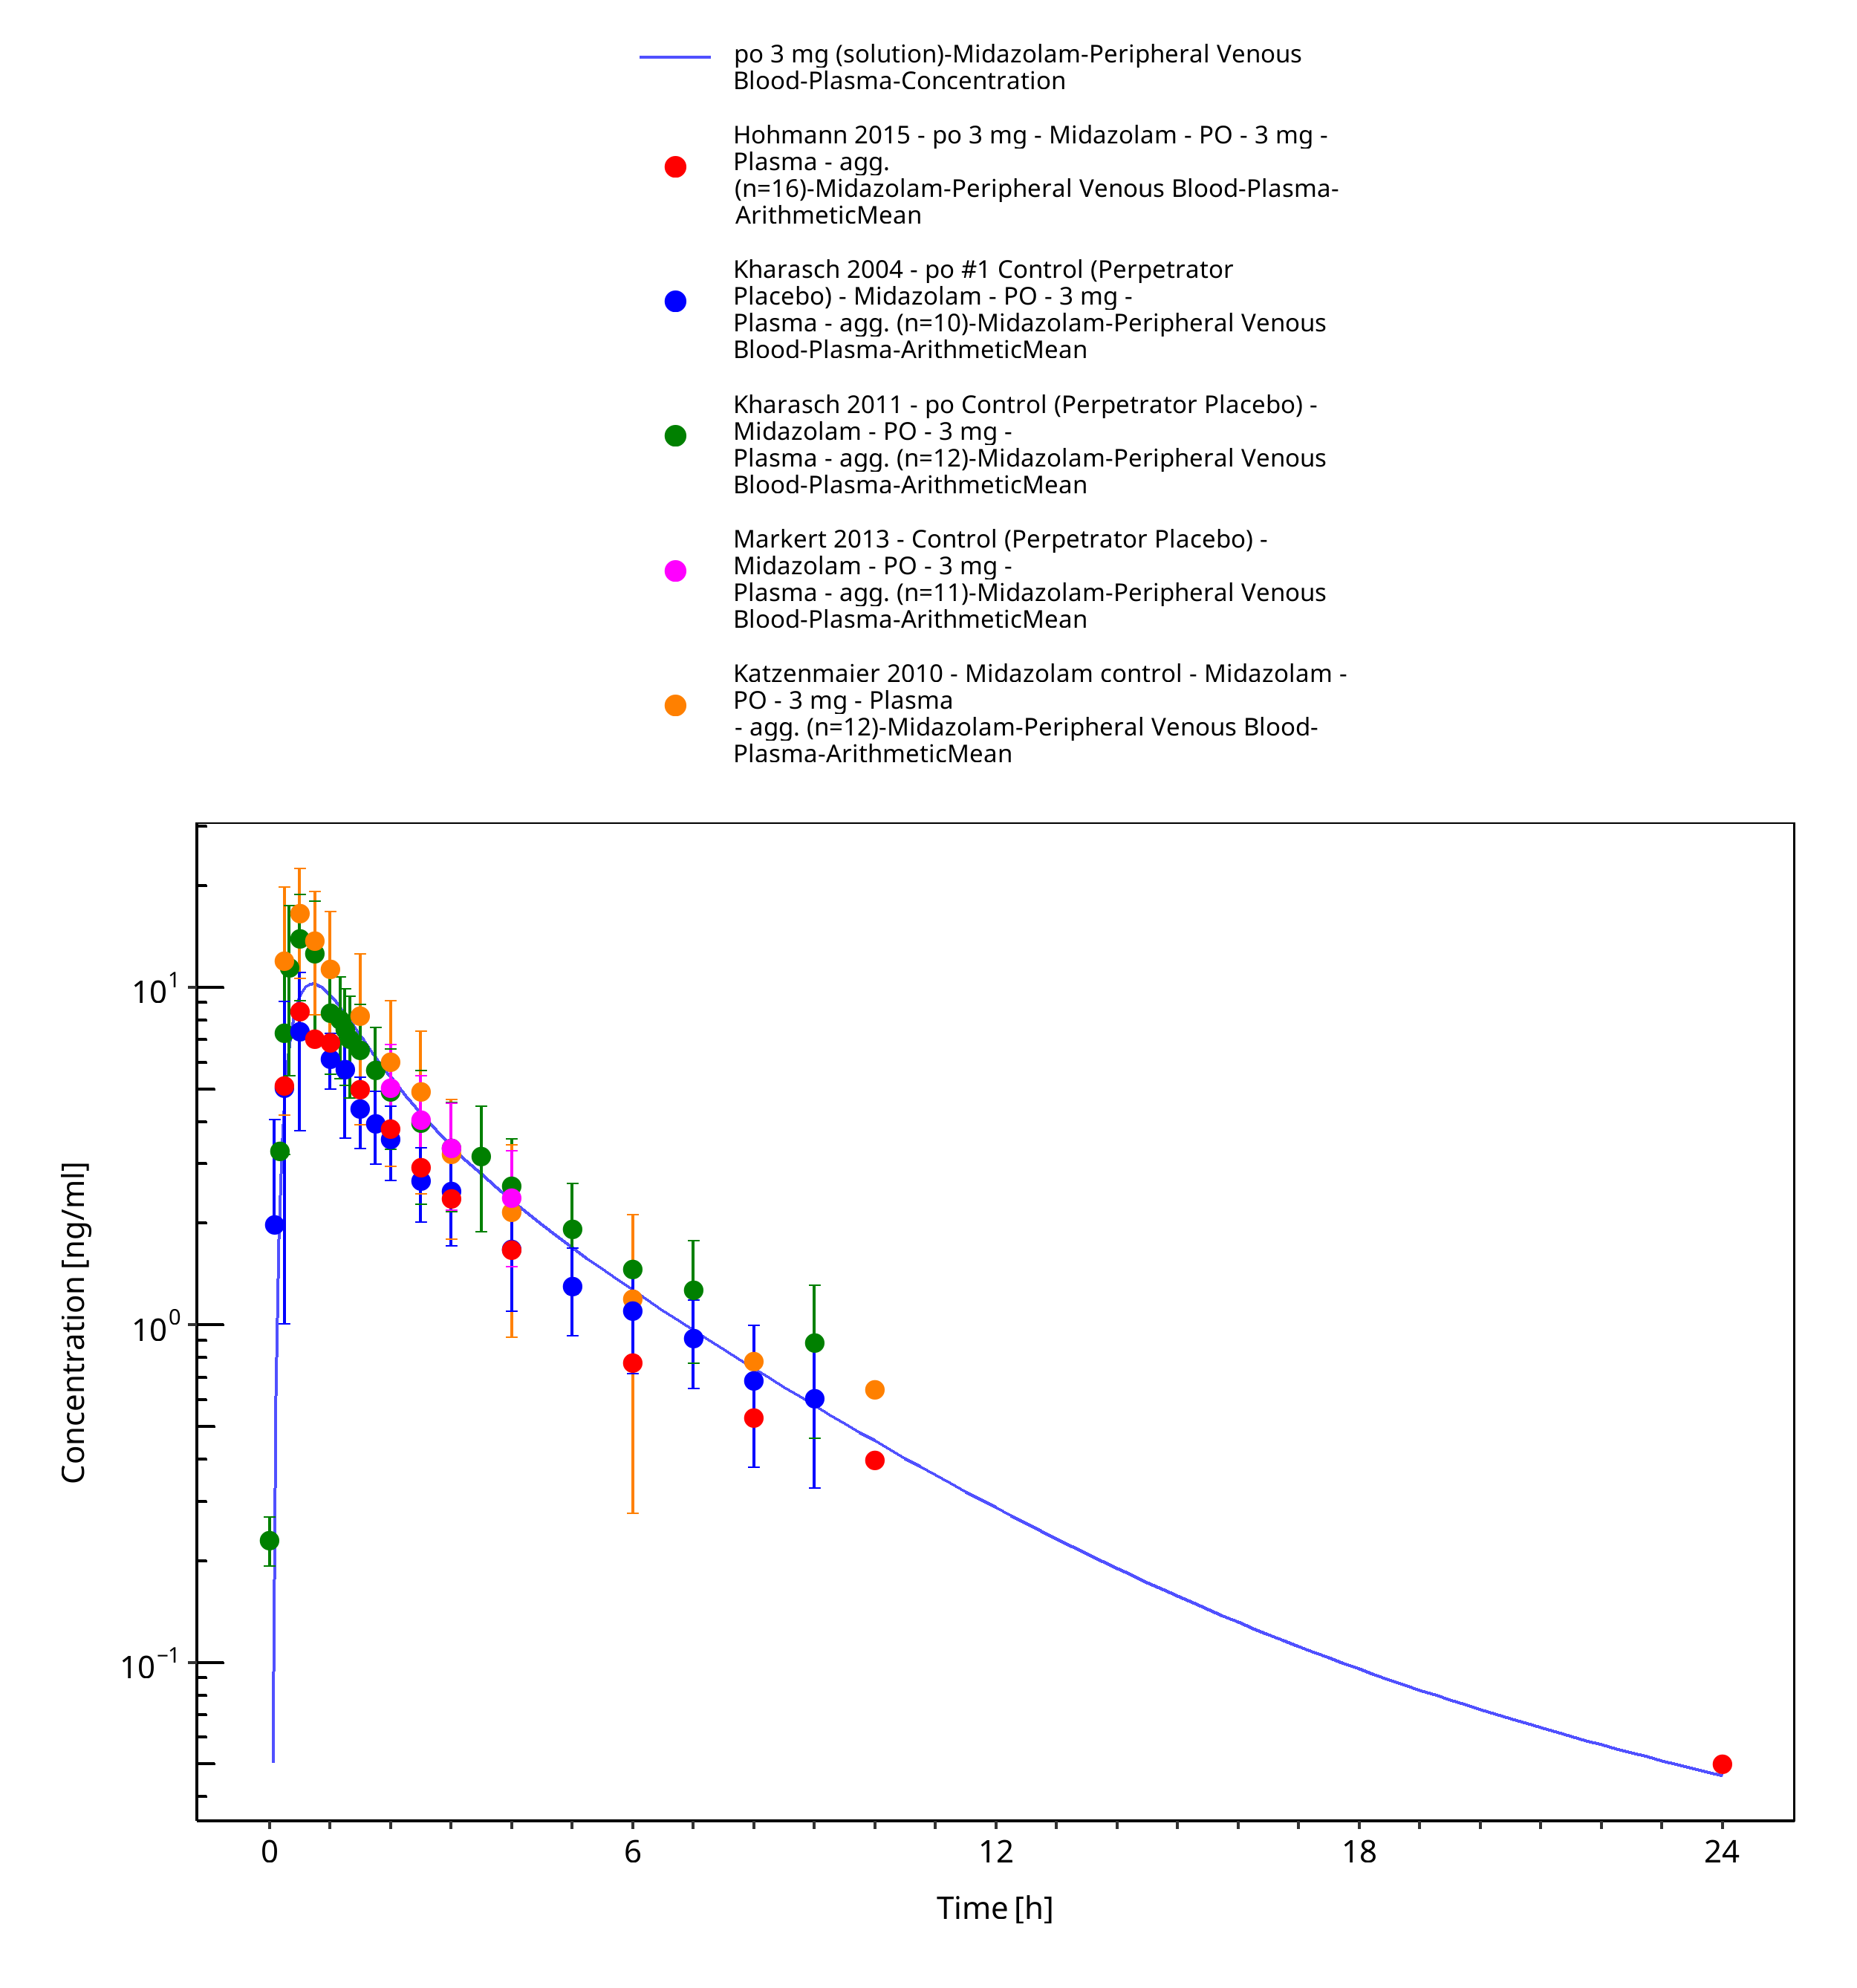
Figure 3-8: po 3 mg (solution) - Plasma
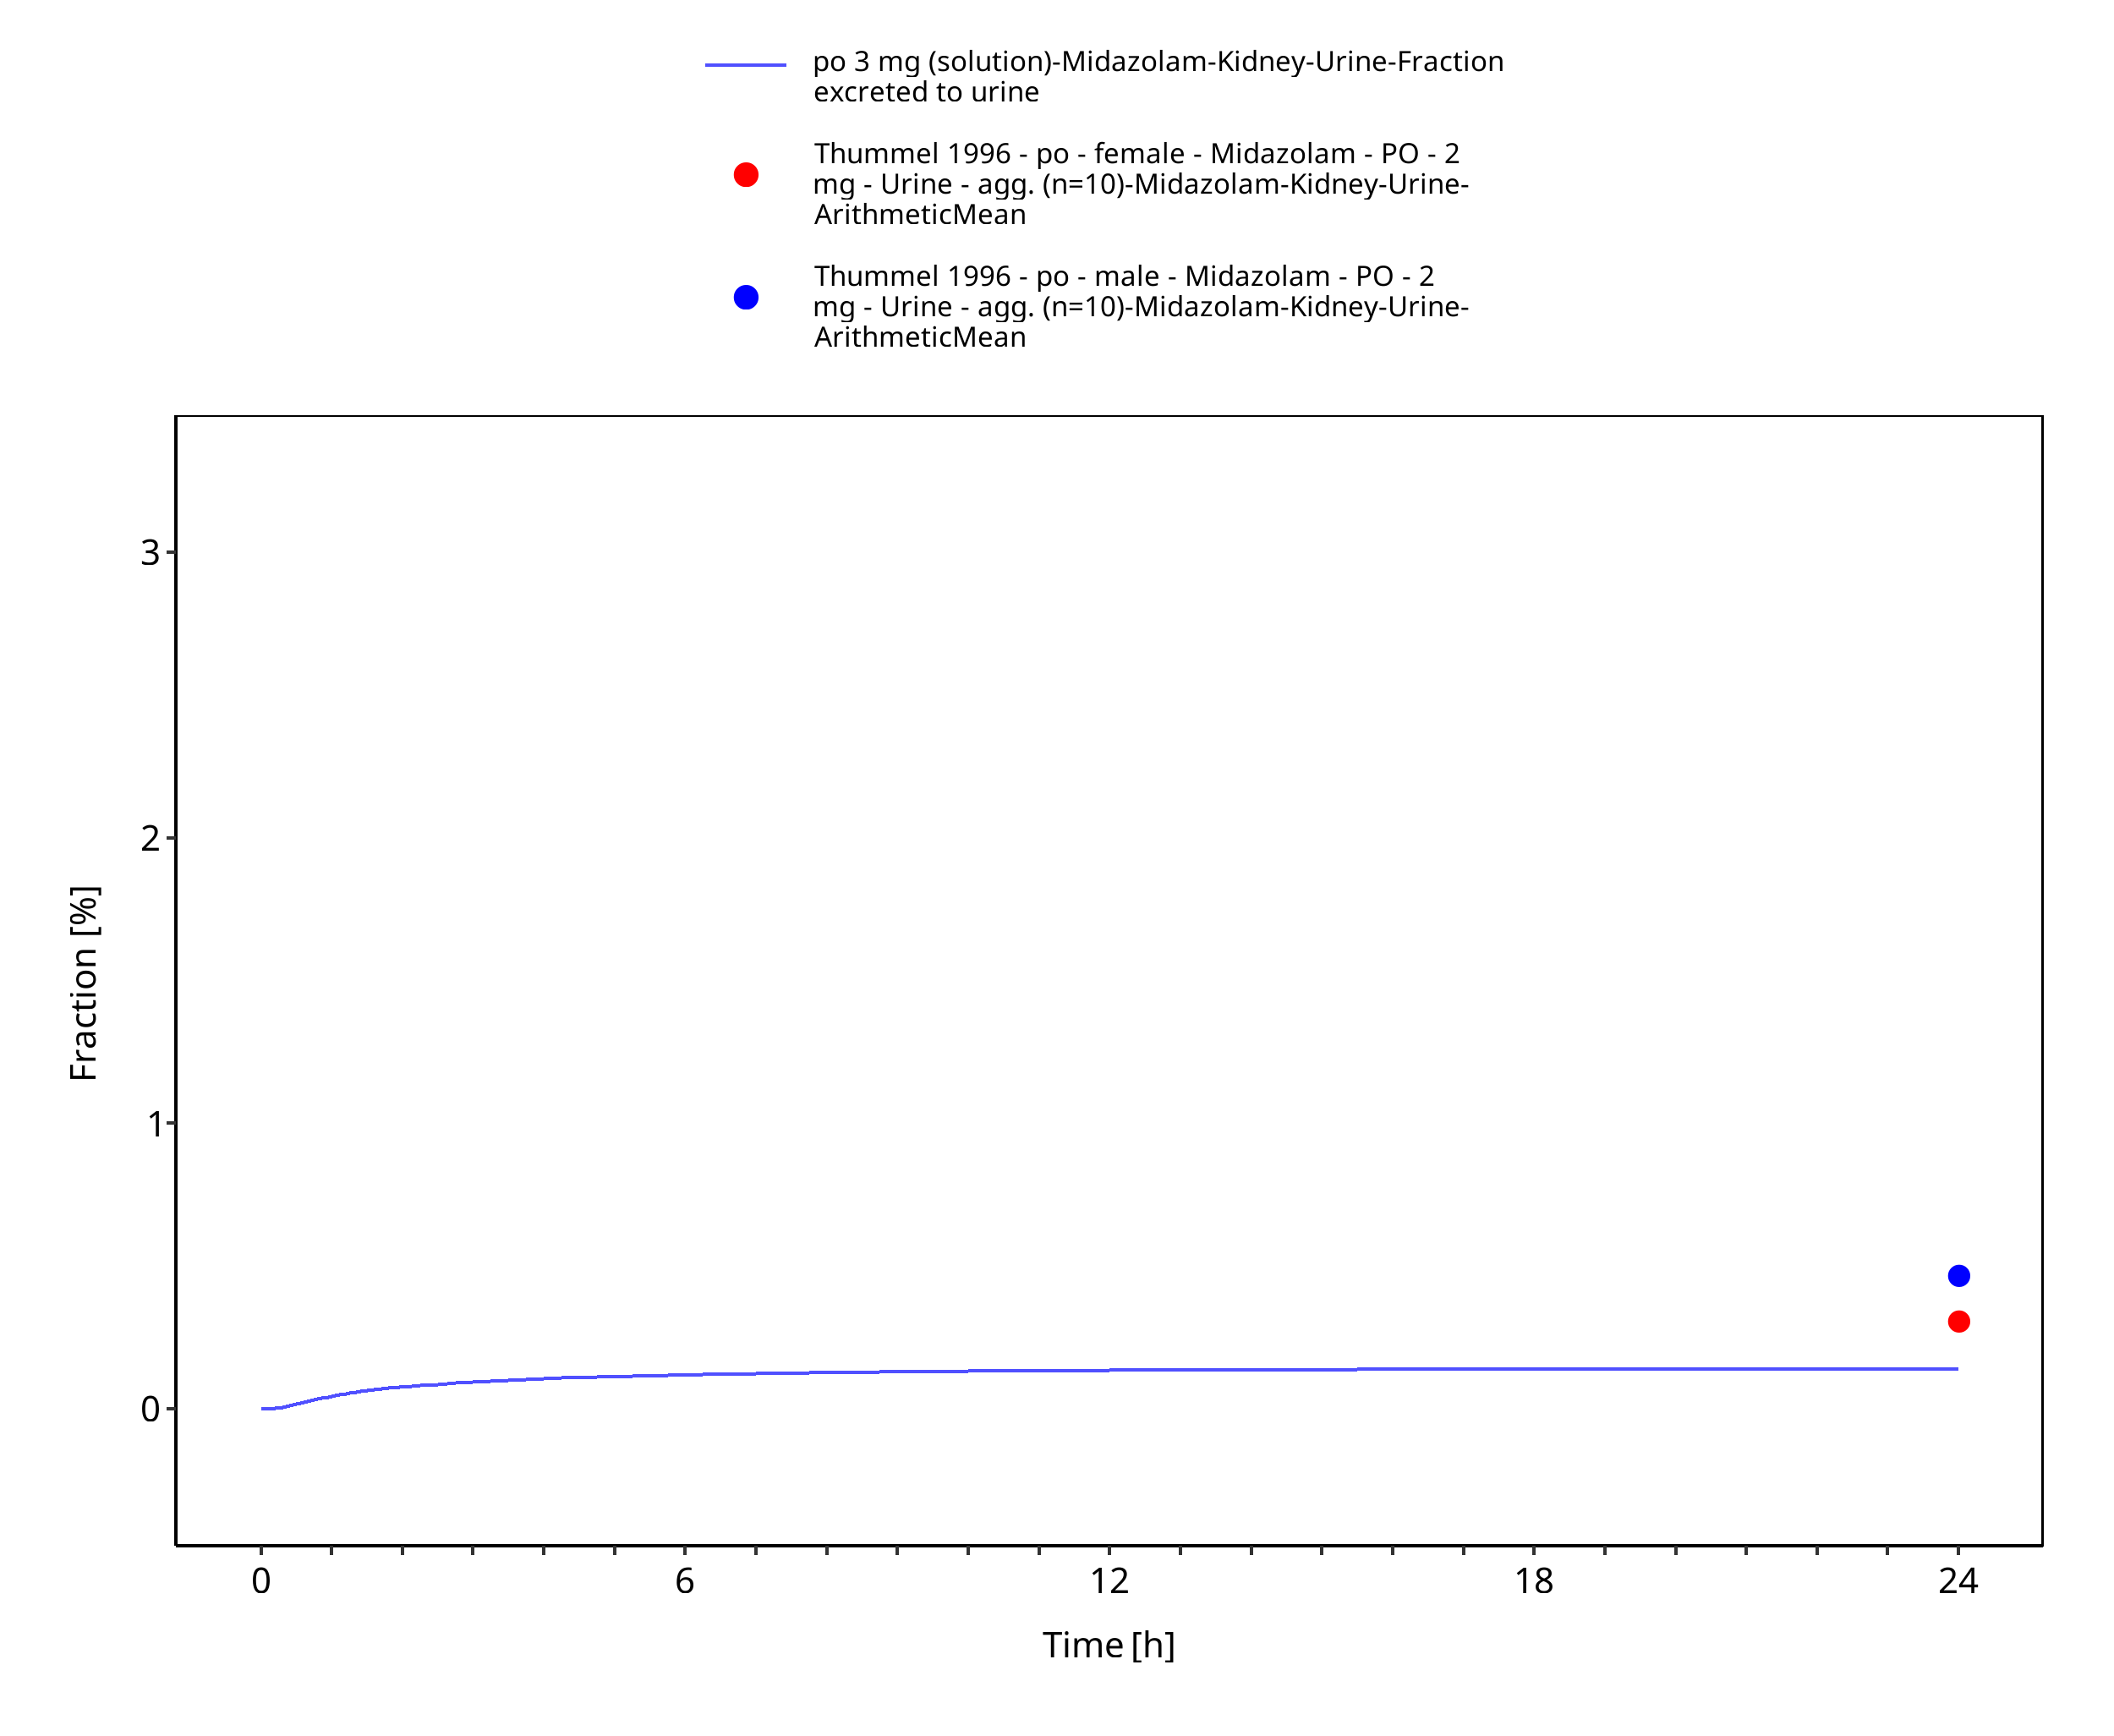
Figure 3-9: po 3 mg (solution) - Urine
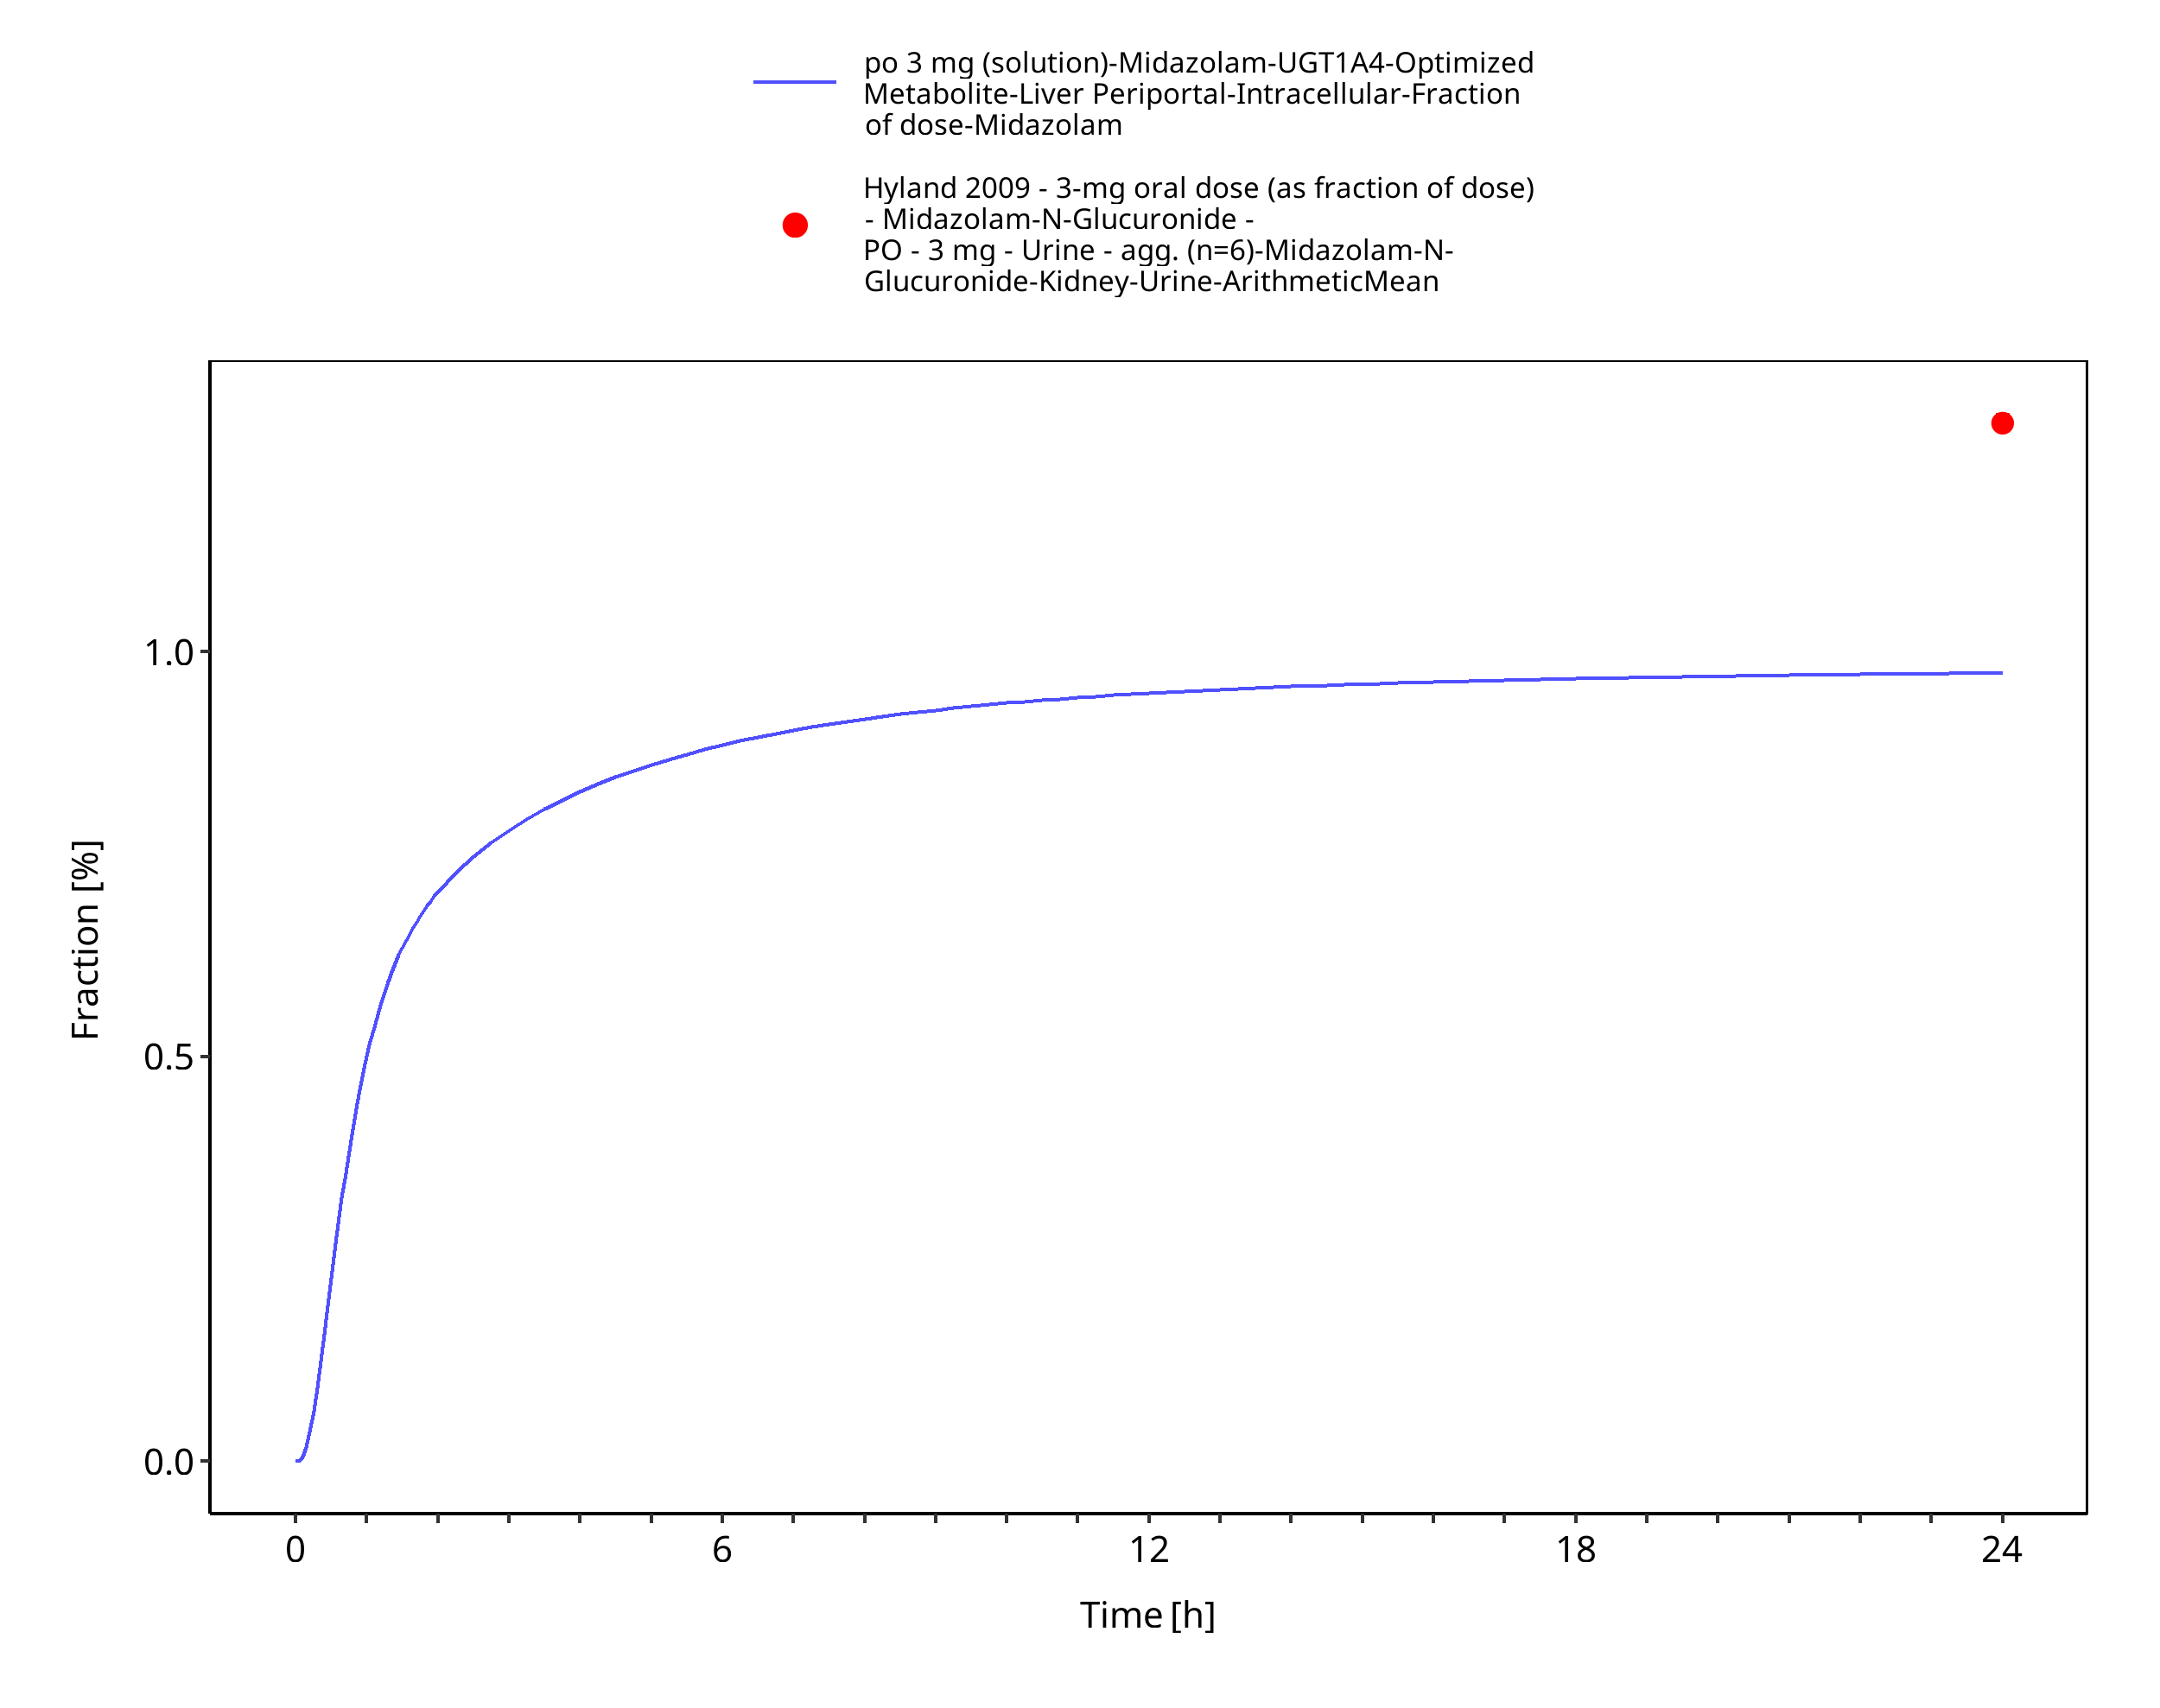
Figure 3-10: po 3 mg (solution) - fm UGT1A4
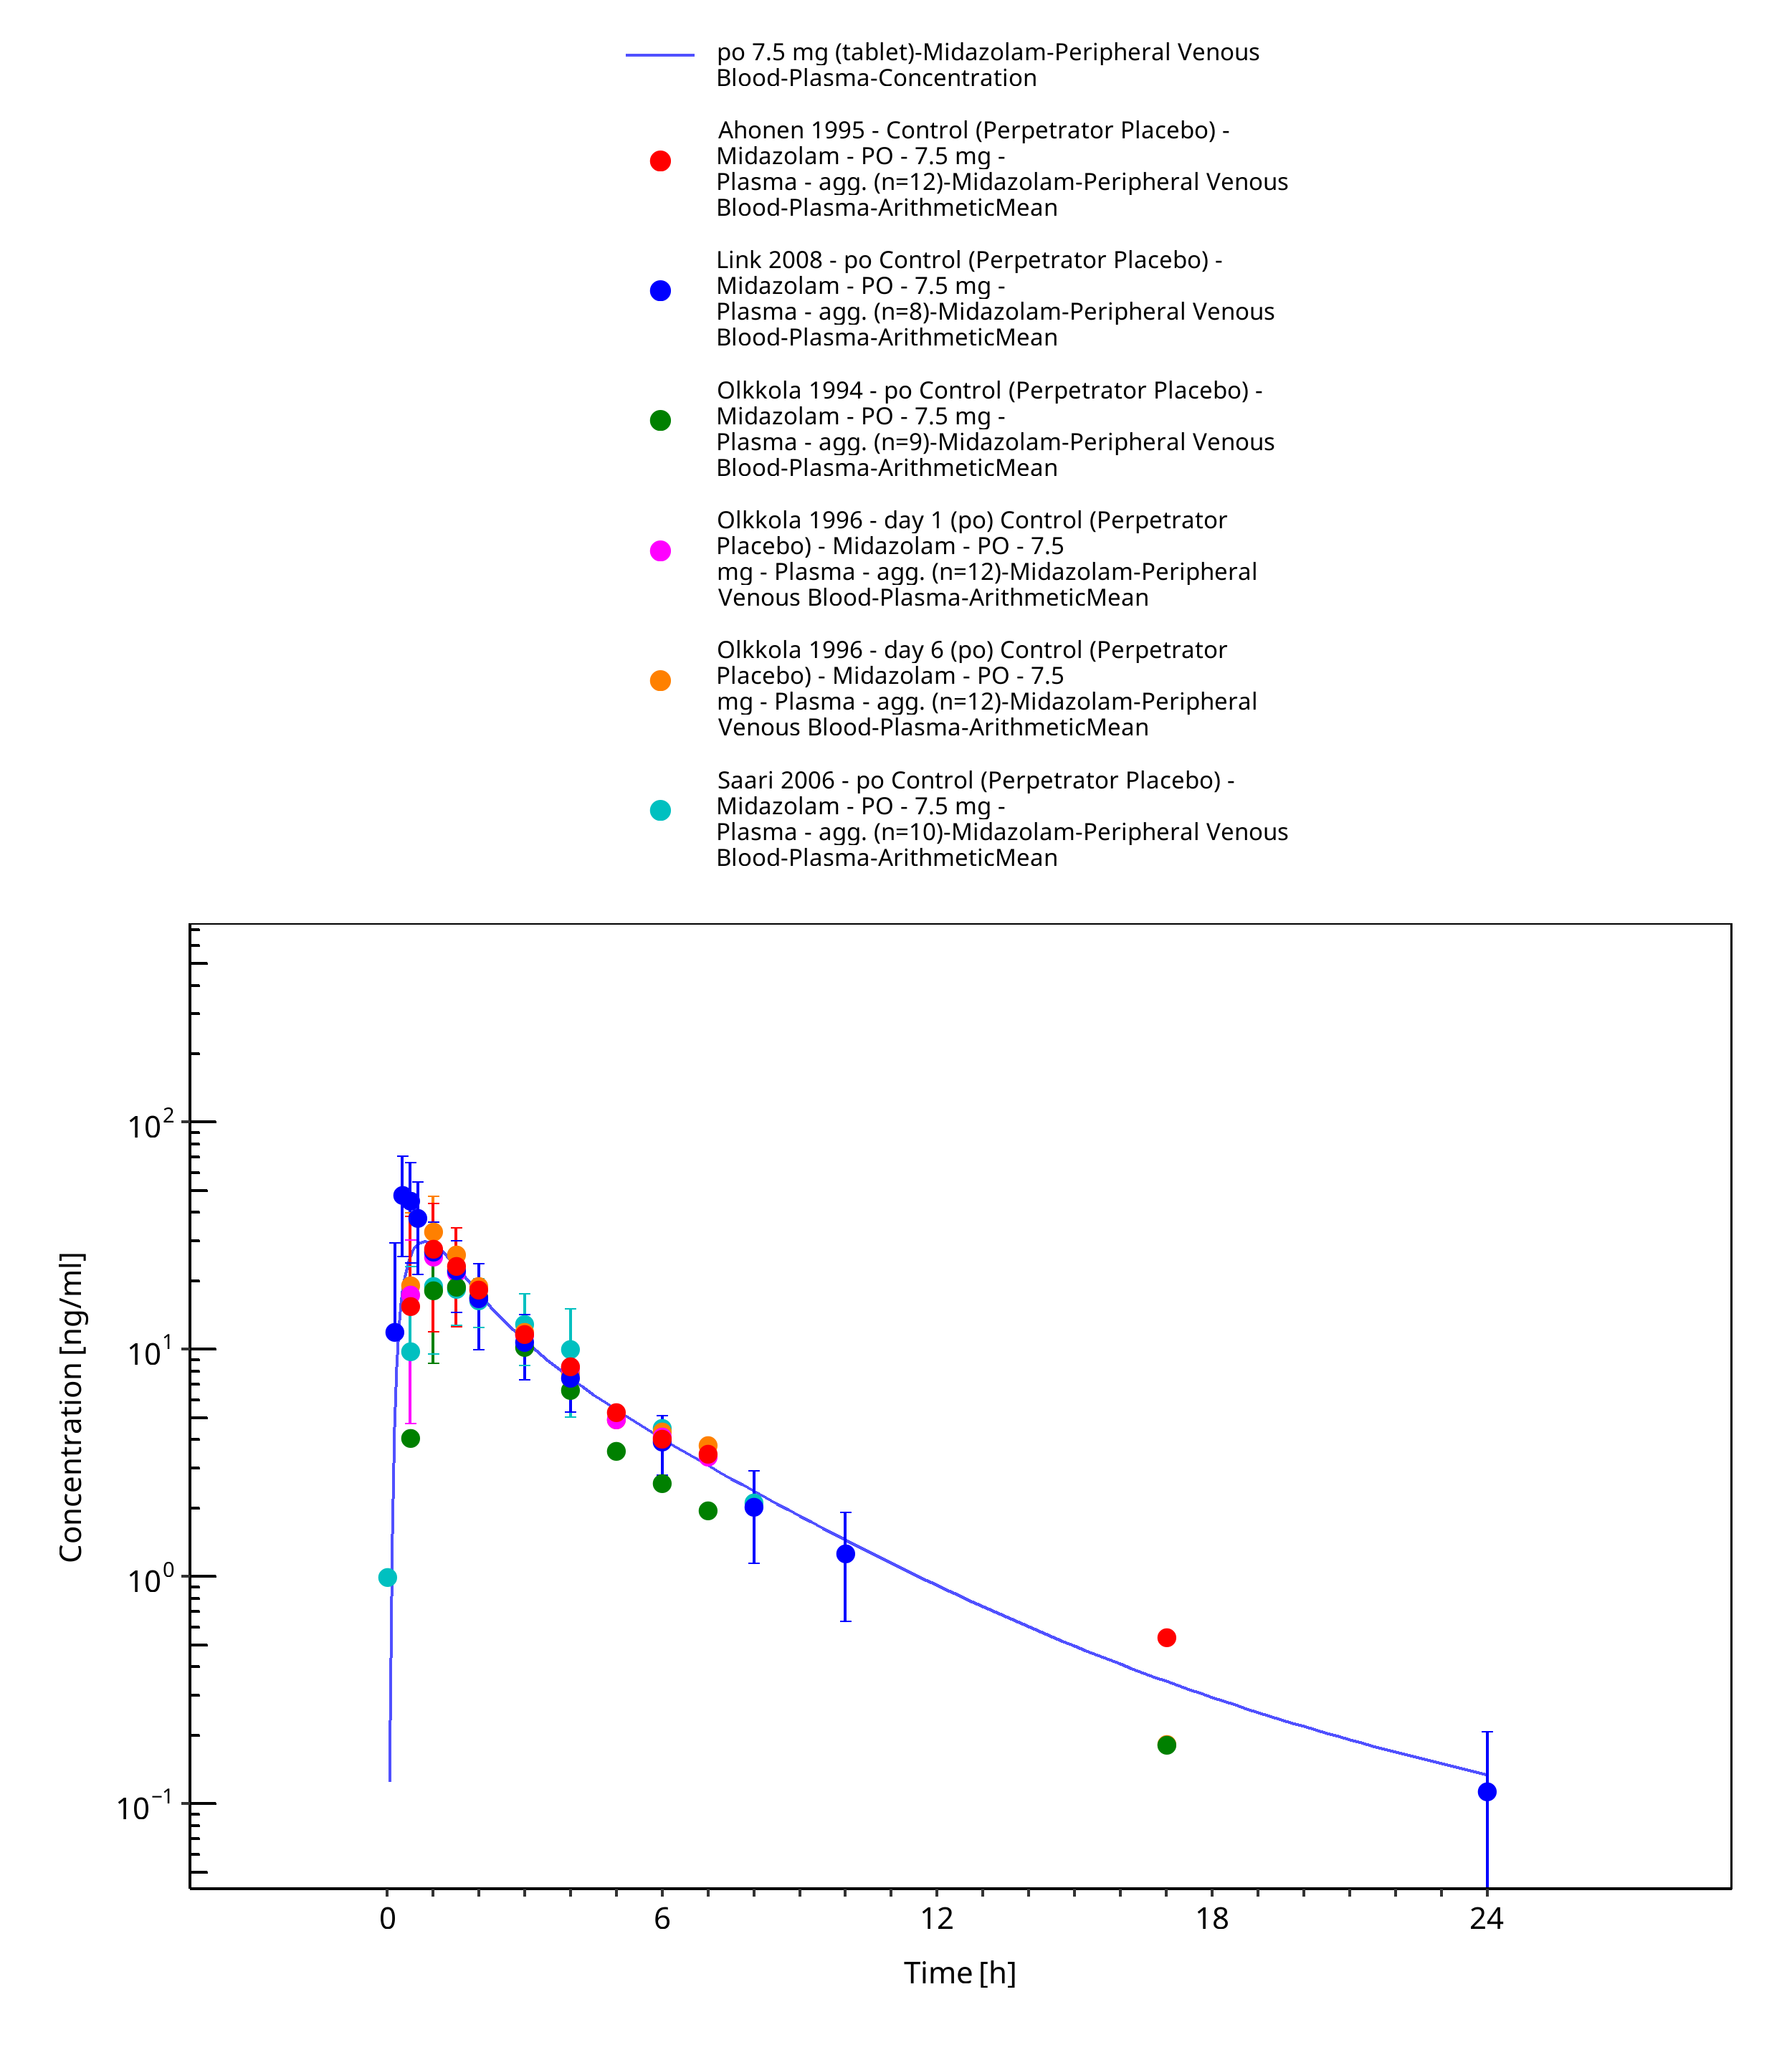
Figure 3-11: po 7.5 mg (tablet) - Plasma
3.3.2 Model Verification
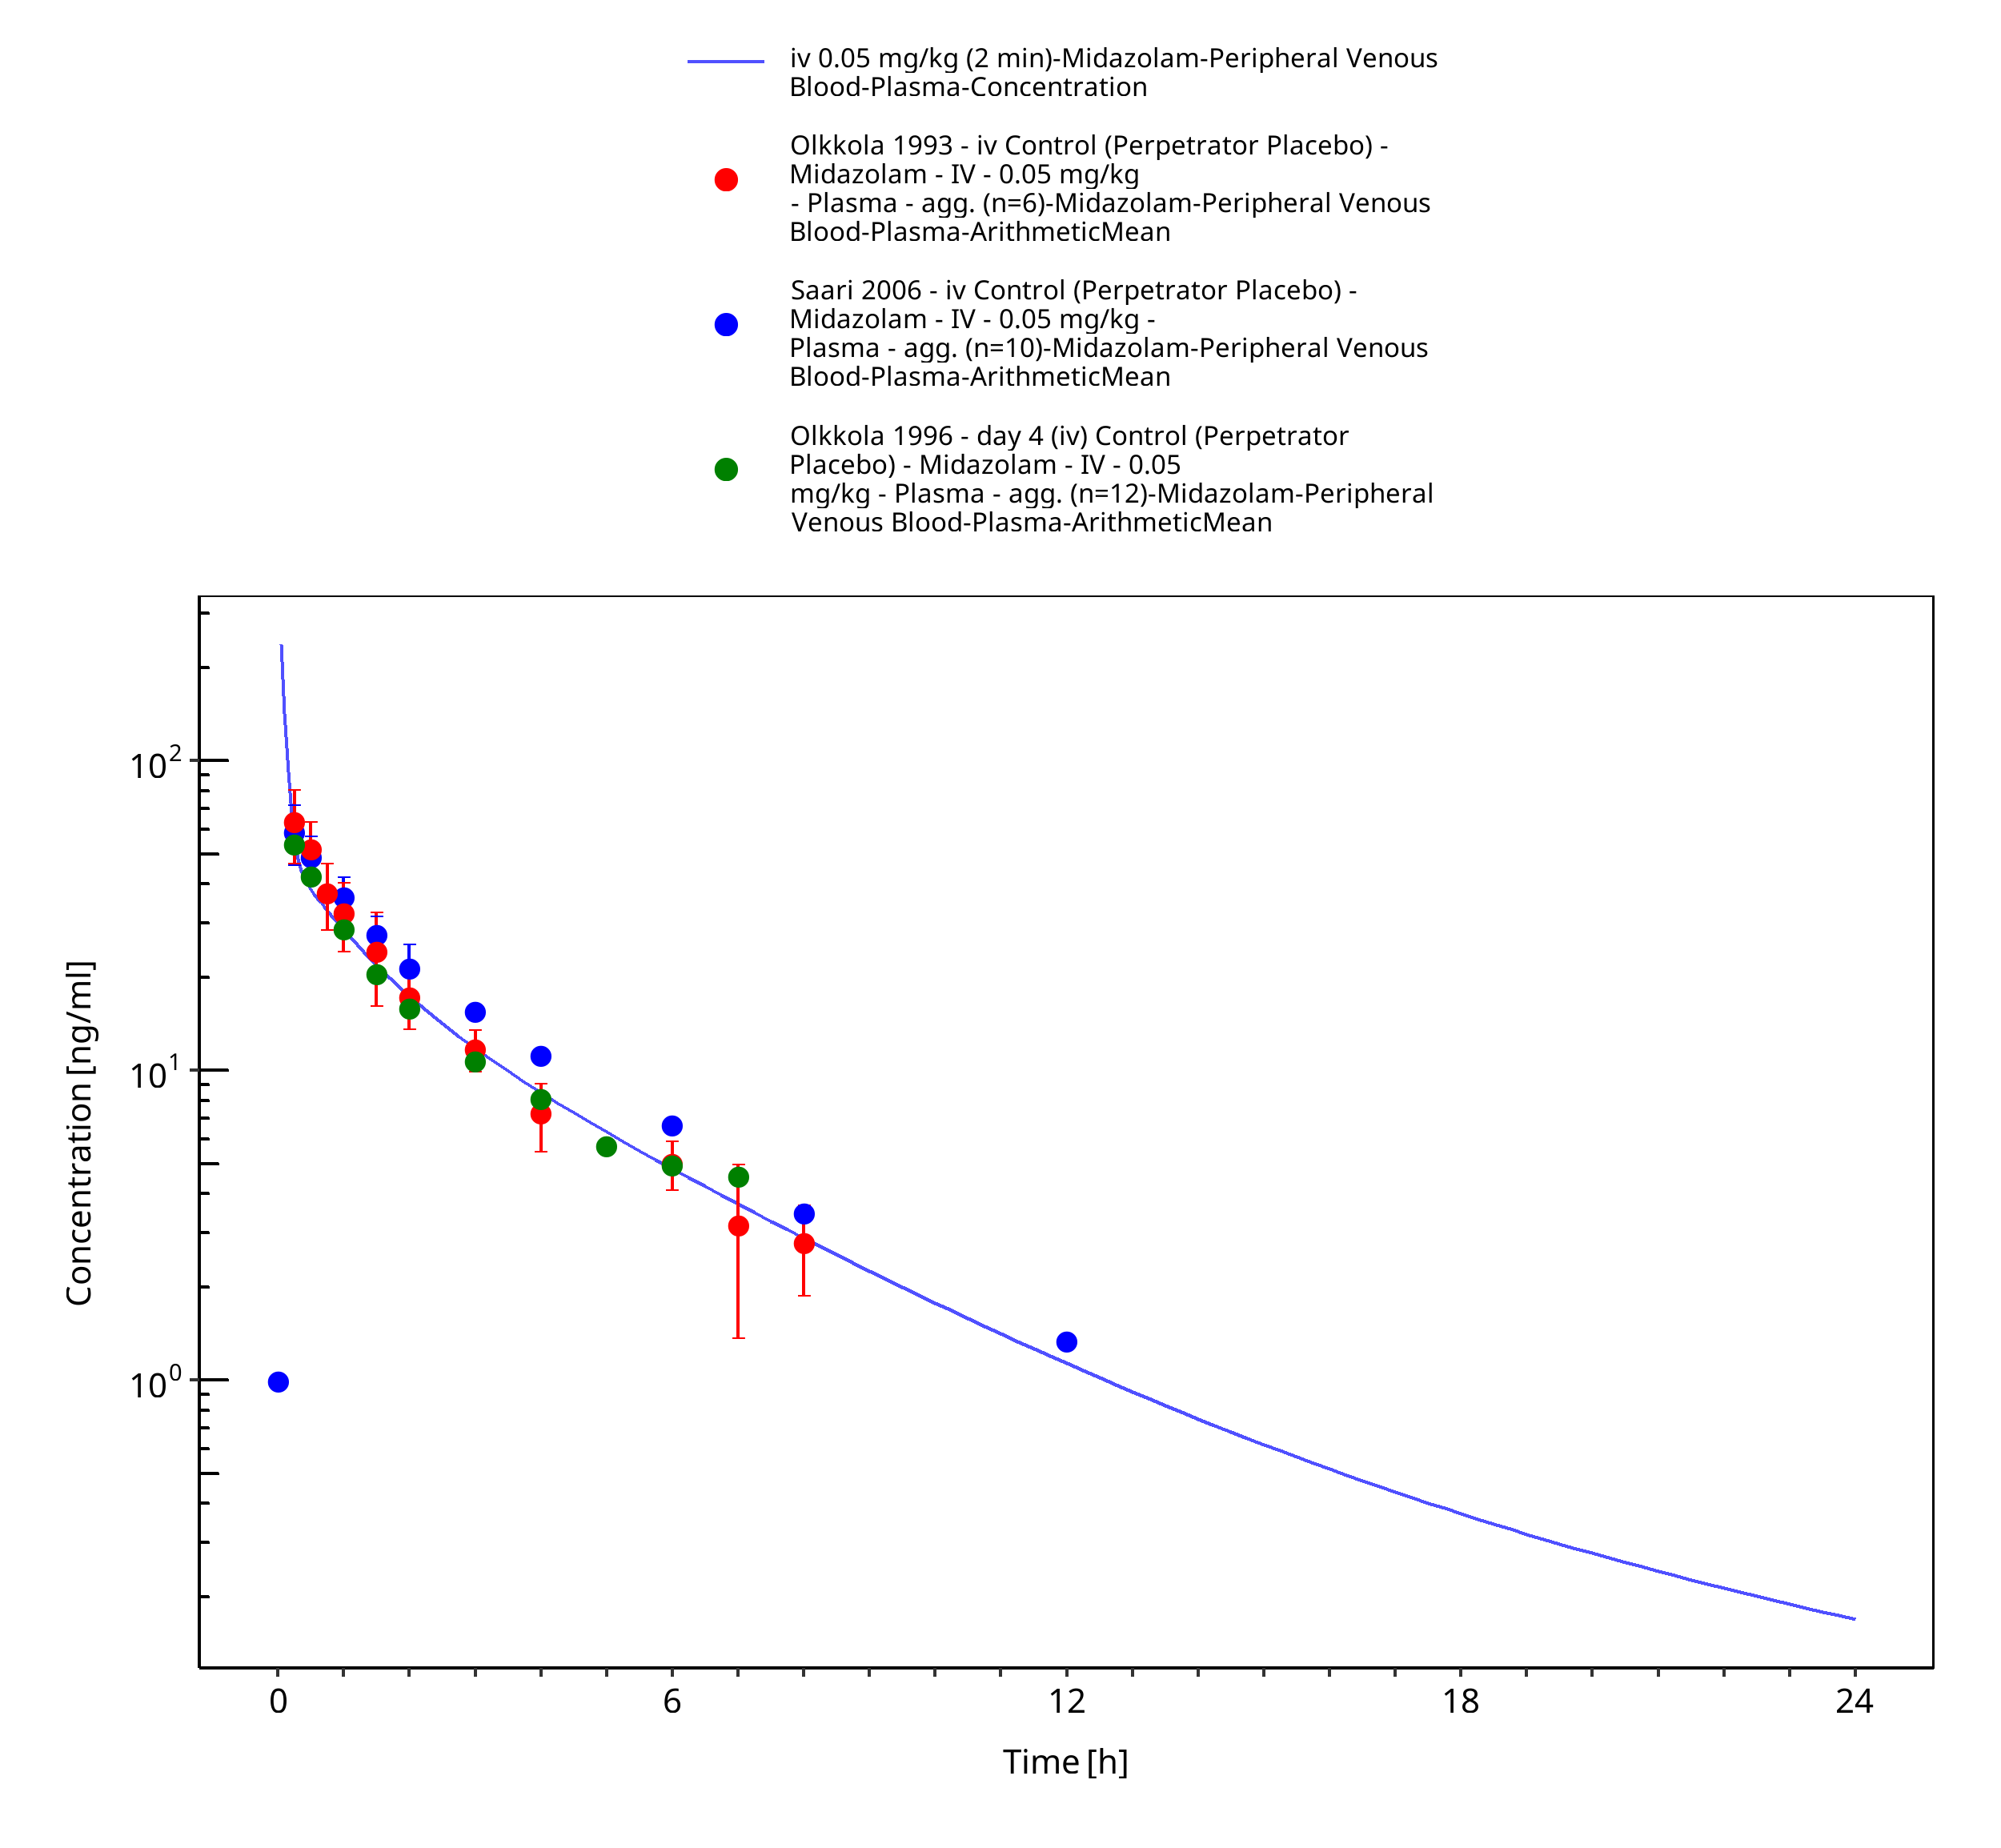
Figure 3-12: iv 0.05 mg/kg (2 min) - Plasma
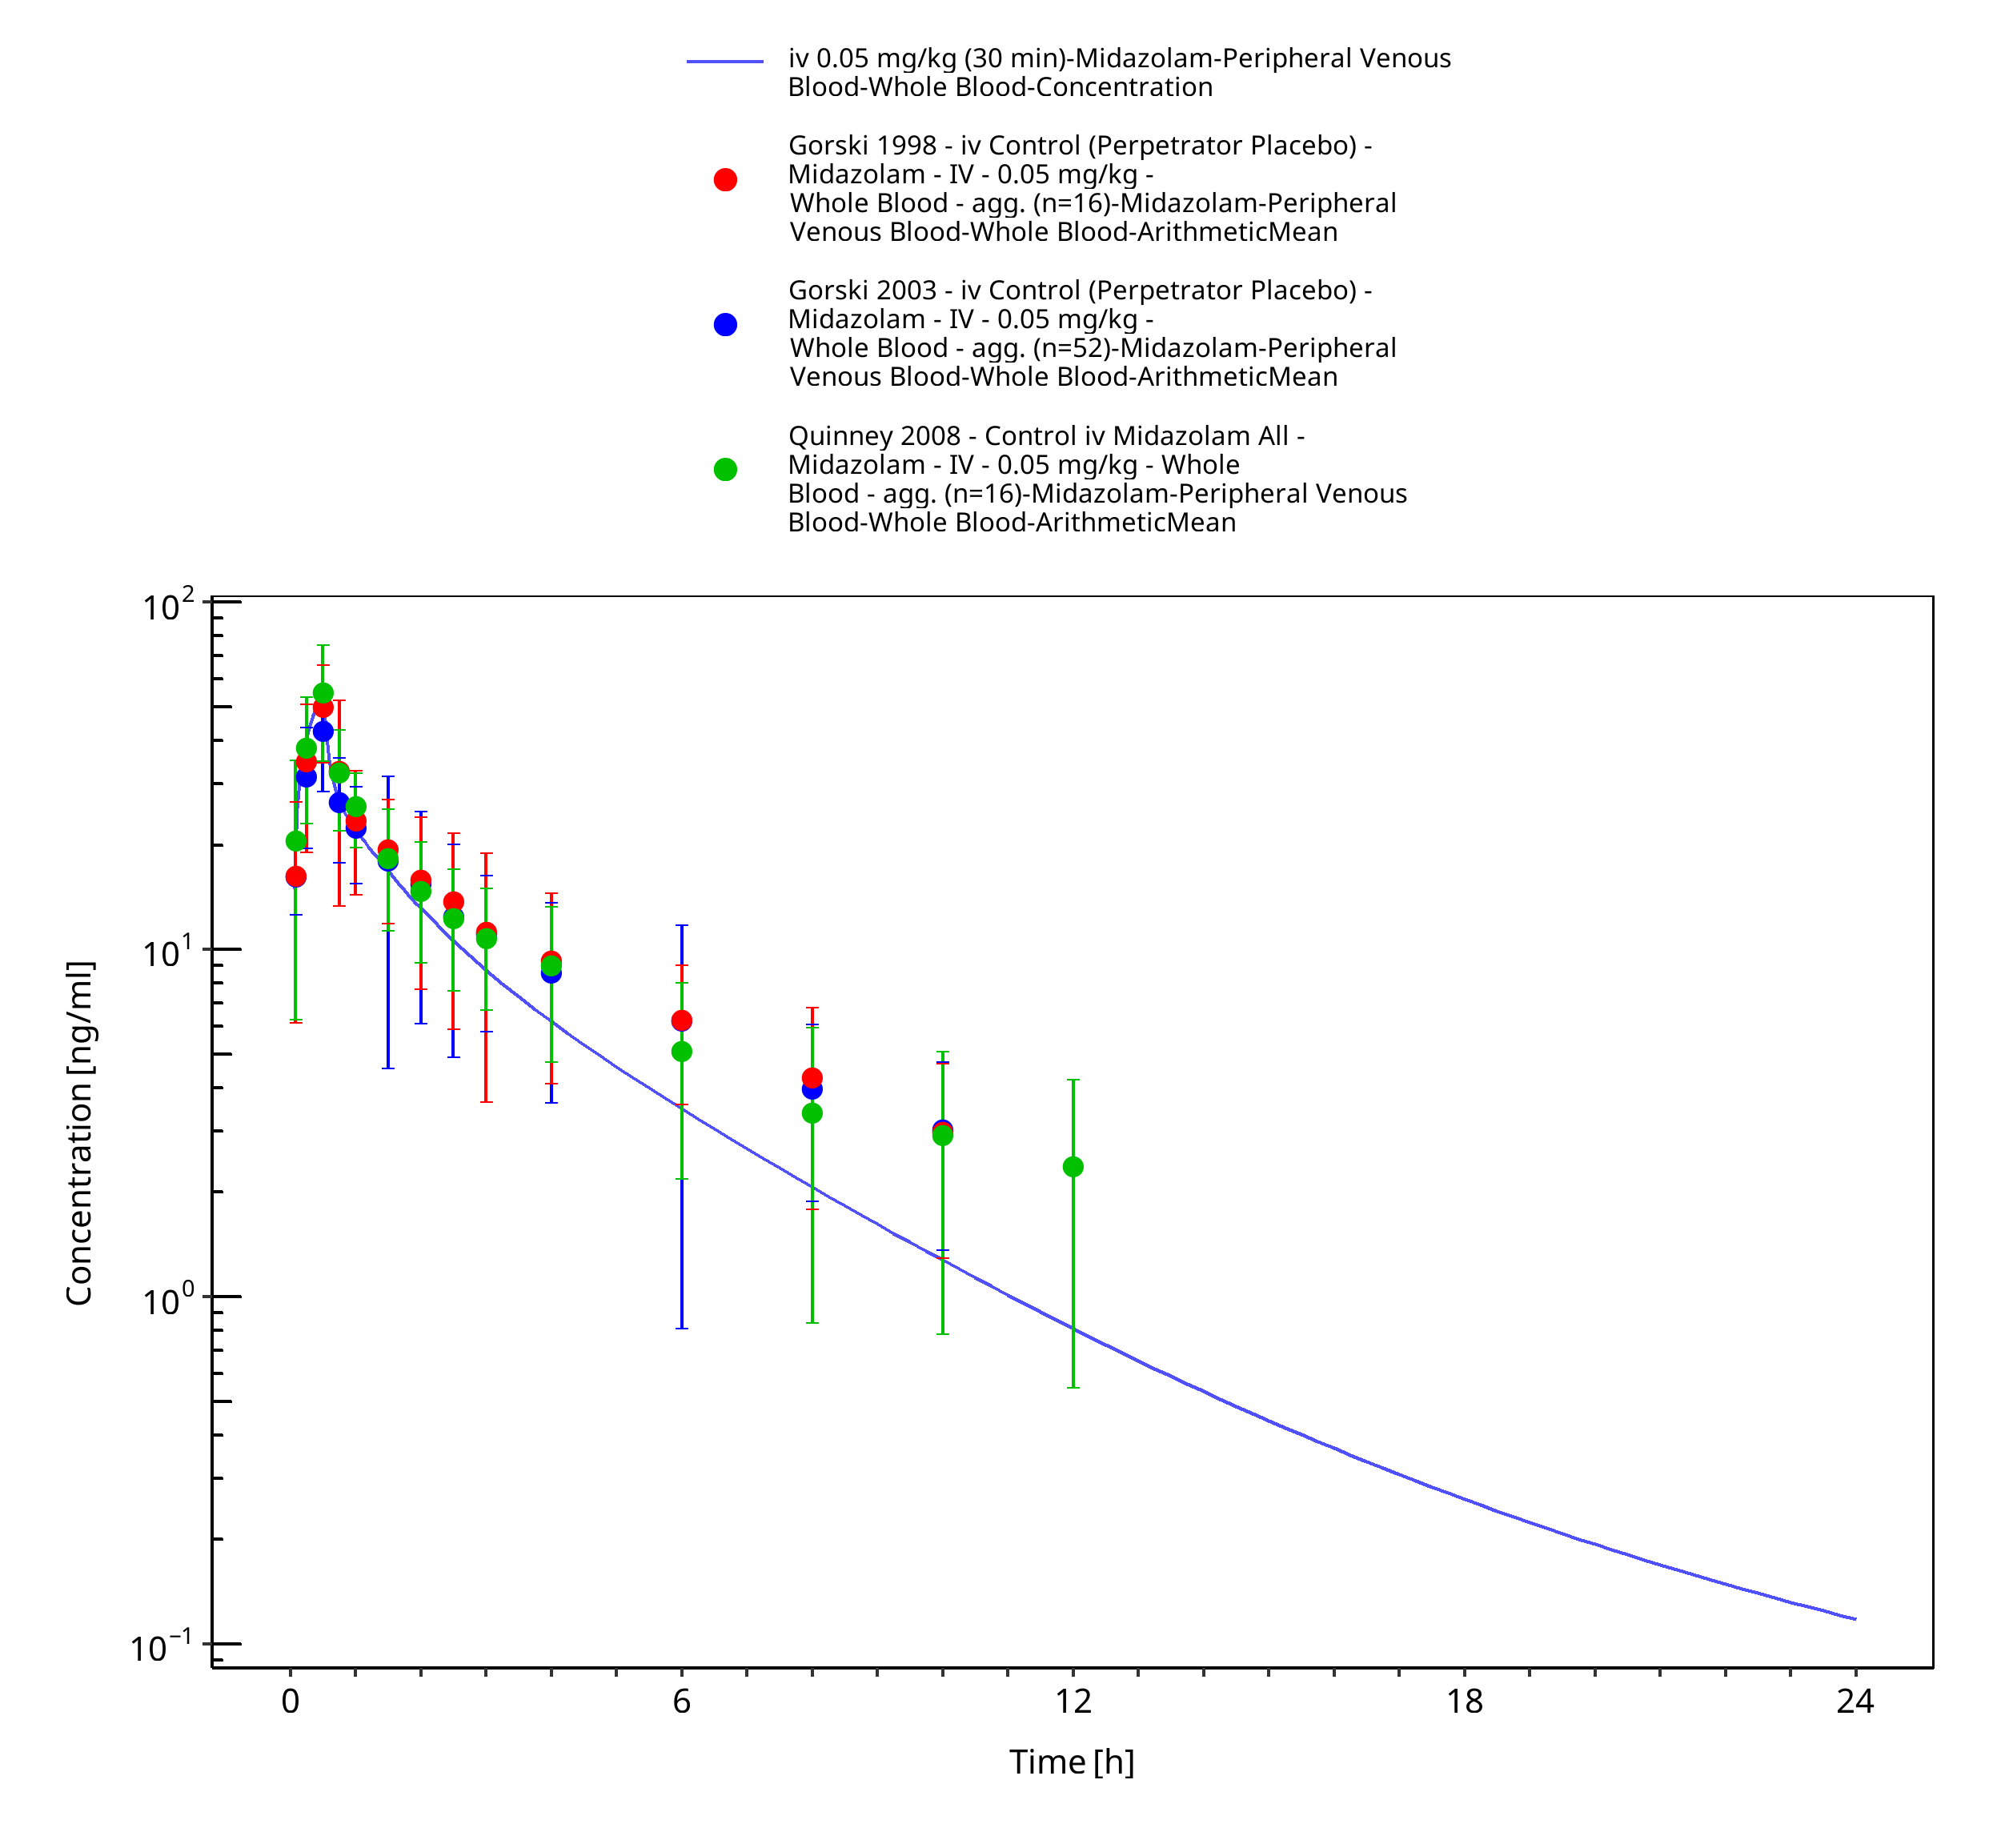
Figure 3-13: iv 0.05 mg/kg (30 min) - Whole blood
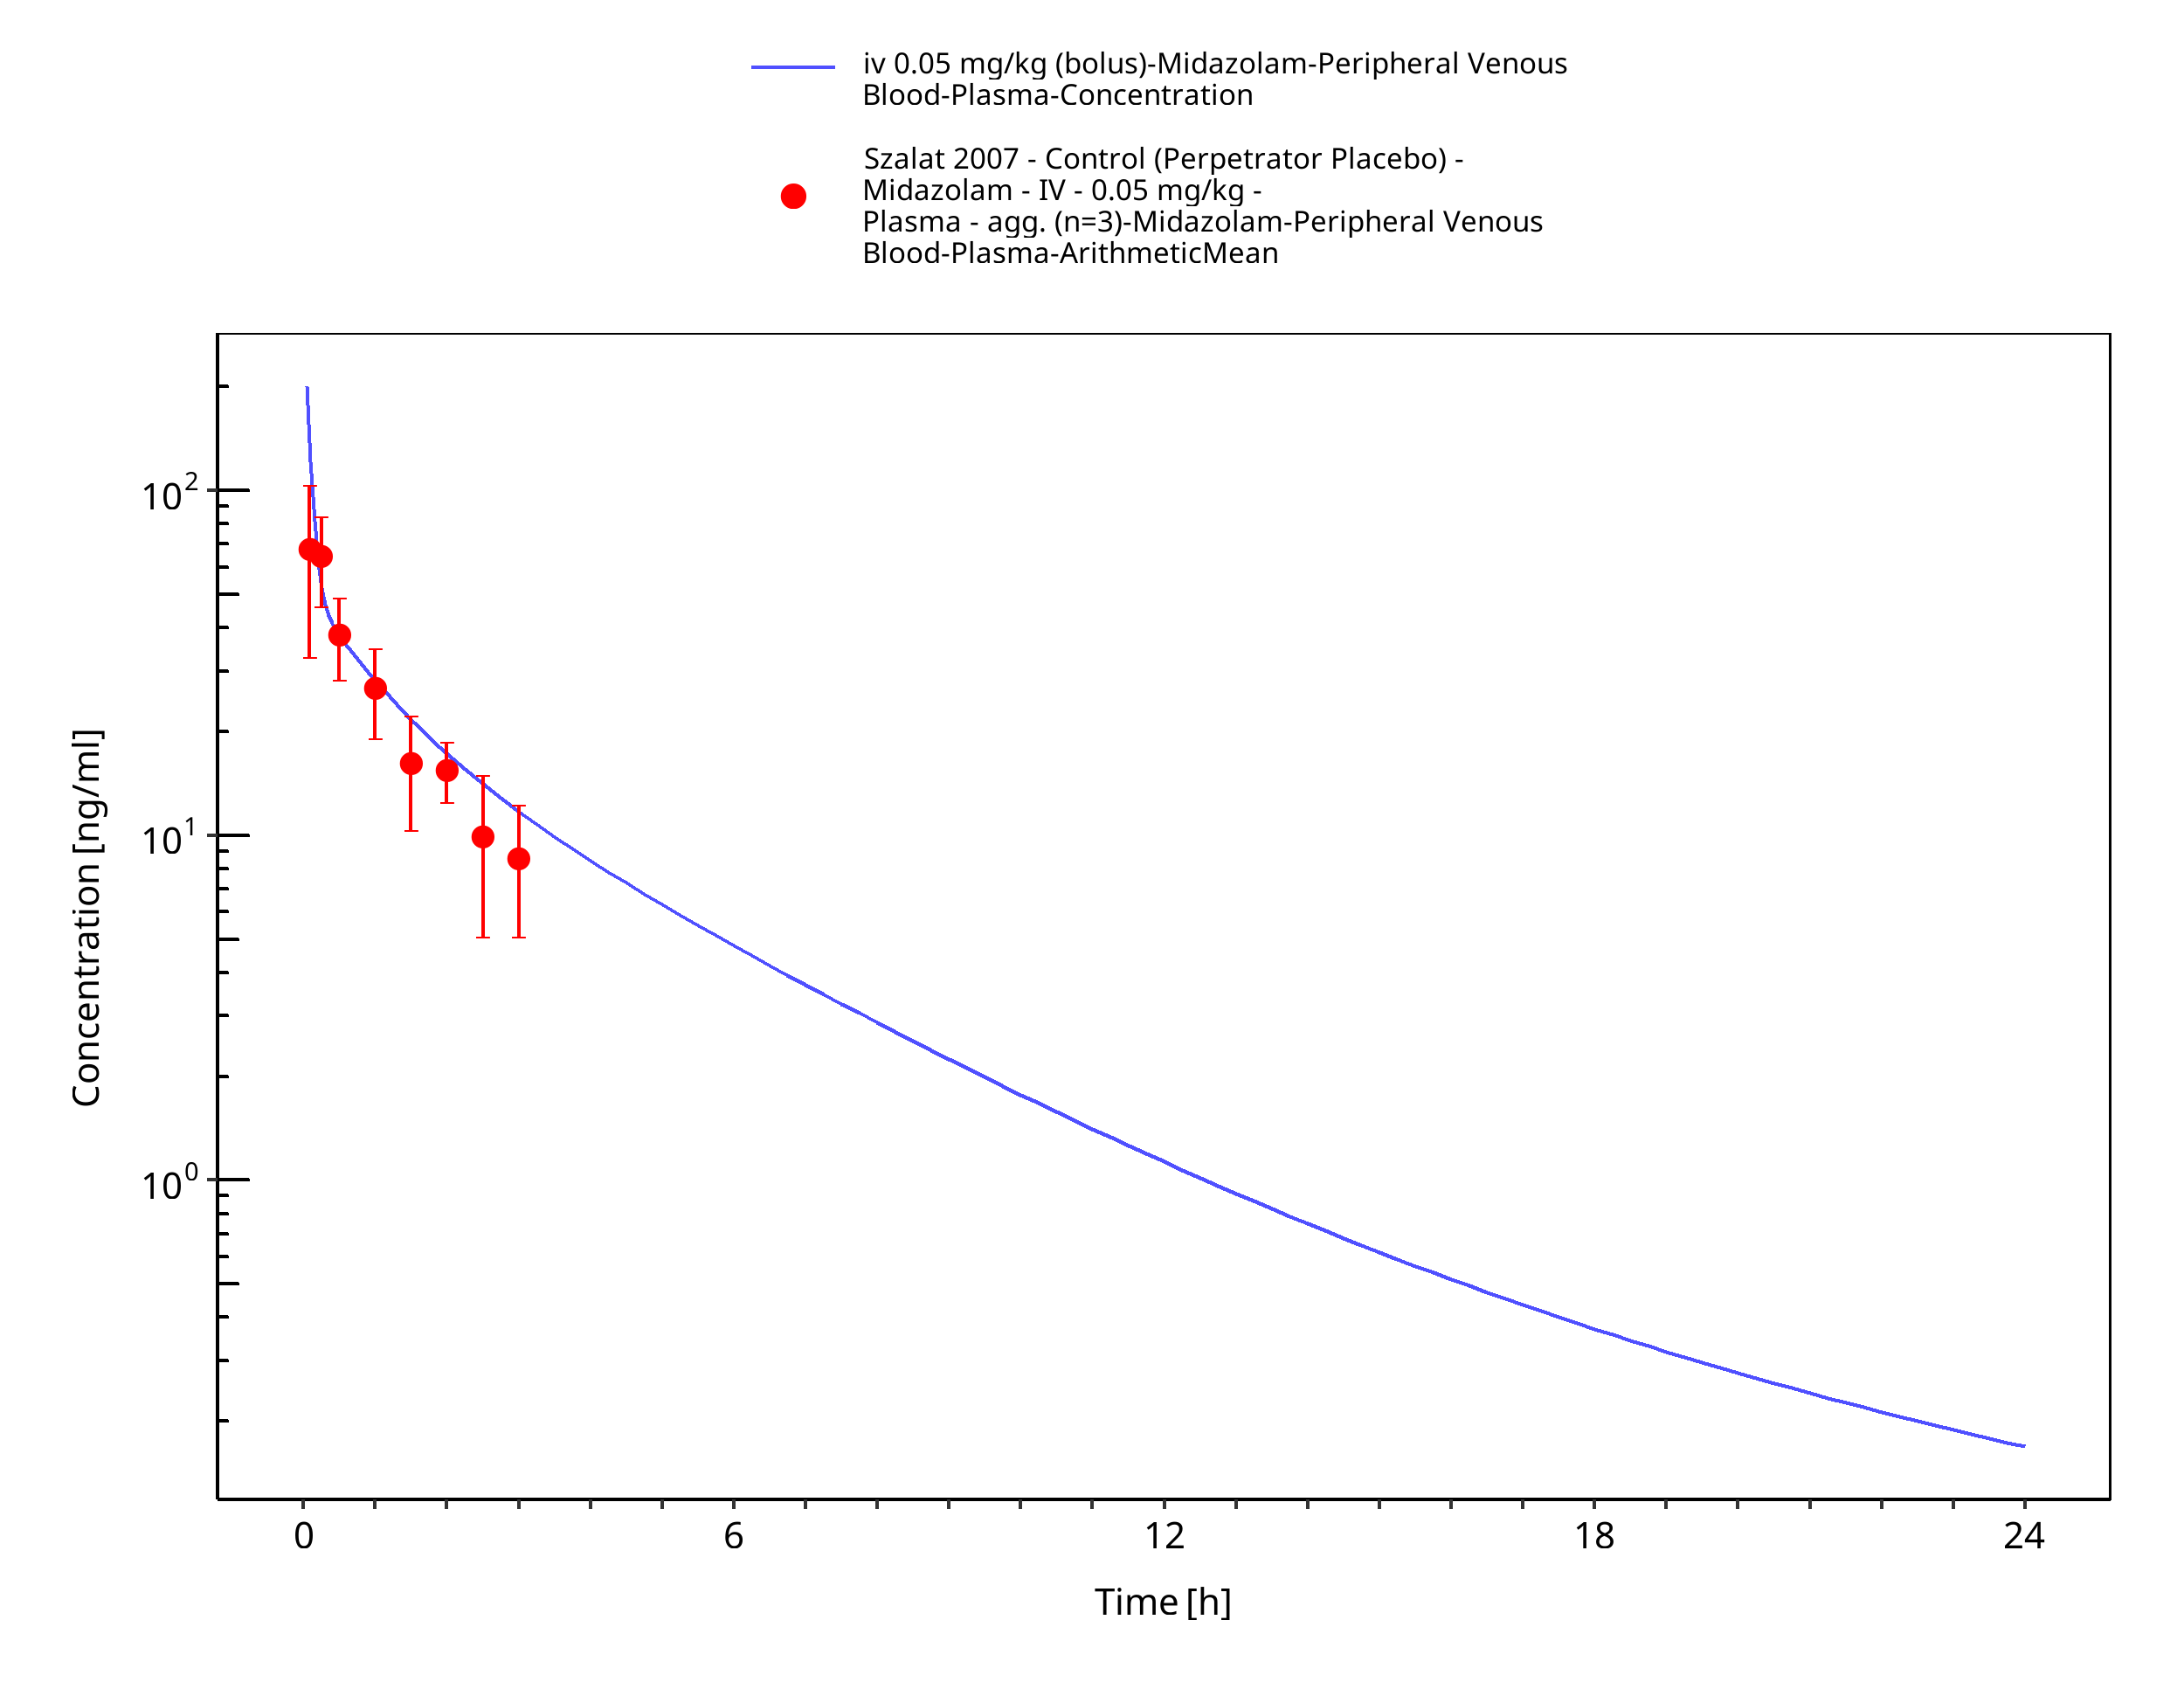
Figure 3-14: iv 0.05 mg/kg (bolus) - Plasma
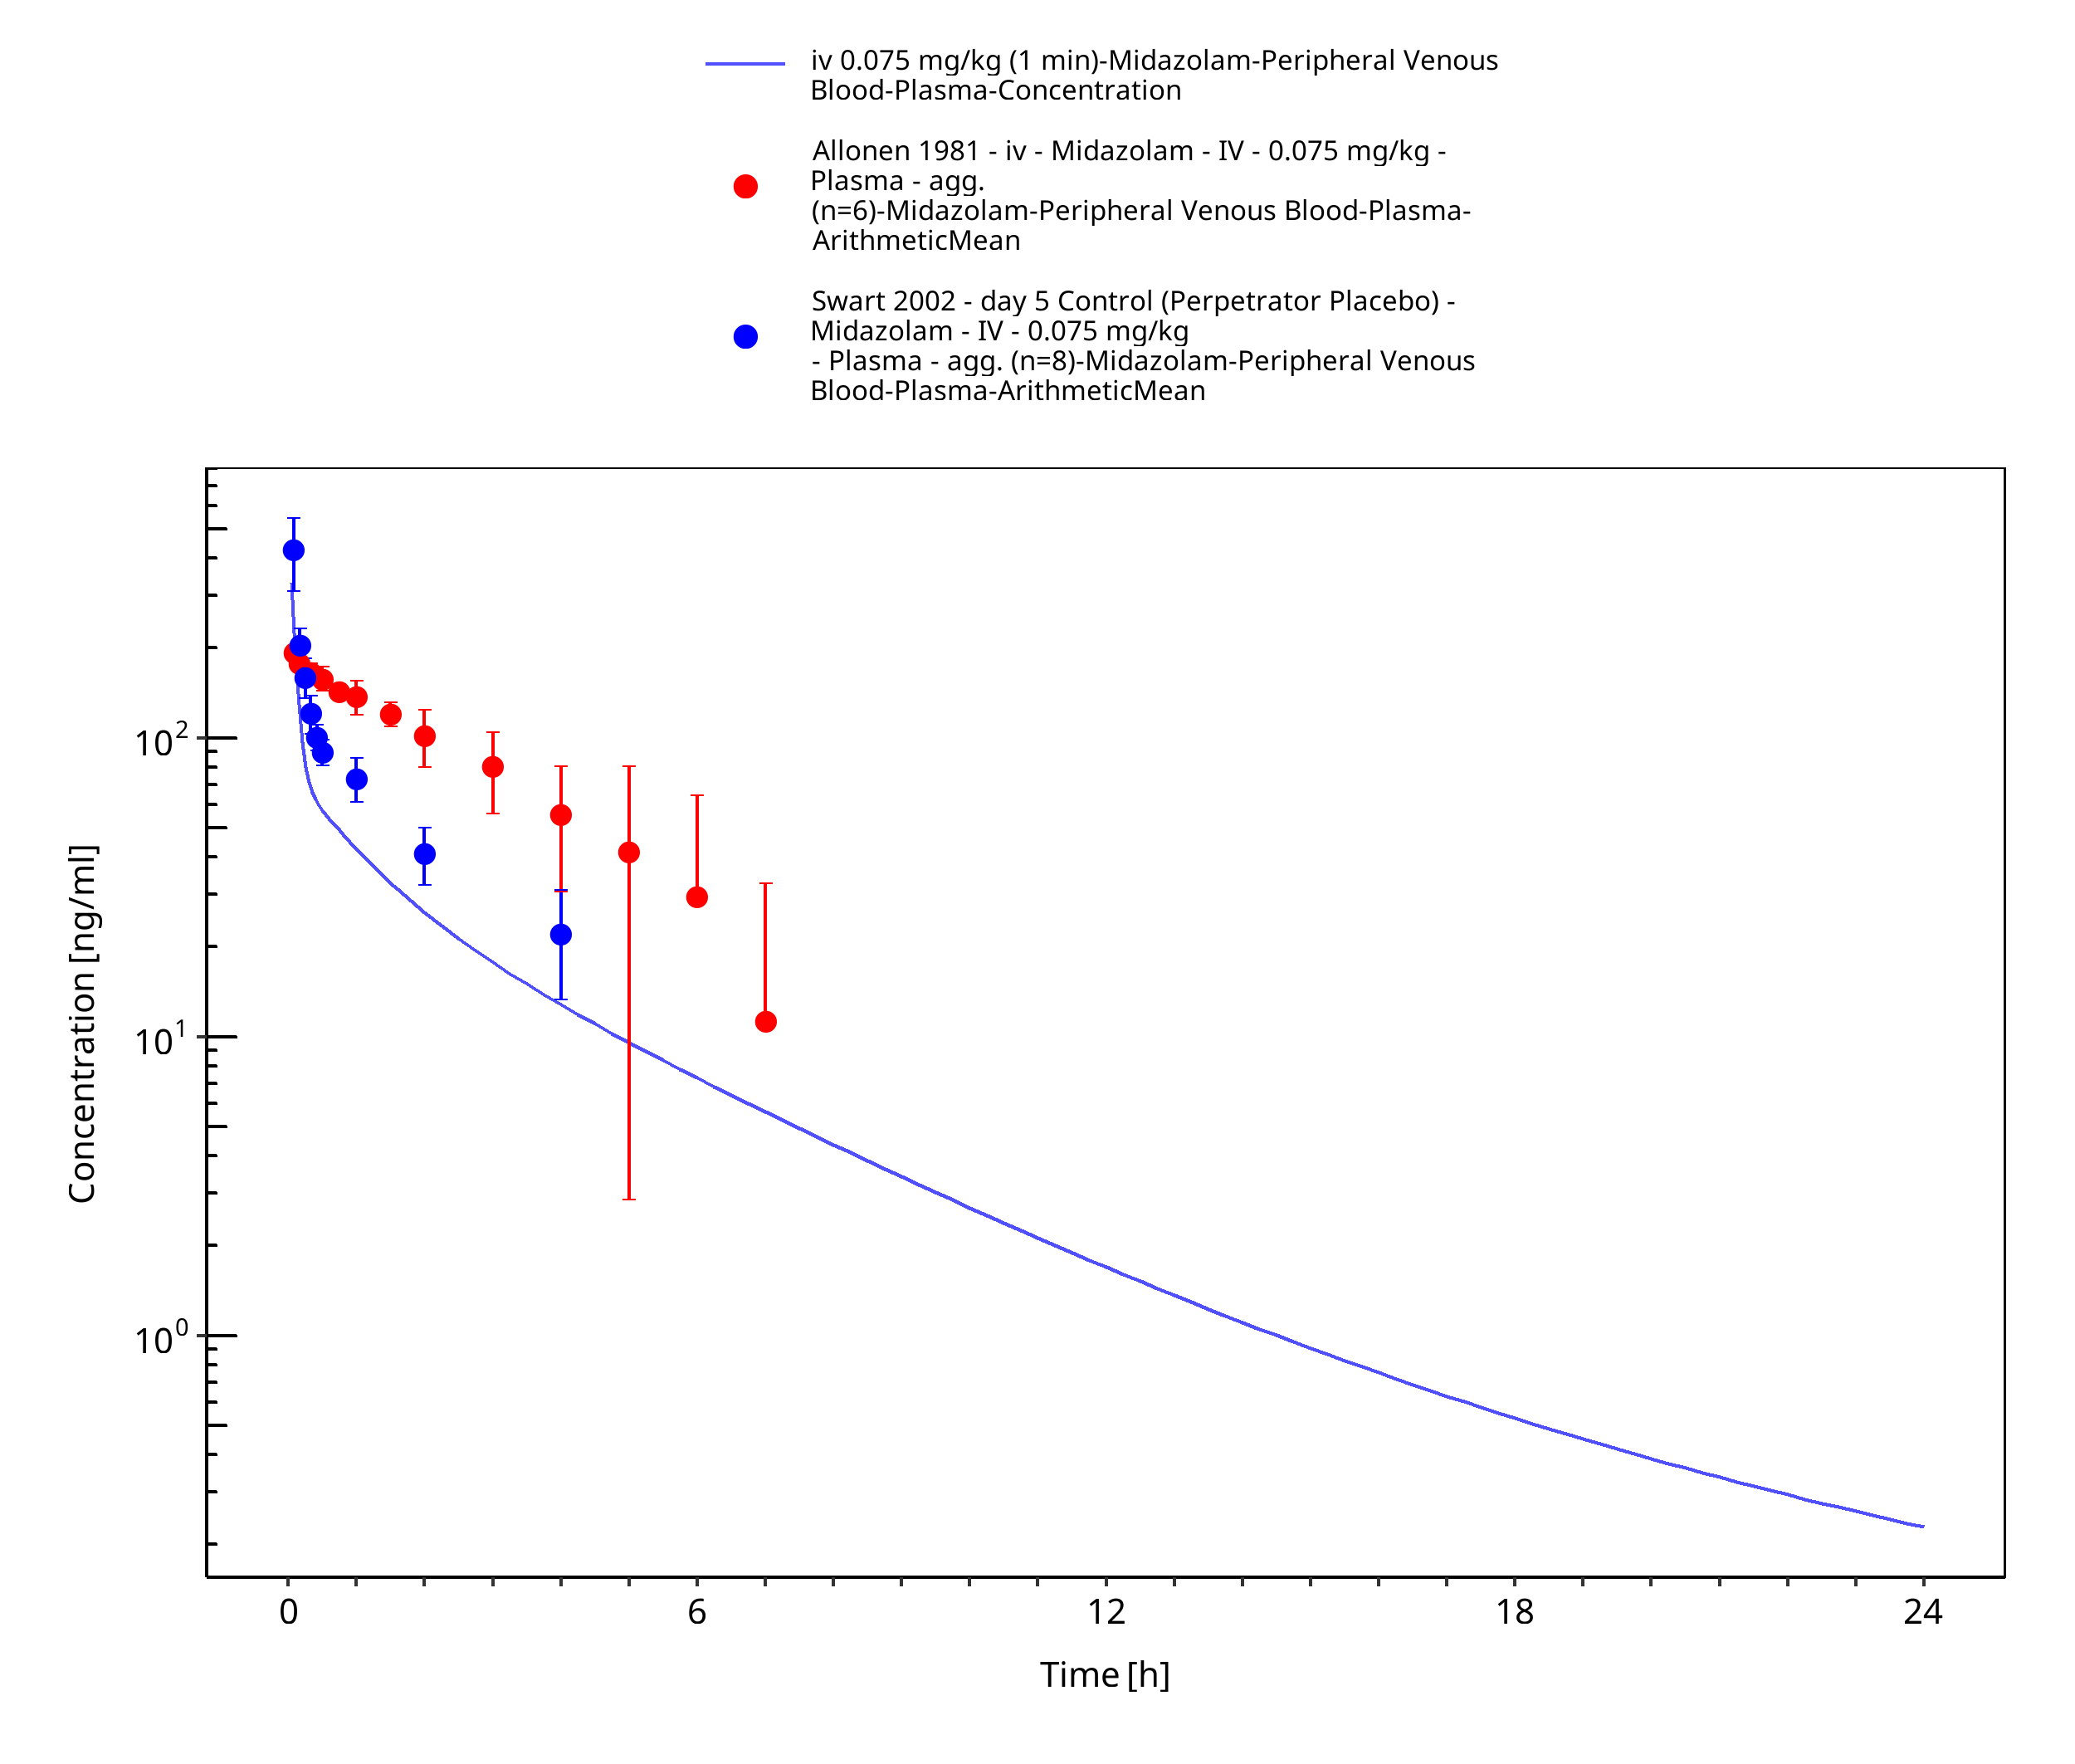
Figure 3-15: iv 0.075 mg/kg (1 min) - Plasma
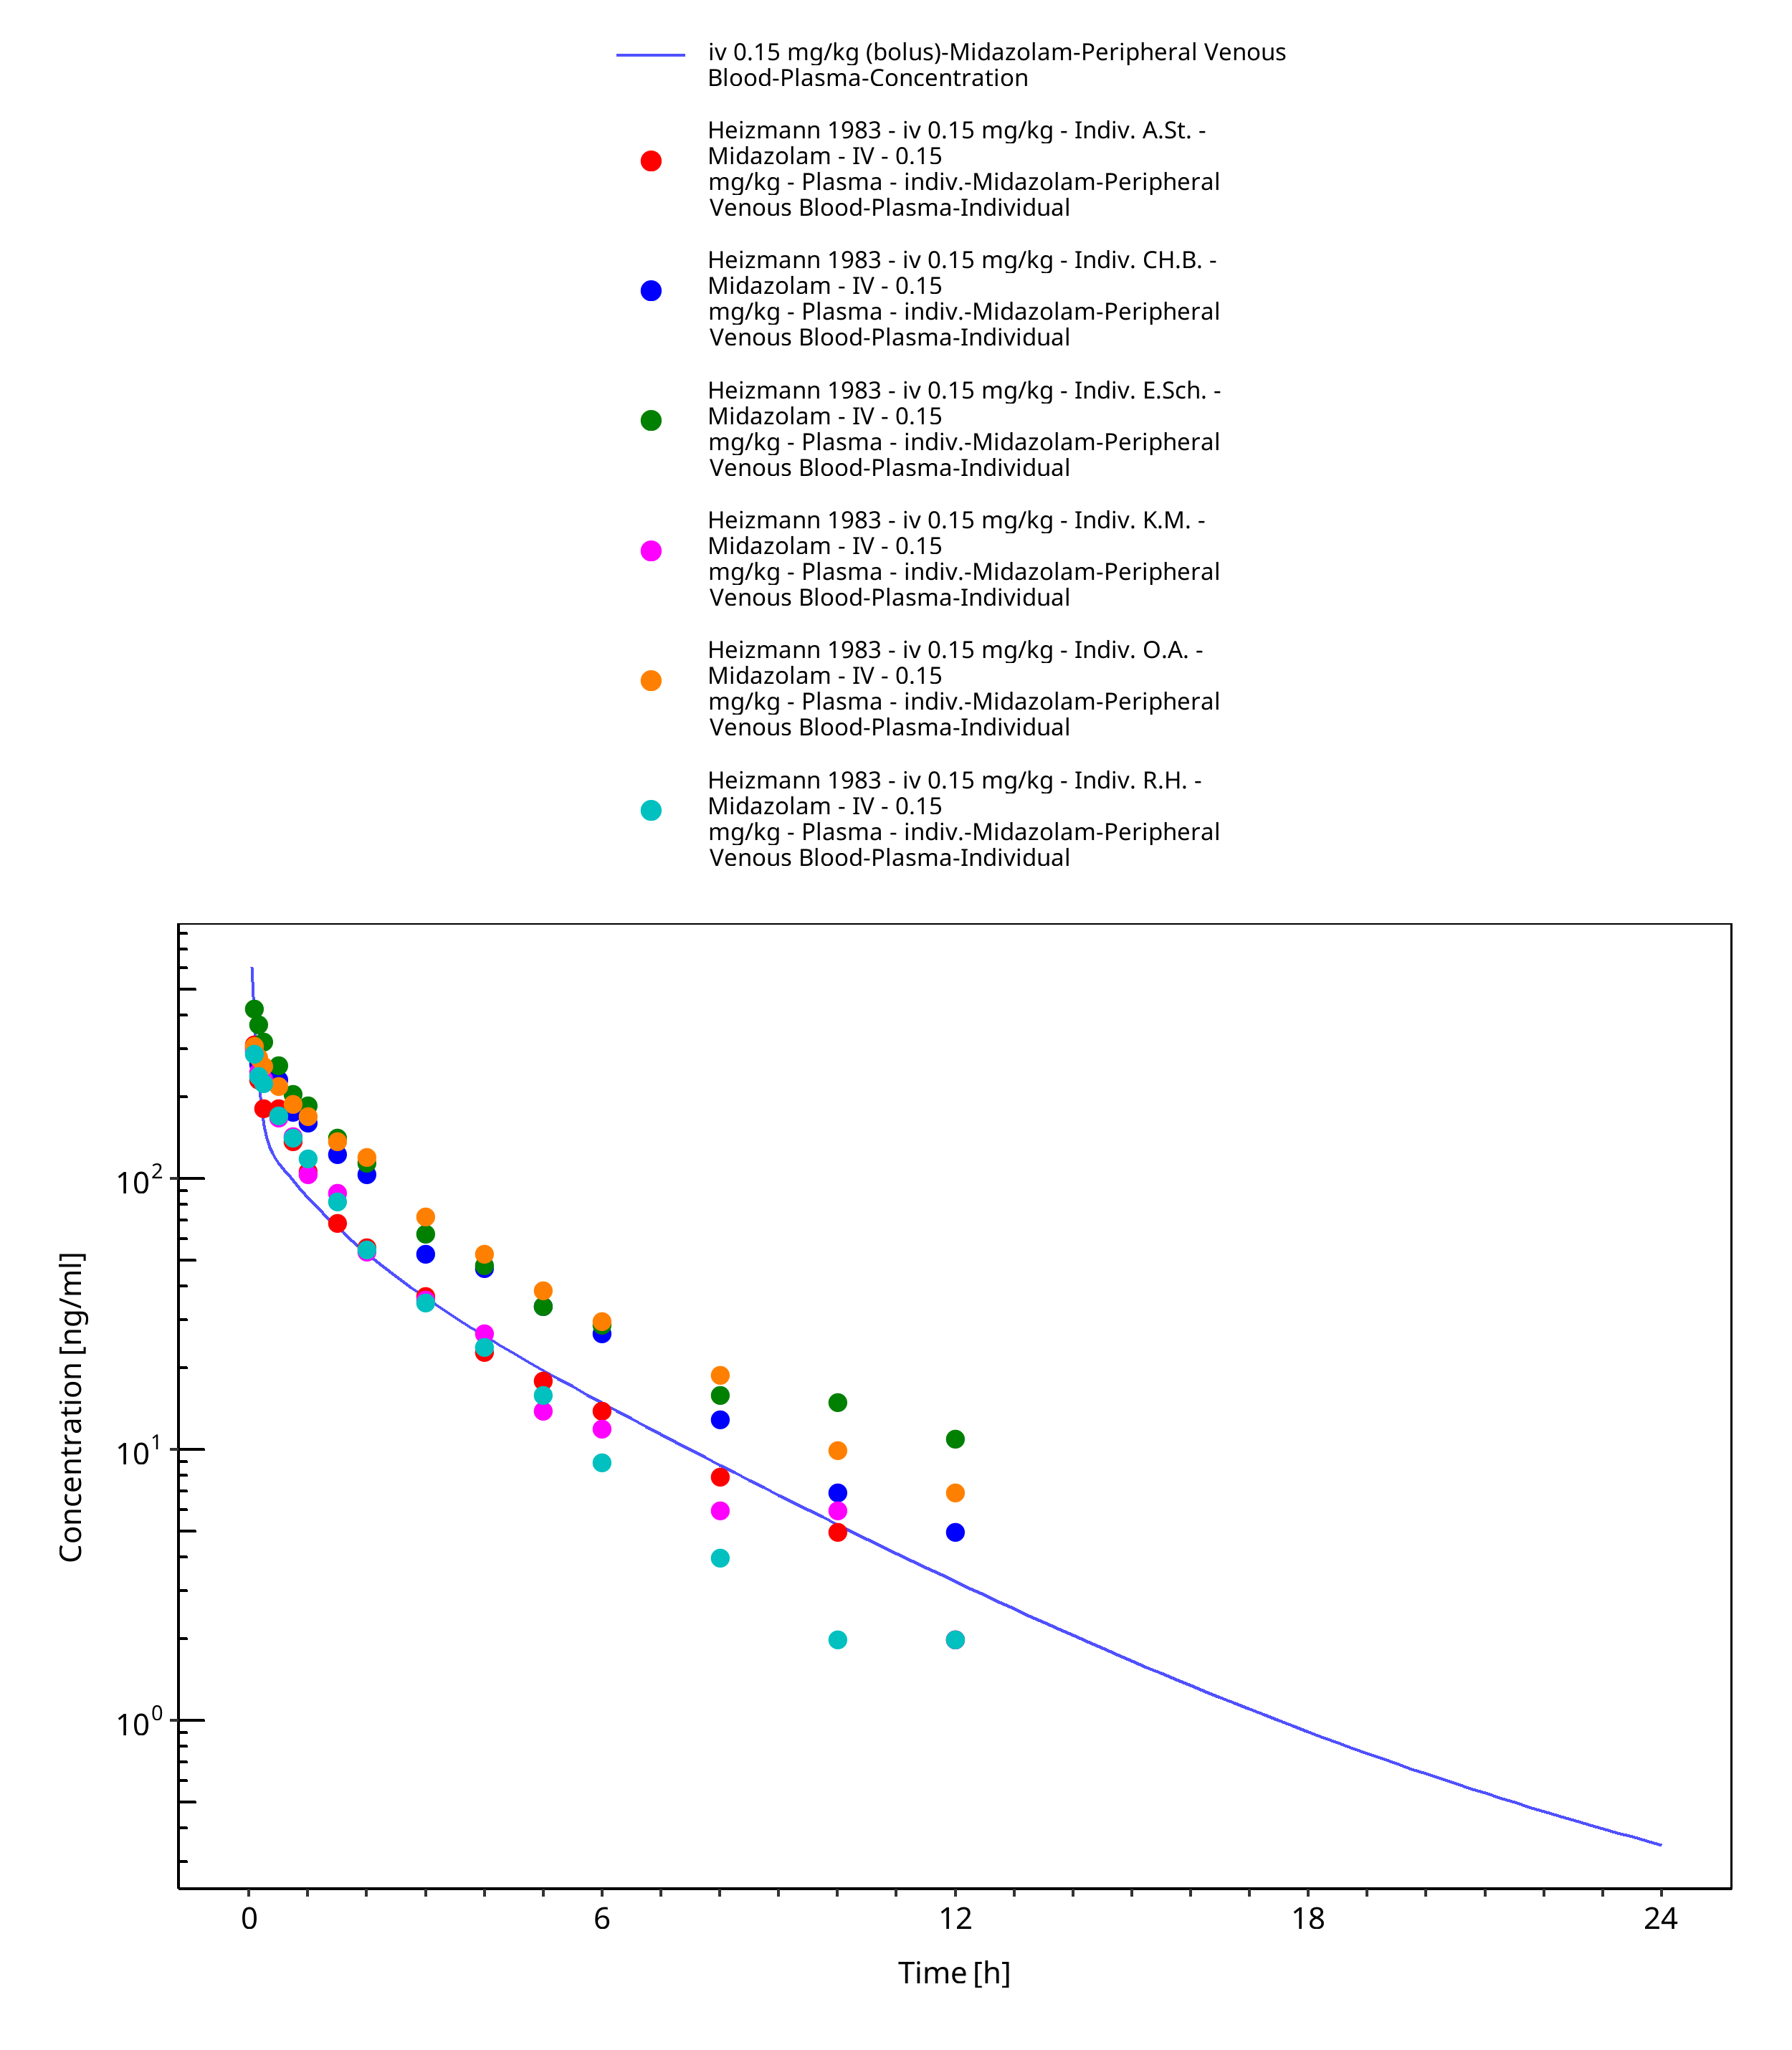
Figure 3-16: iv 0.15 mg/kg (bolus) - Plasma
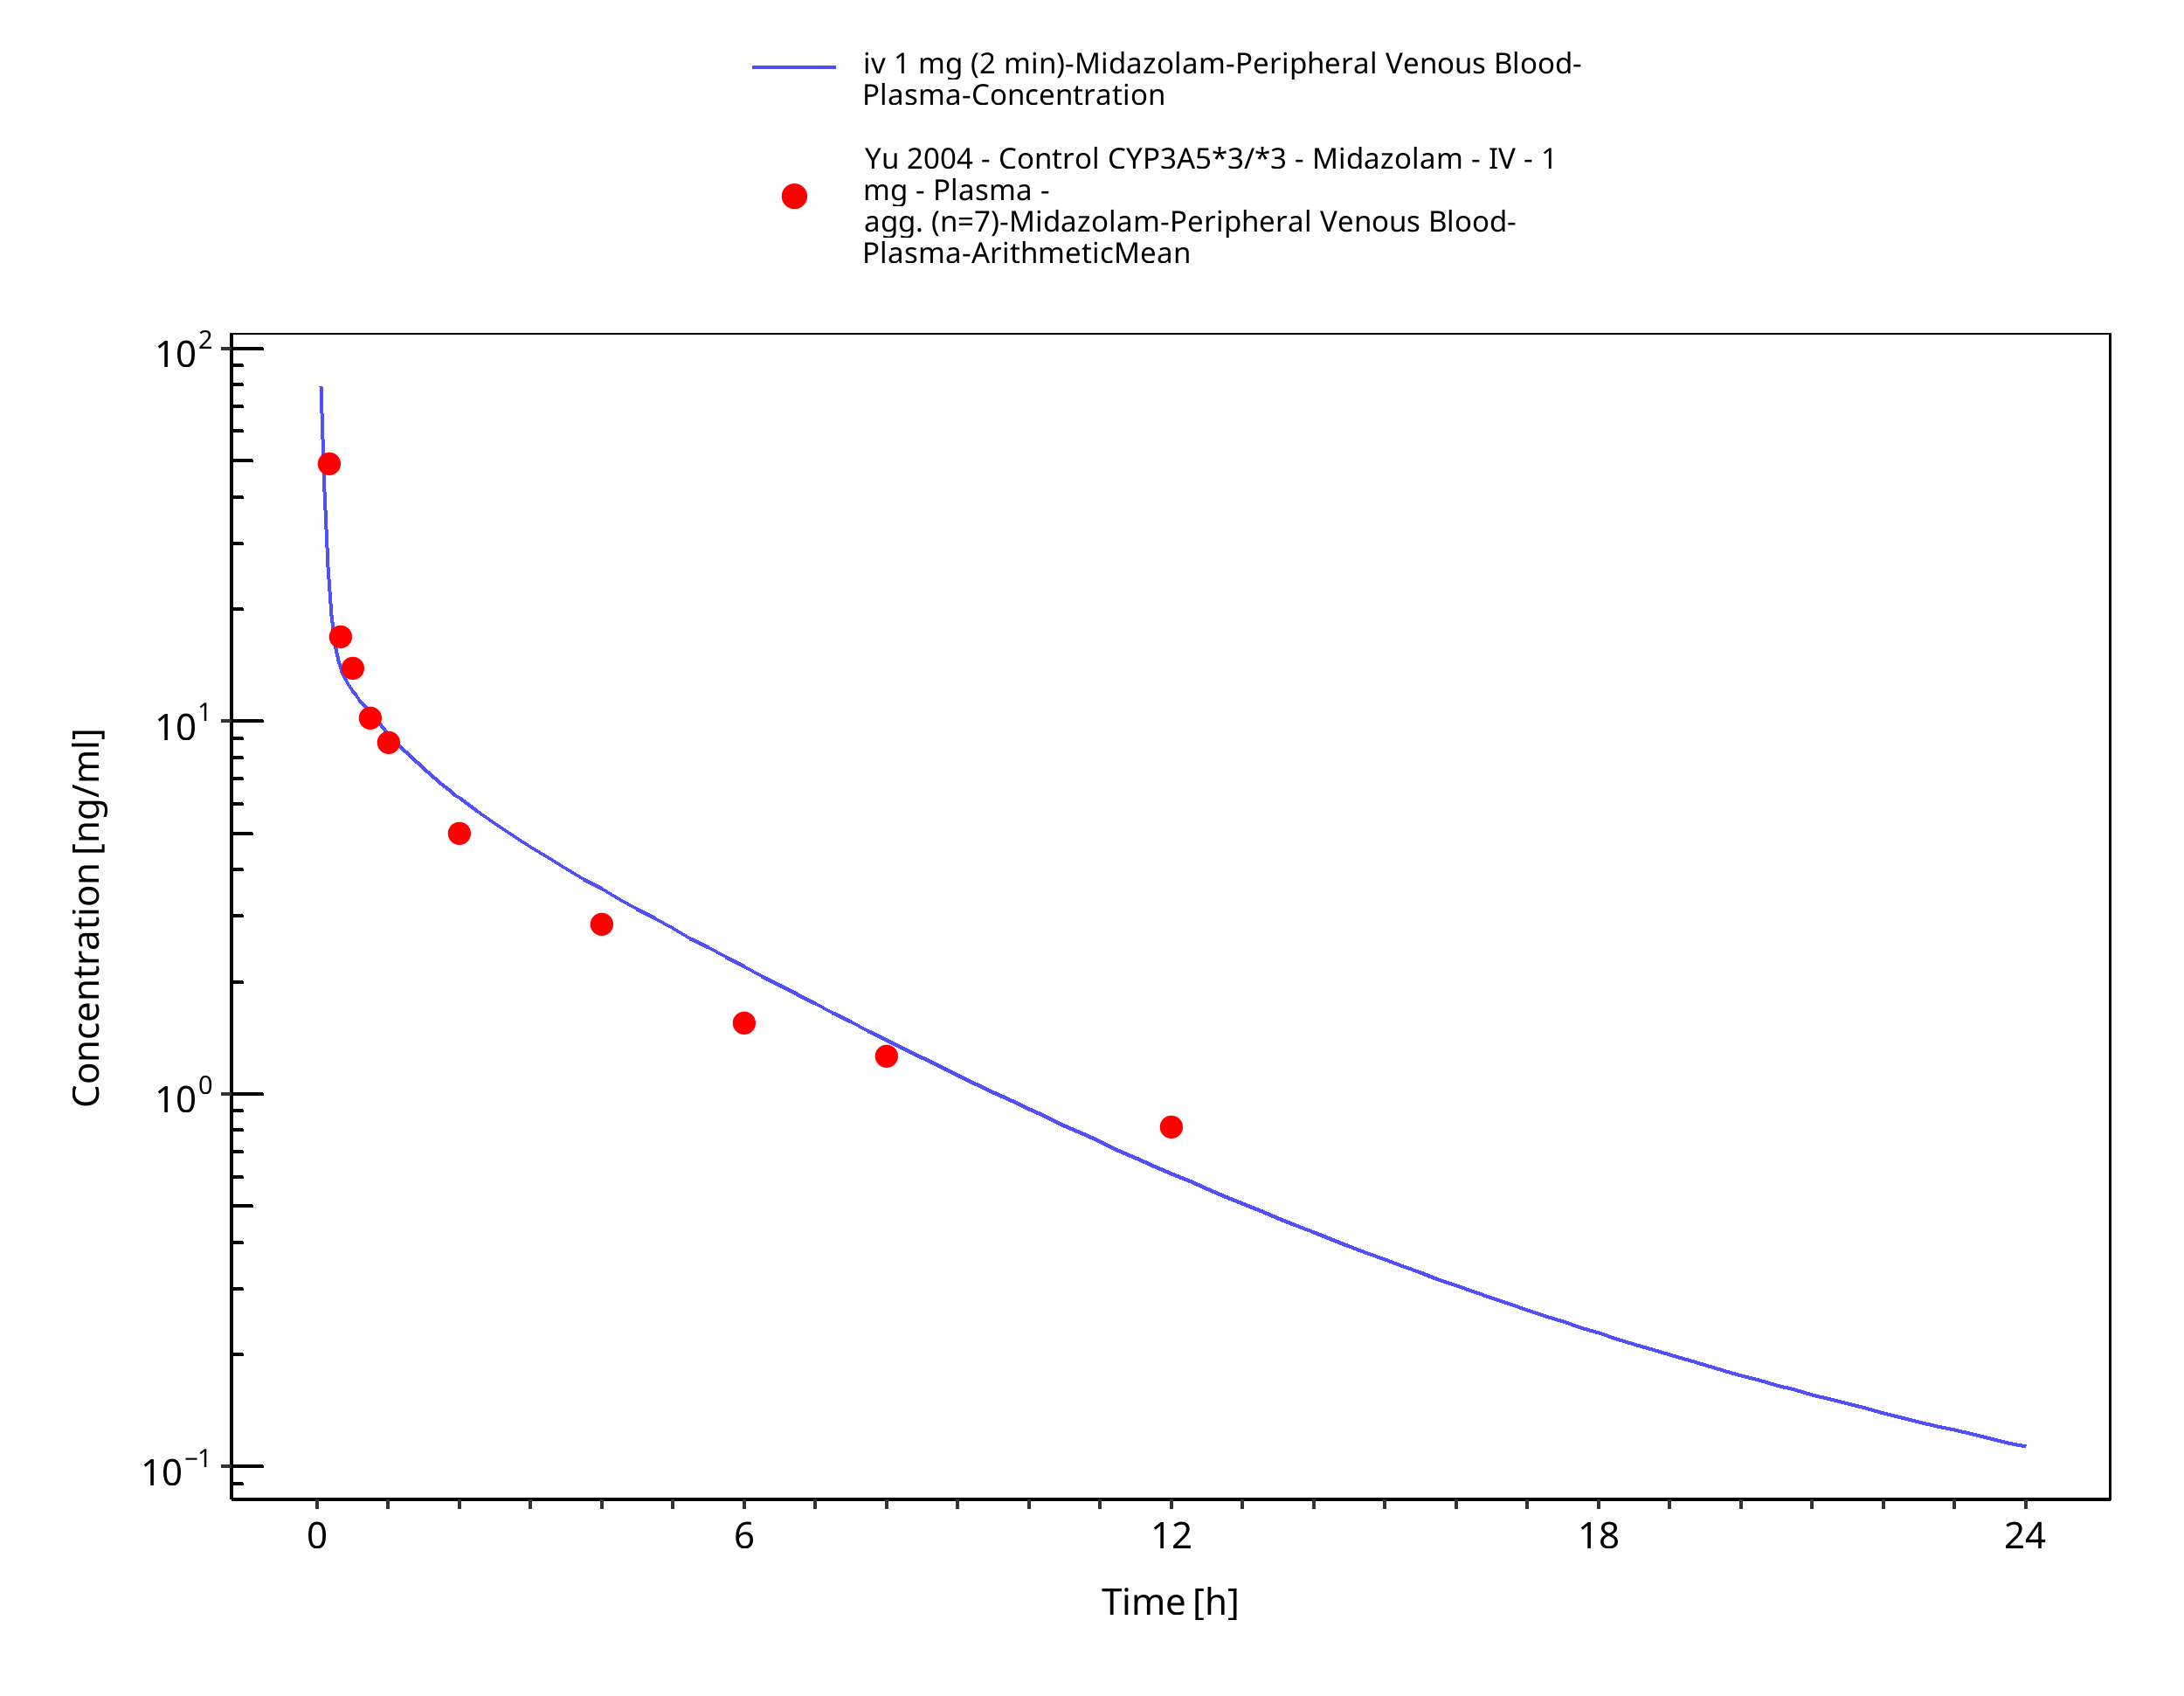
Figure 3-17: iv 1 mg (2 min) [Korean] - Plasma
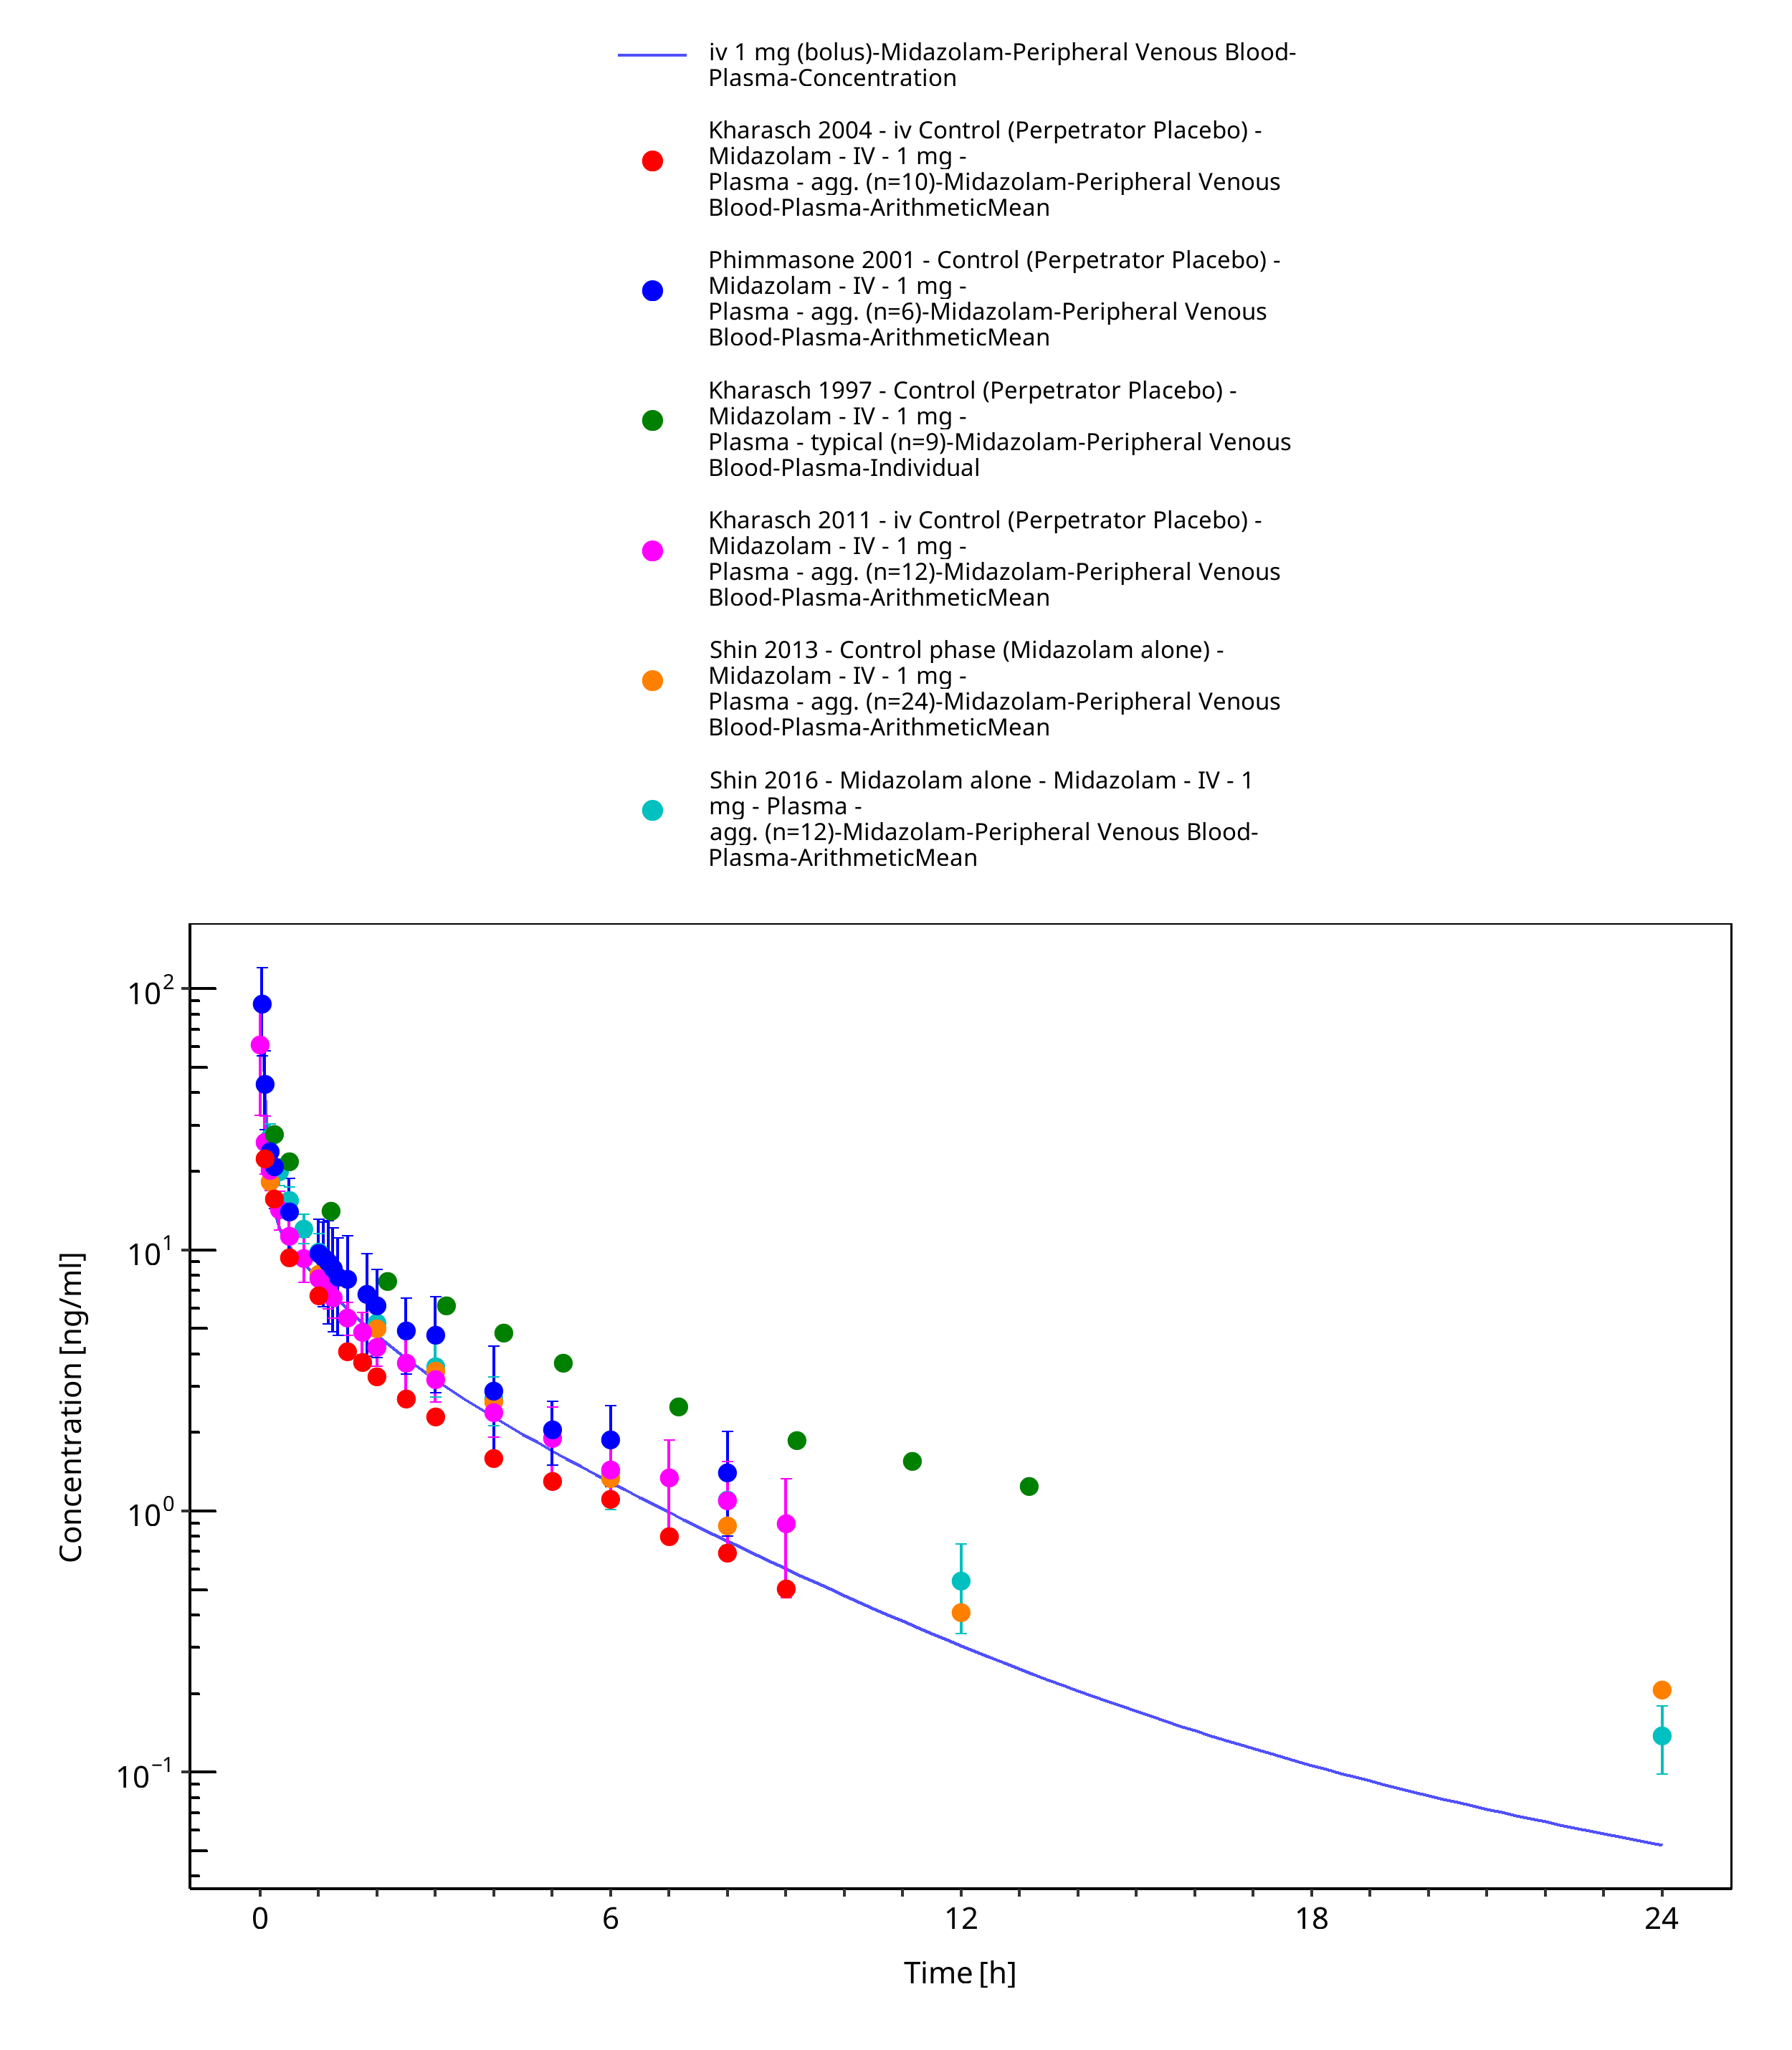
Figure 3-18: iv 1 mg (bolus) - Plasma
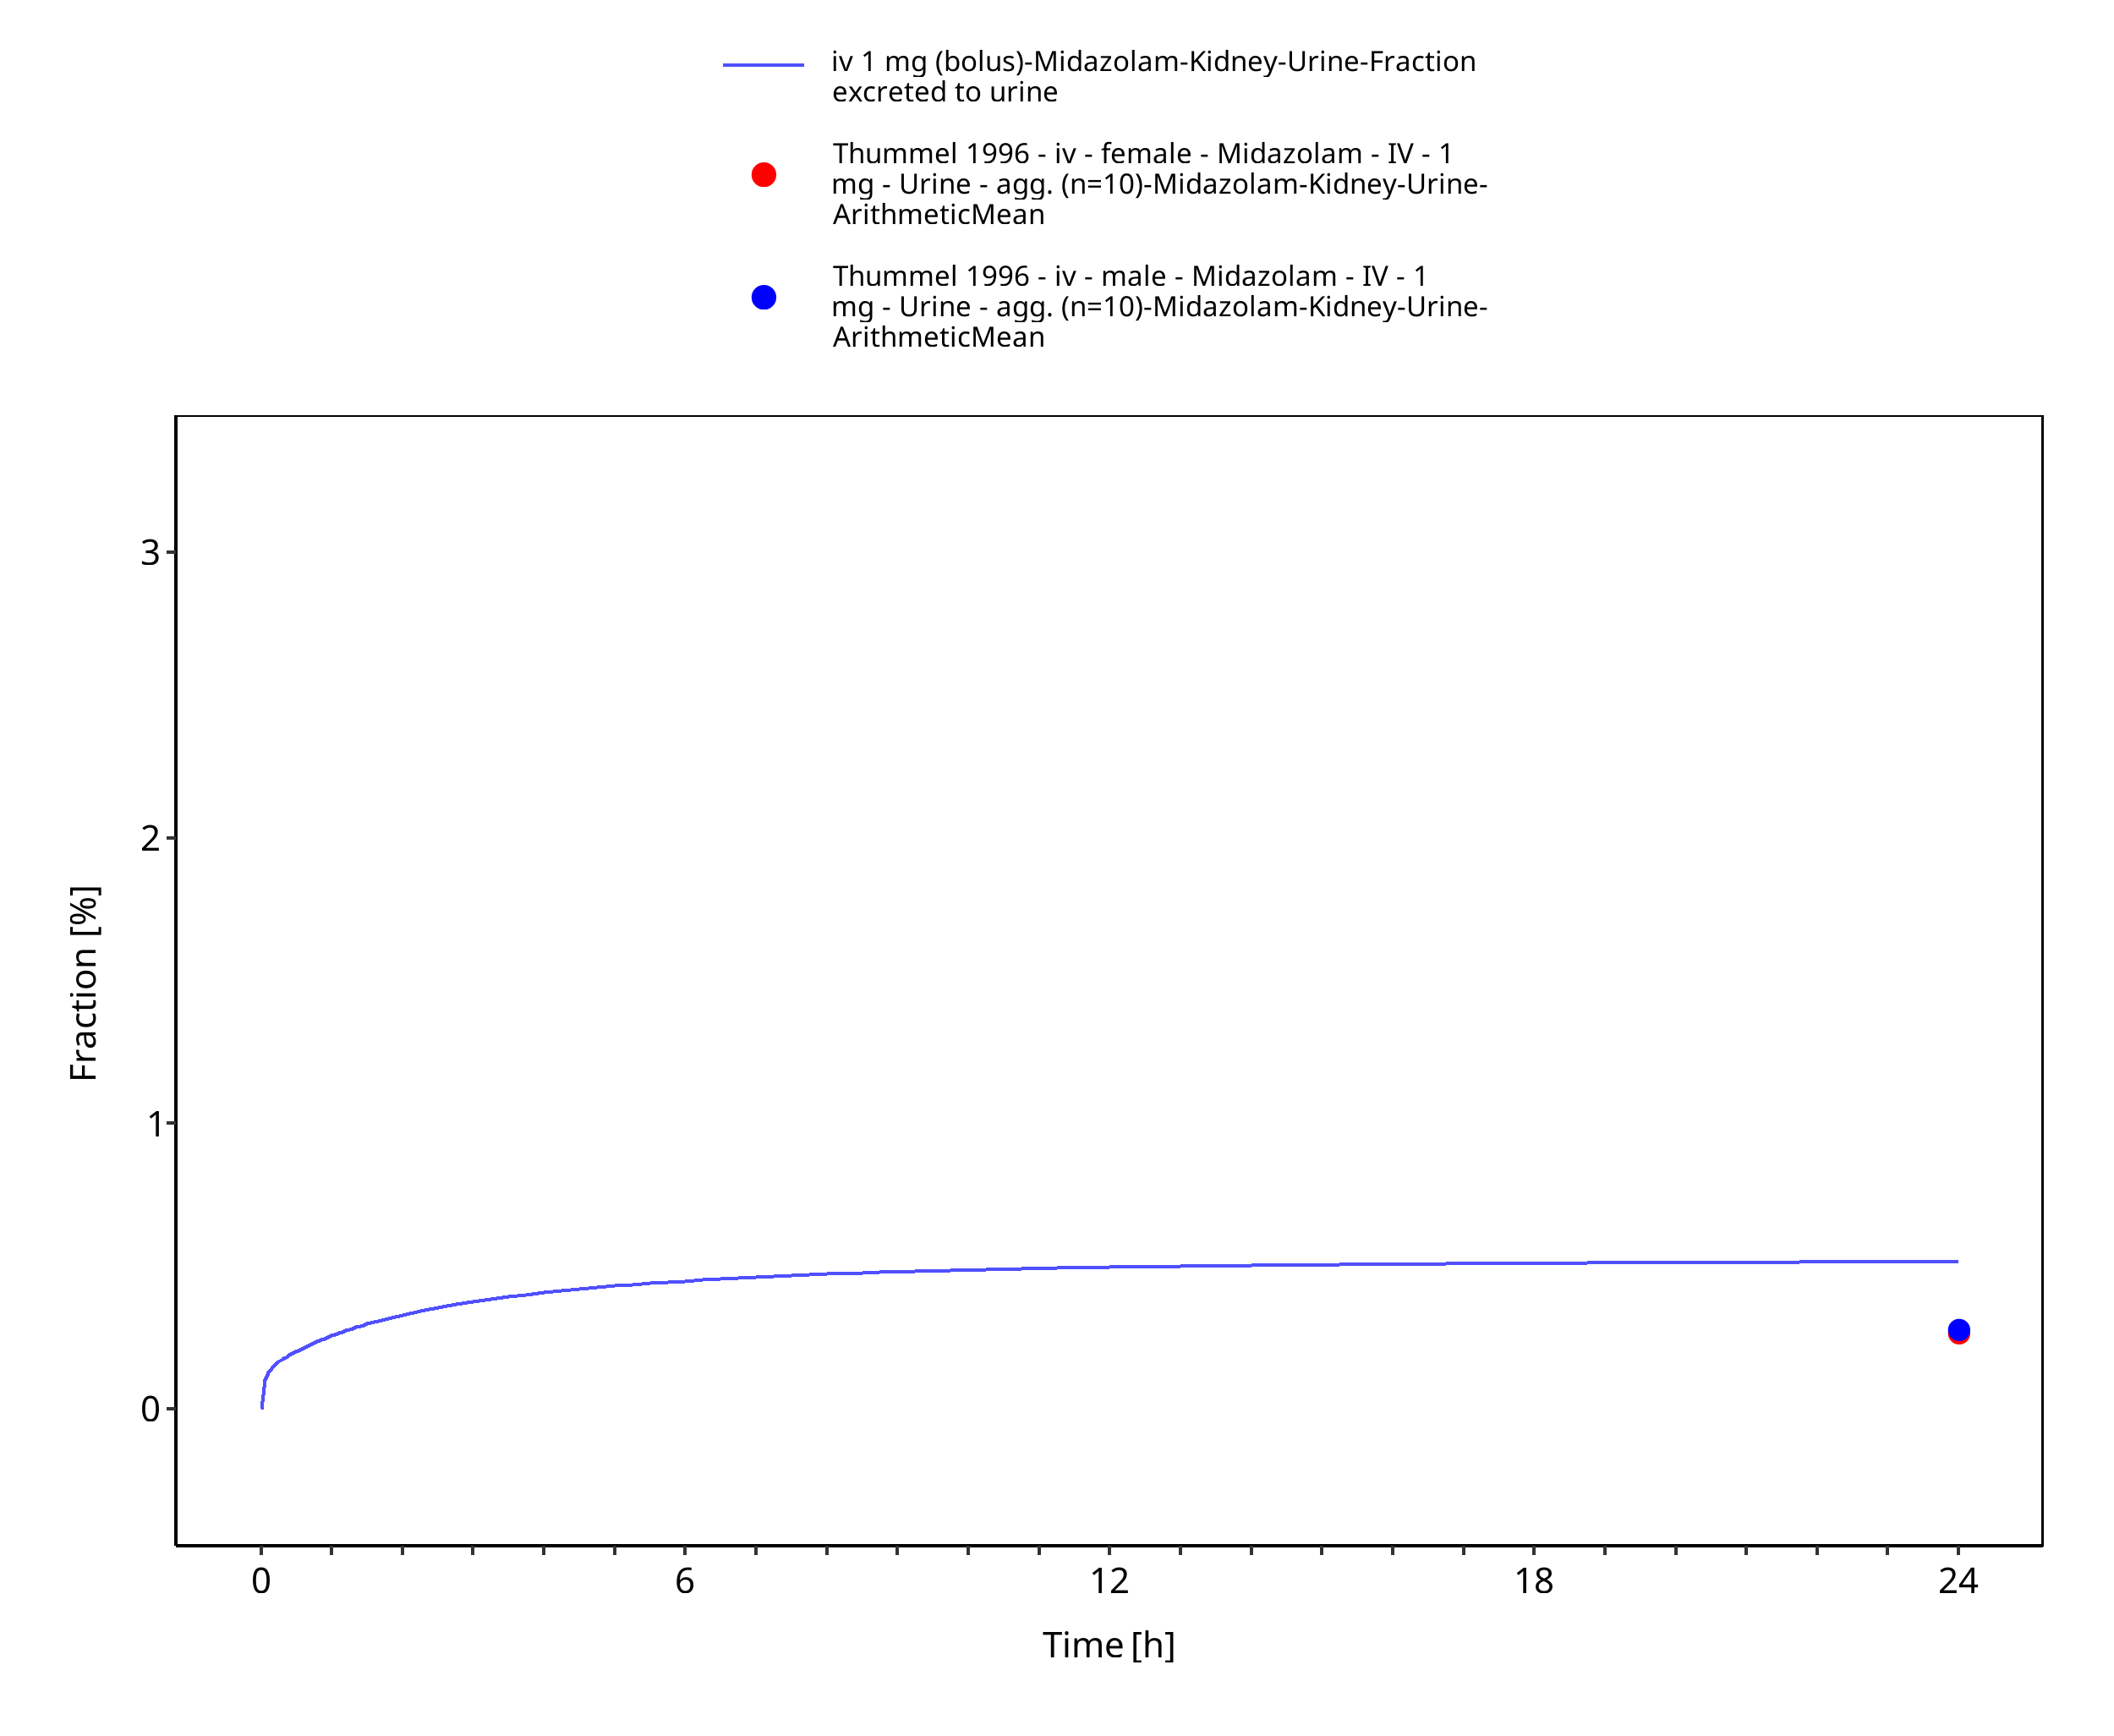
Figure 3-19: iv 1 mg (bolus) - Urine

Figure 3-20: iv 1 mg (bolus) - fm UGT1A4
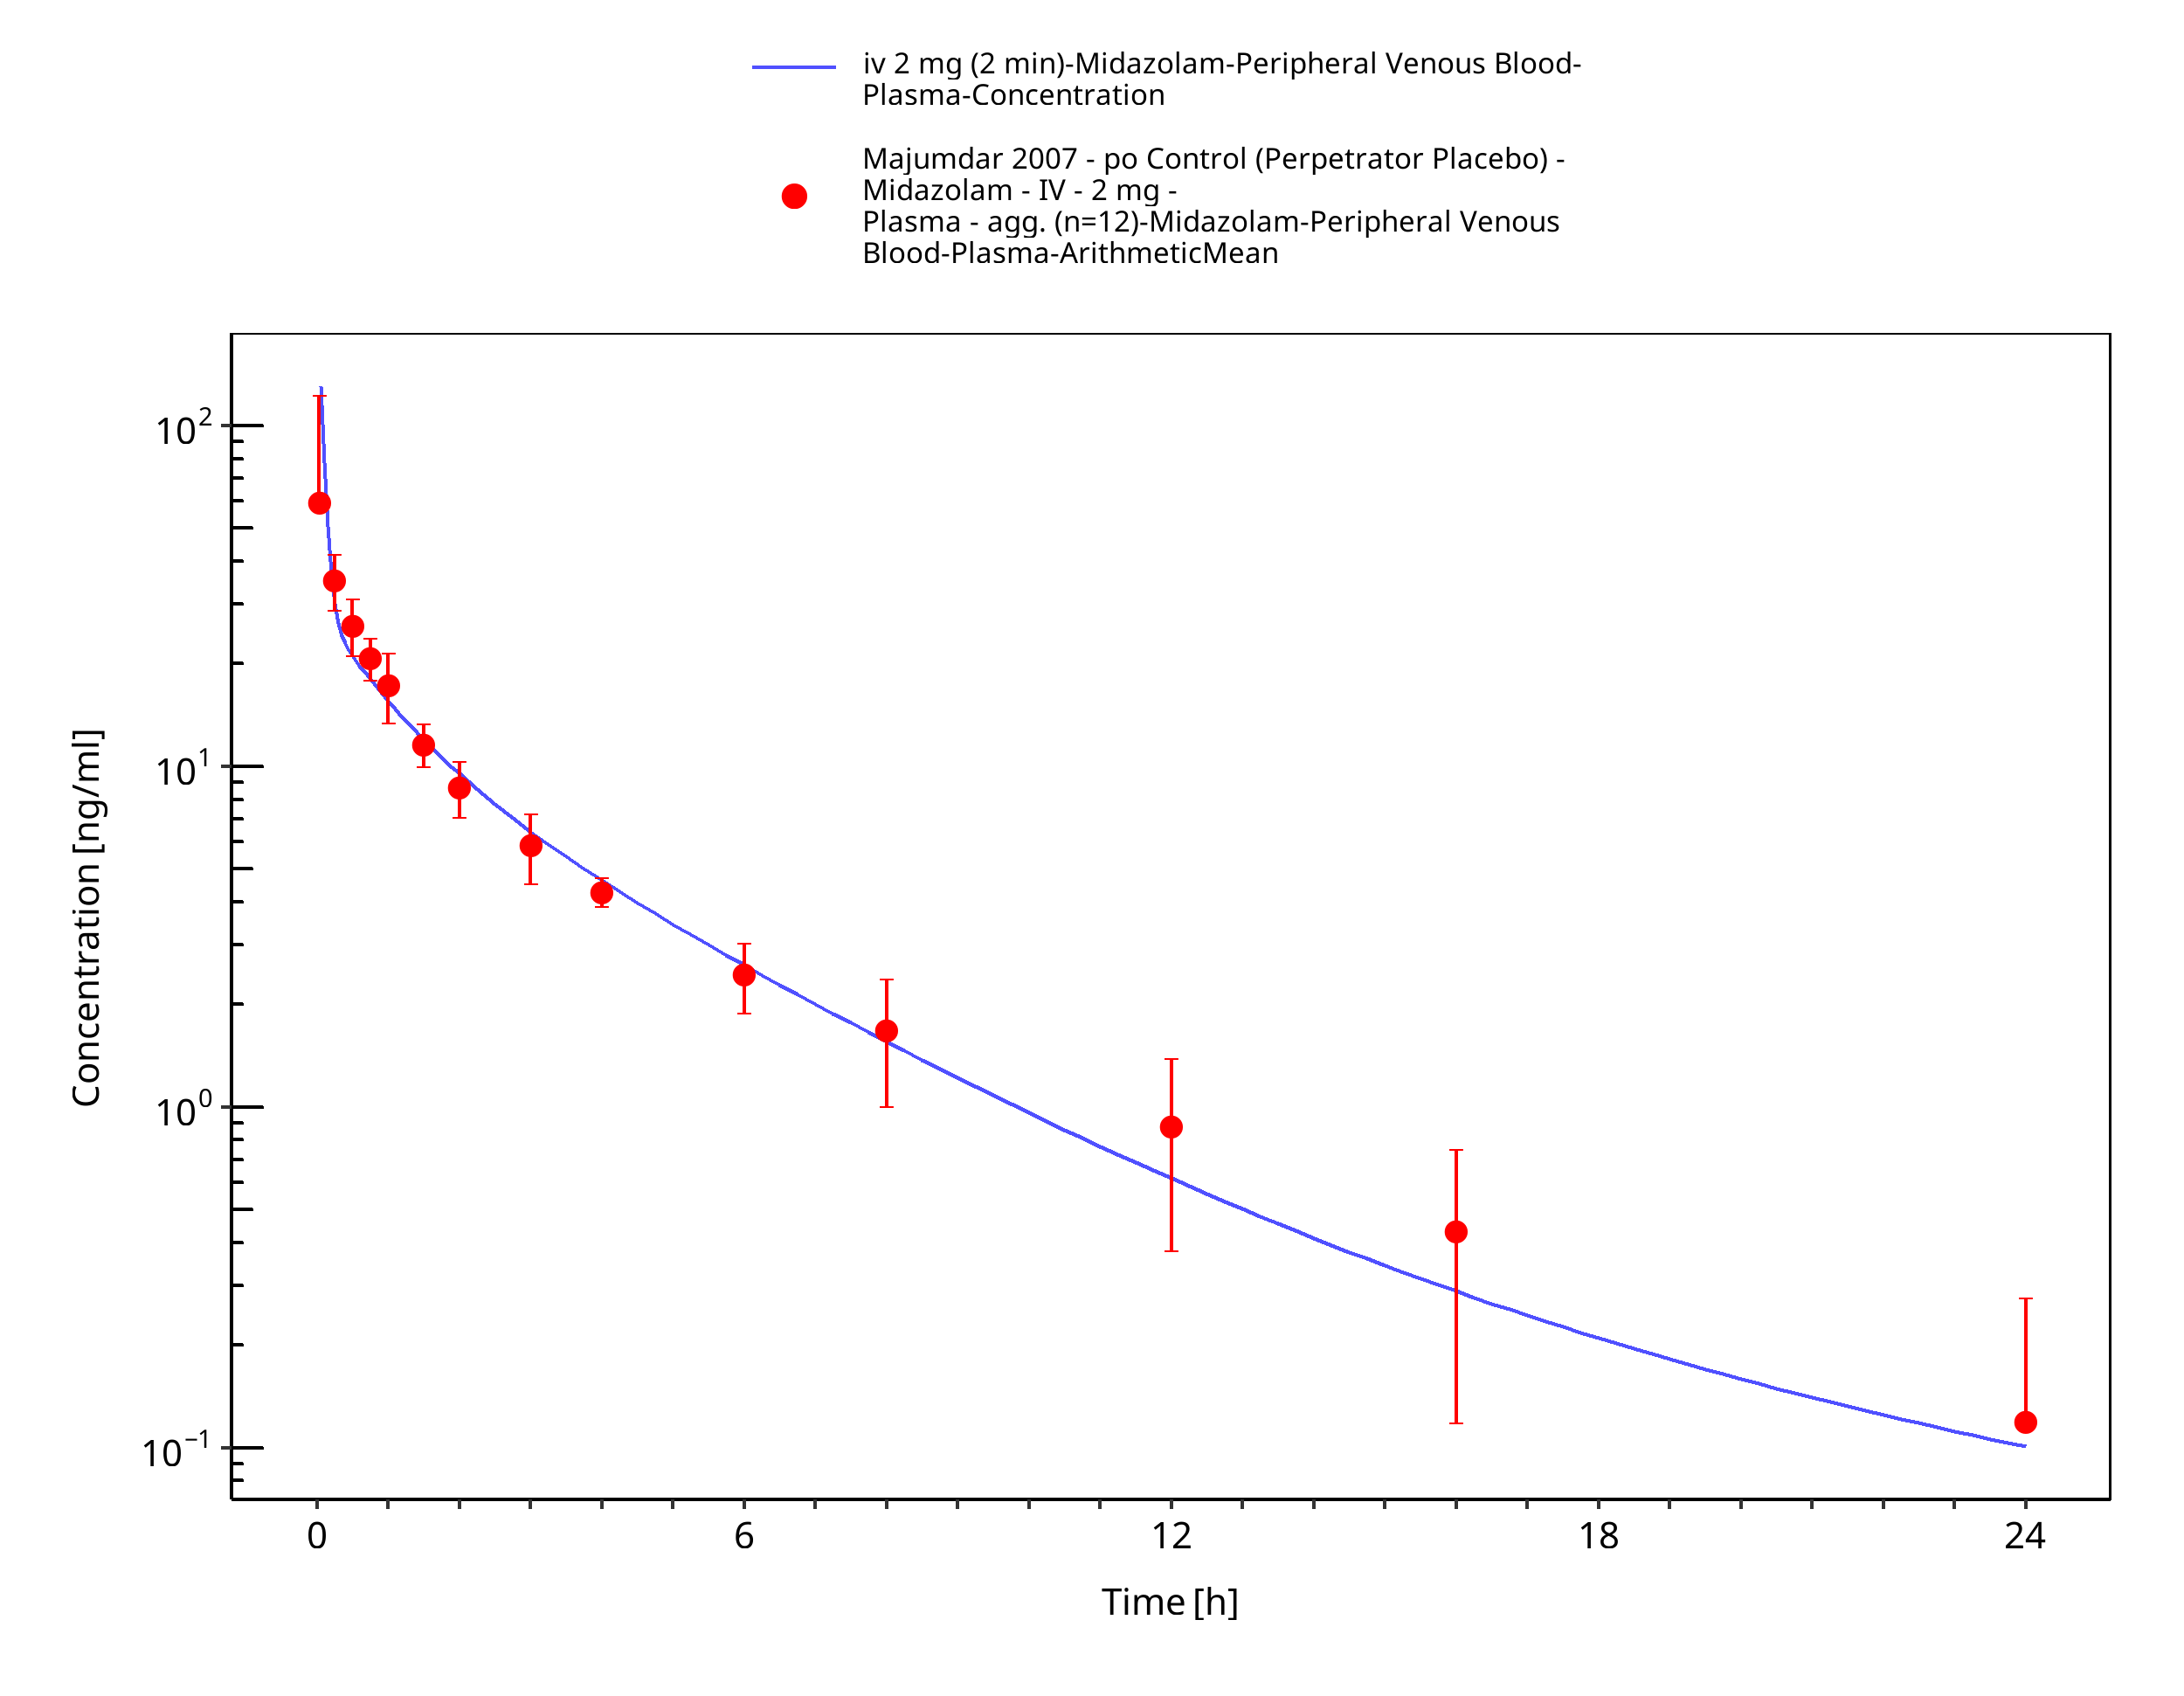
Figure 3-21: iv 2 mg (2 min) - Plasma
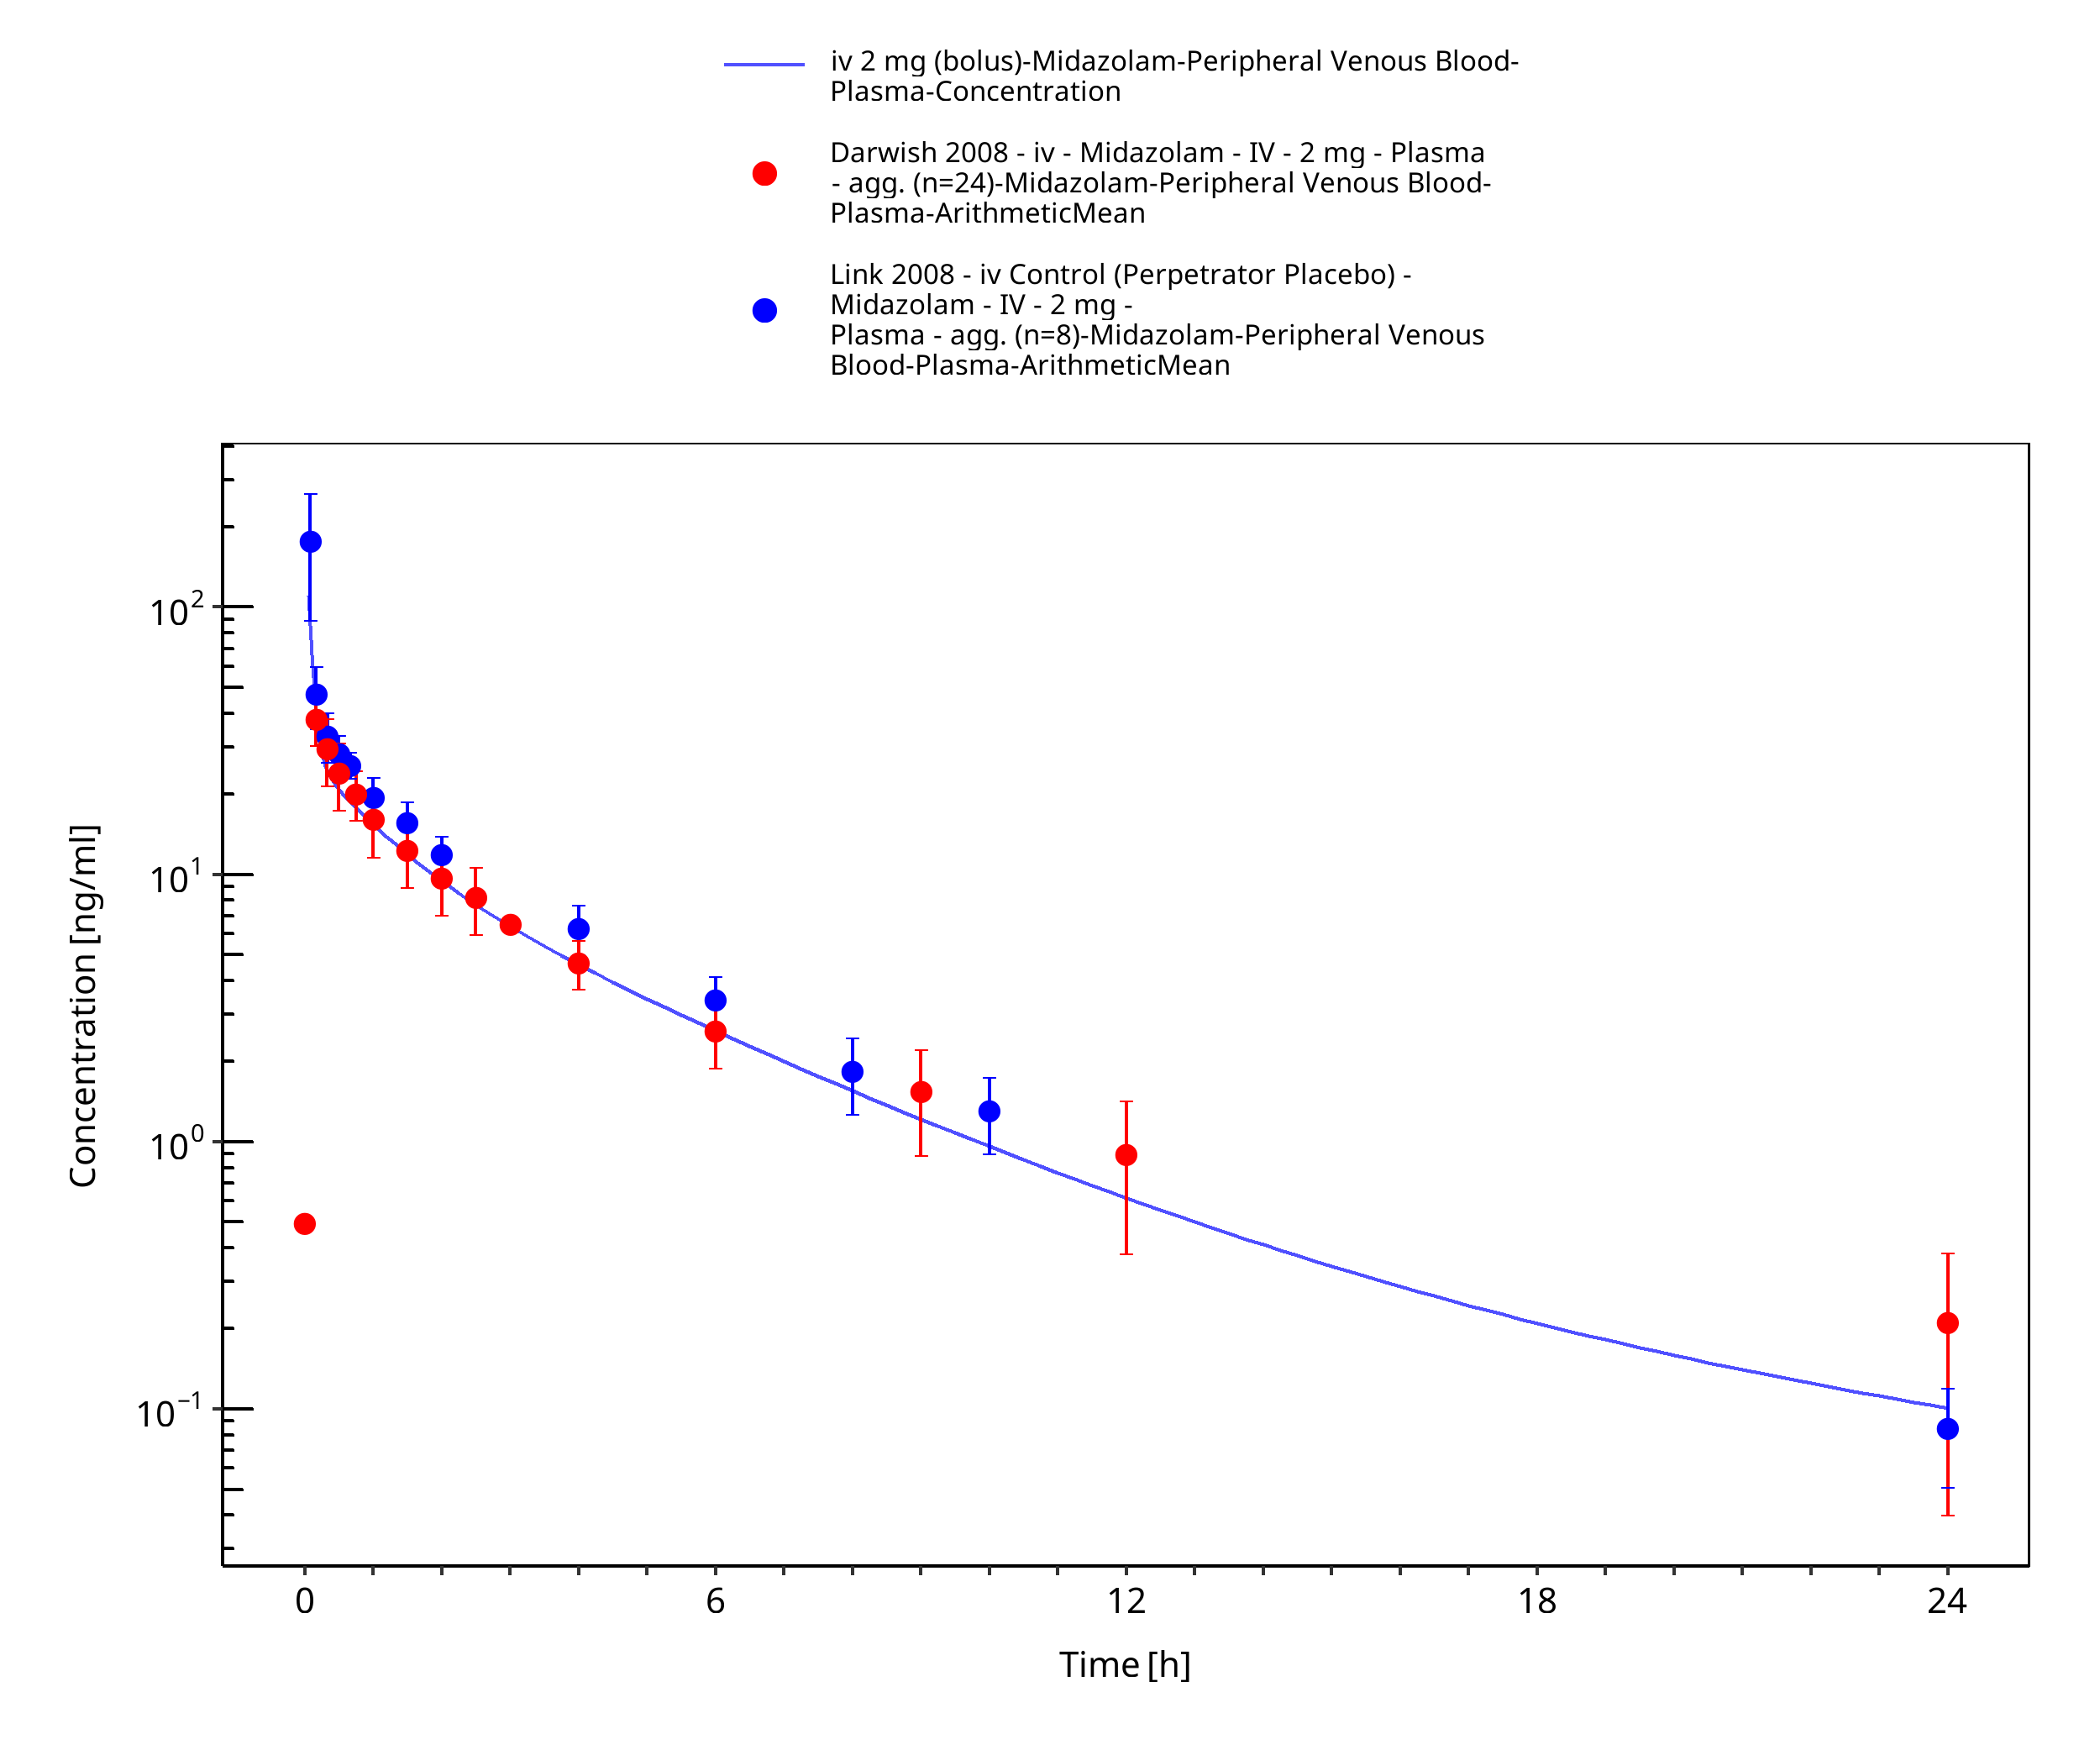
Figure 3-22: iv 2 mg (bolus) - Plasma
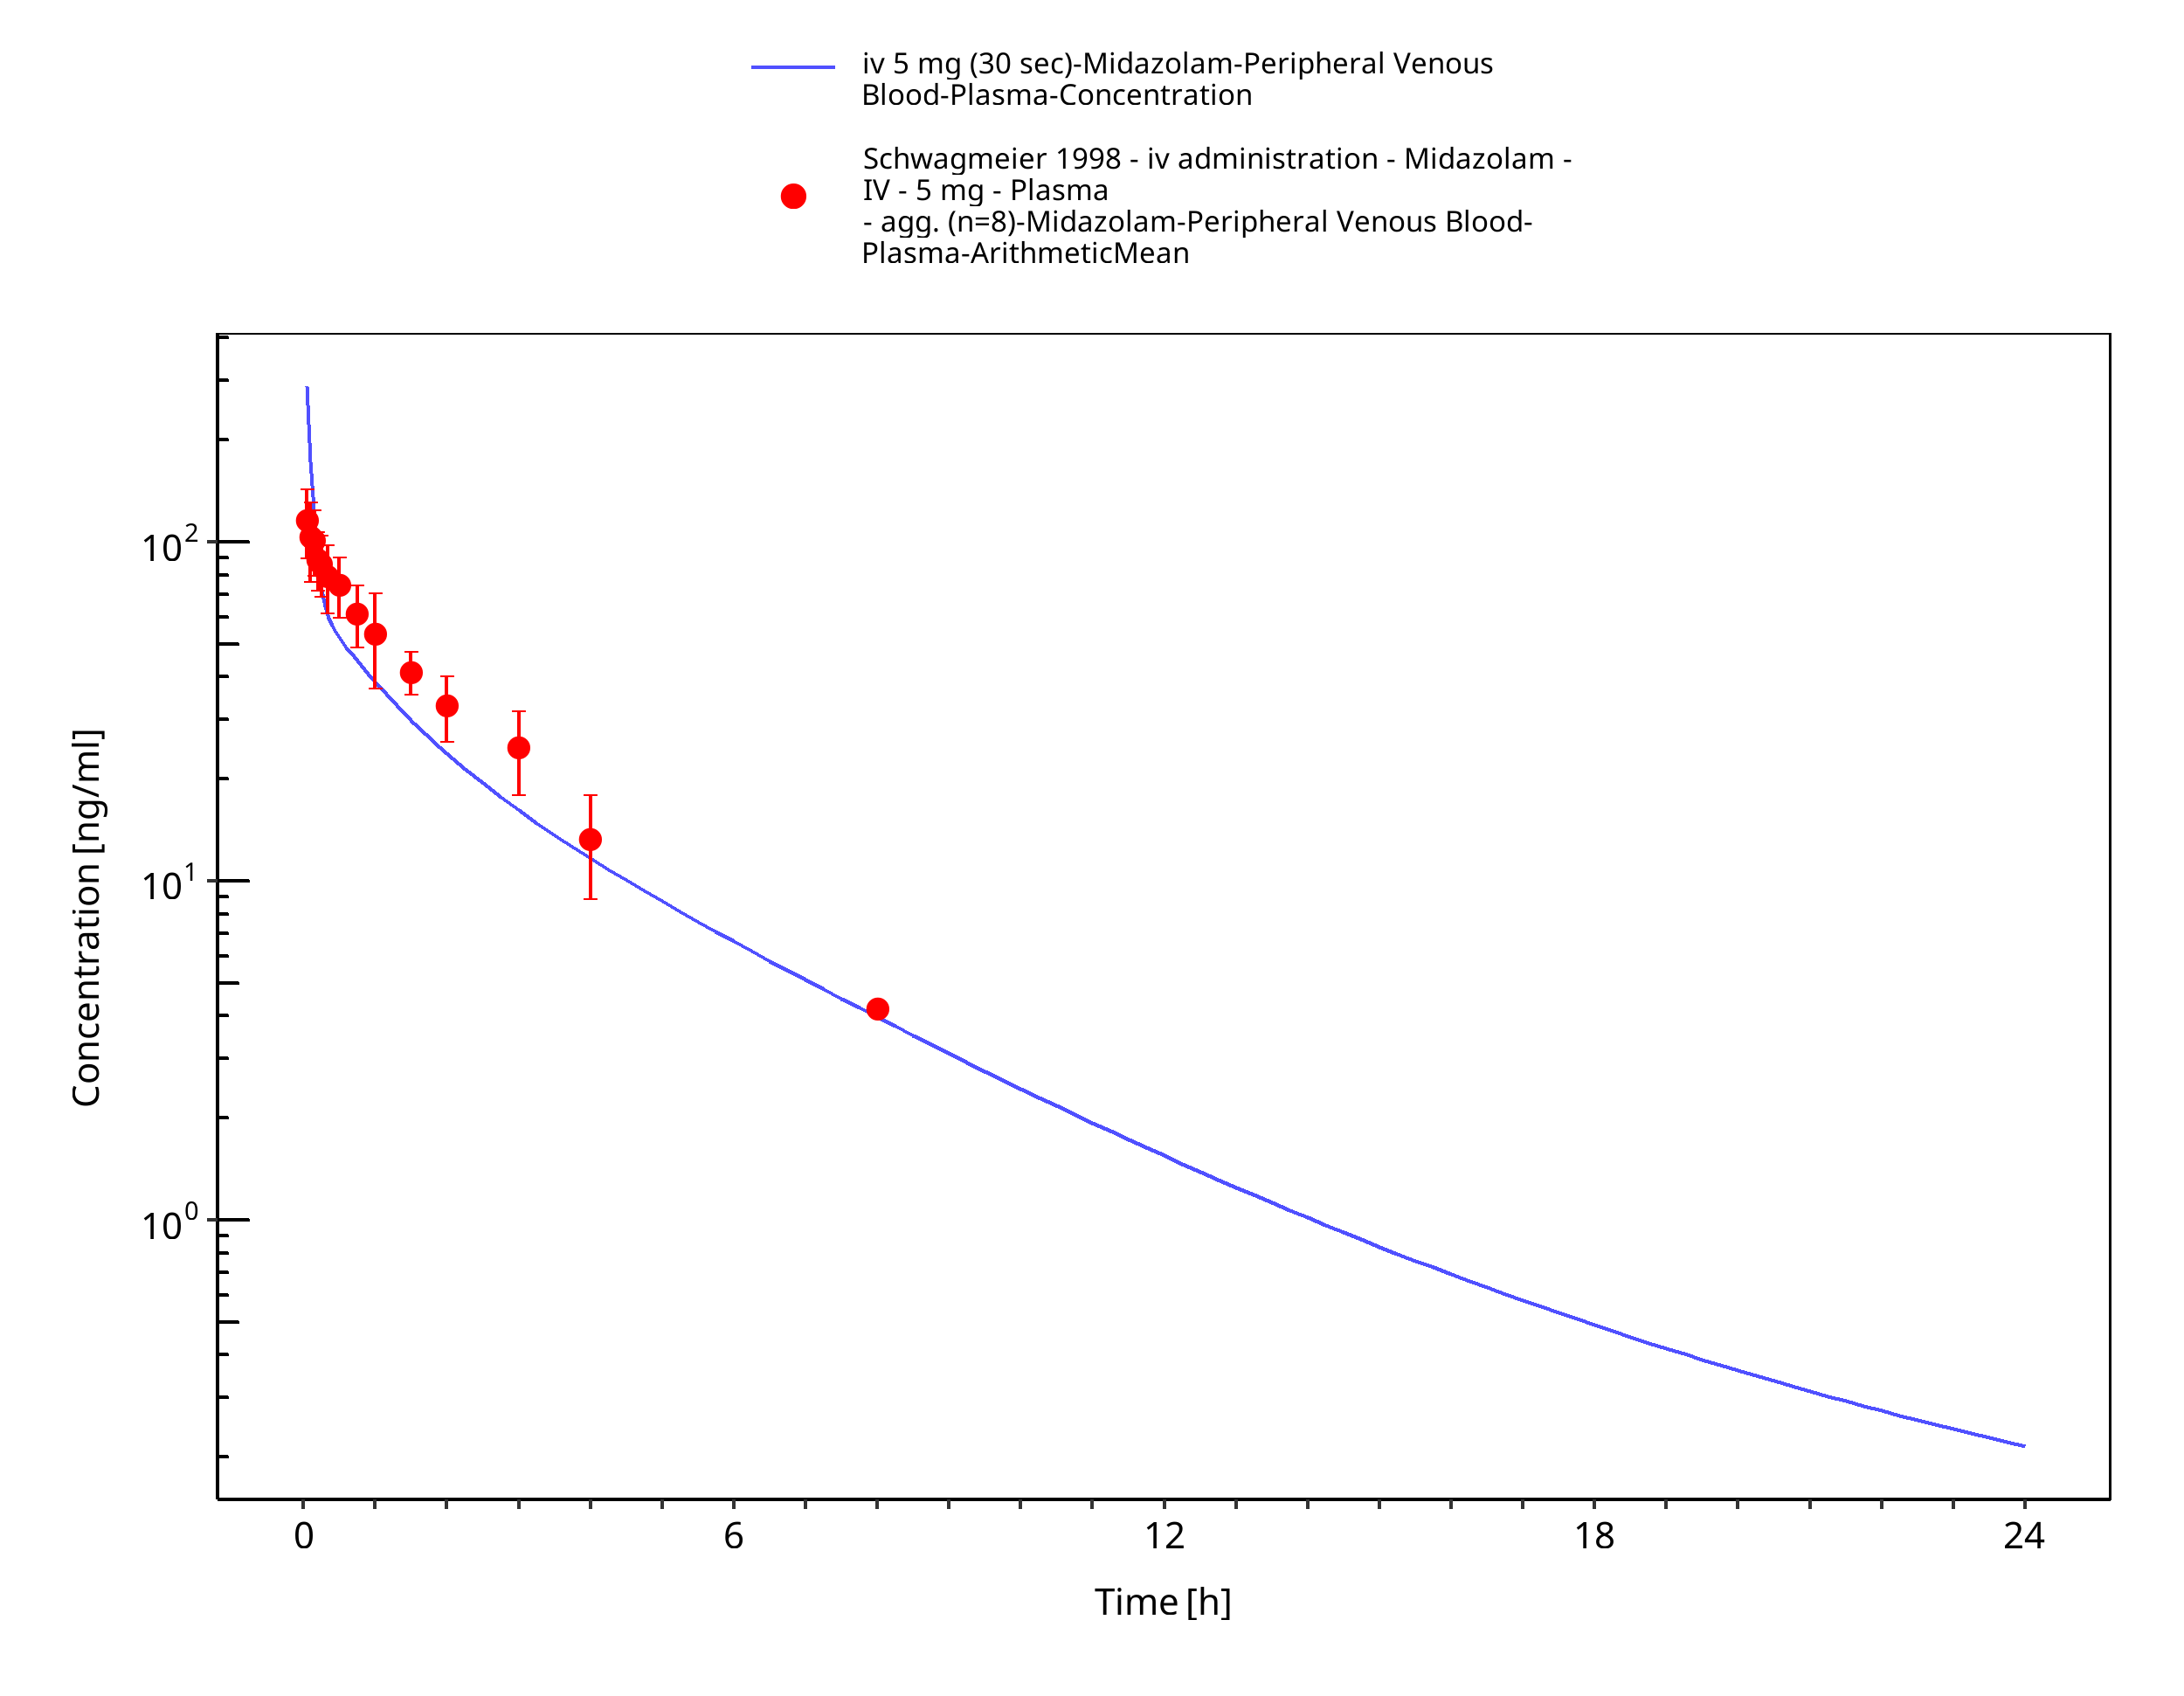
Figure 3-23: iv 5 mg (30 sec) - Plasma
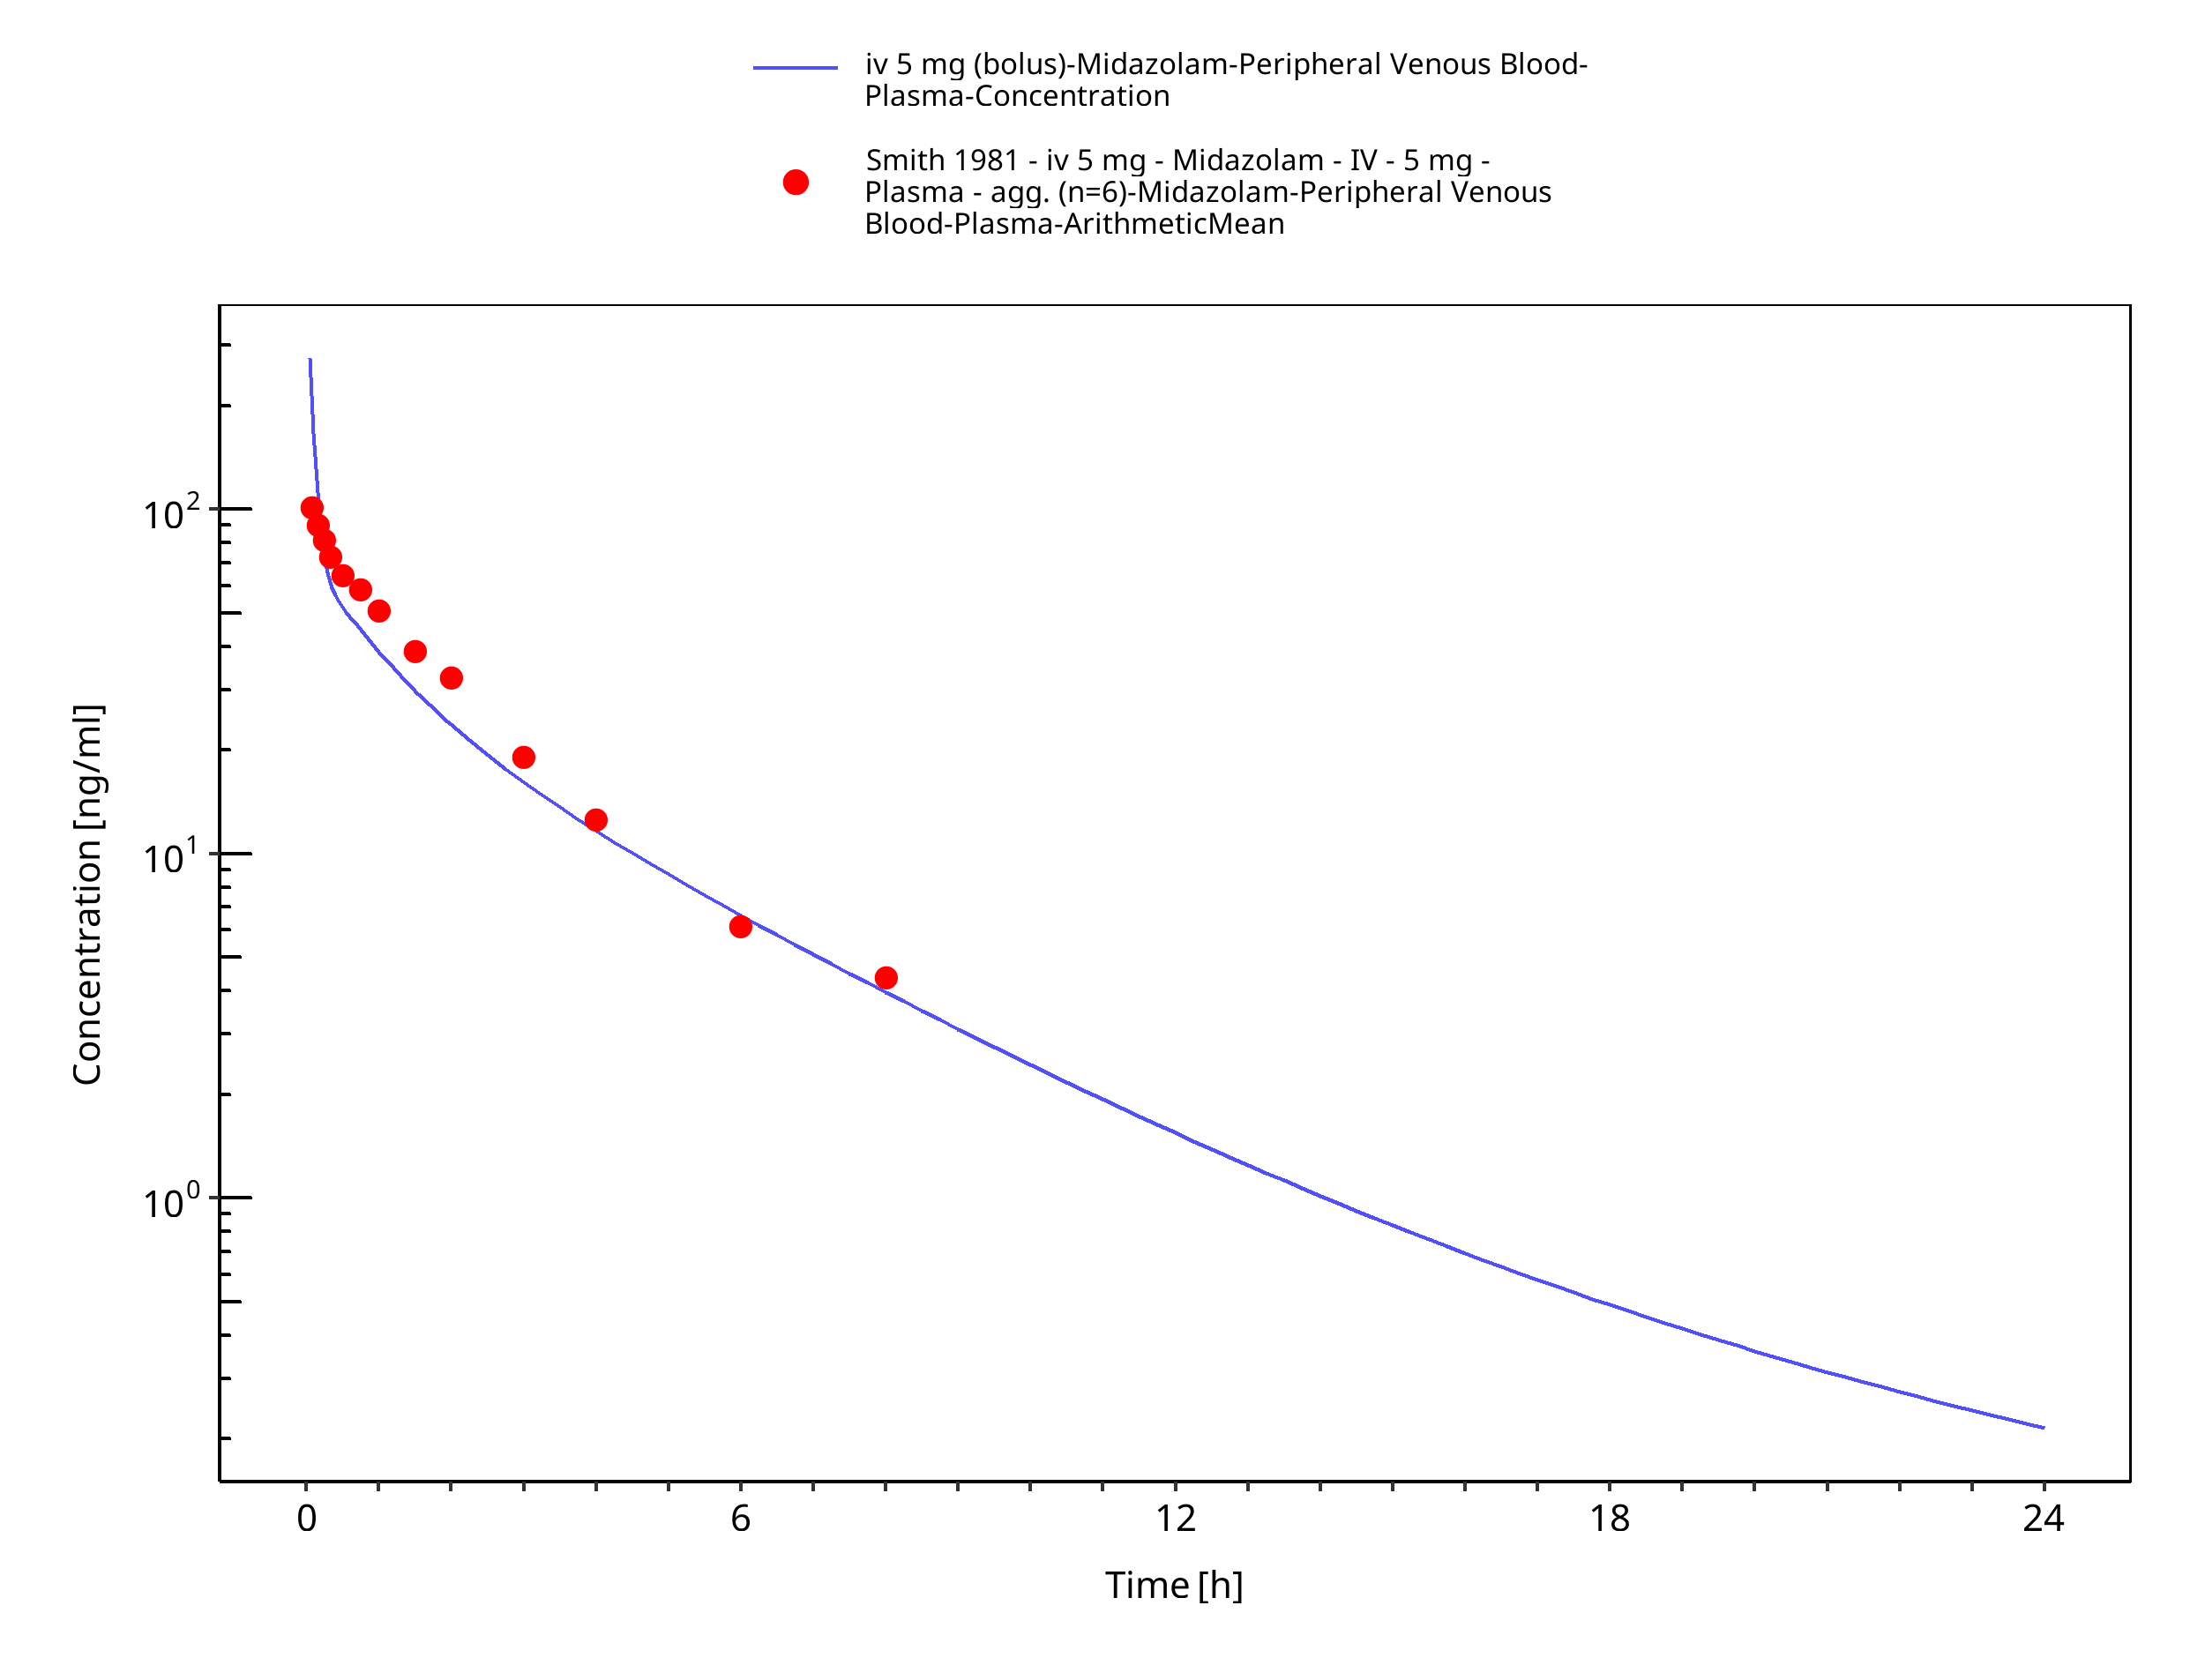
Figure 3-24: iv 5 mg (bolus) - Plasma
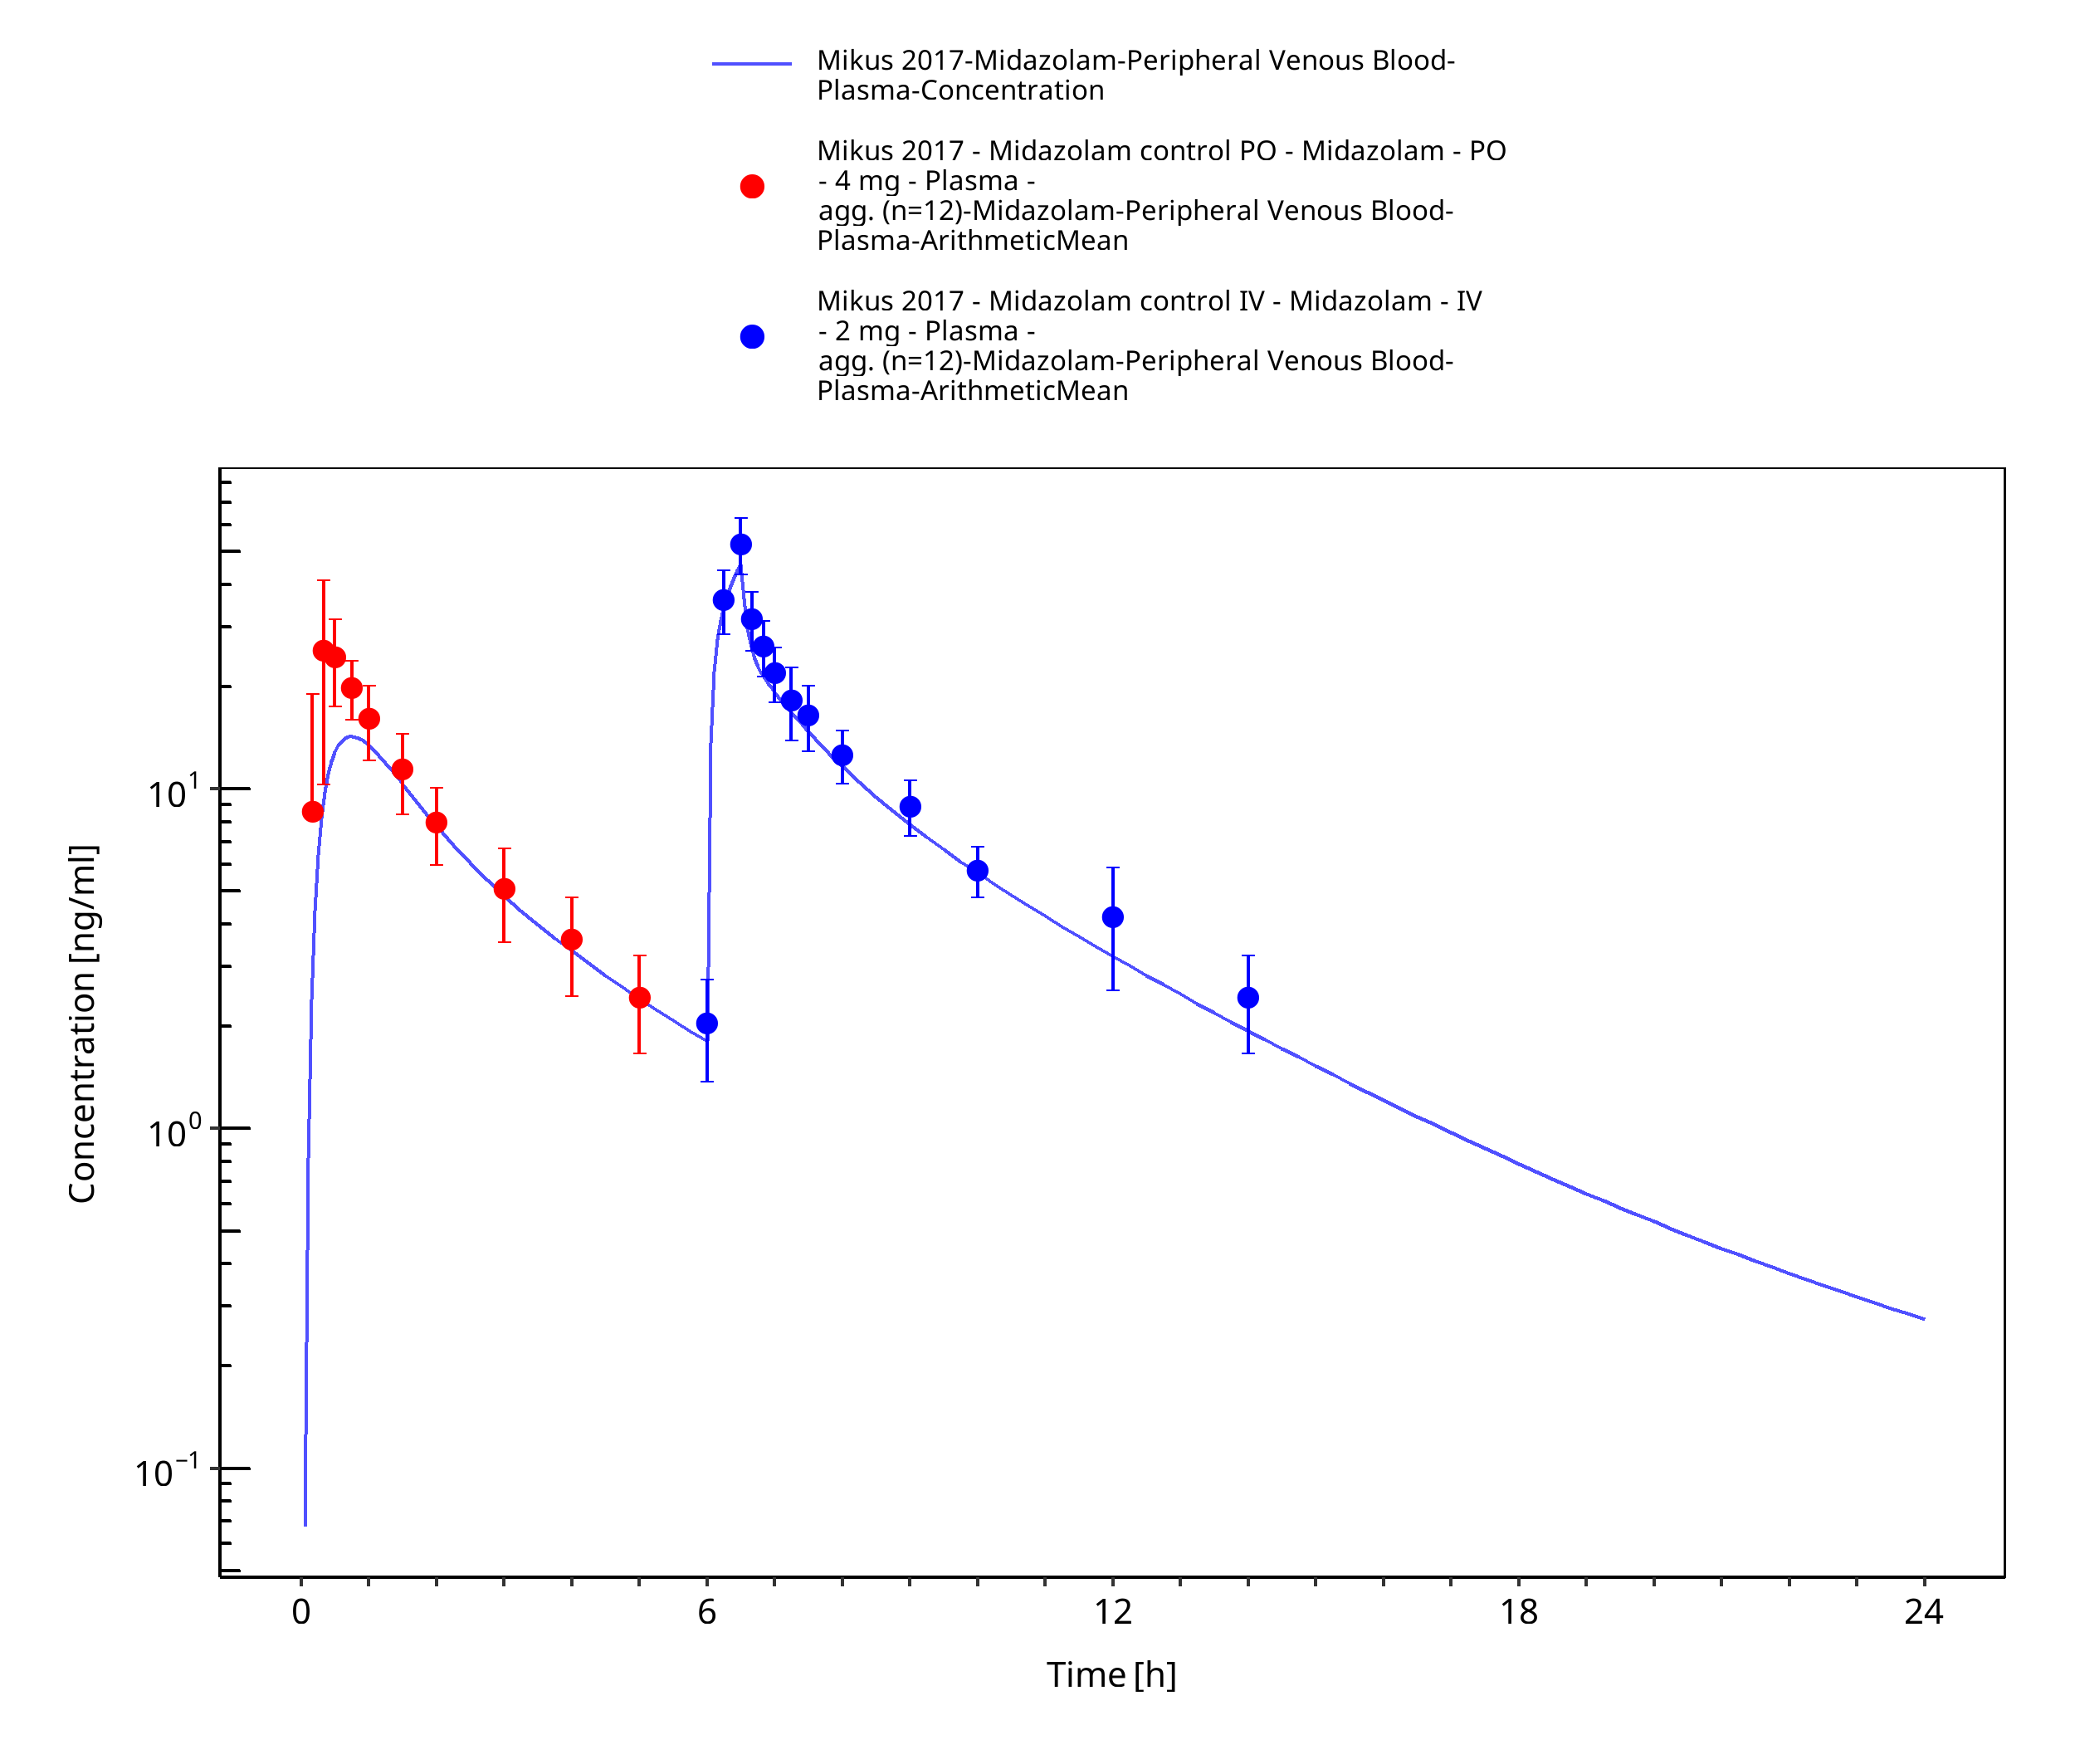
Figure 3-25: Mikus 2017 (4 mg po followed by 2 mg iv)
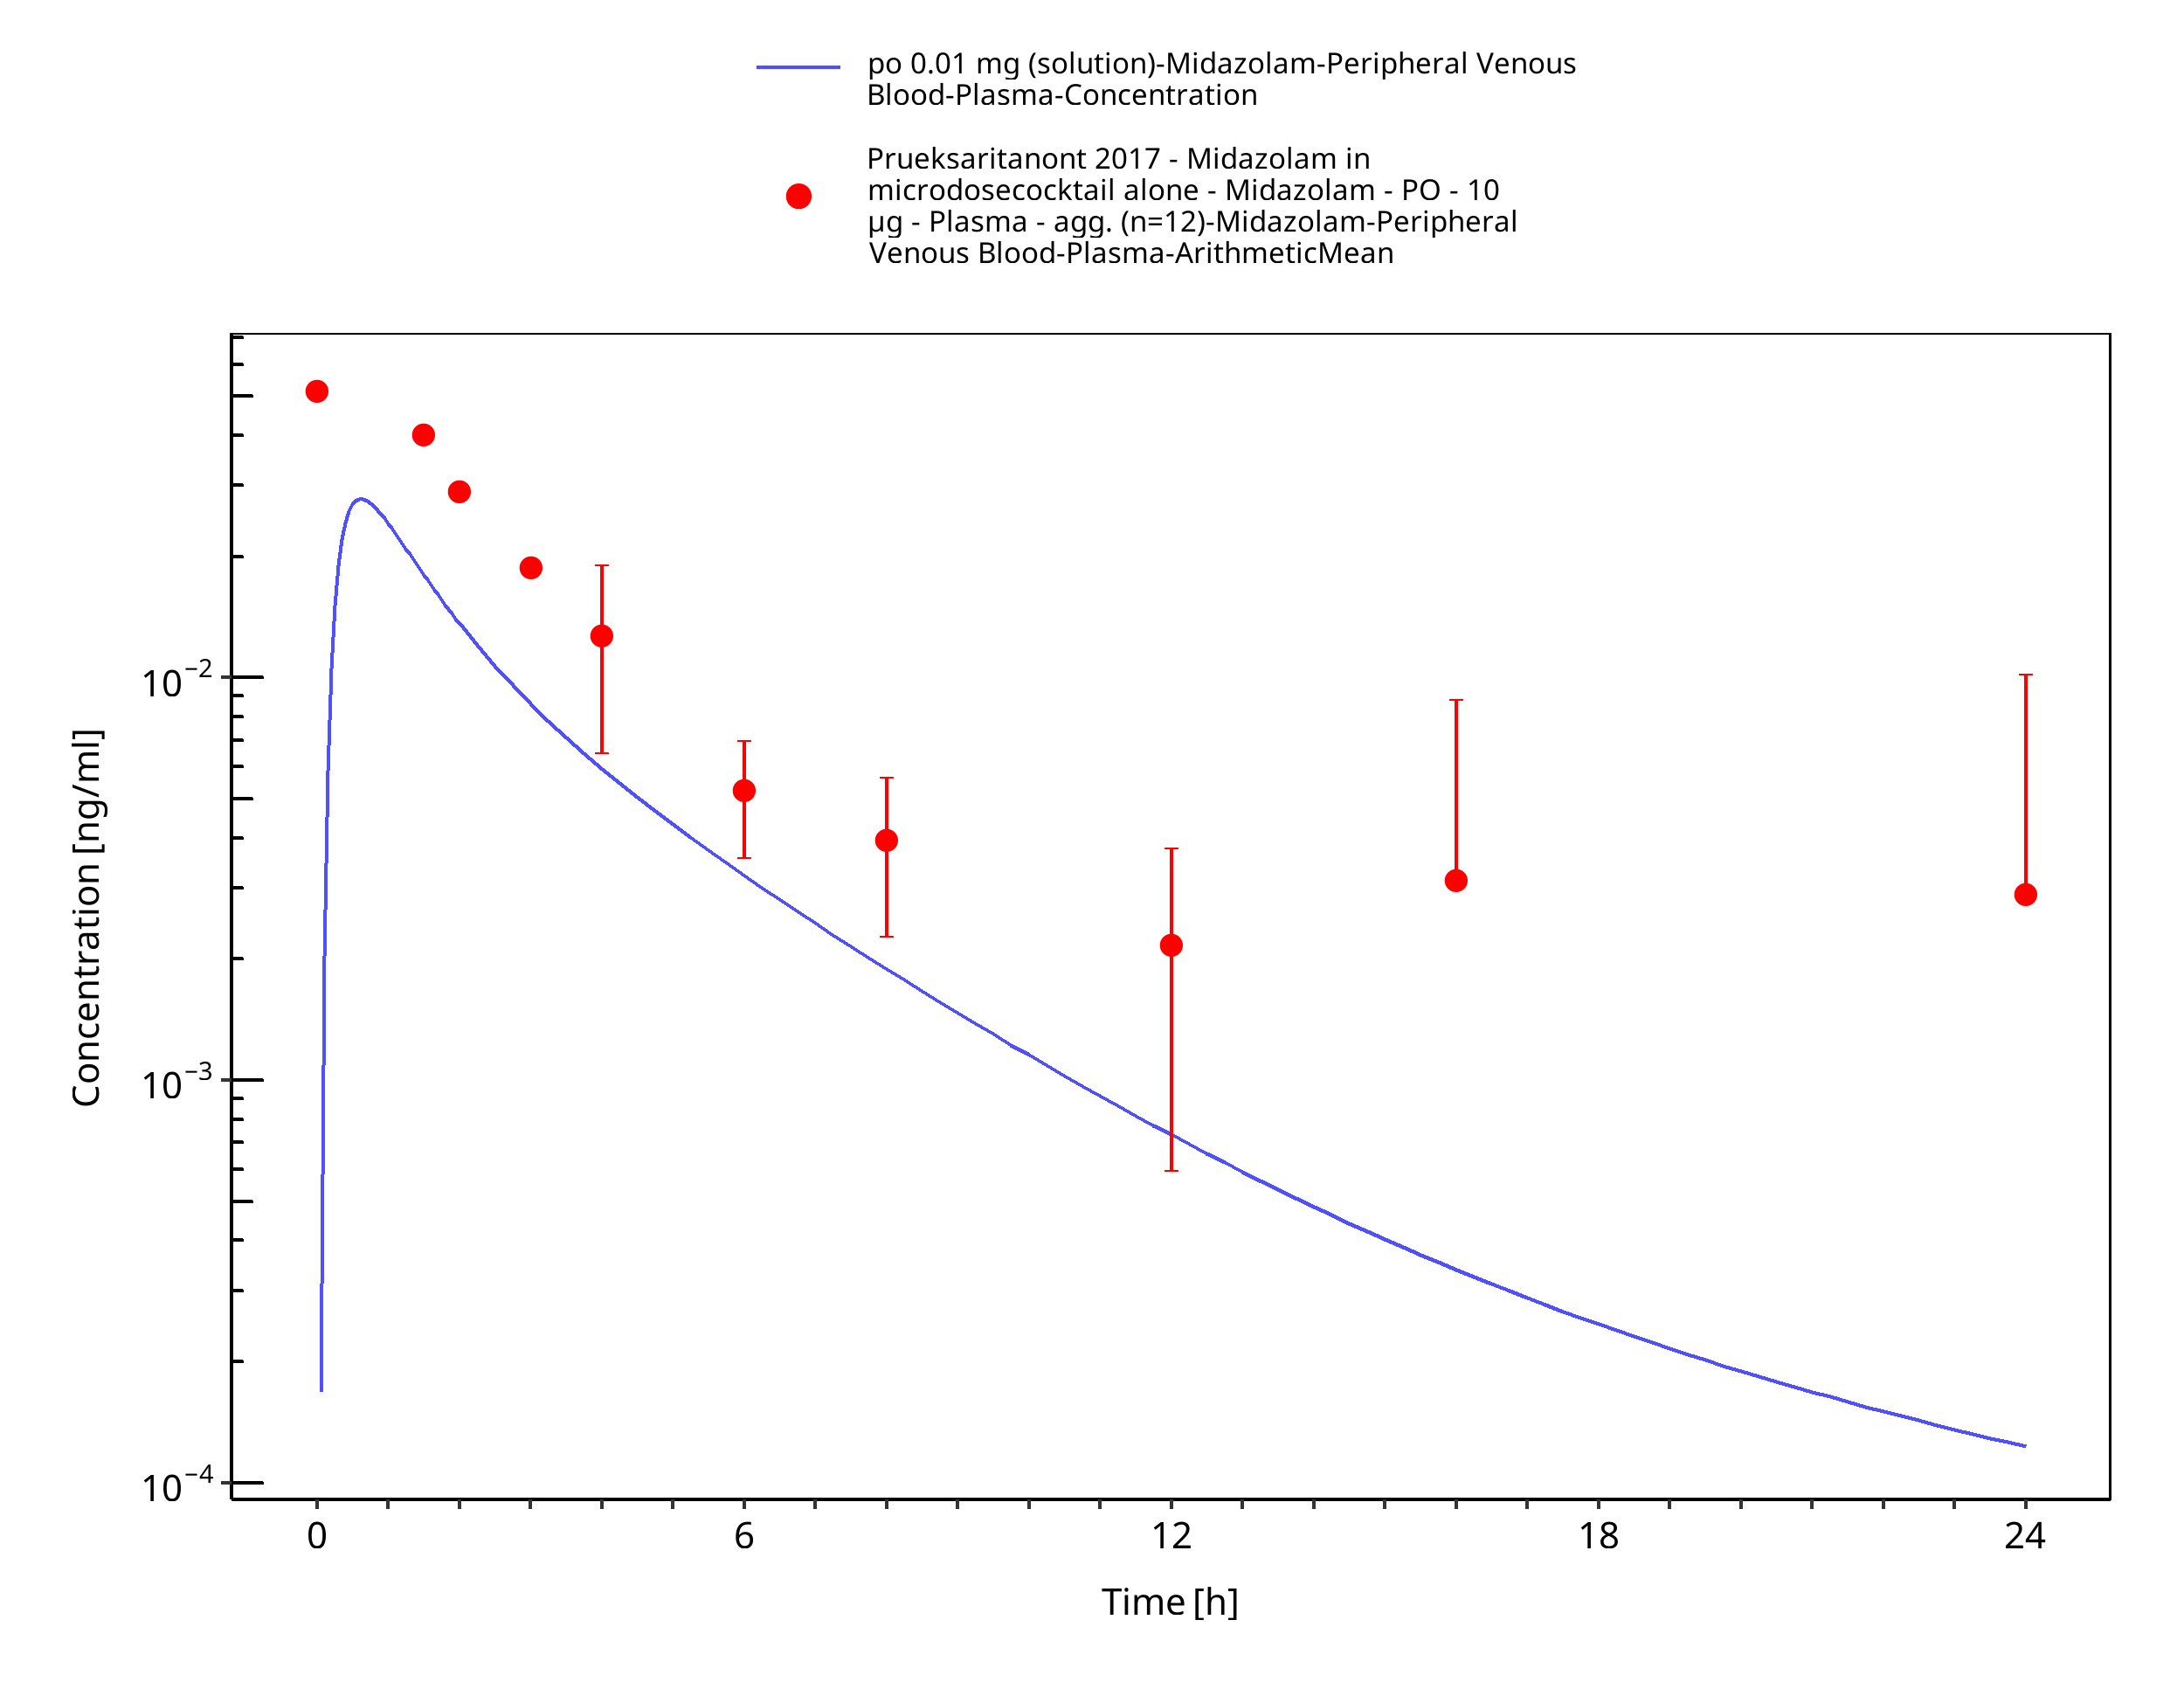
Figure 3-26: po 0.01 mg (solution) - Plasma
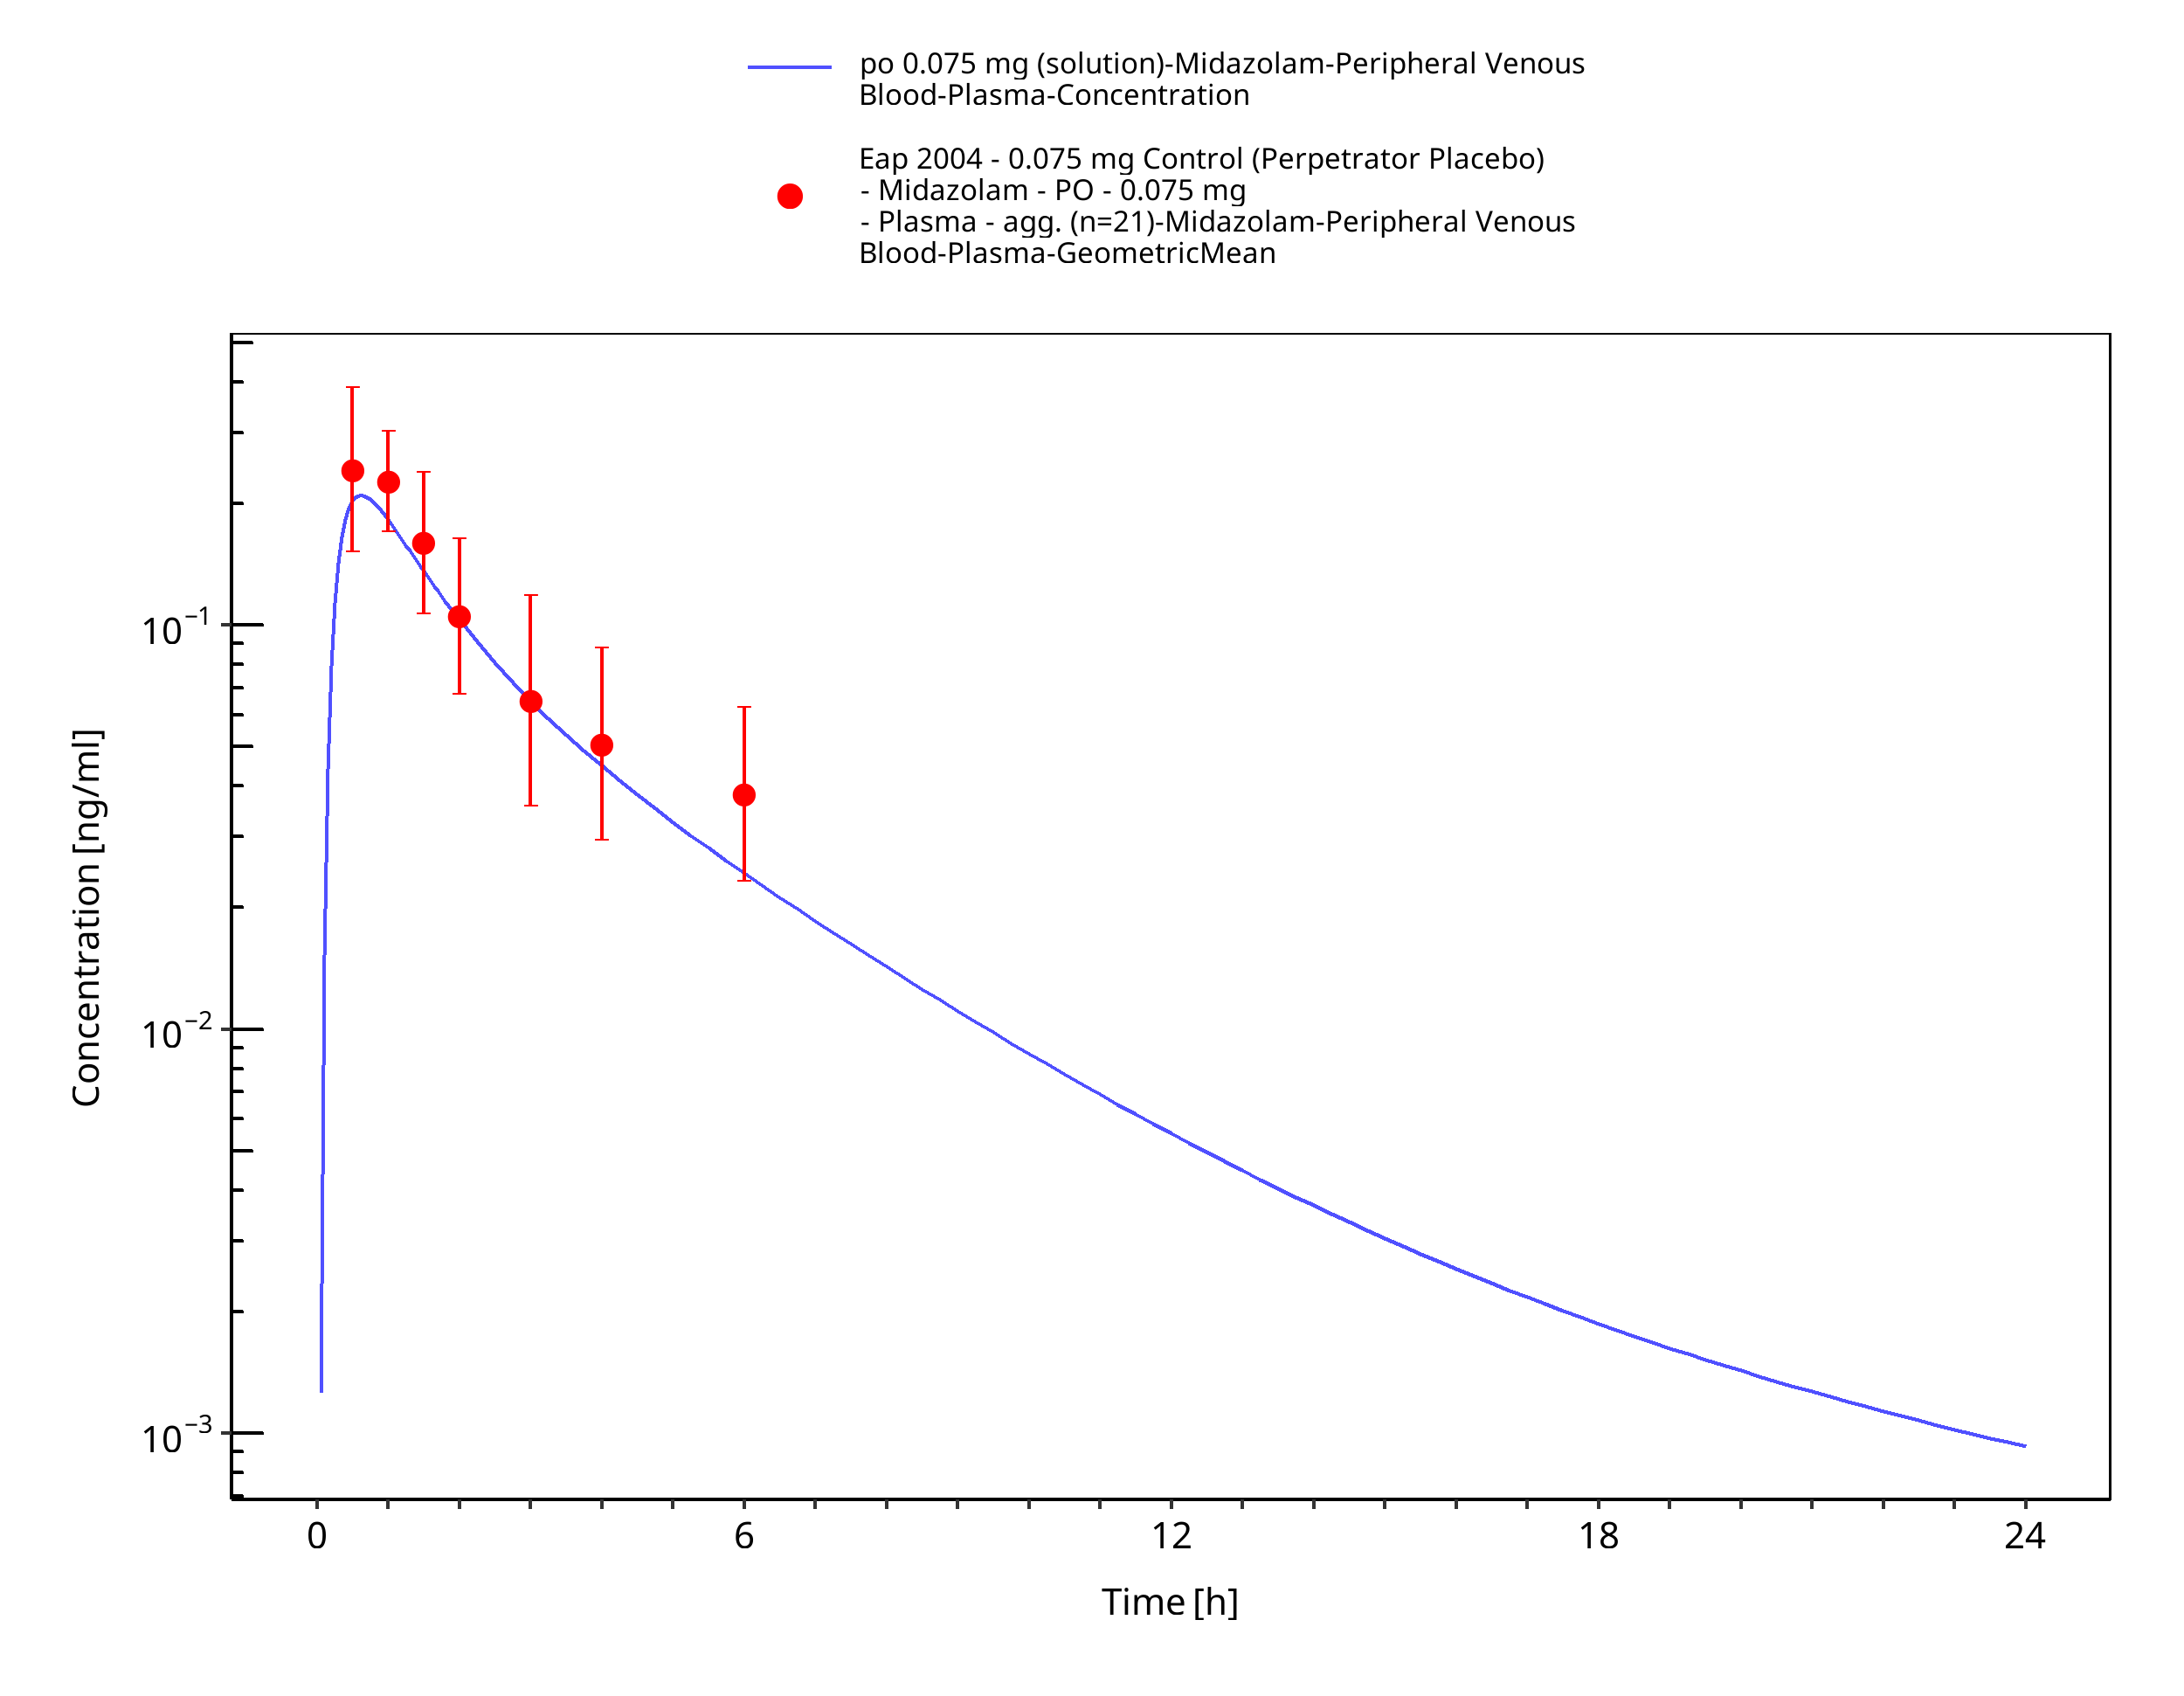
Figure 3-27: po 0.075 mg (solution) - Plasma
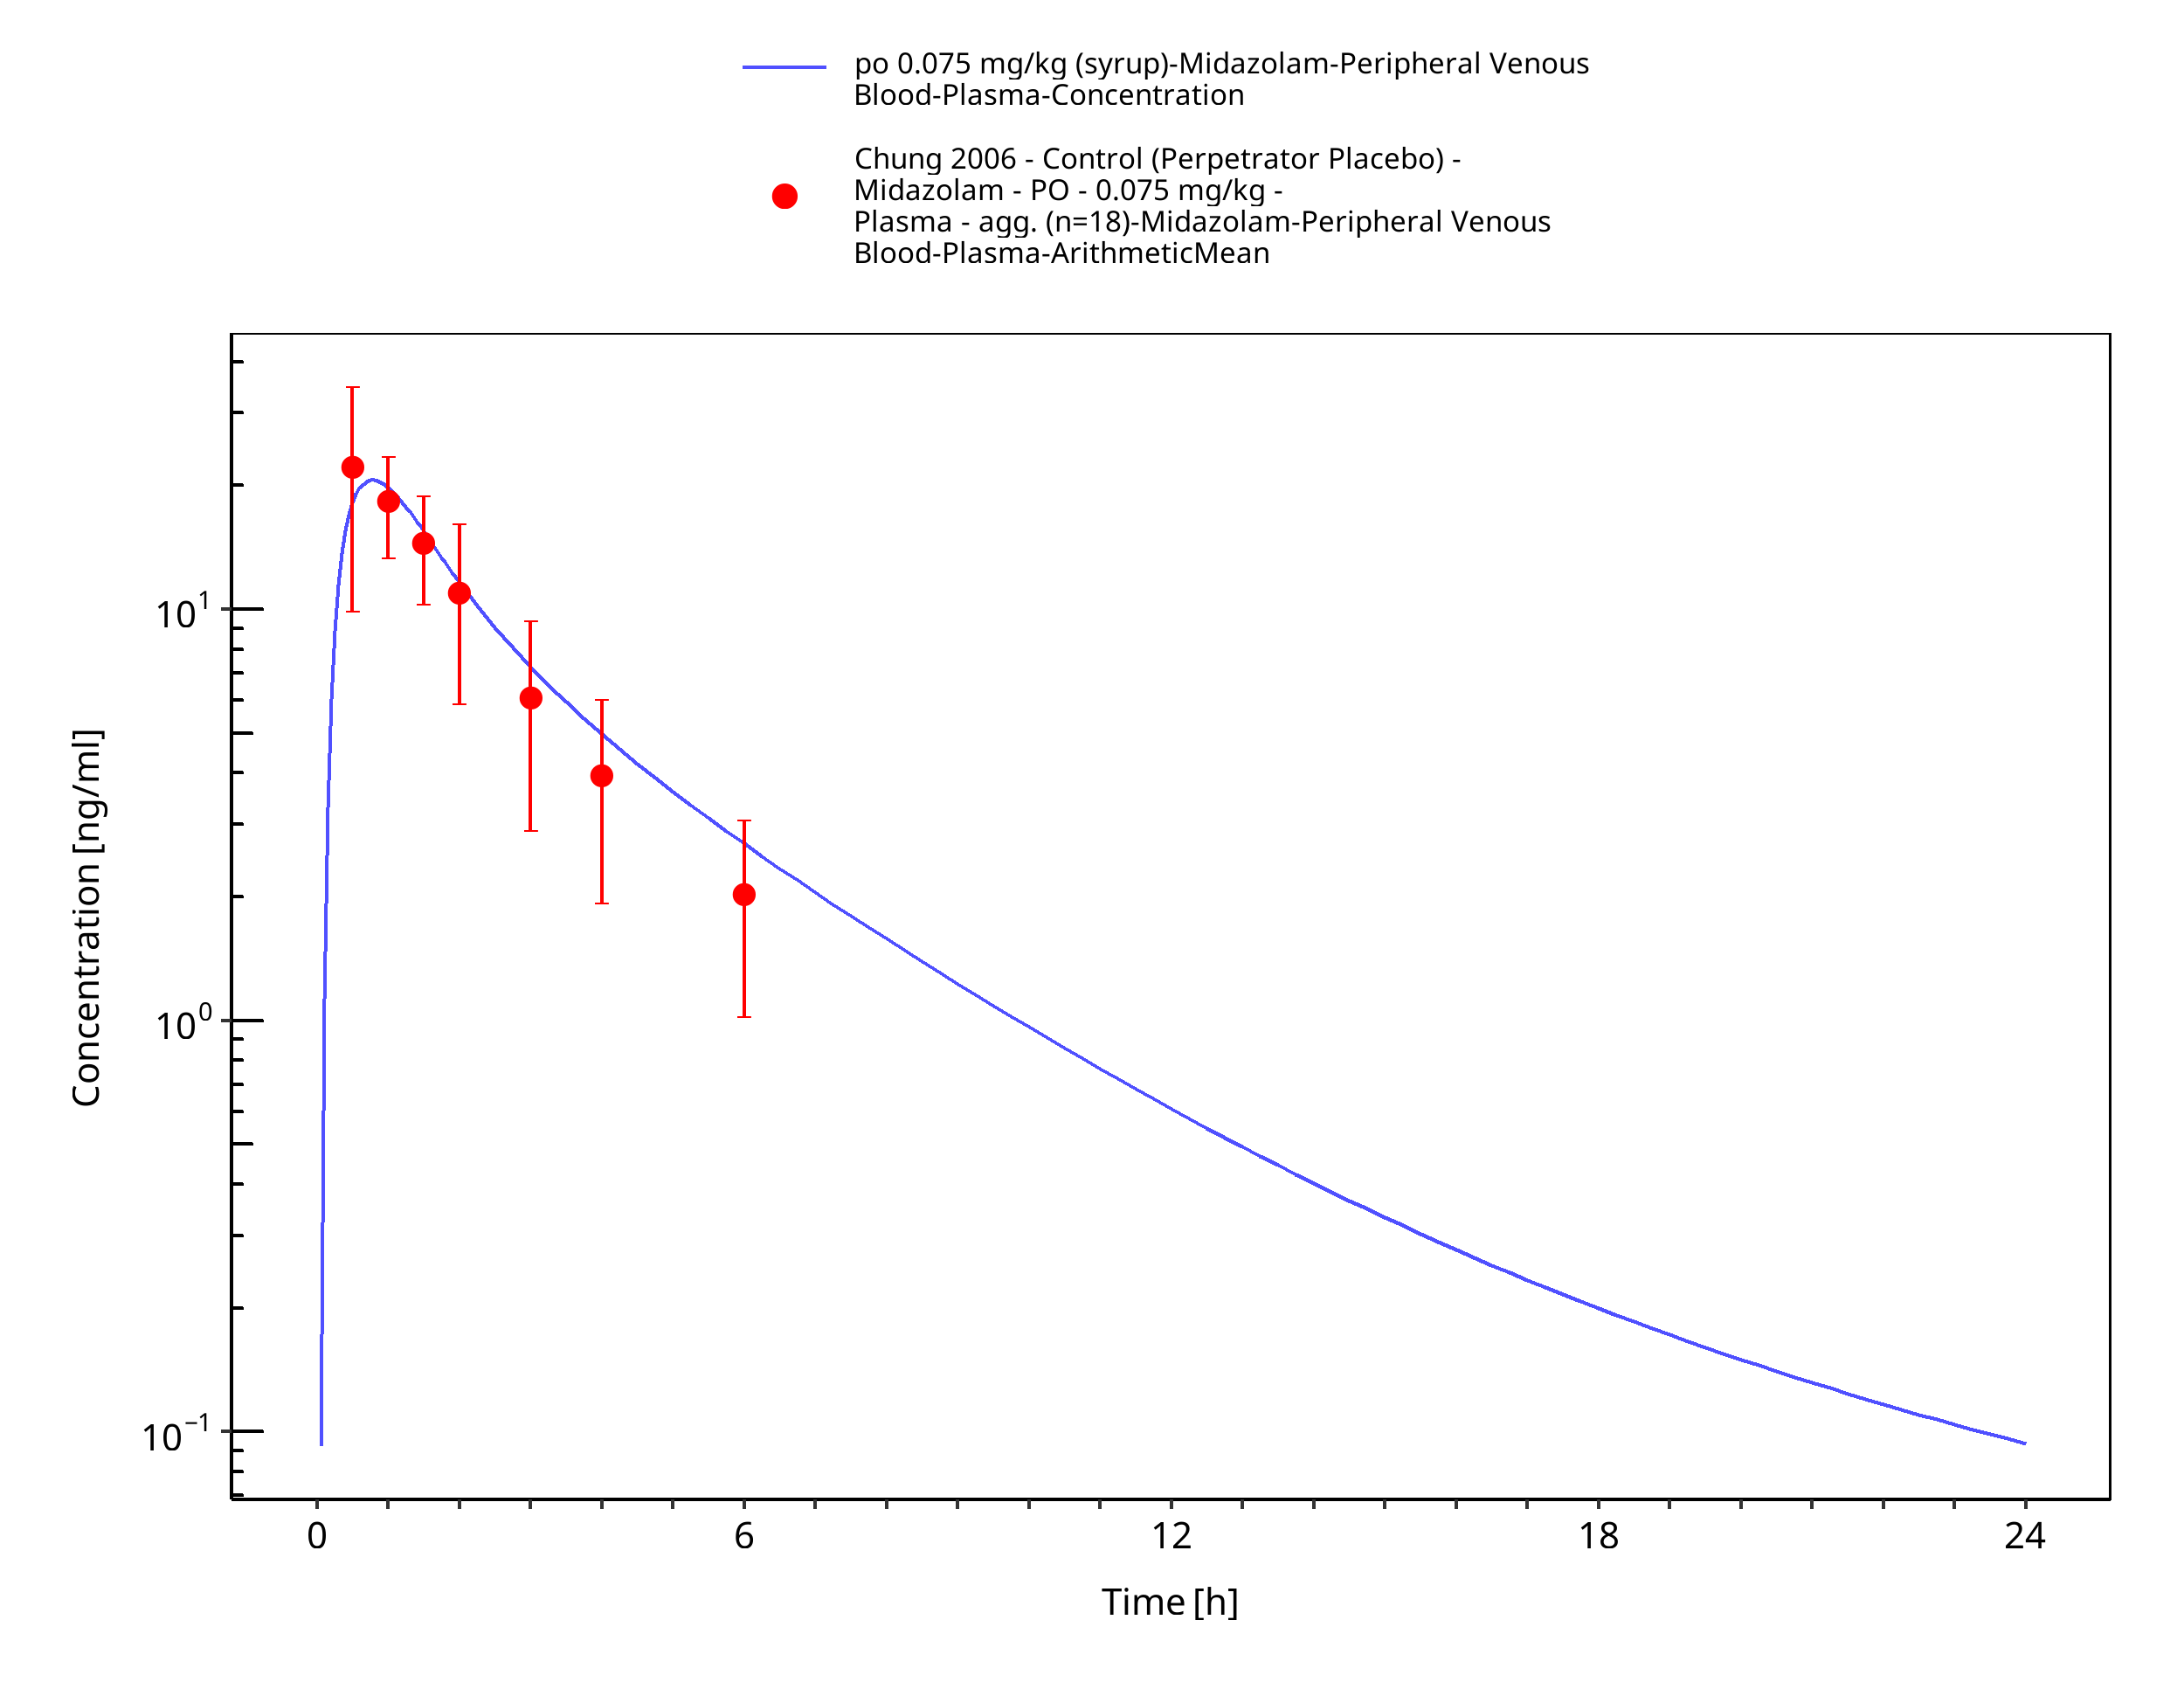
Figure 3-28: po 0.075 mg/kg (syrup) - Plasma
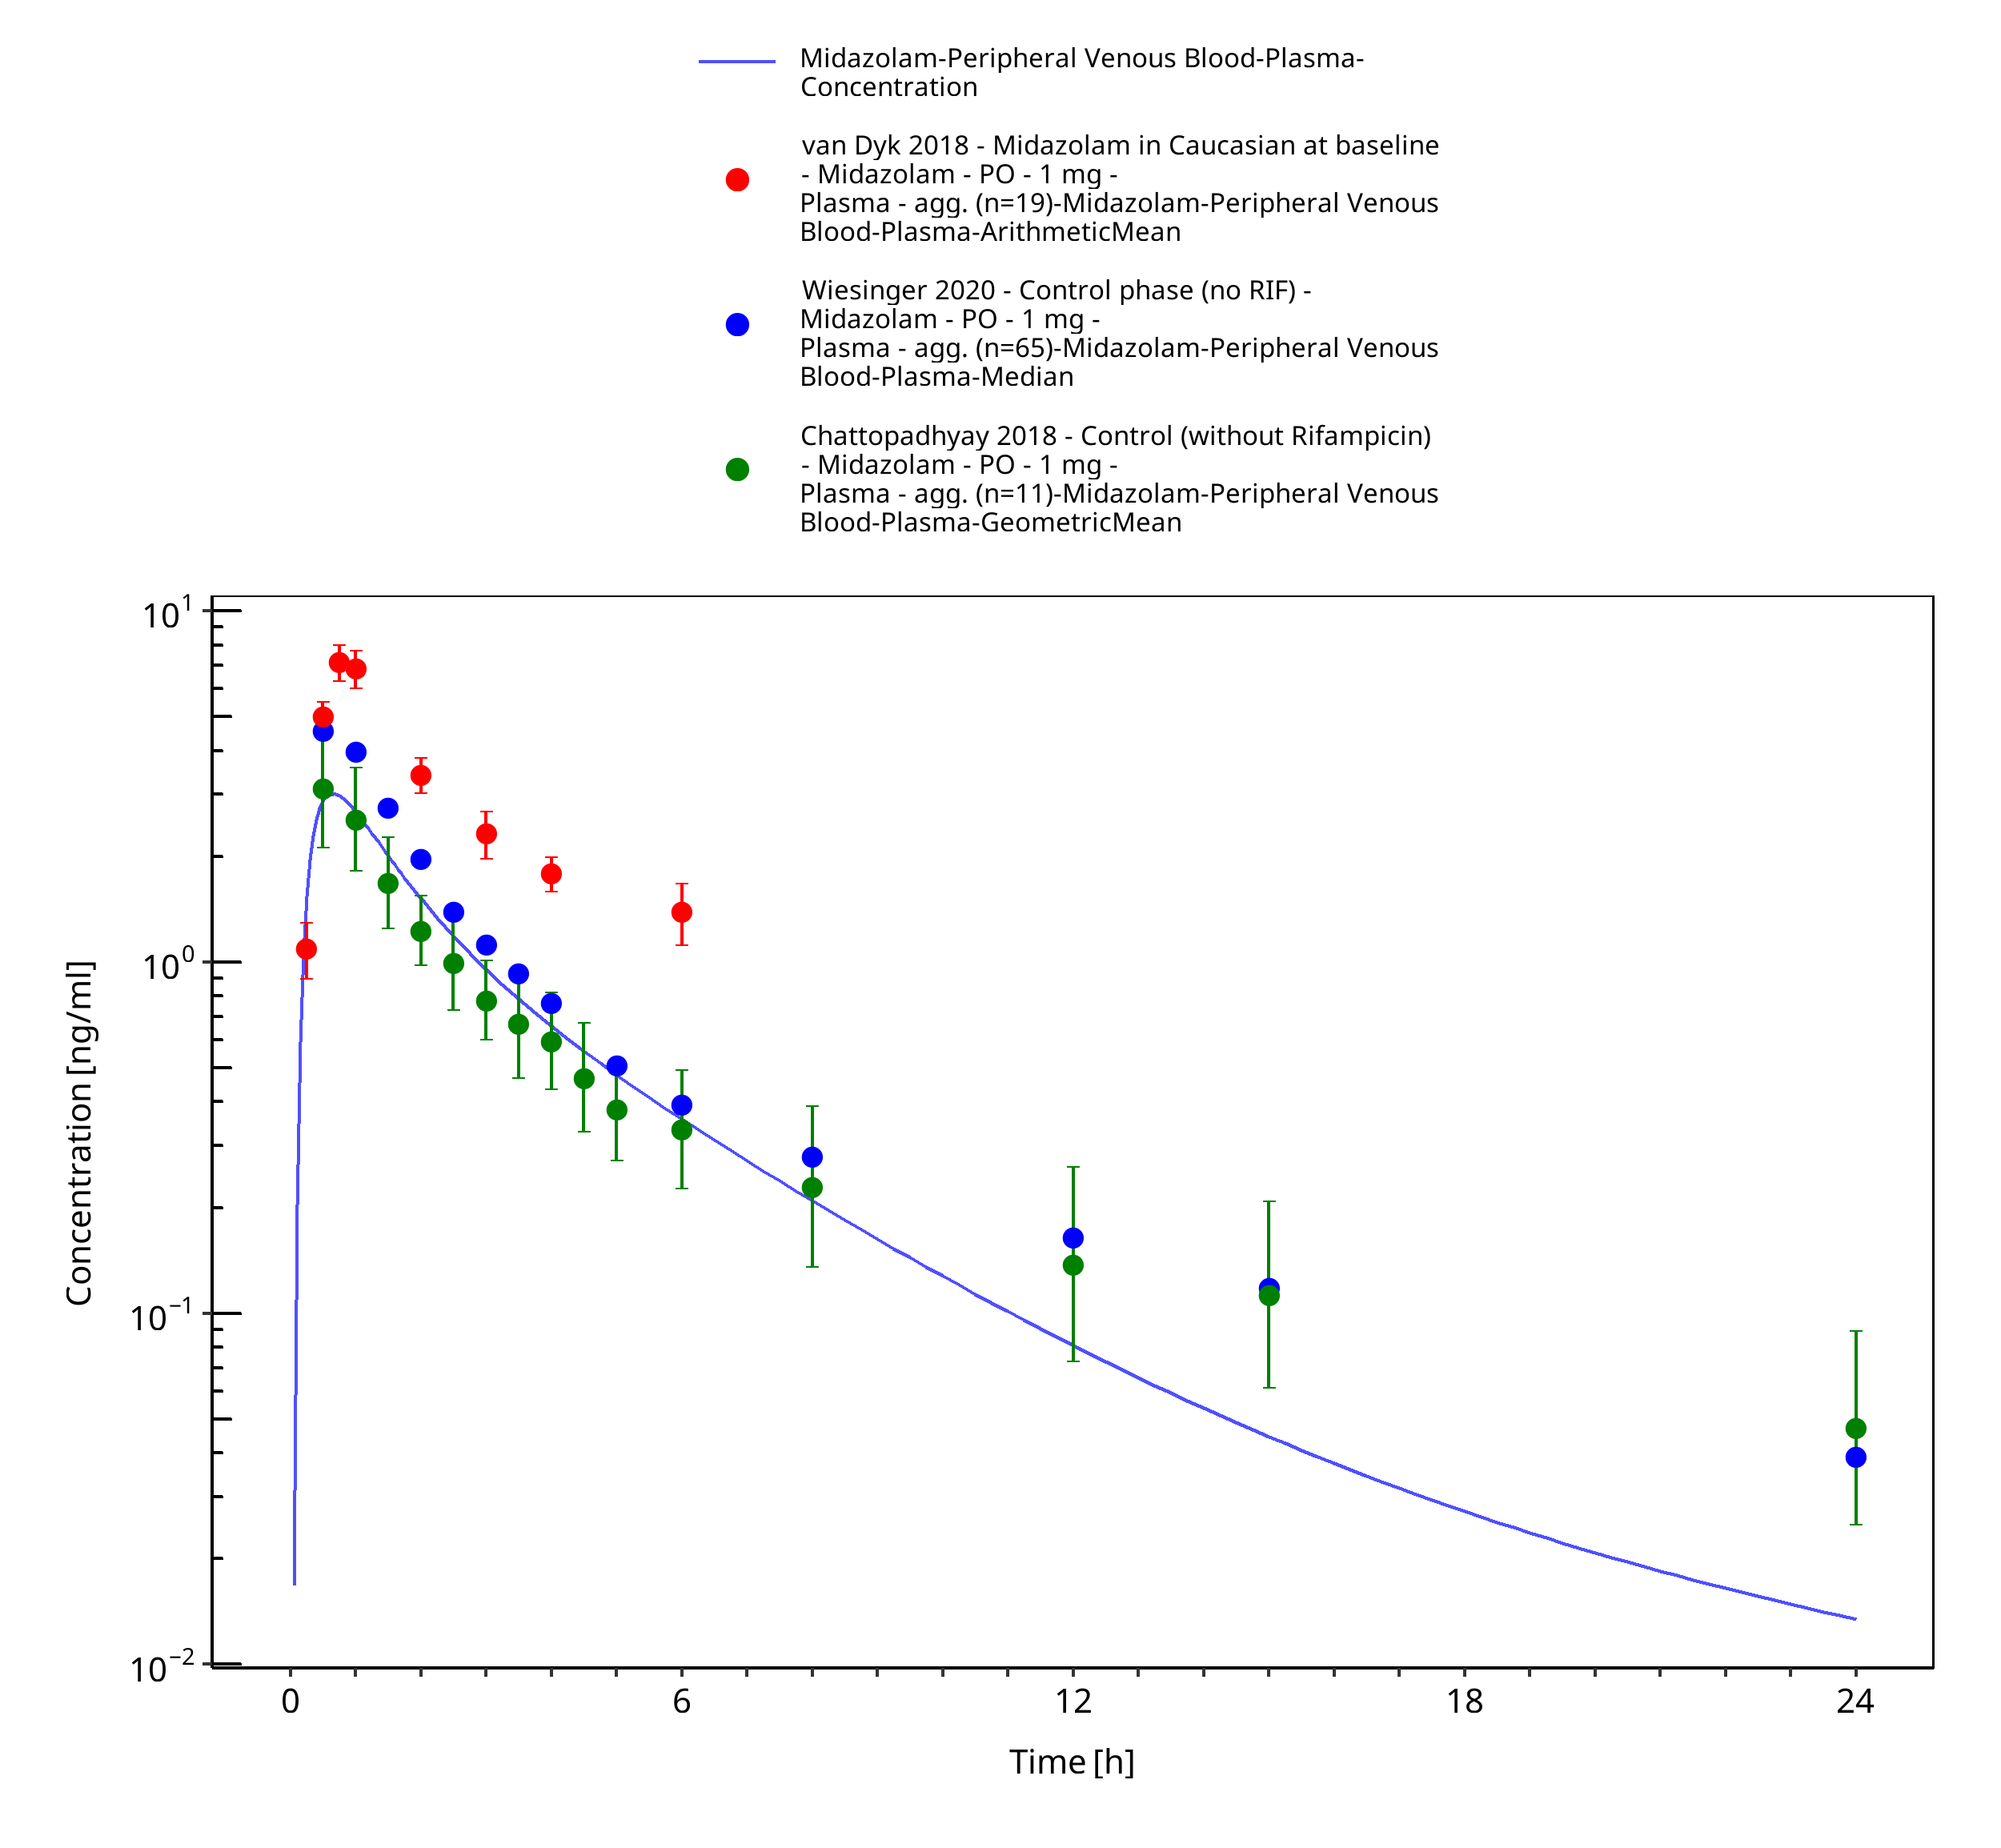
Figure 3-29: po 1 mg (solution) - Plasma
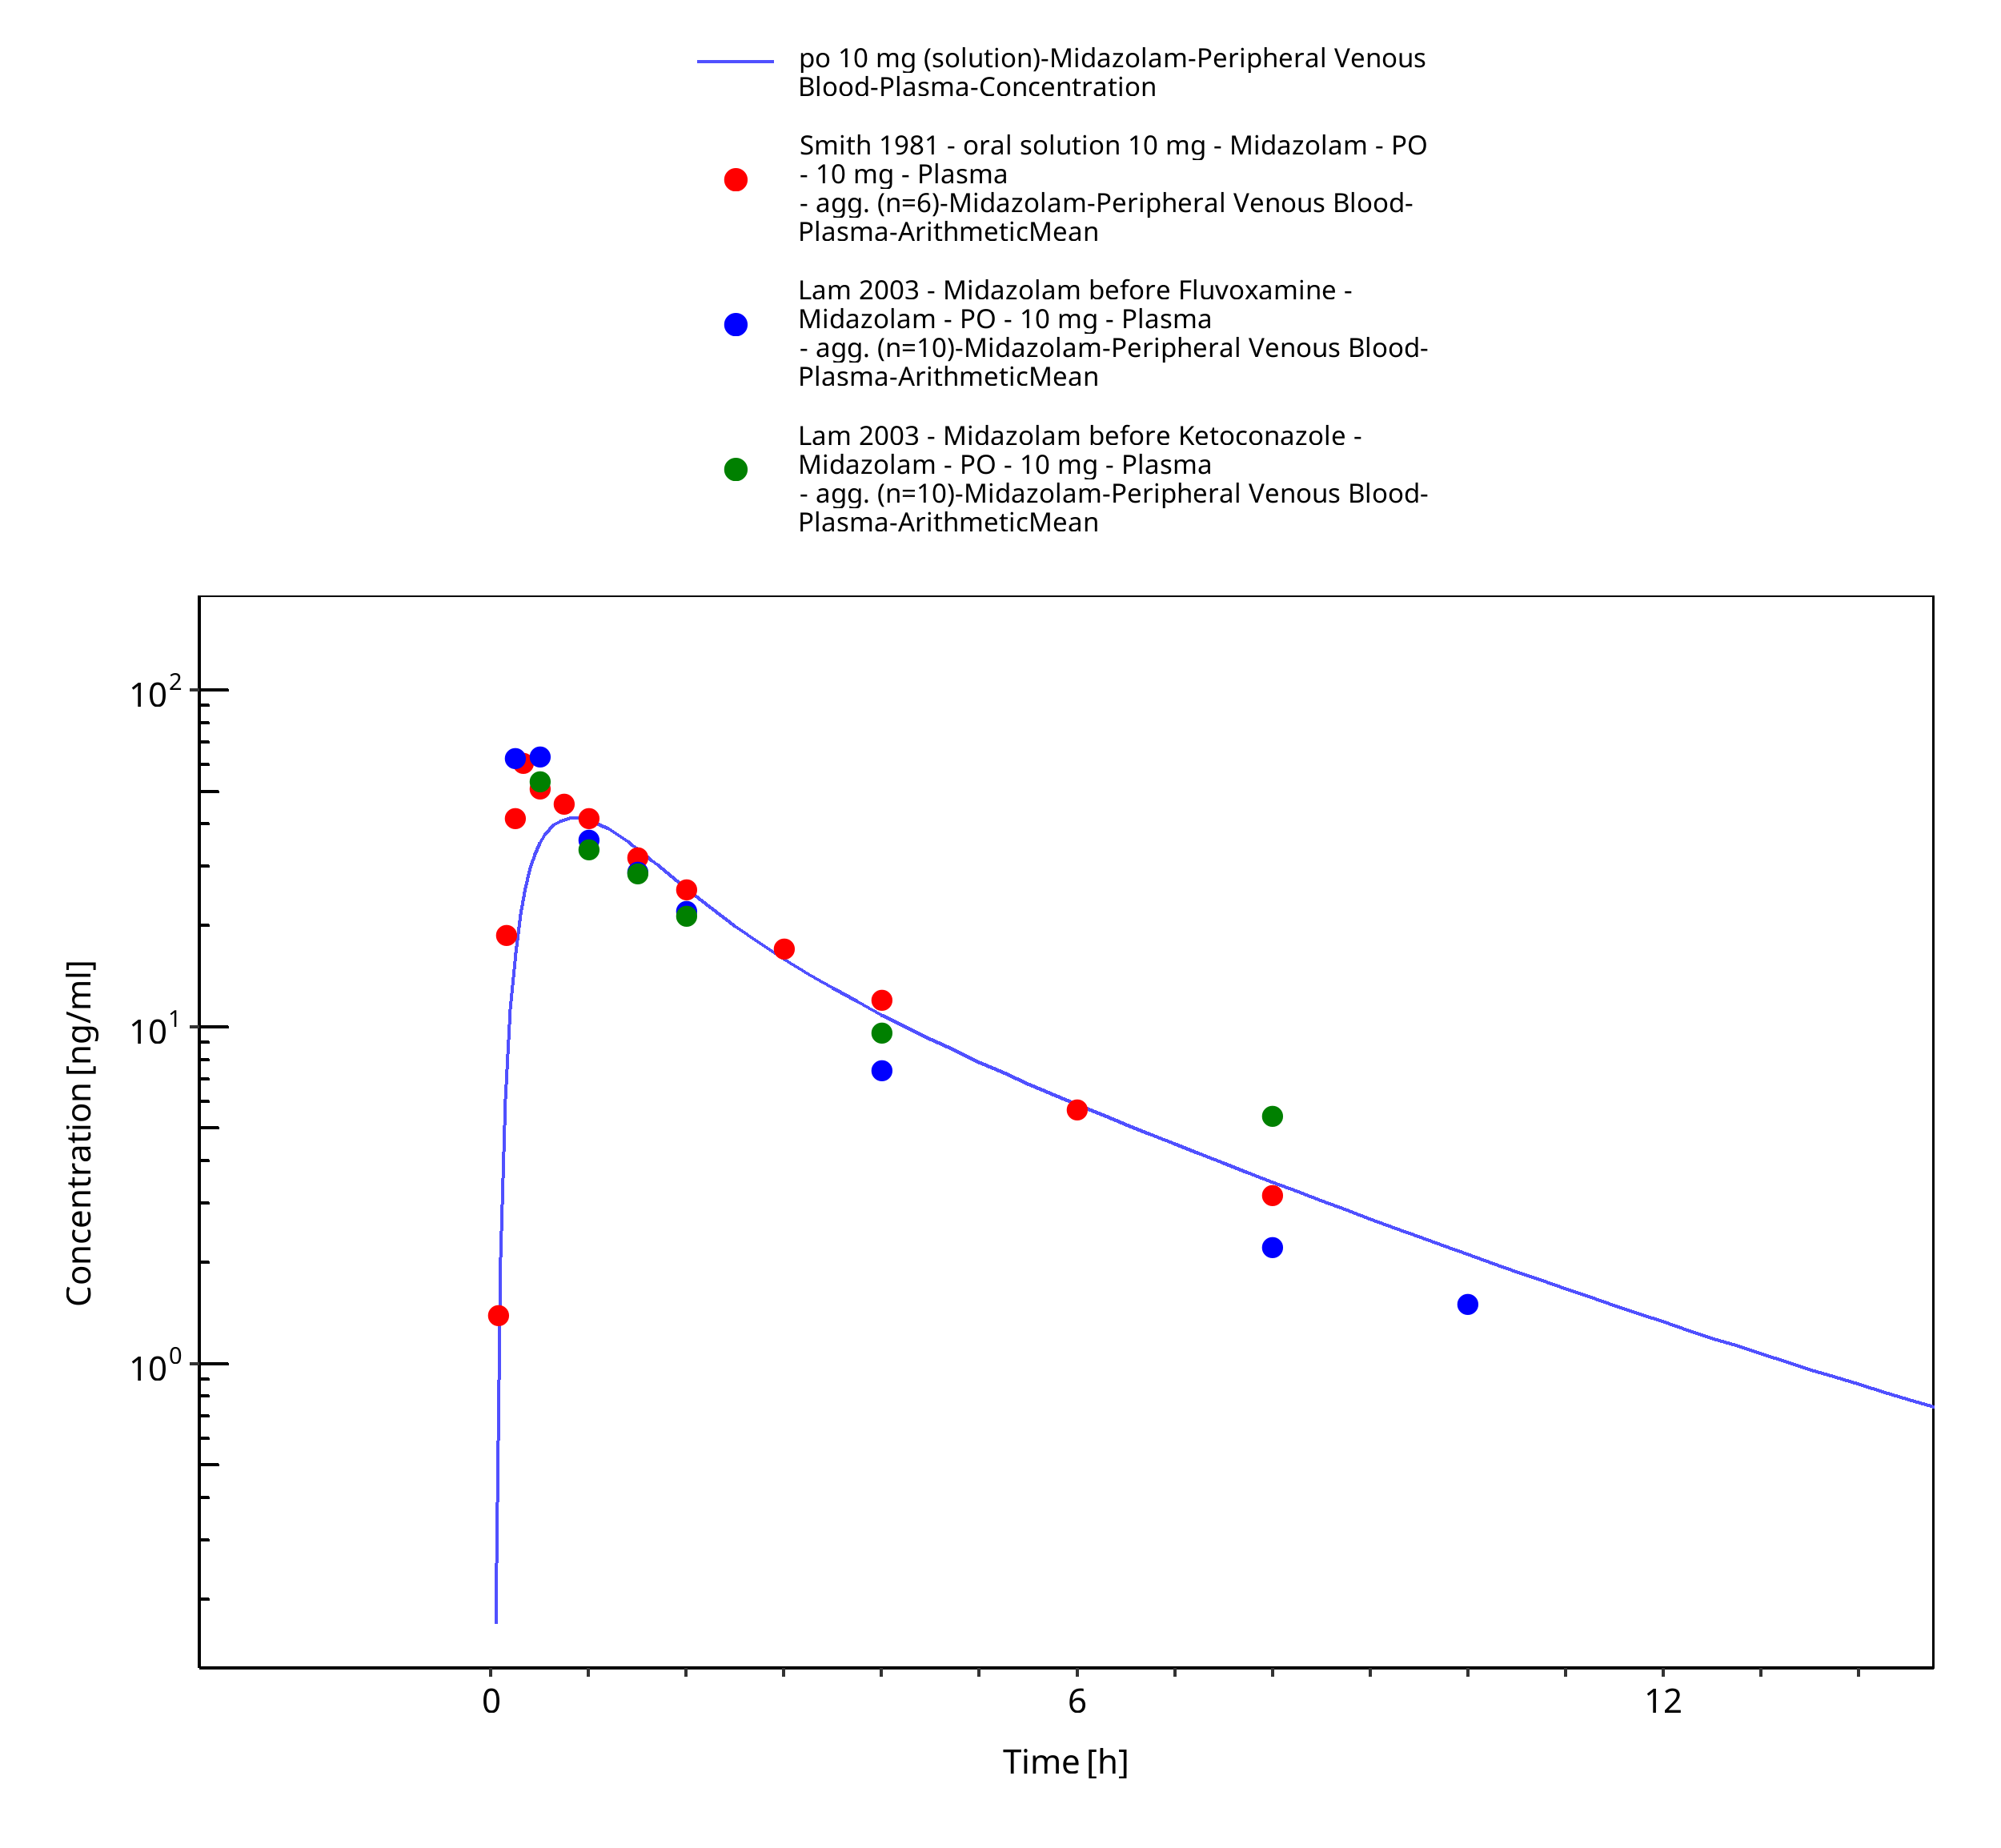
Figure 3-30: po 10 mg (solution) - Plasma
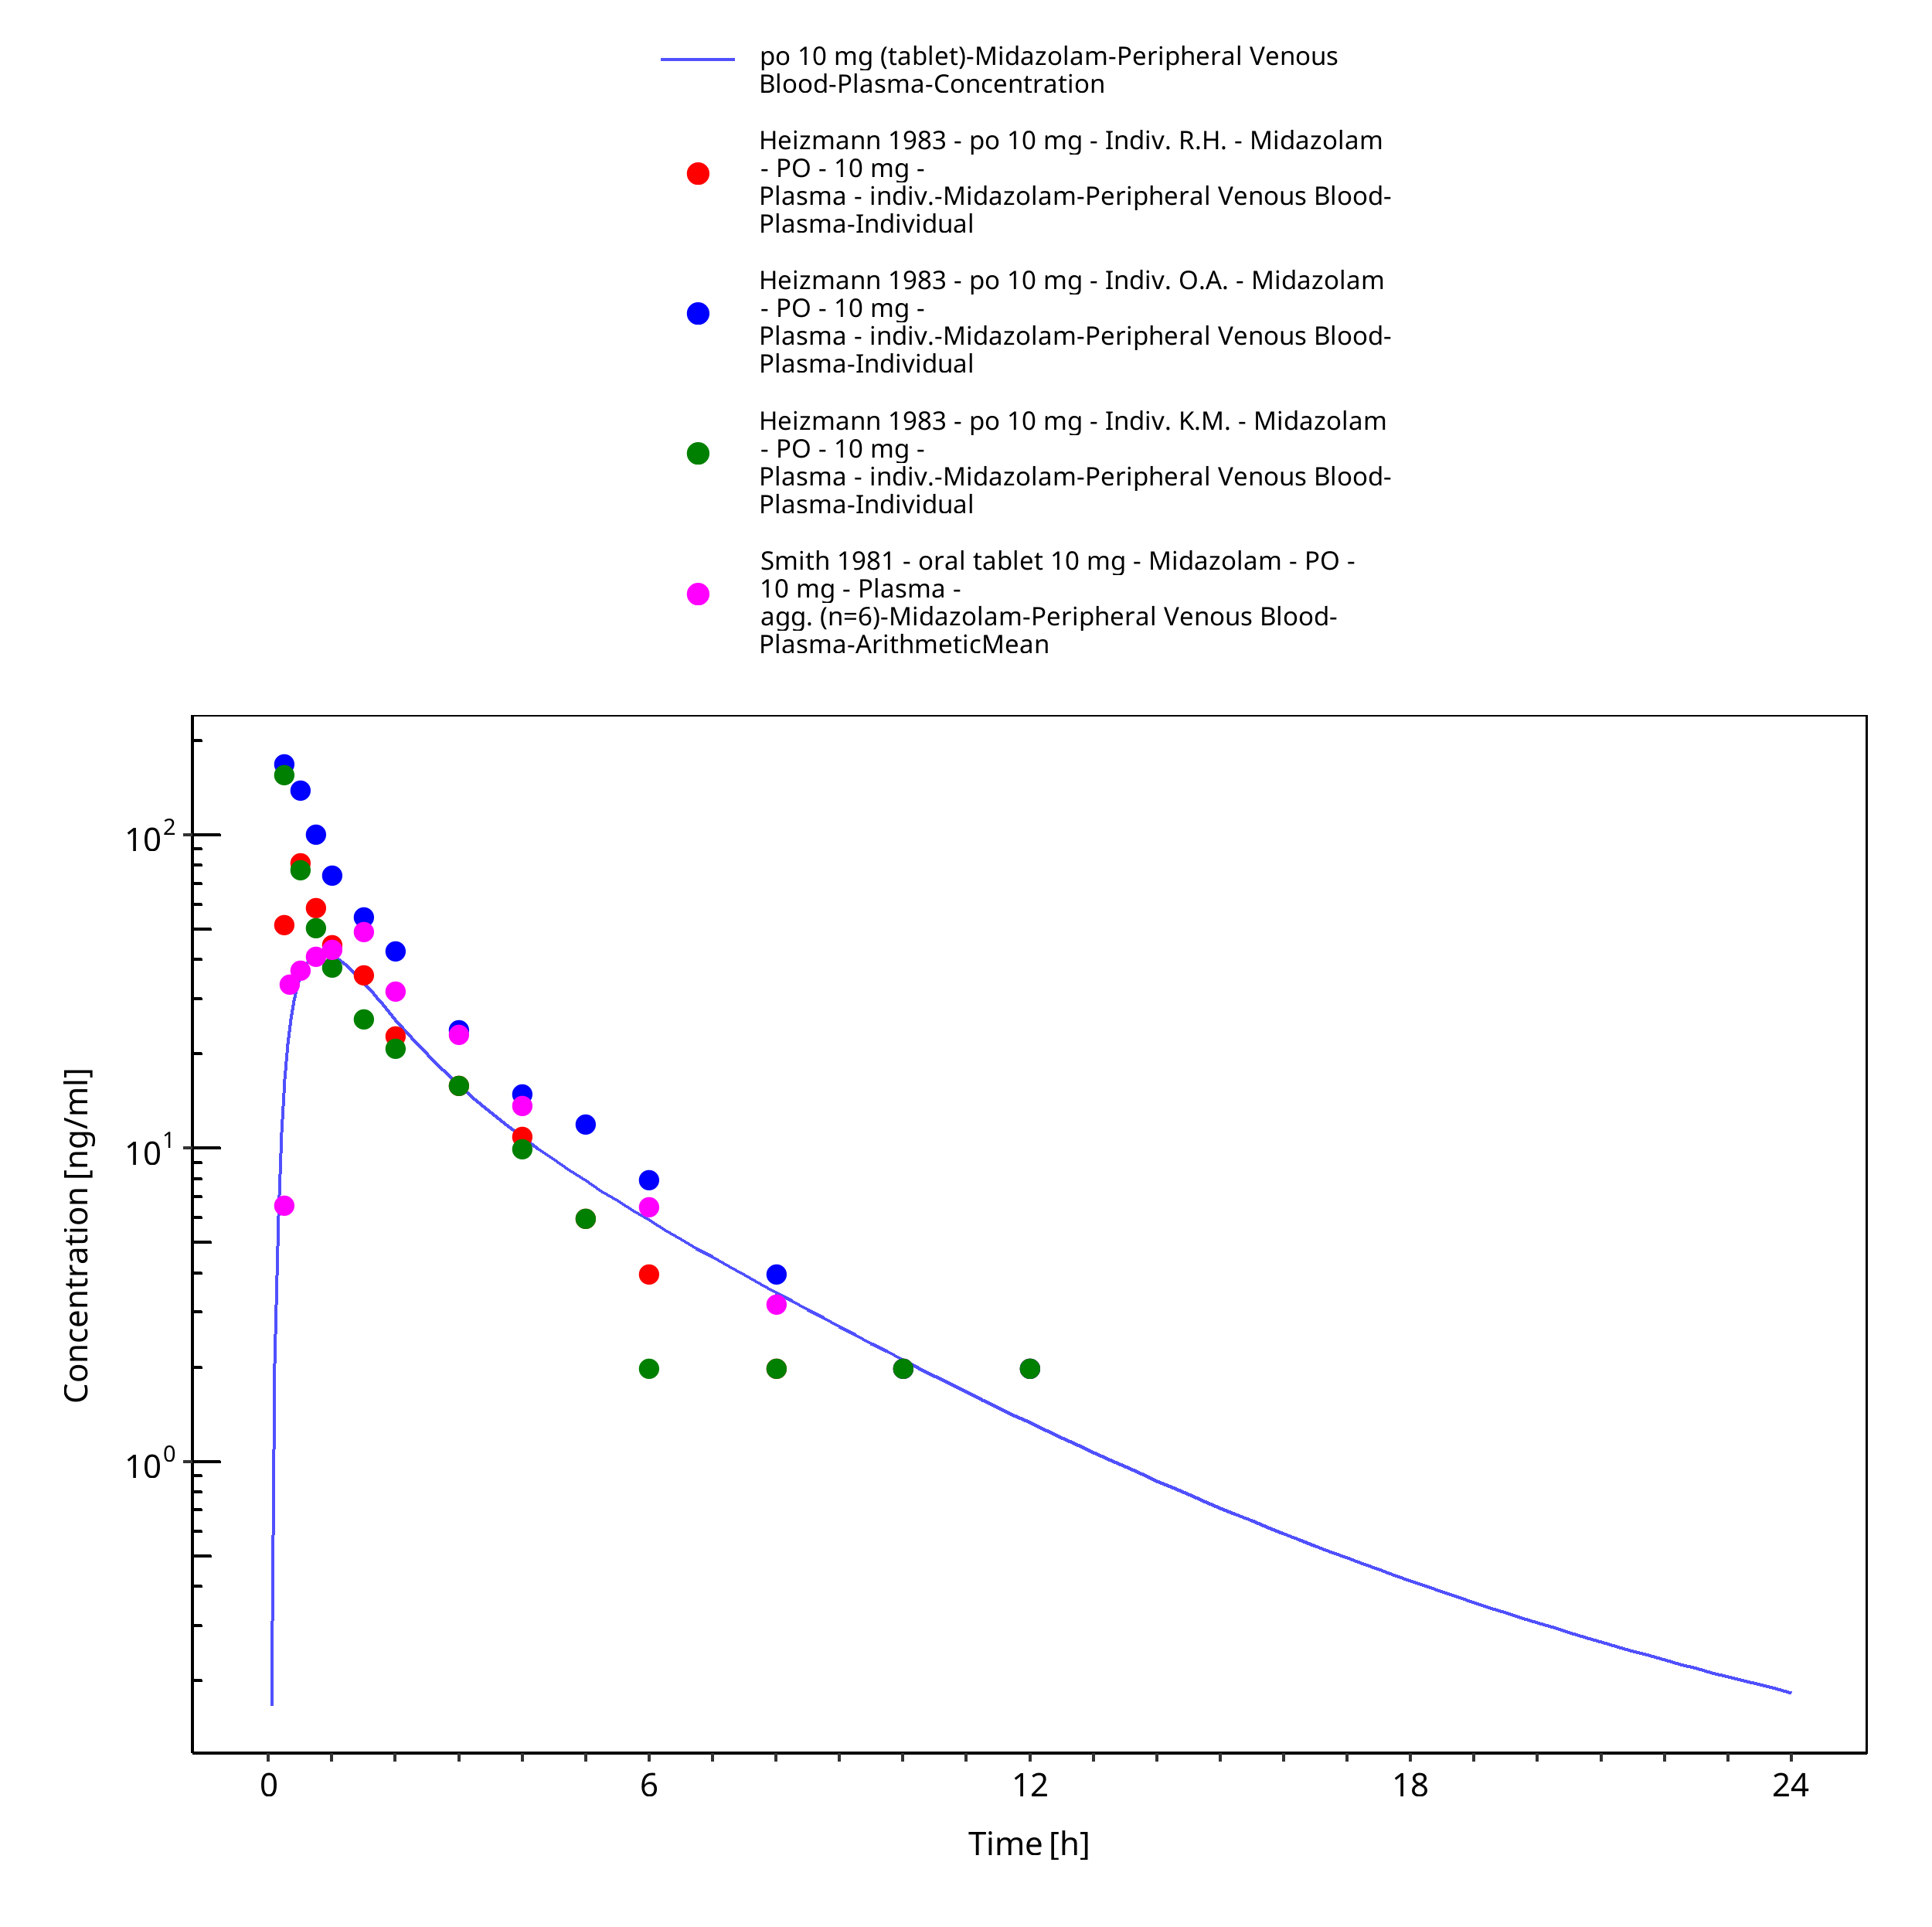
Figure 3-31: po 10 mg (tablet) - Plasma
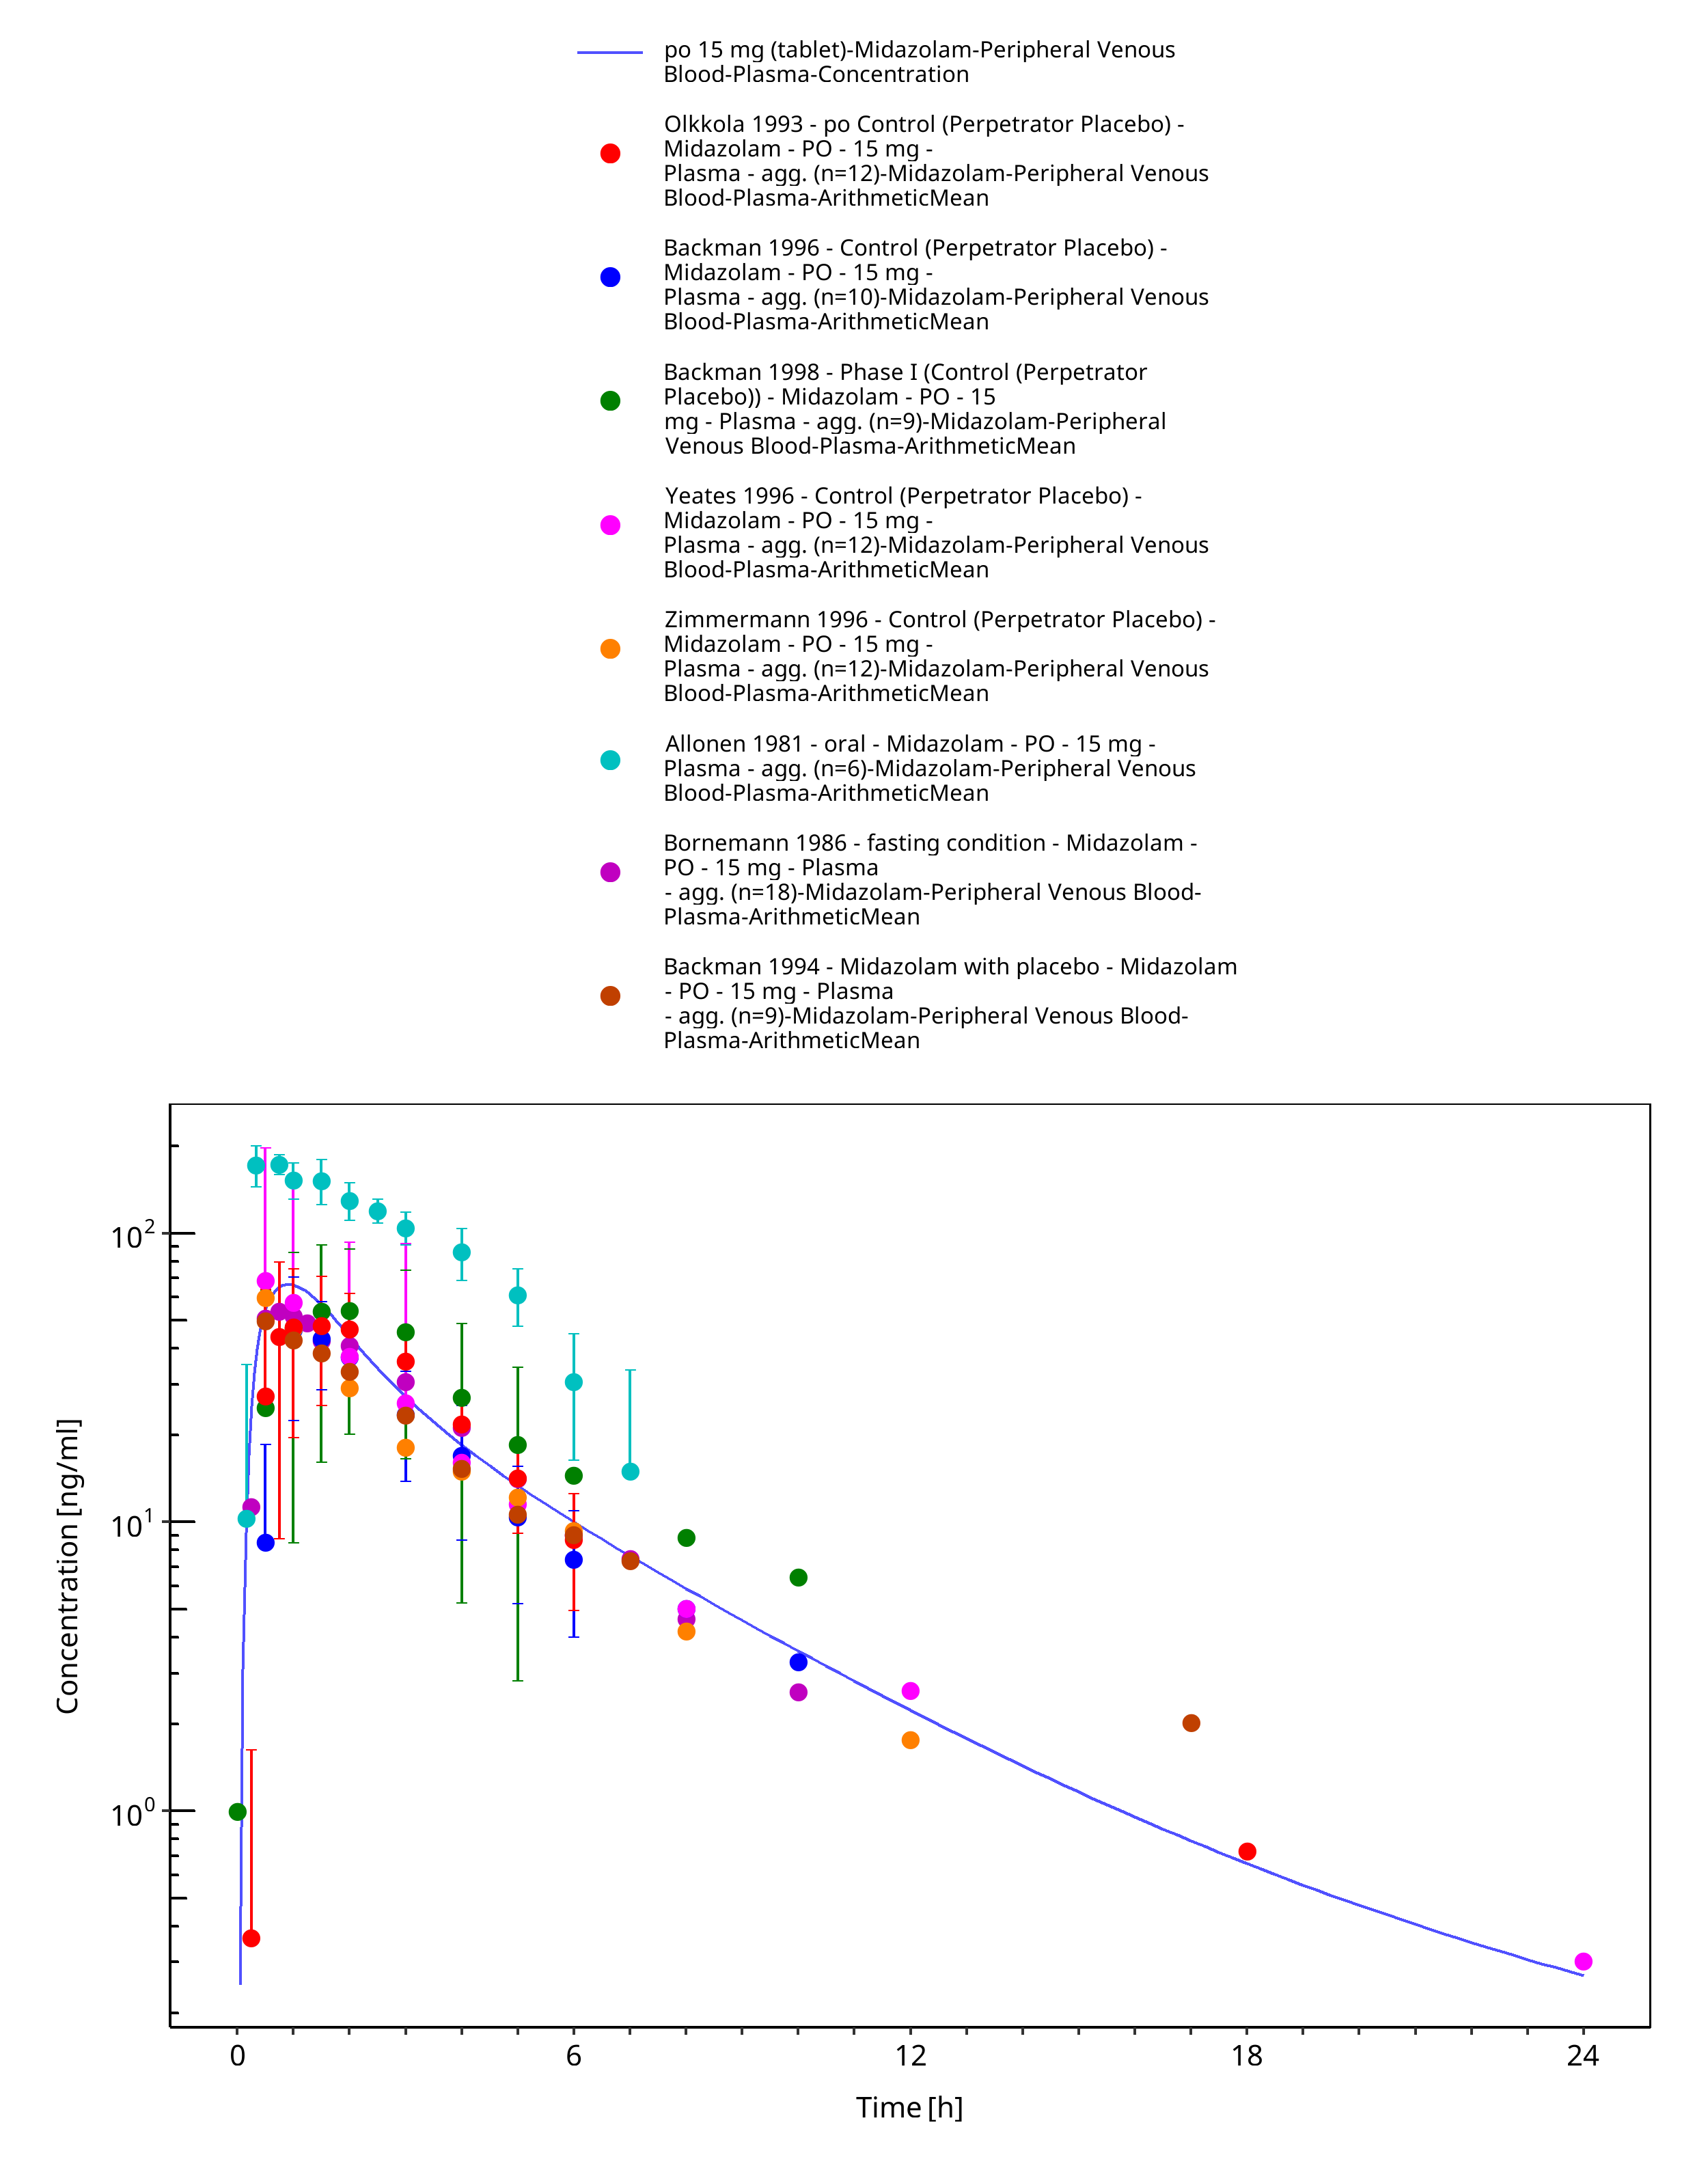
Figure 3-32: po 15 mg (tablet) - Plasma
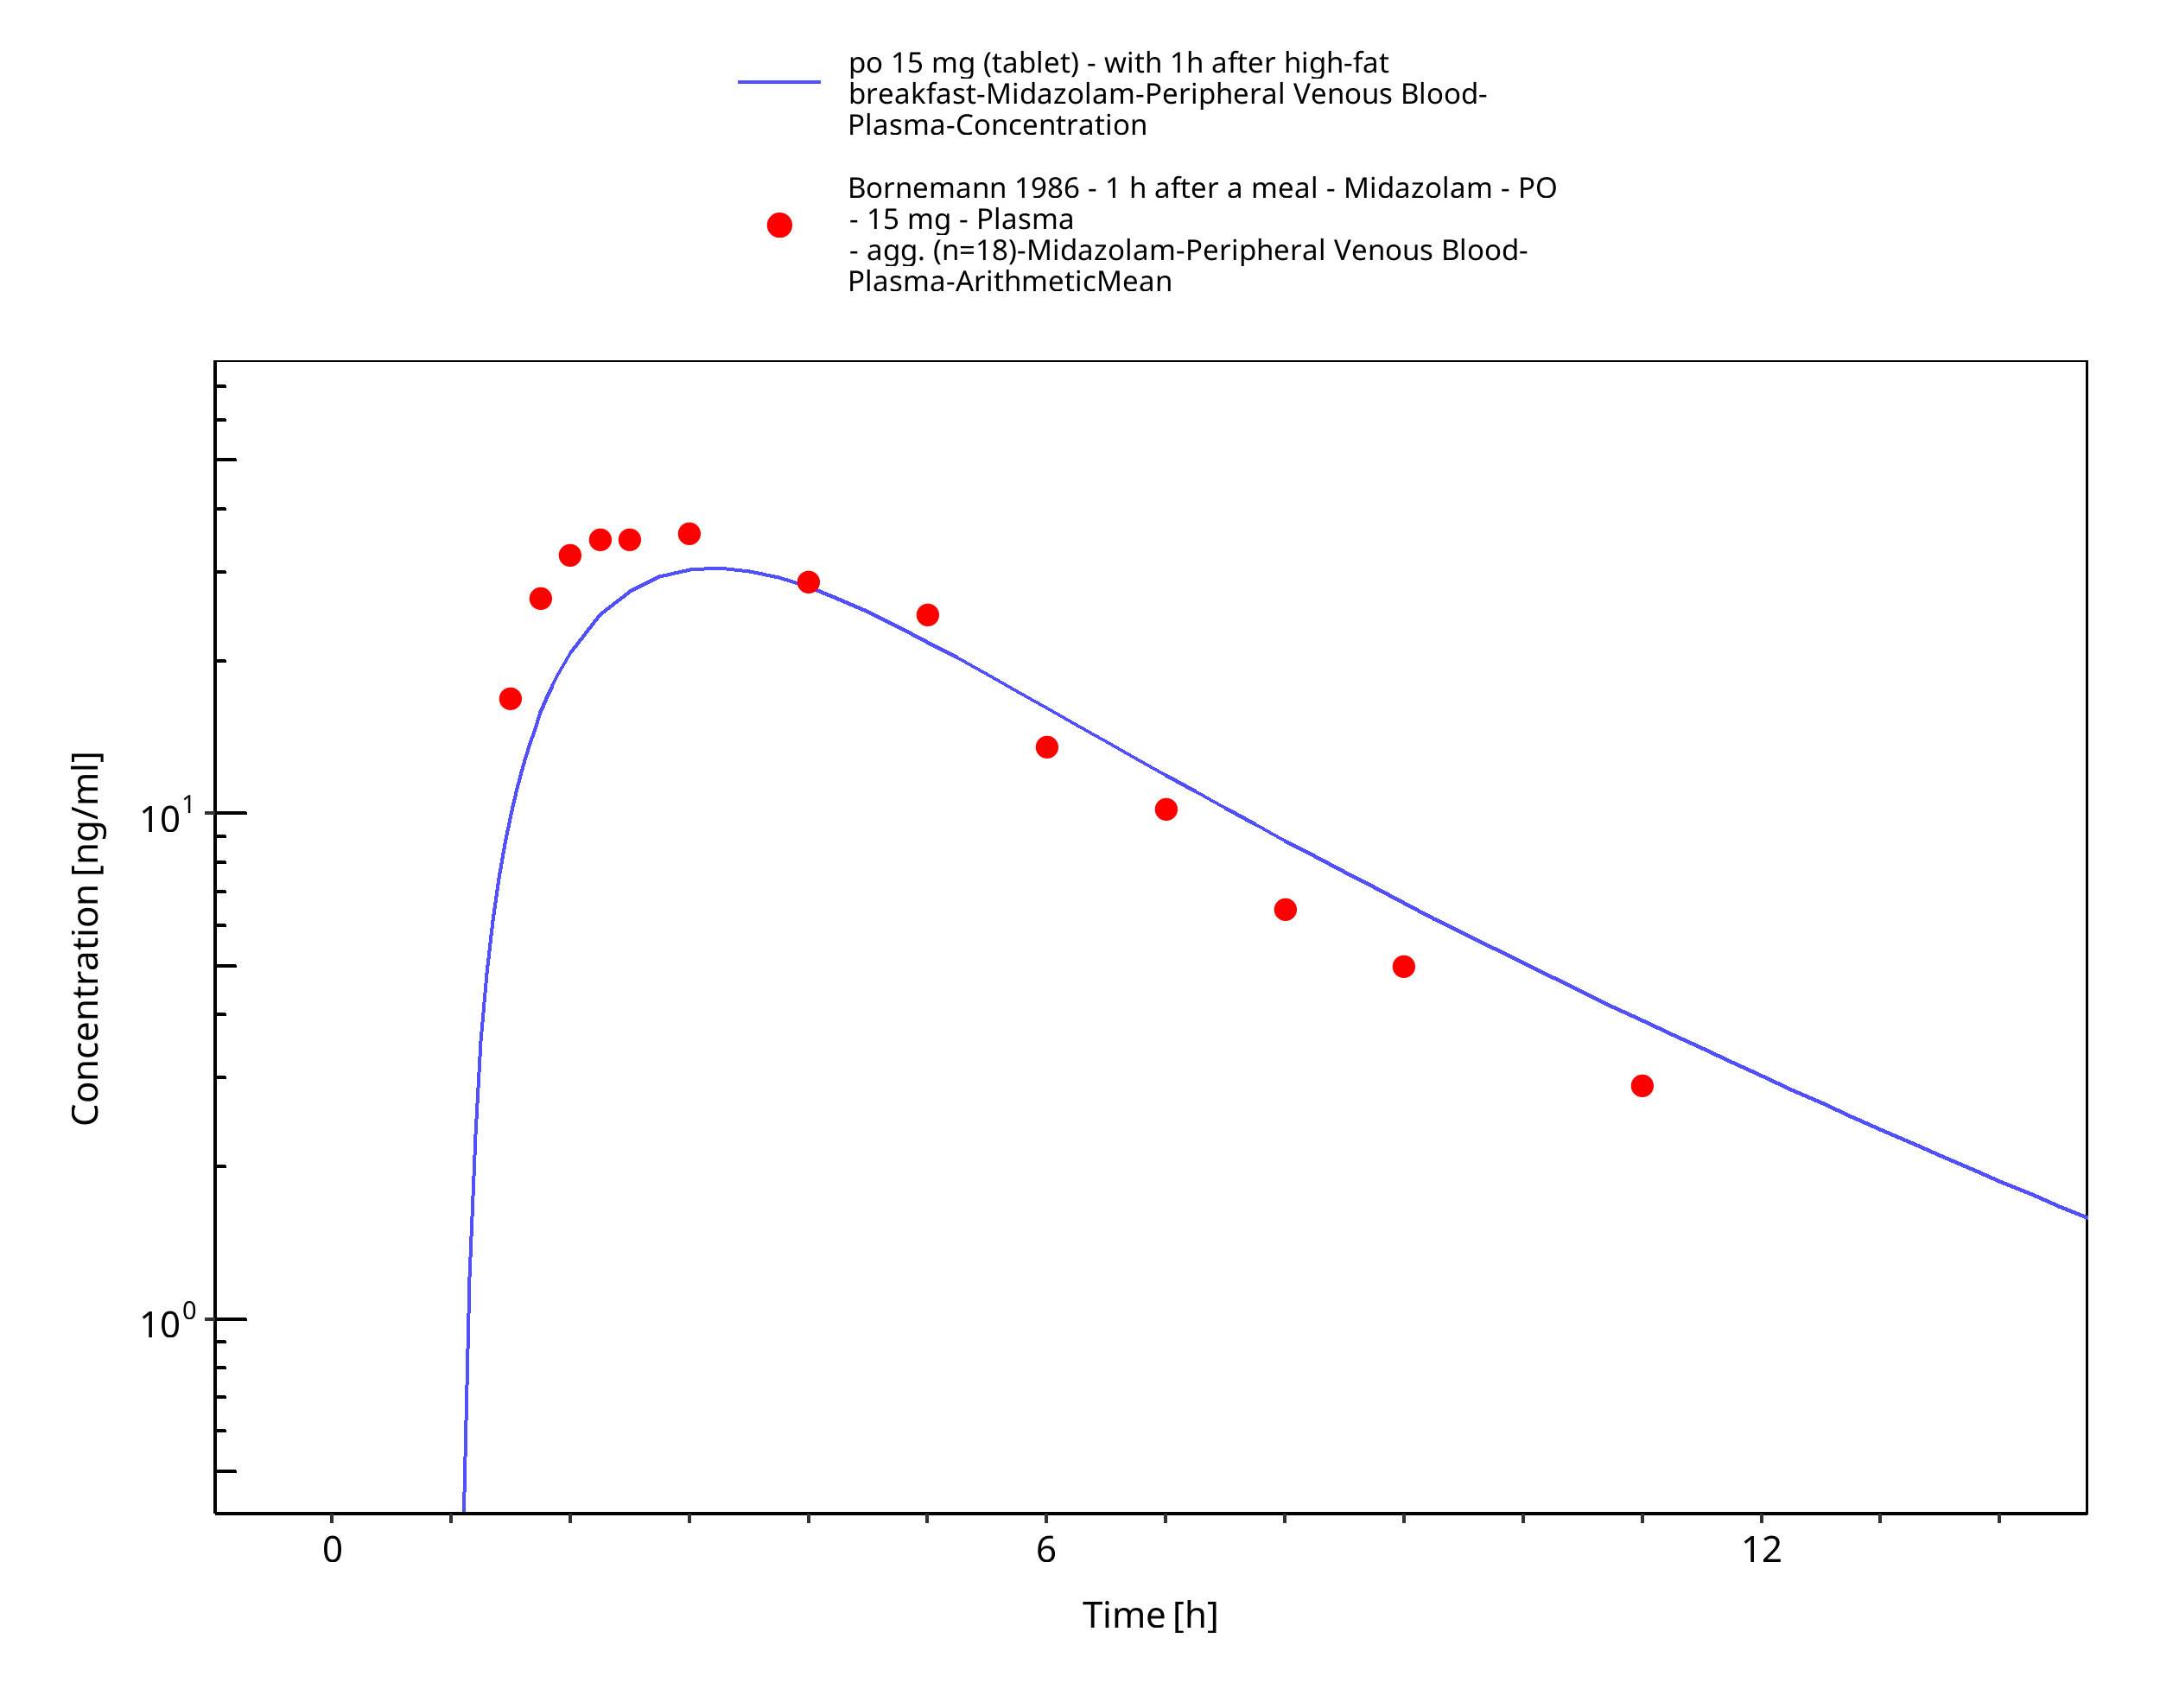
Figure 3-33: po 15 mg (tablet) - with 1h after high-fat breakfast - Plasma
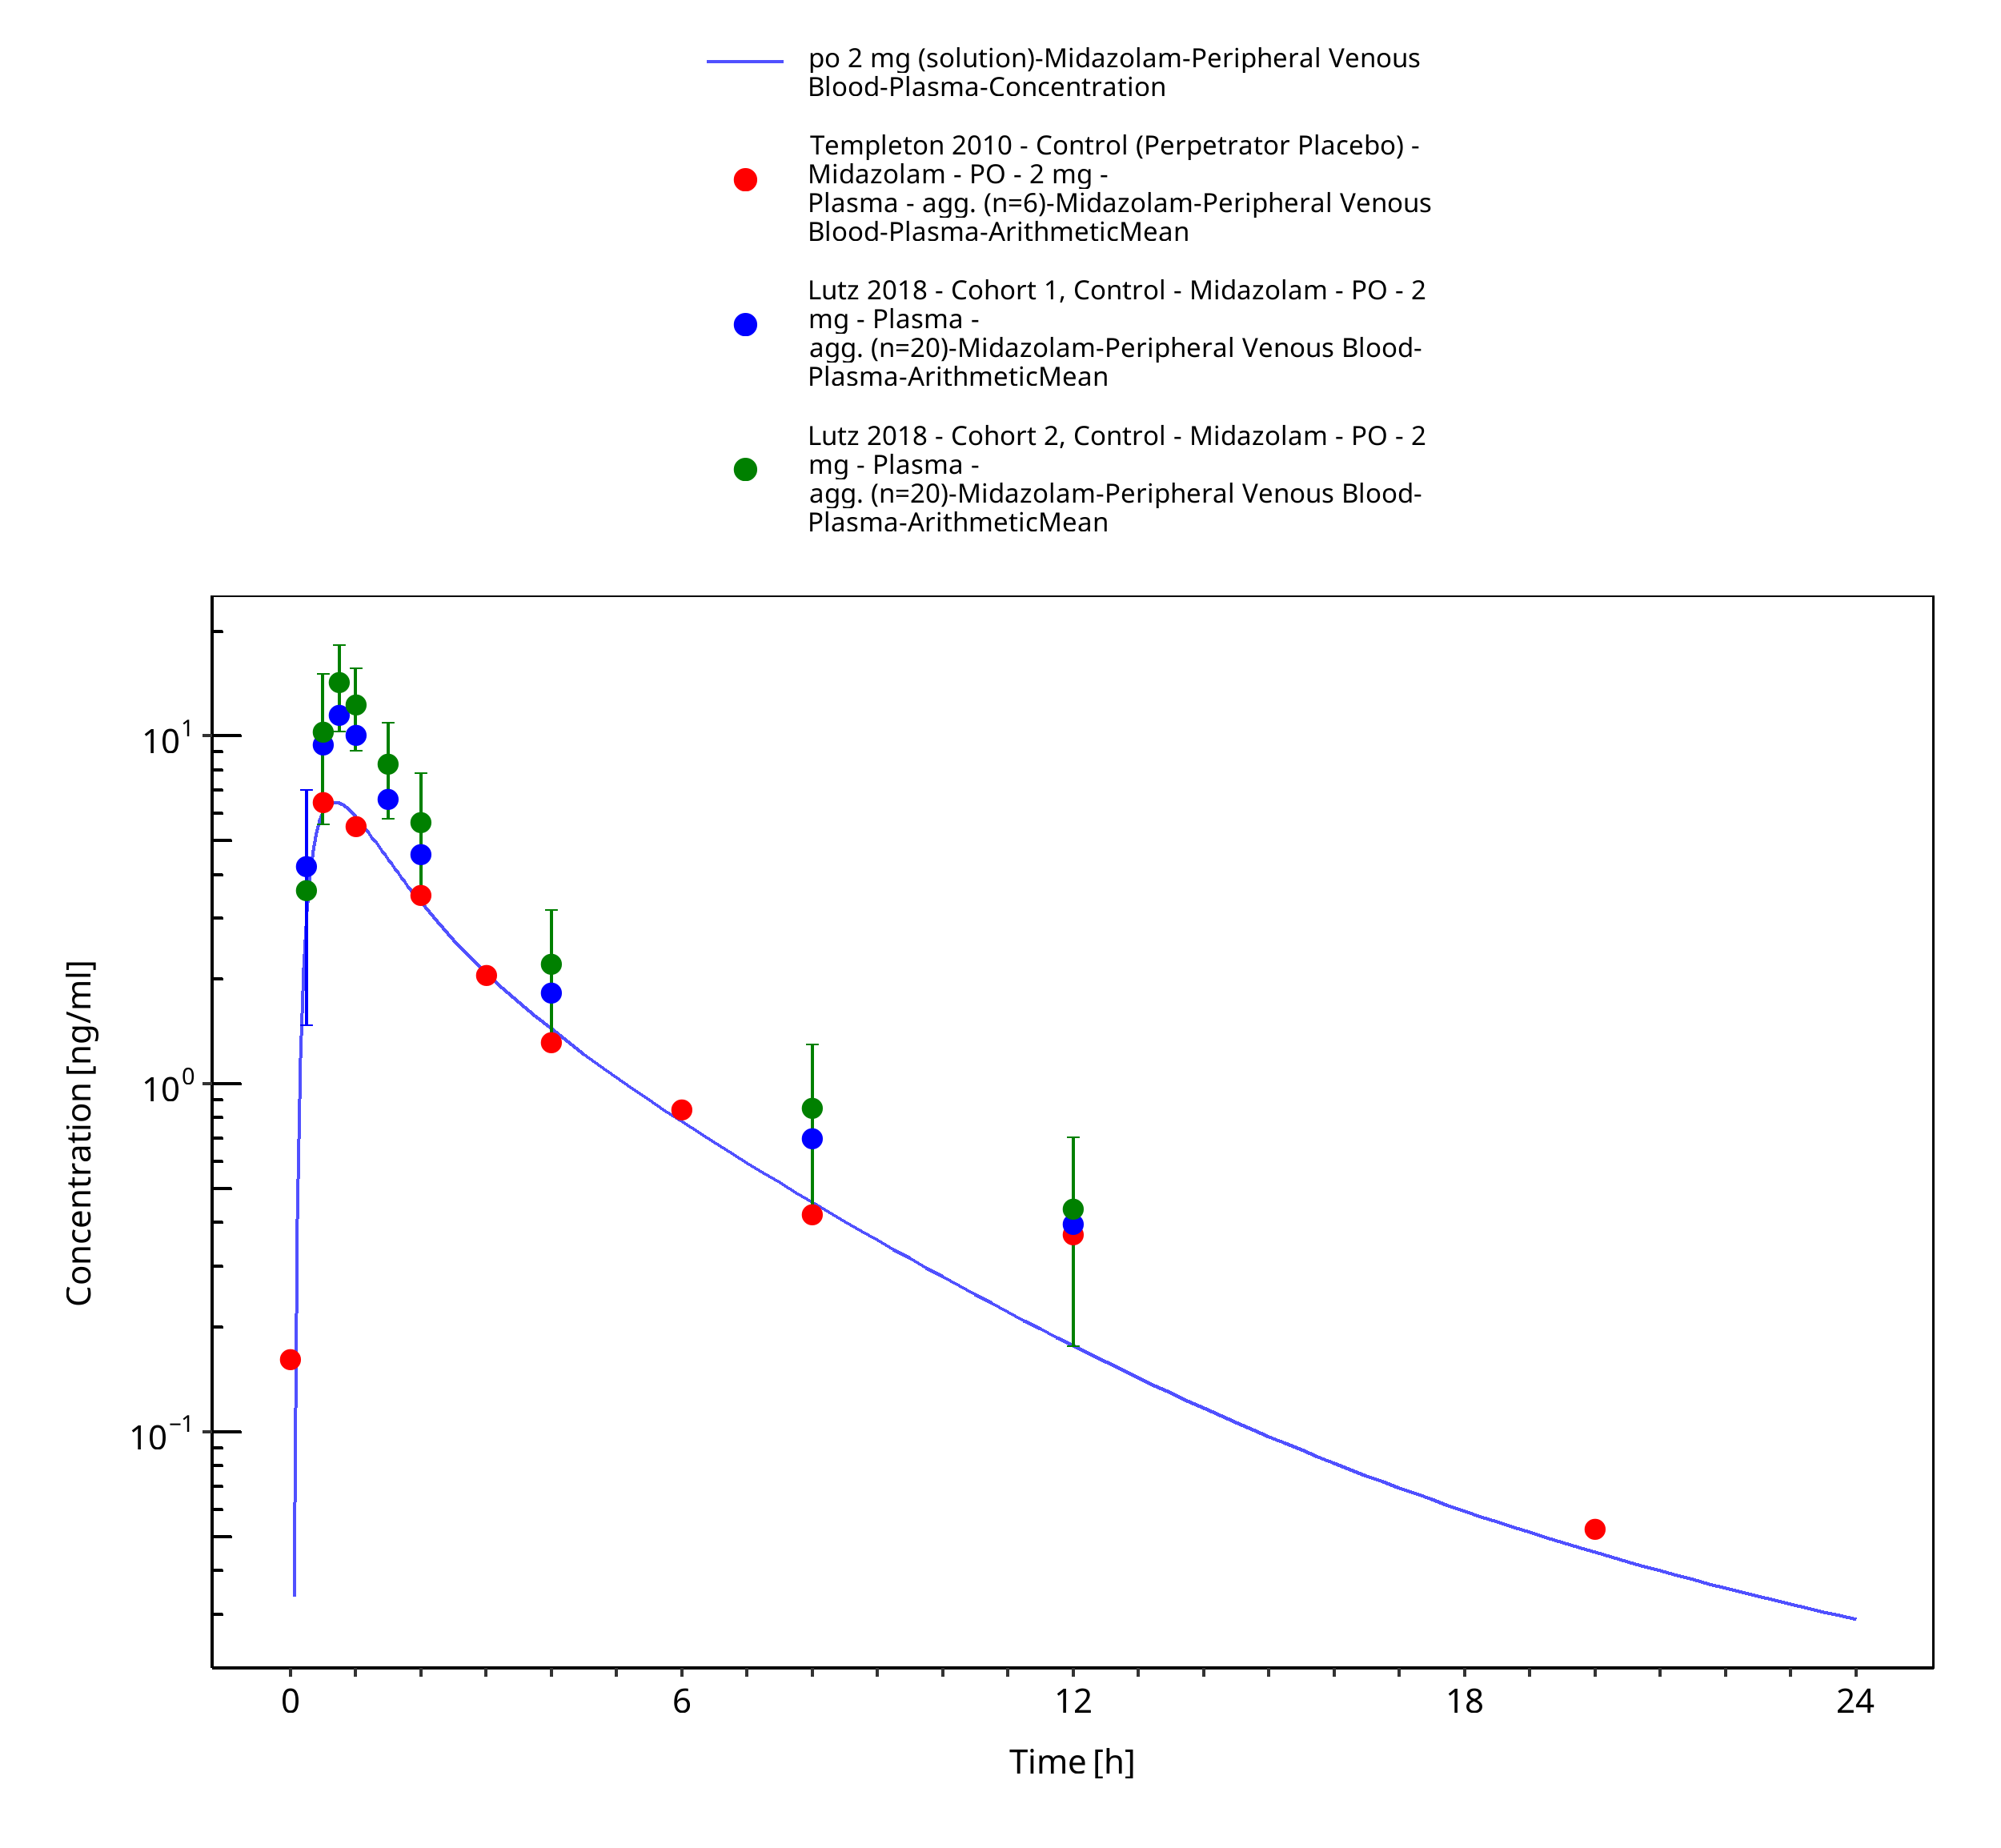
Figure 3-34: po 2 mg (solution) - Plasma
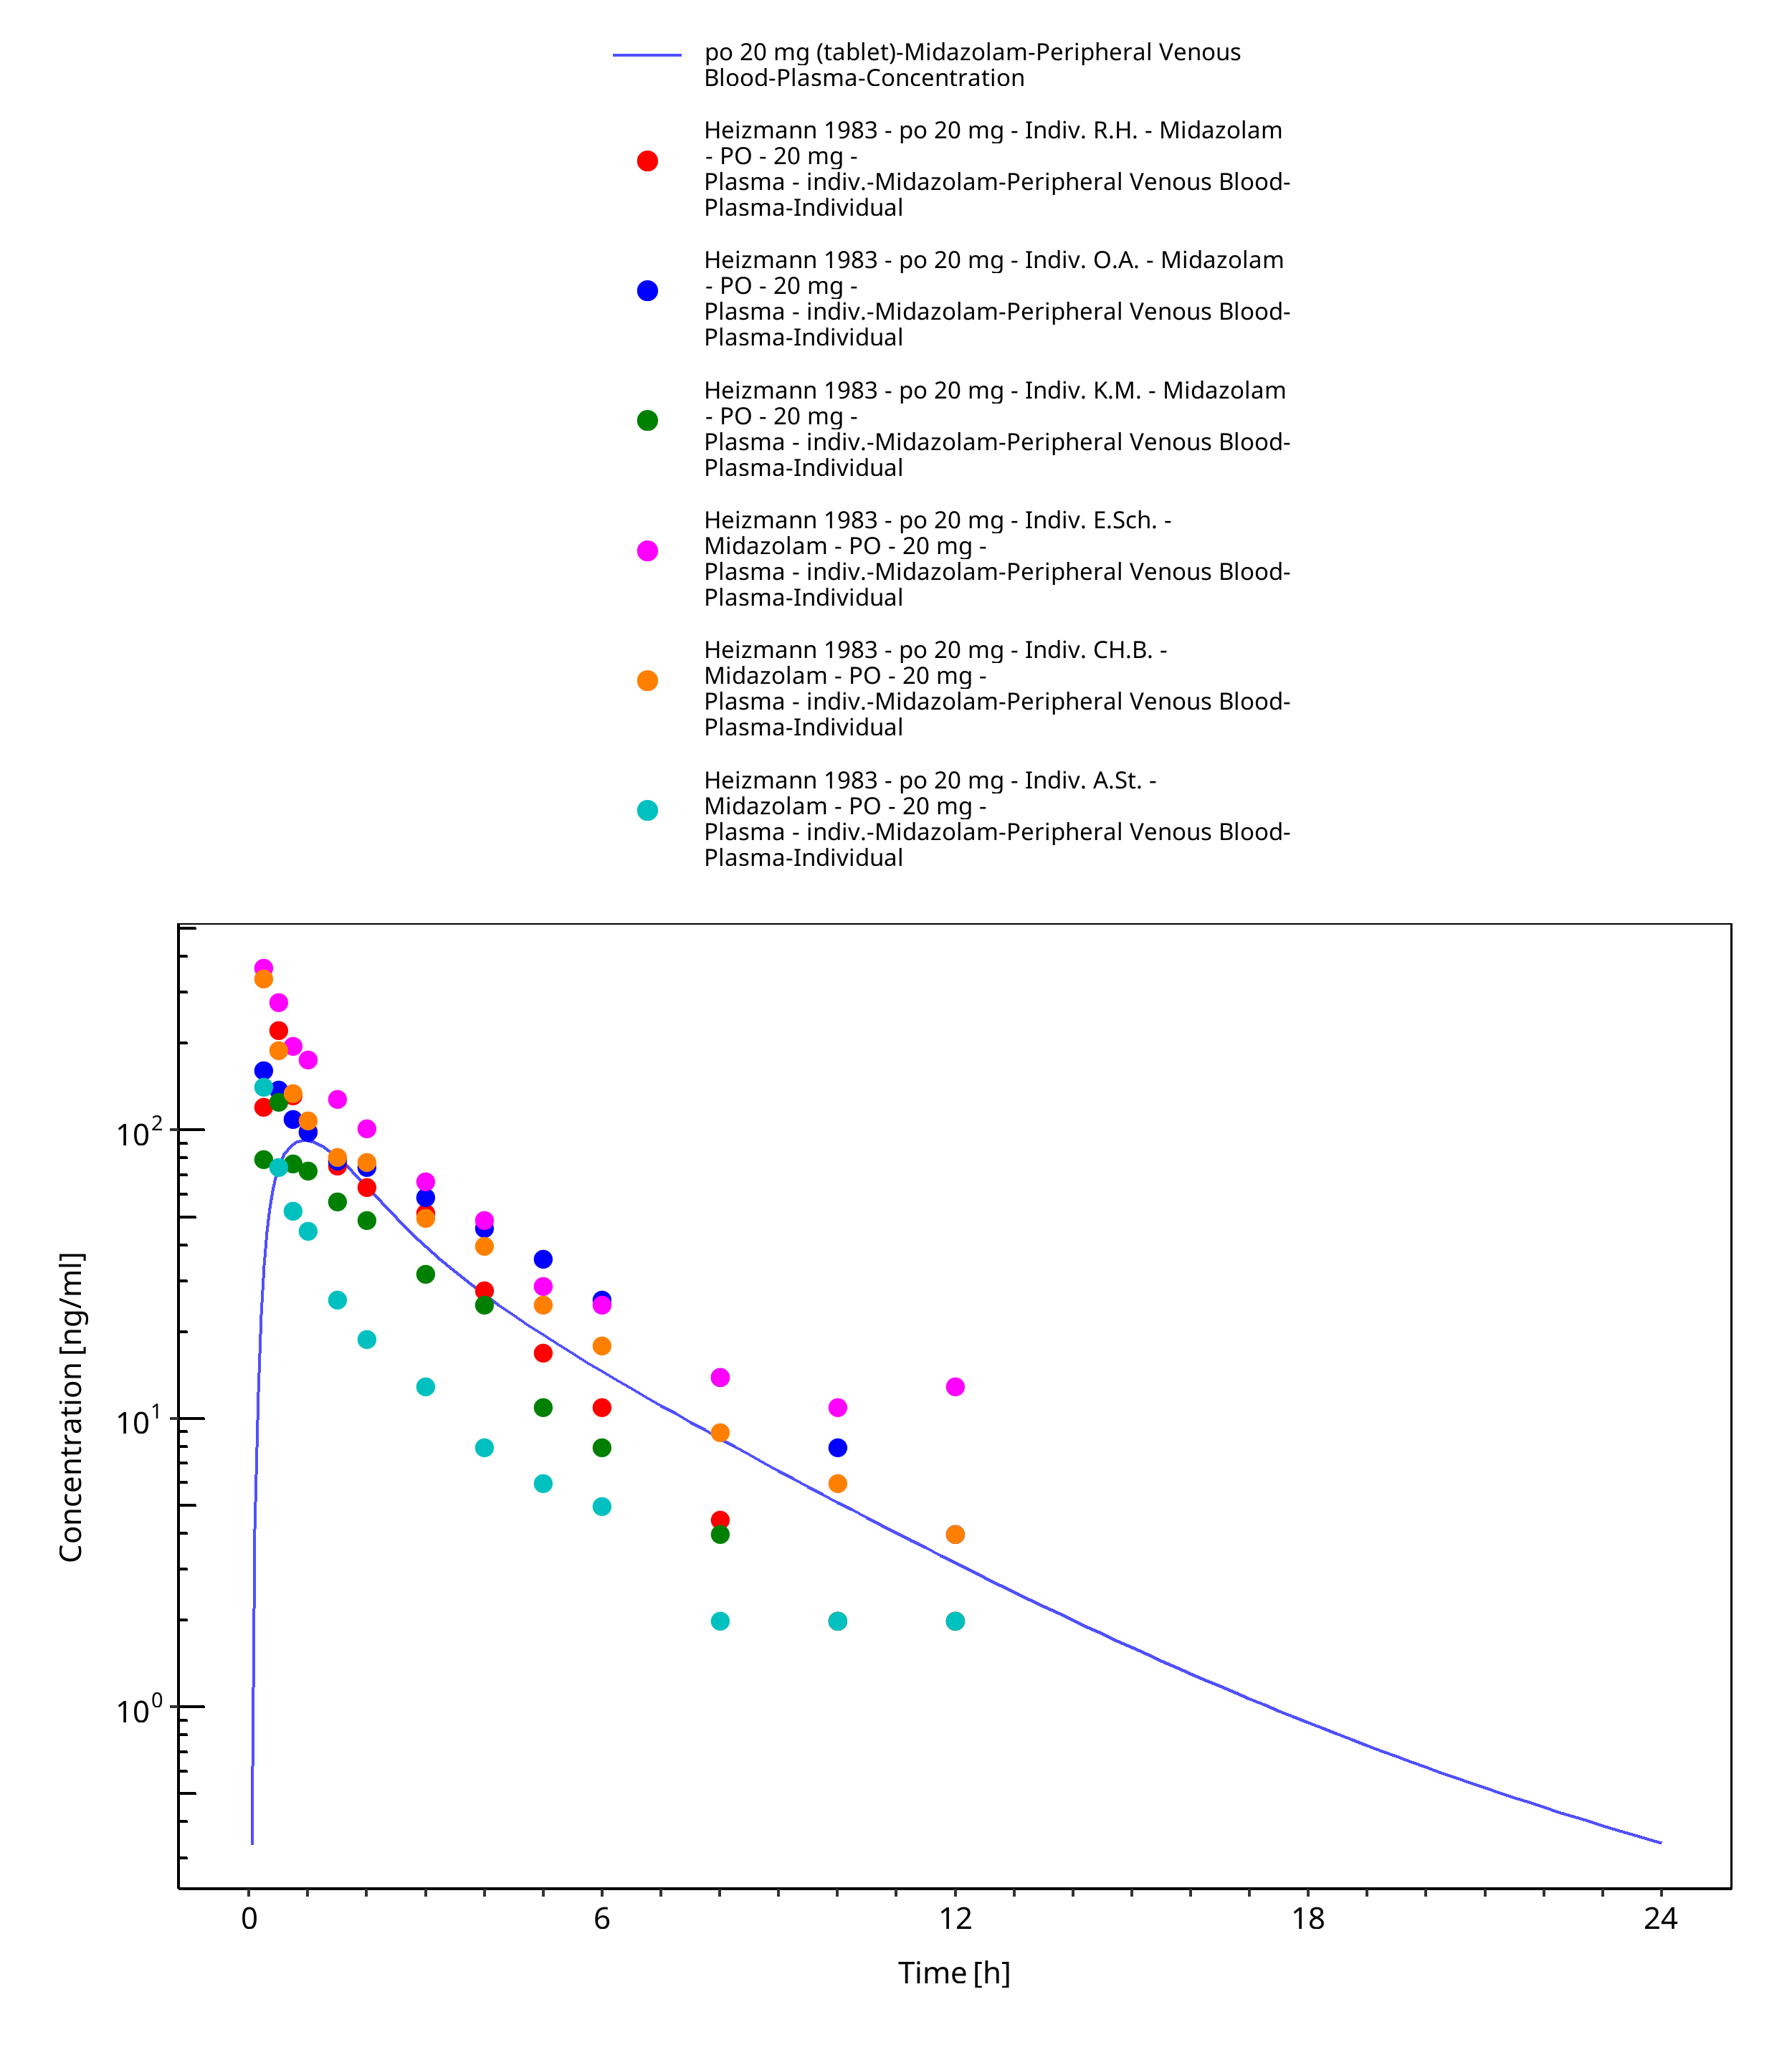
Figure 3-35: po 20 mg (tablet) - Plasma
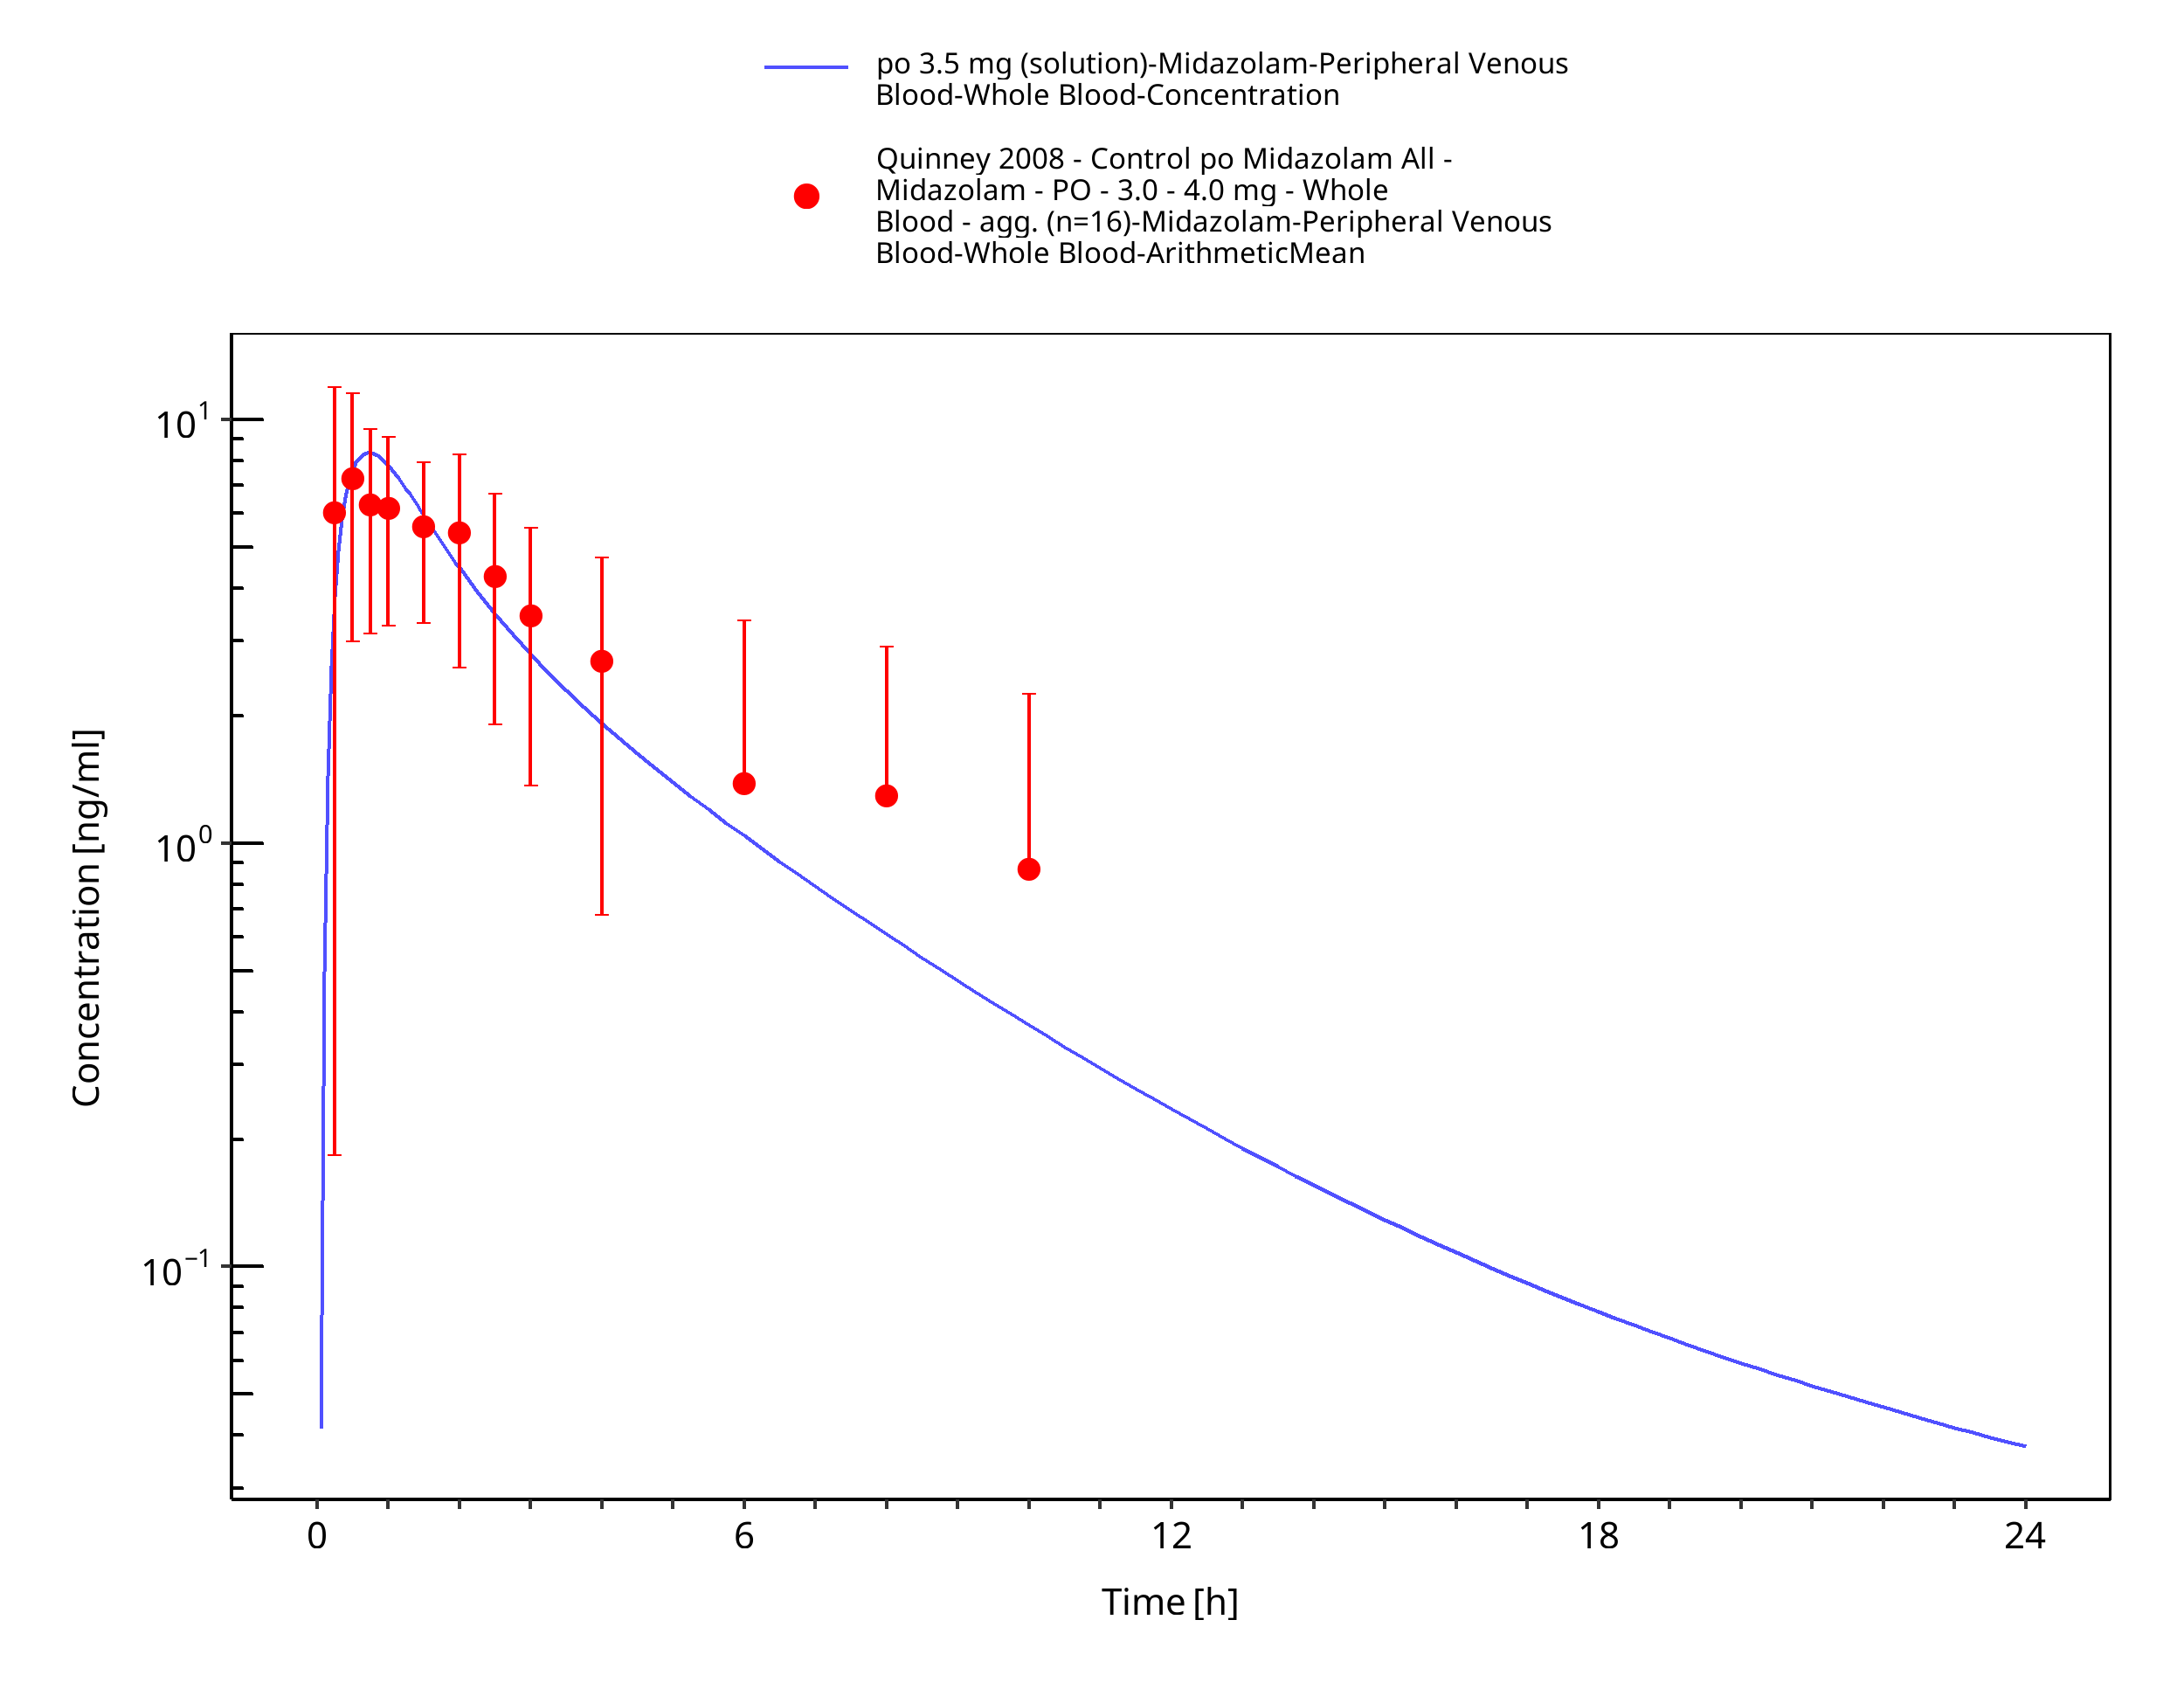
Figure 3-36: po 3.5 mg (solution) - Whole blood
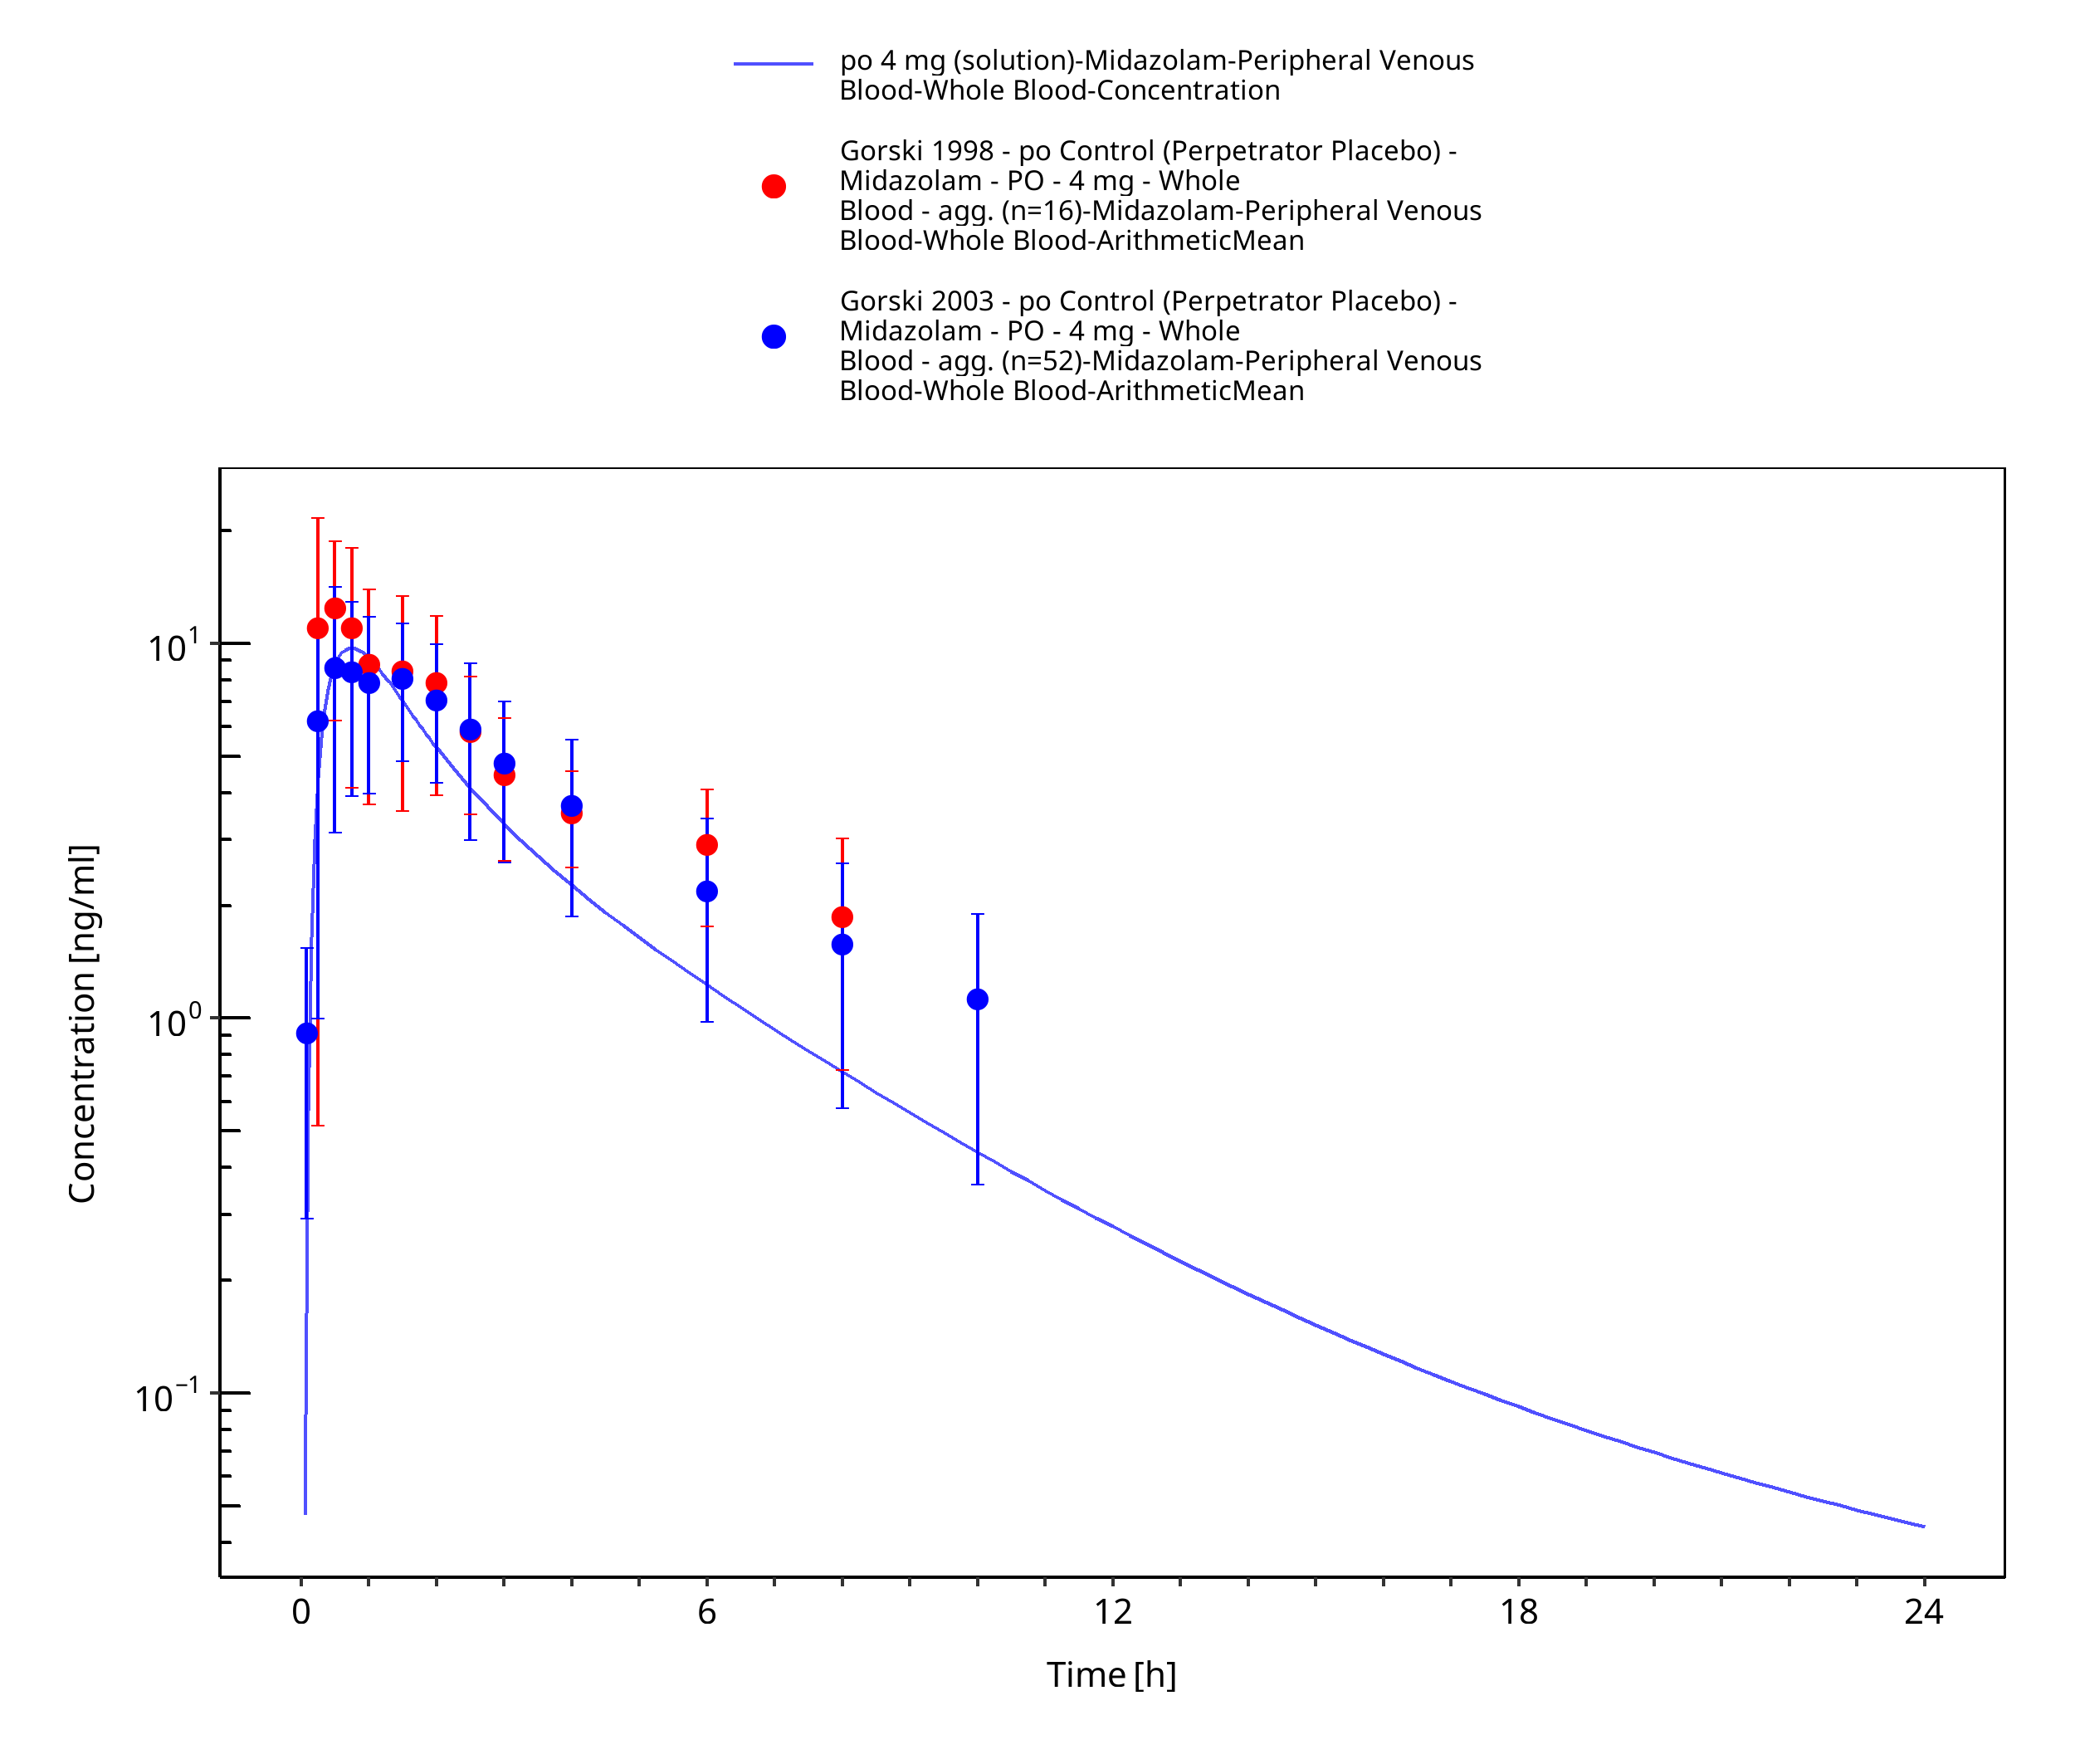
Figure 3-37: po 4 mg (solution) - Whole blood
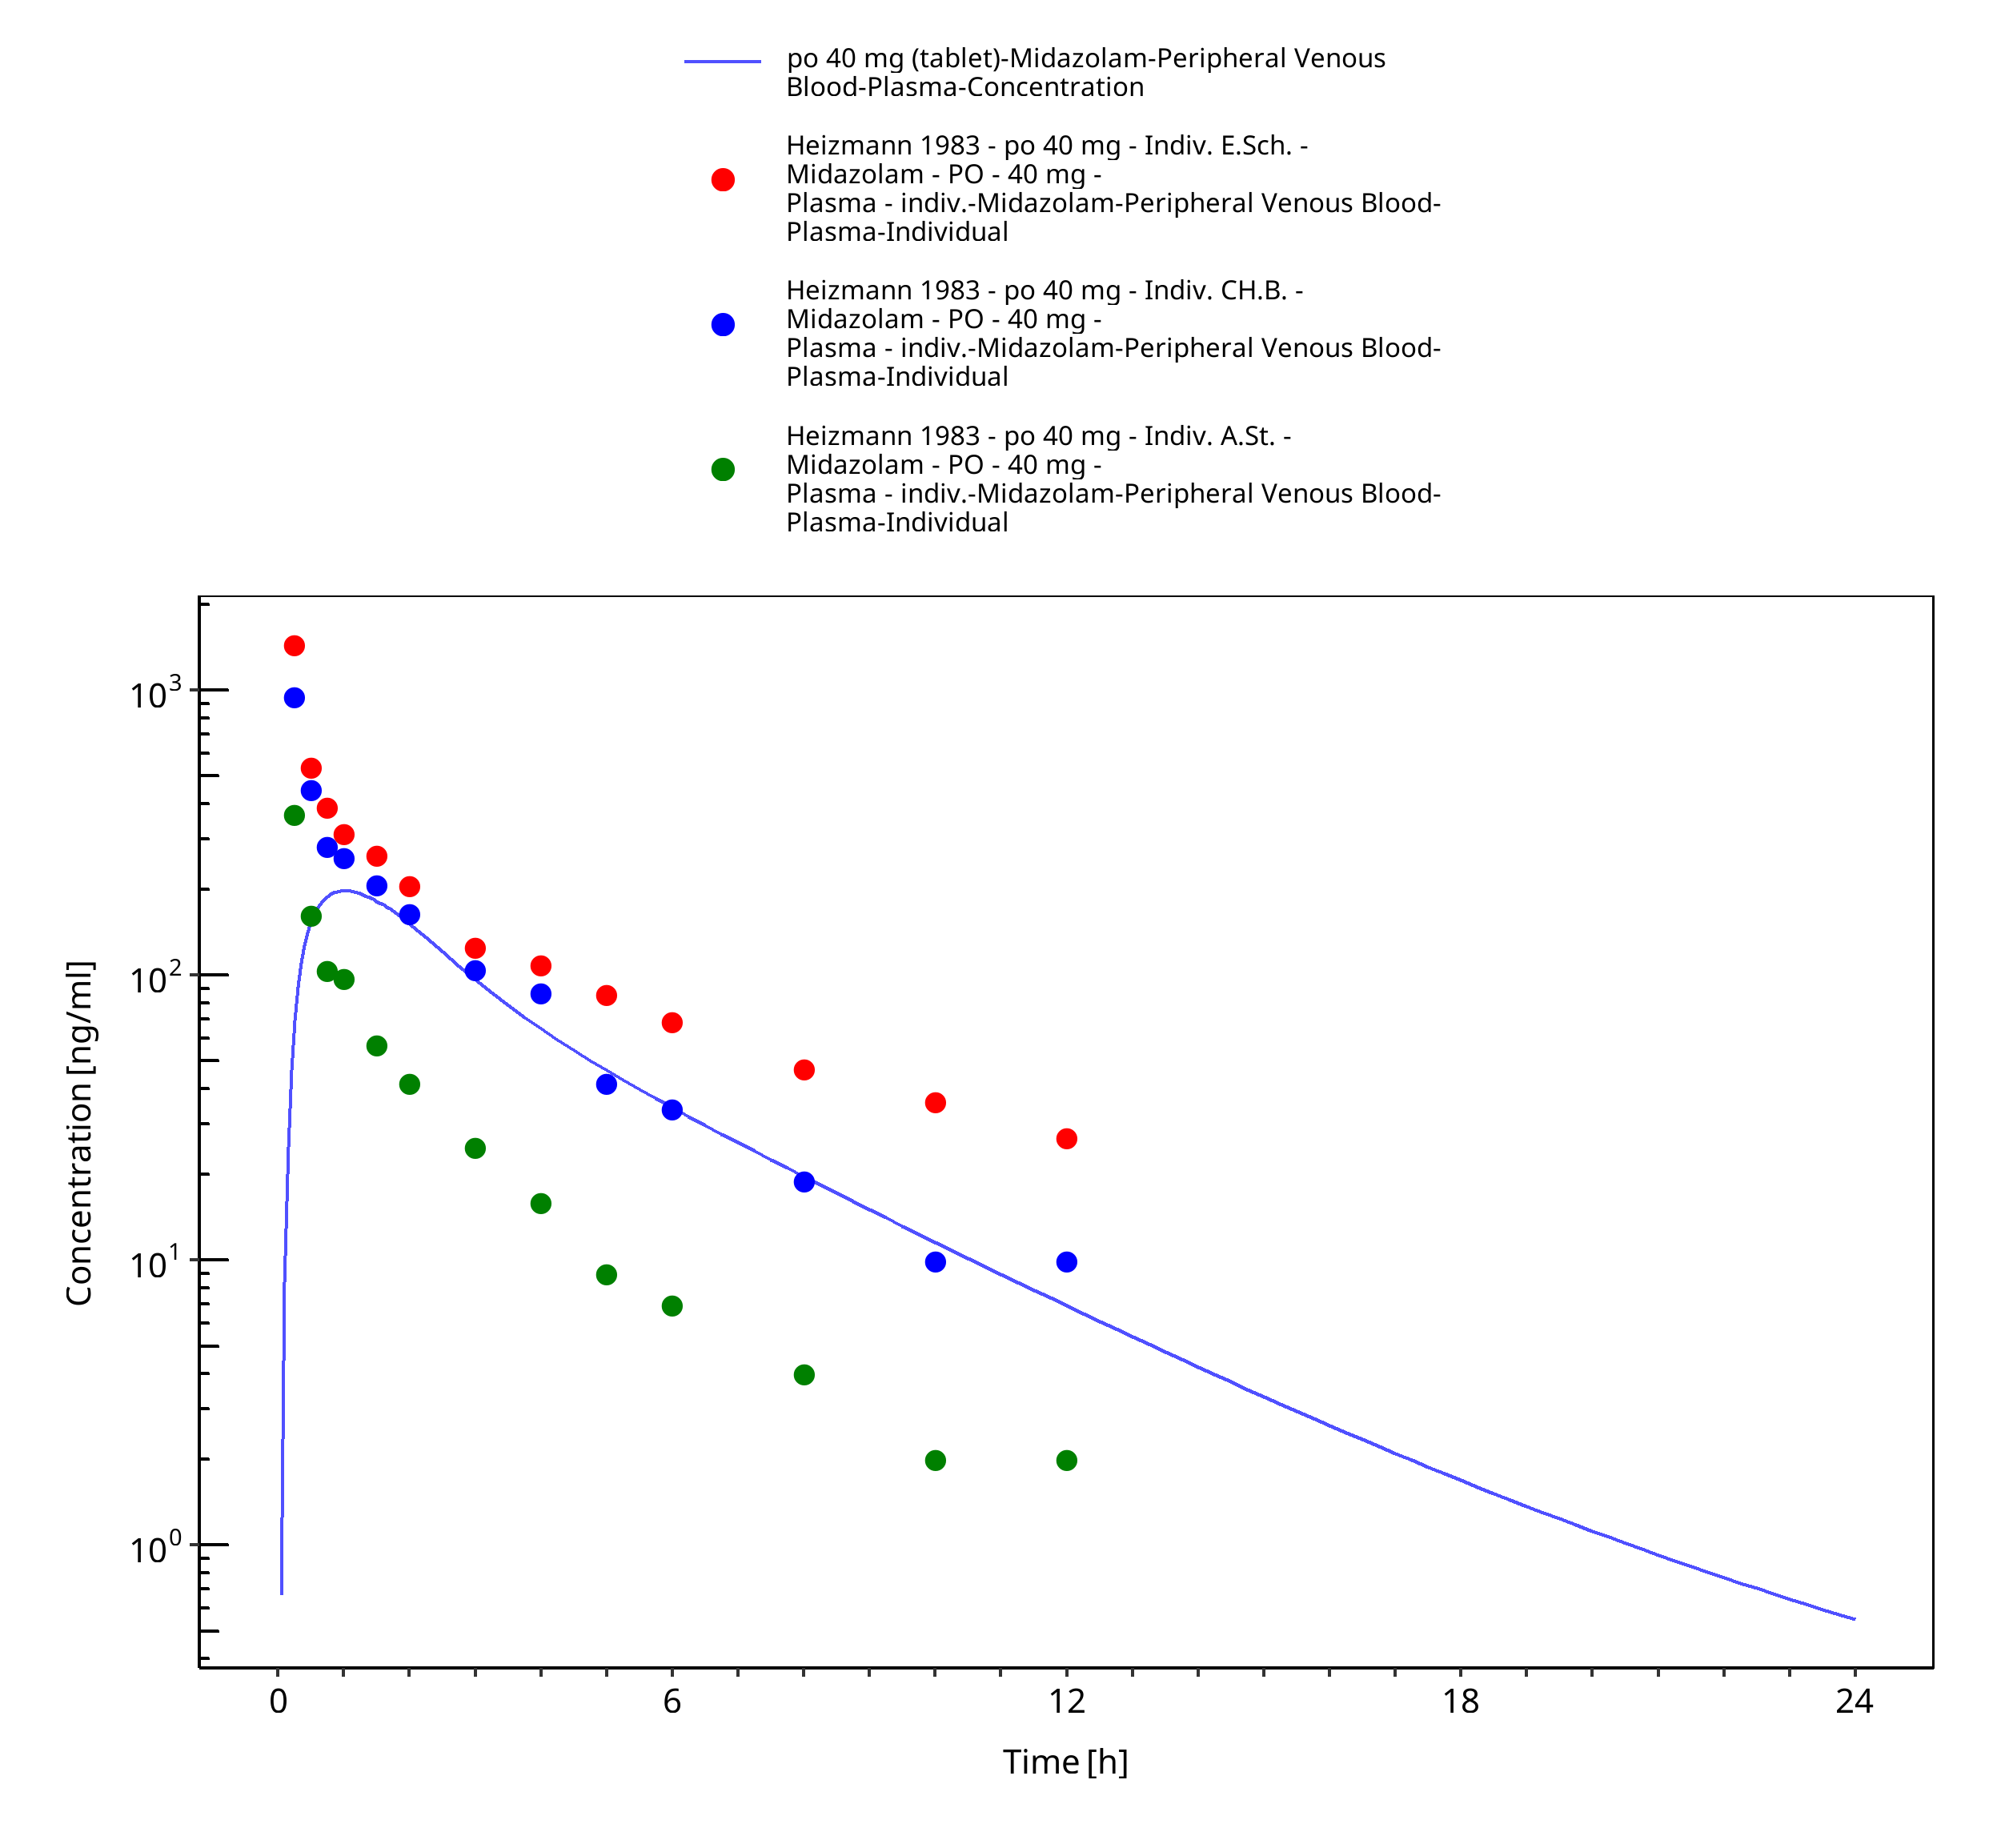
Figure 3-38: po 40 mg (tablet) - Plasma
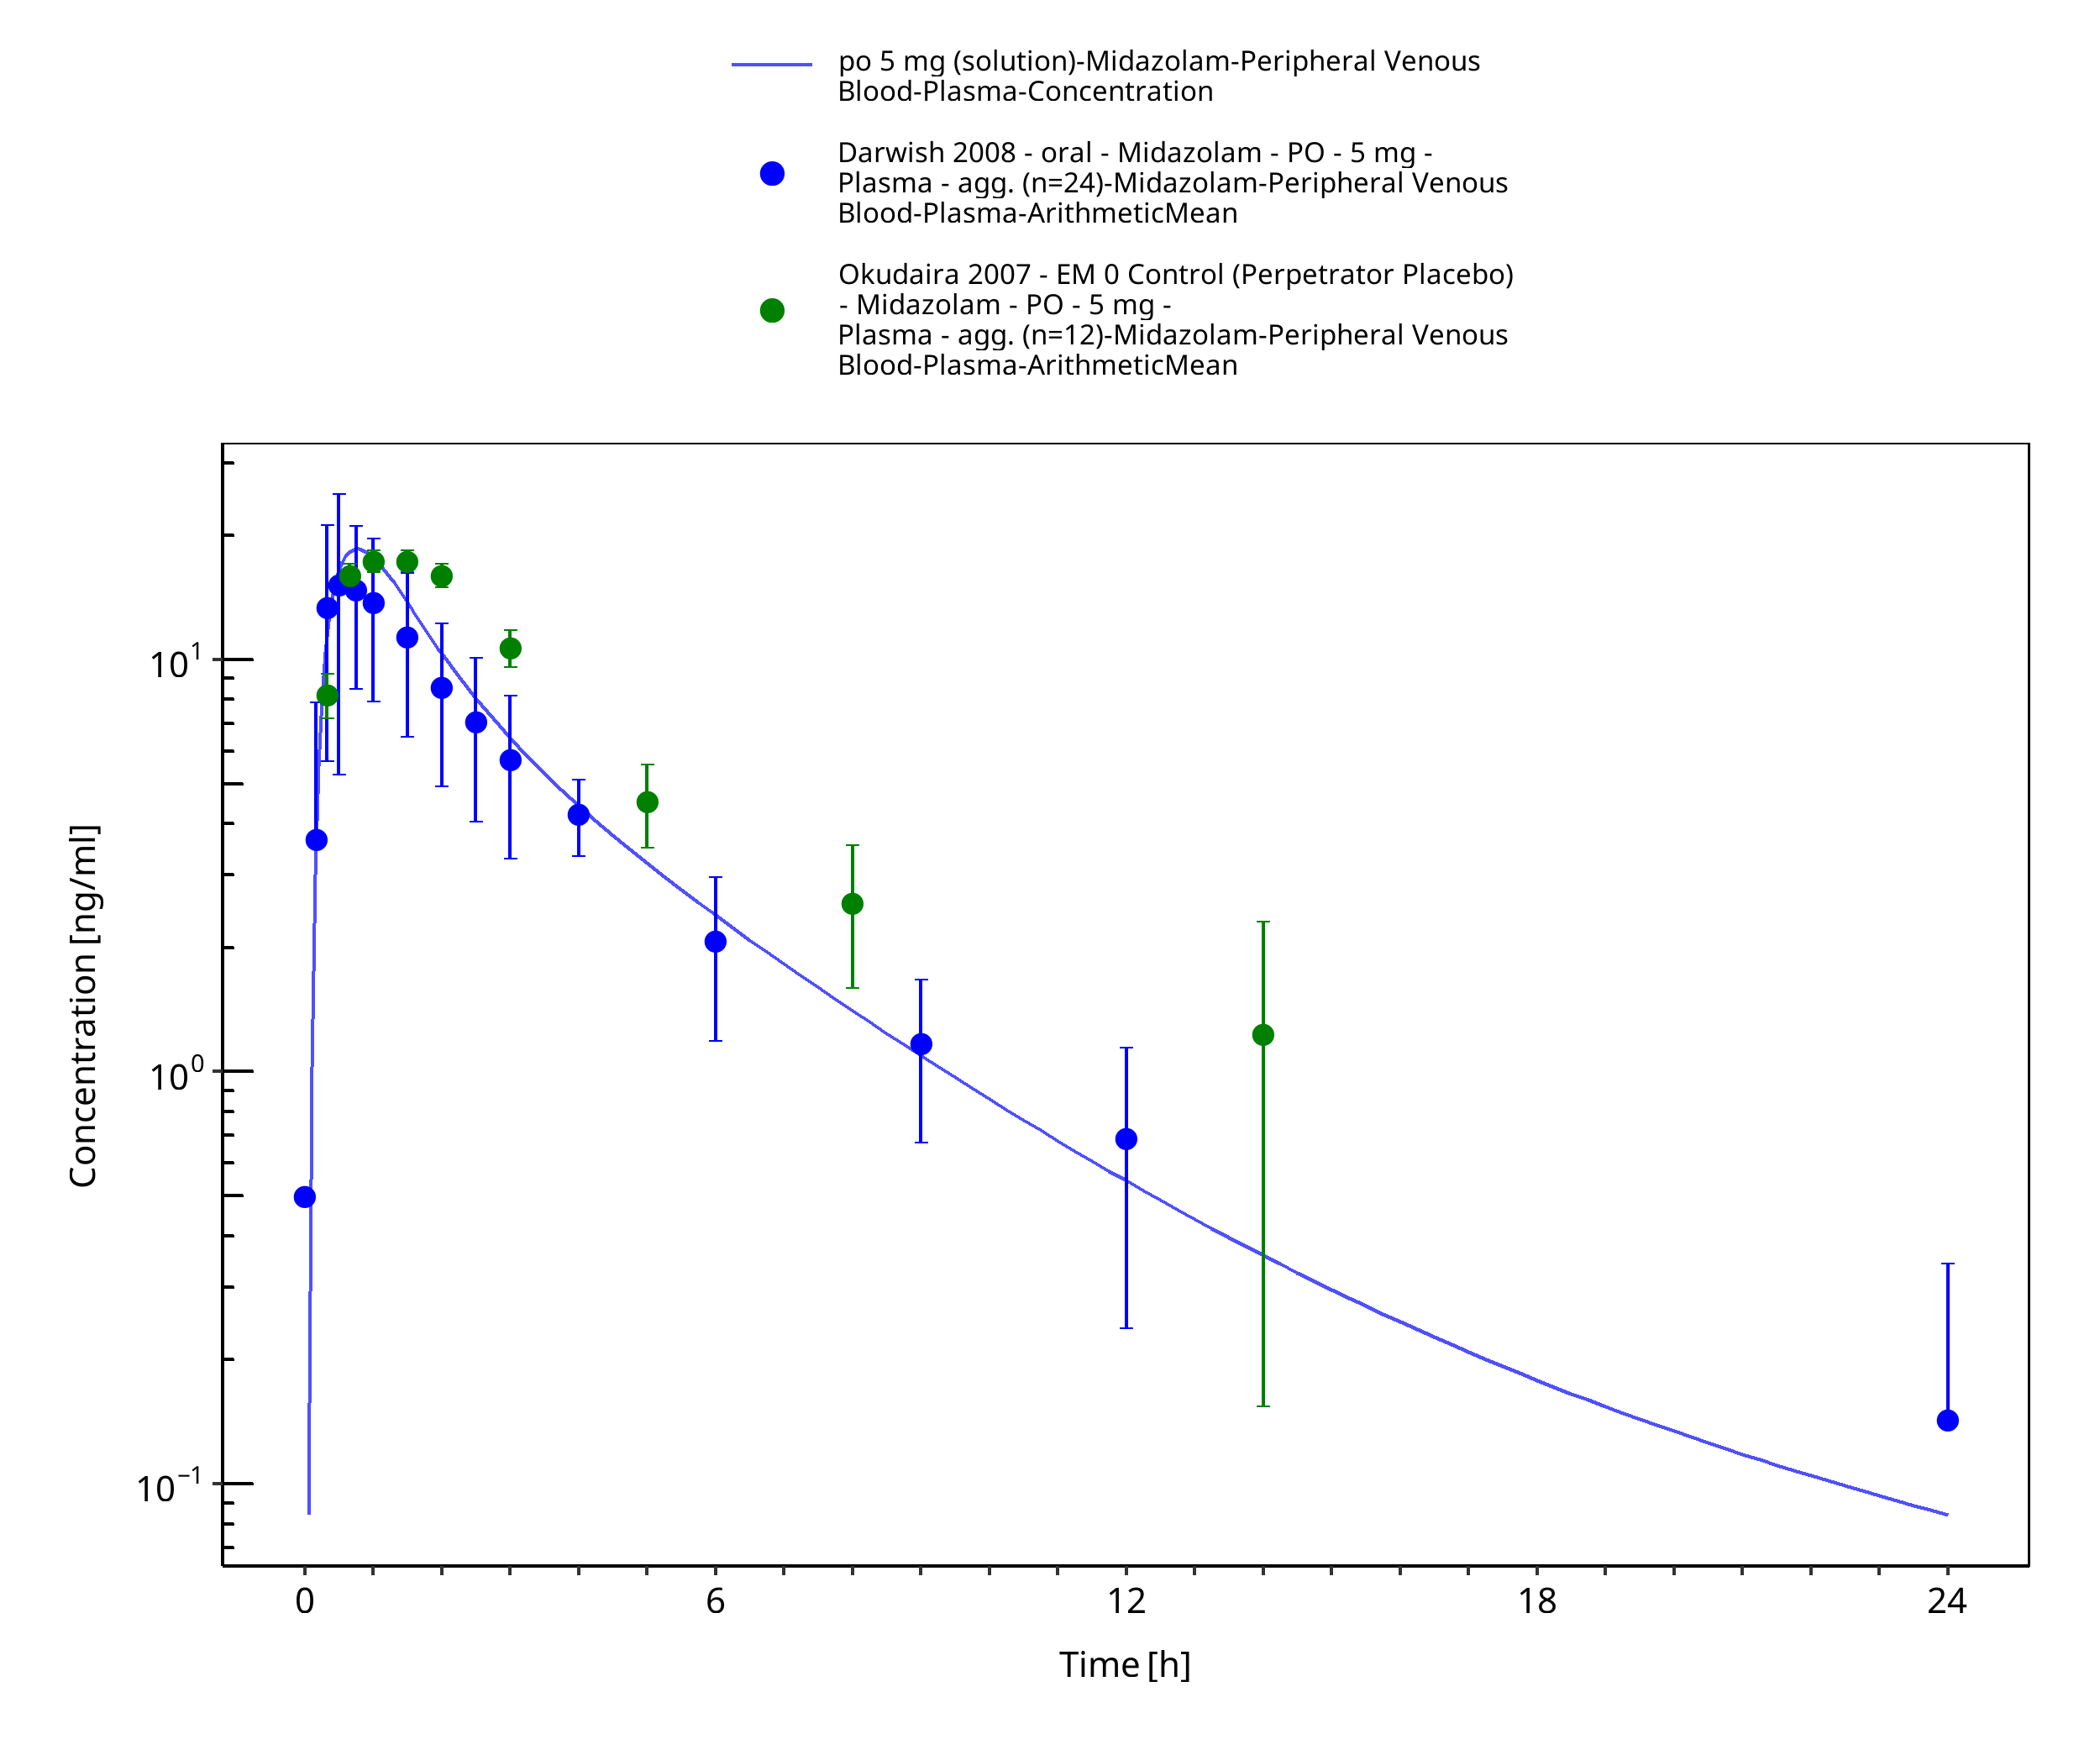
Figure 3-39: po 5 mg (solution) - Plasma
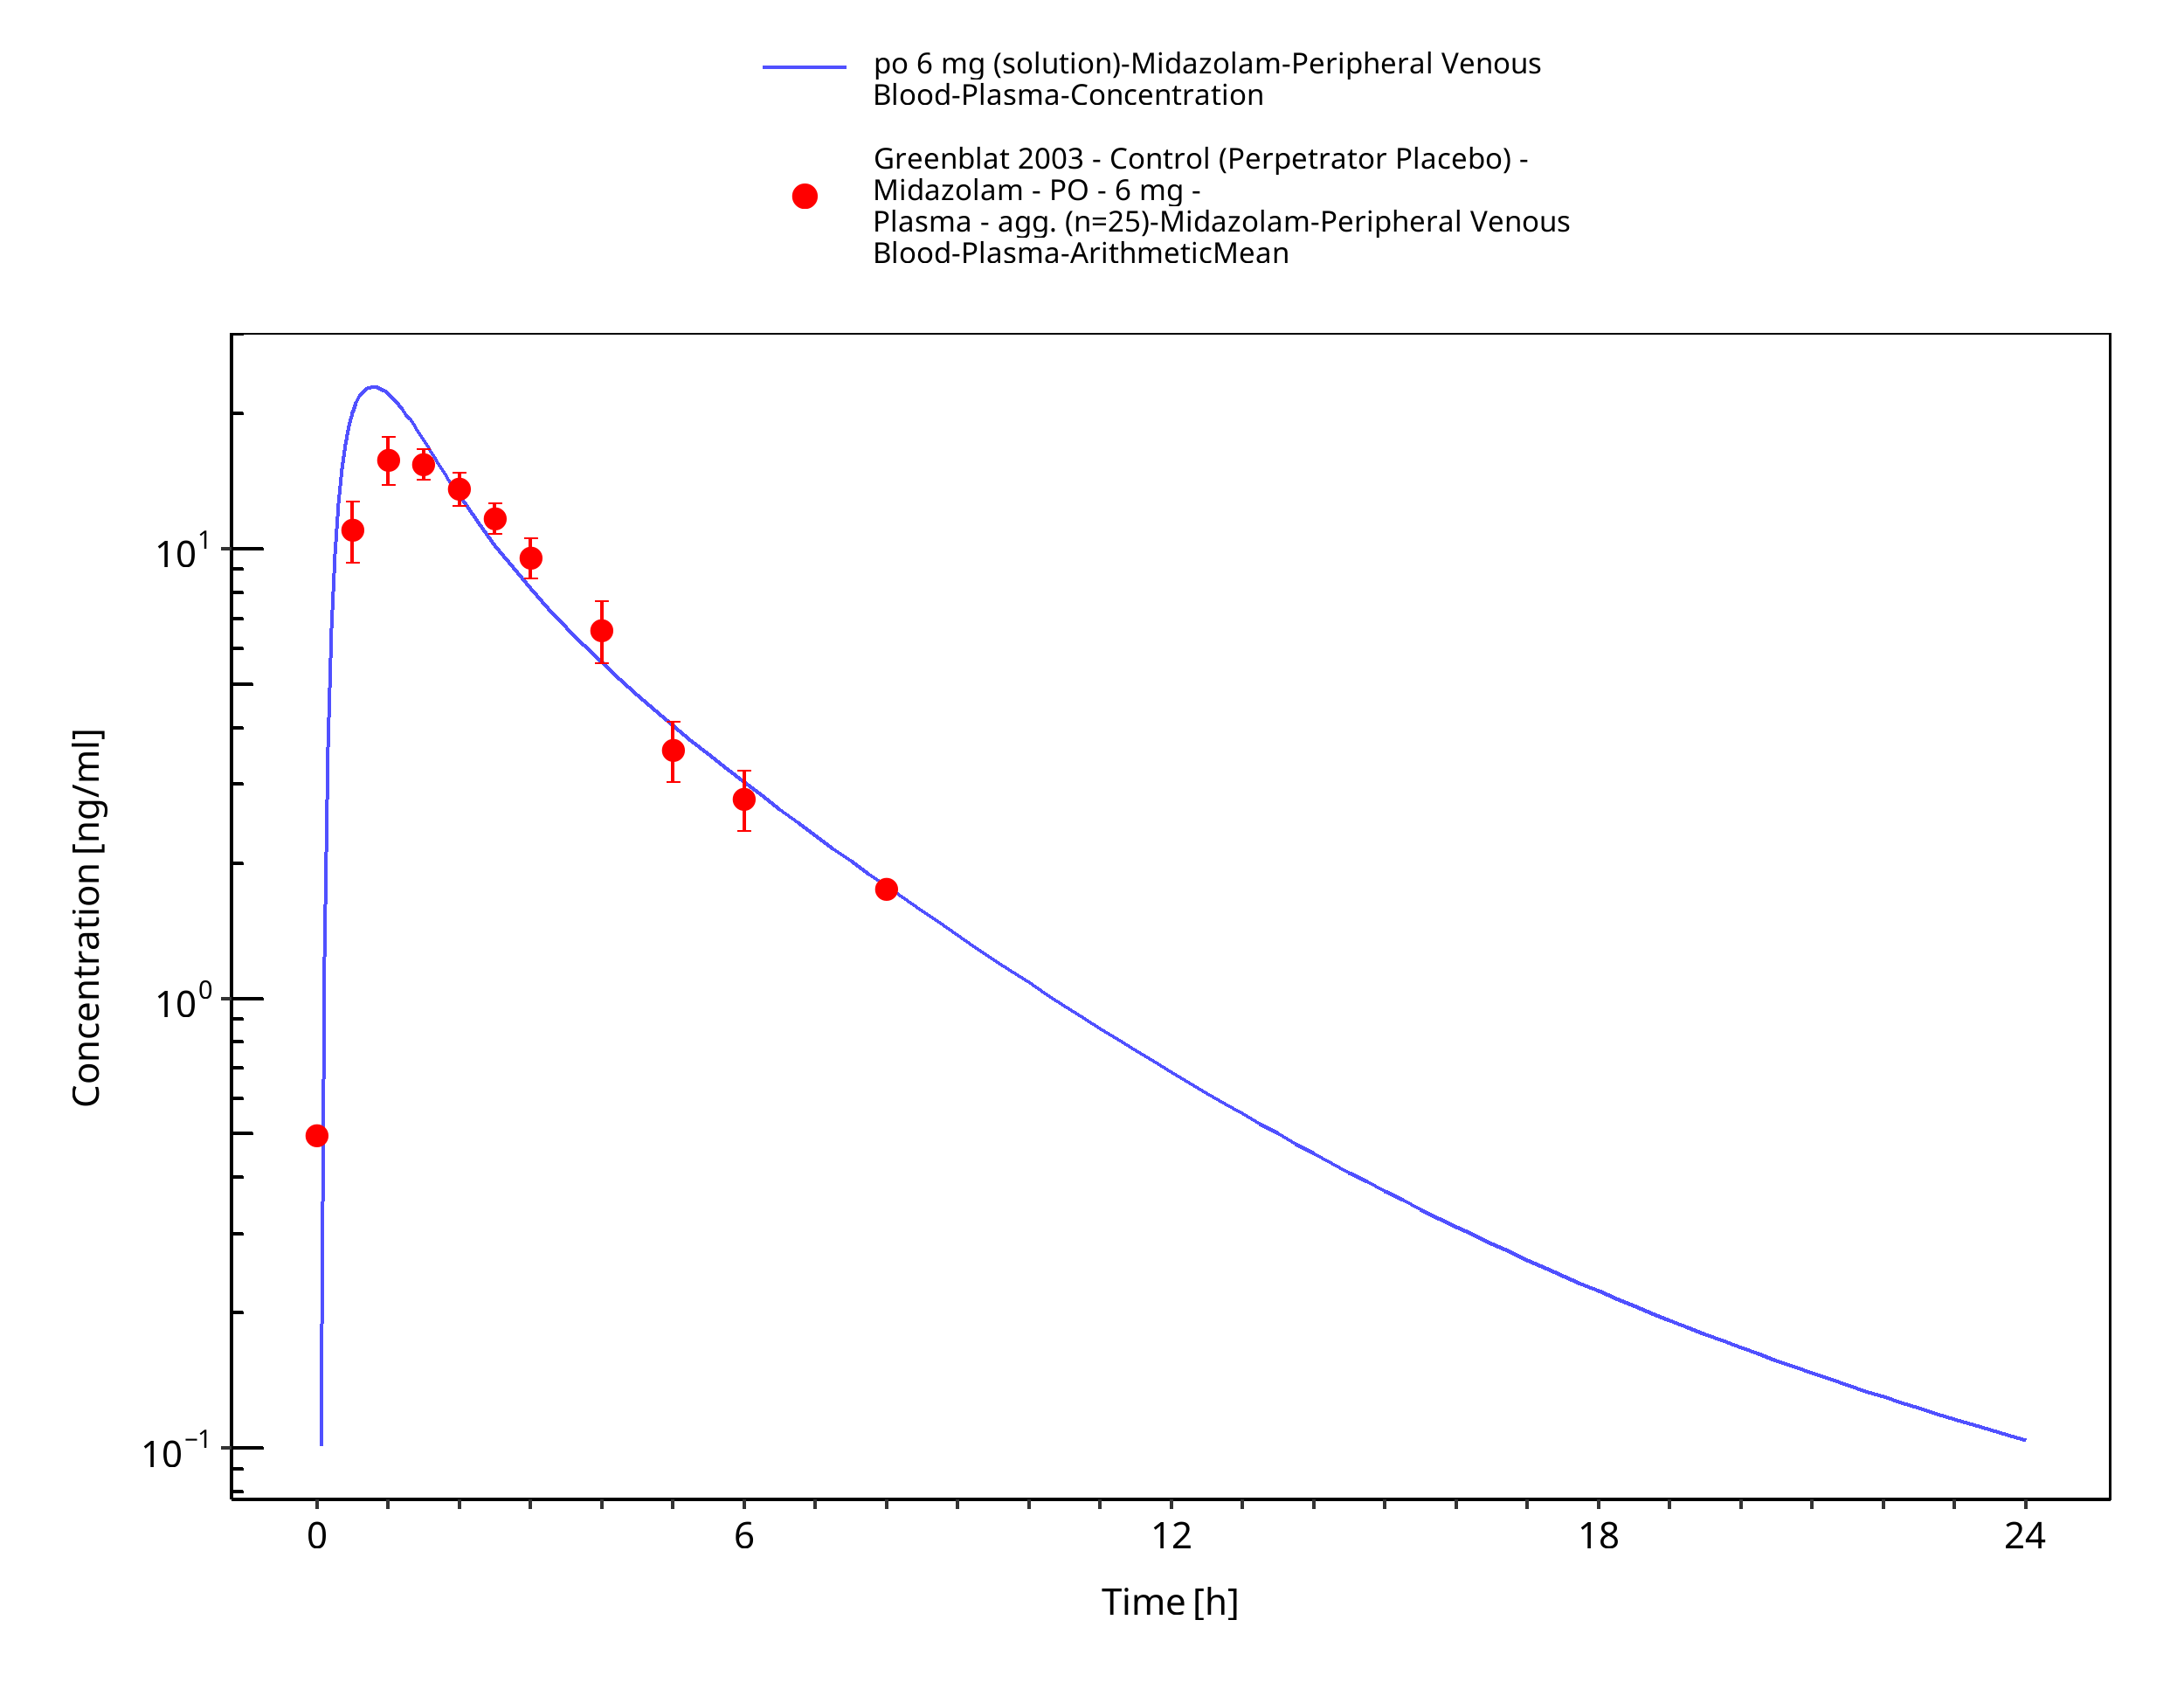
Figure 3-40: po 6 mg (solution) - Plasma
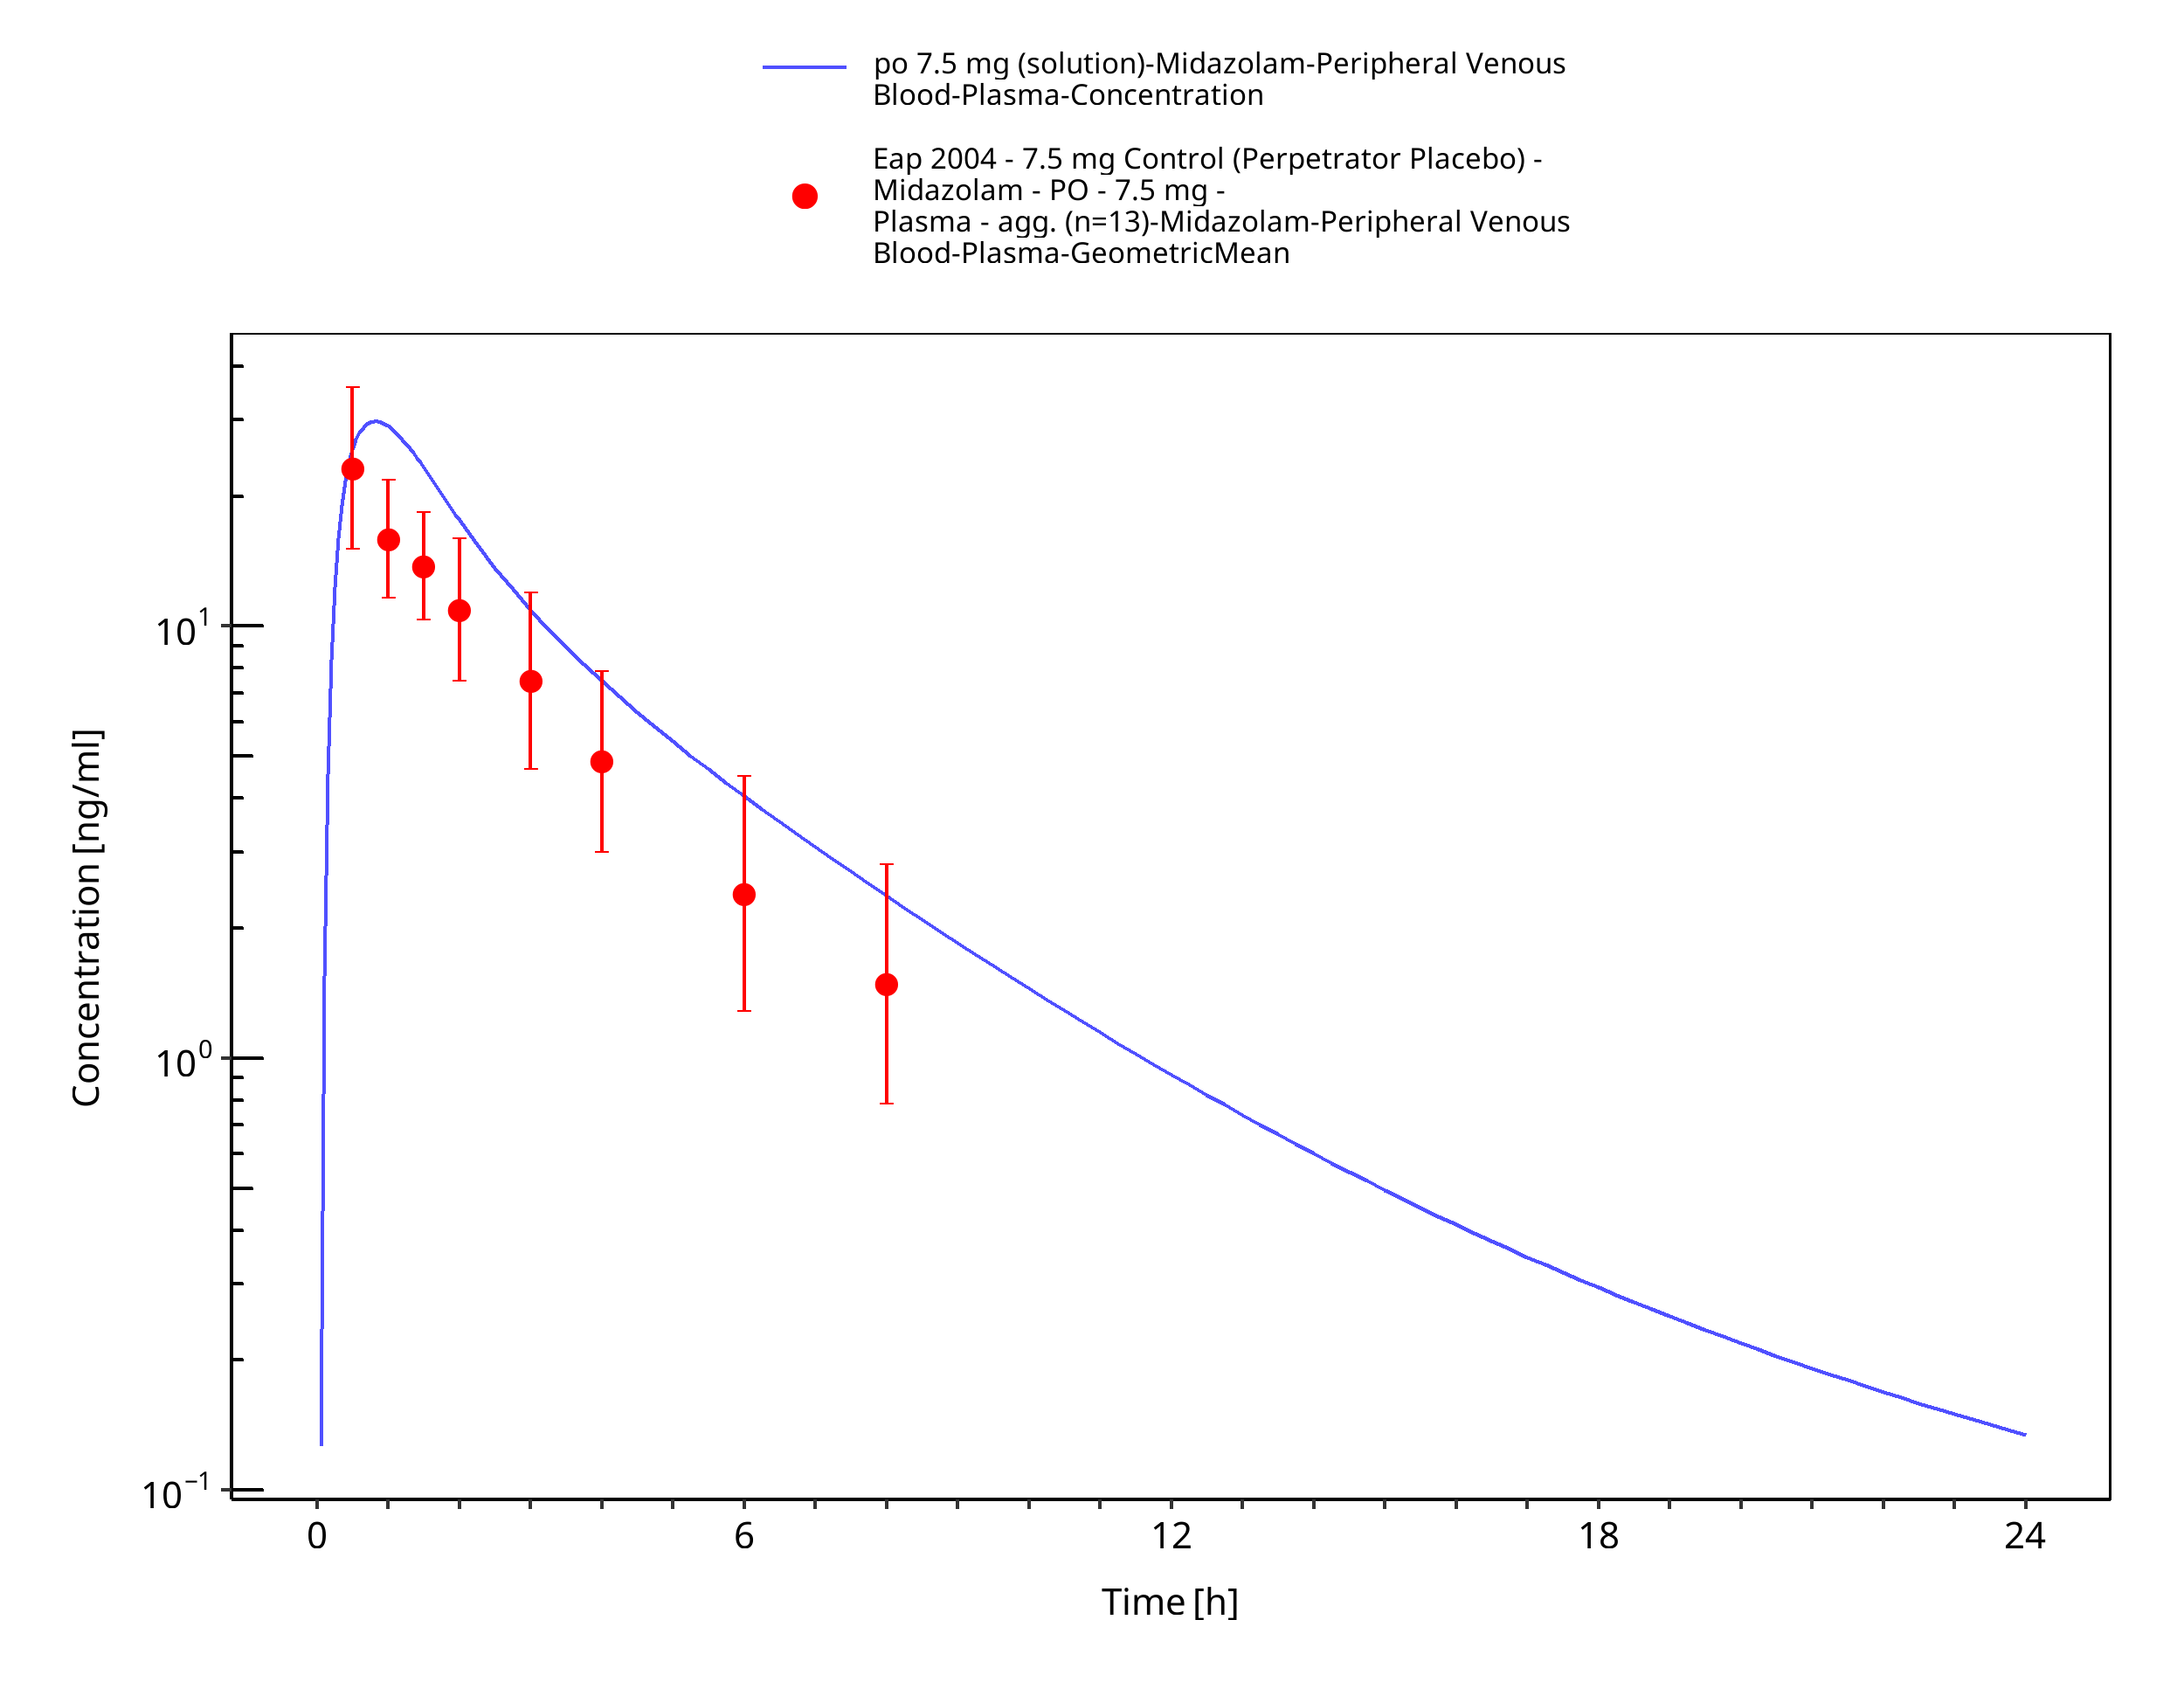
Figure 3-41: po 7.5 mg (solution) - Plasma
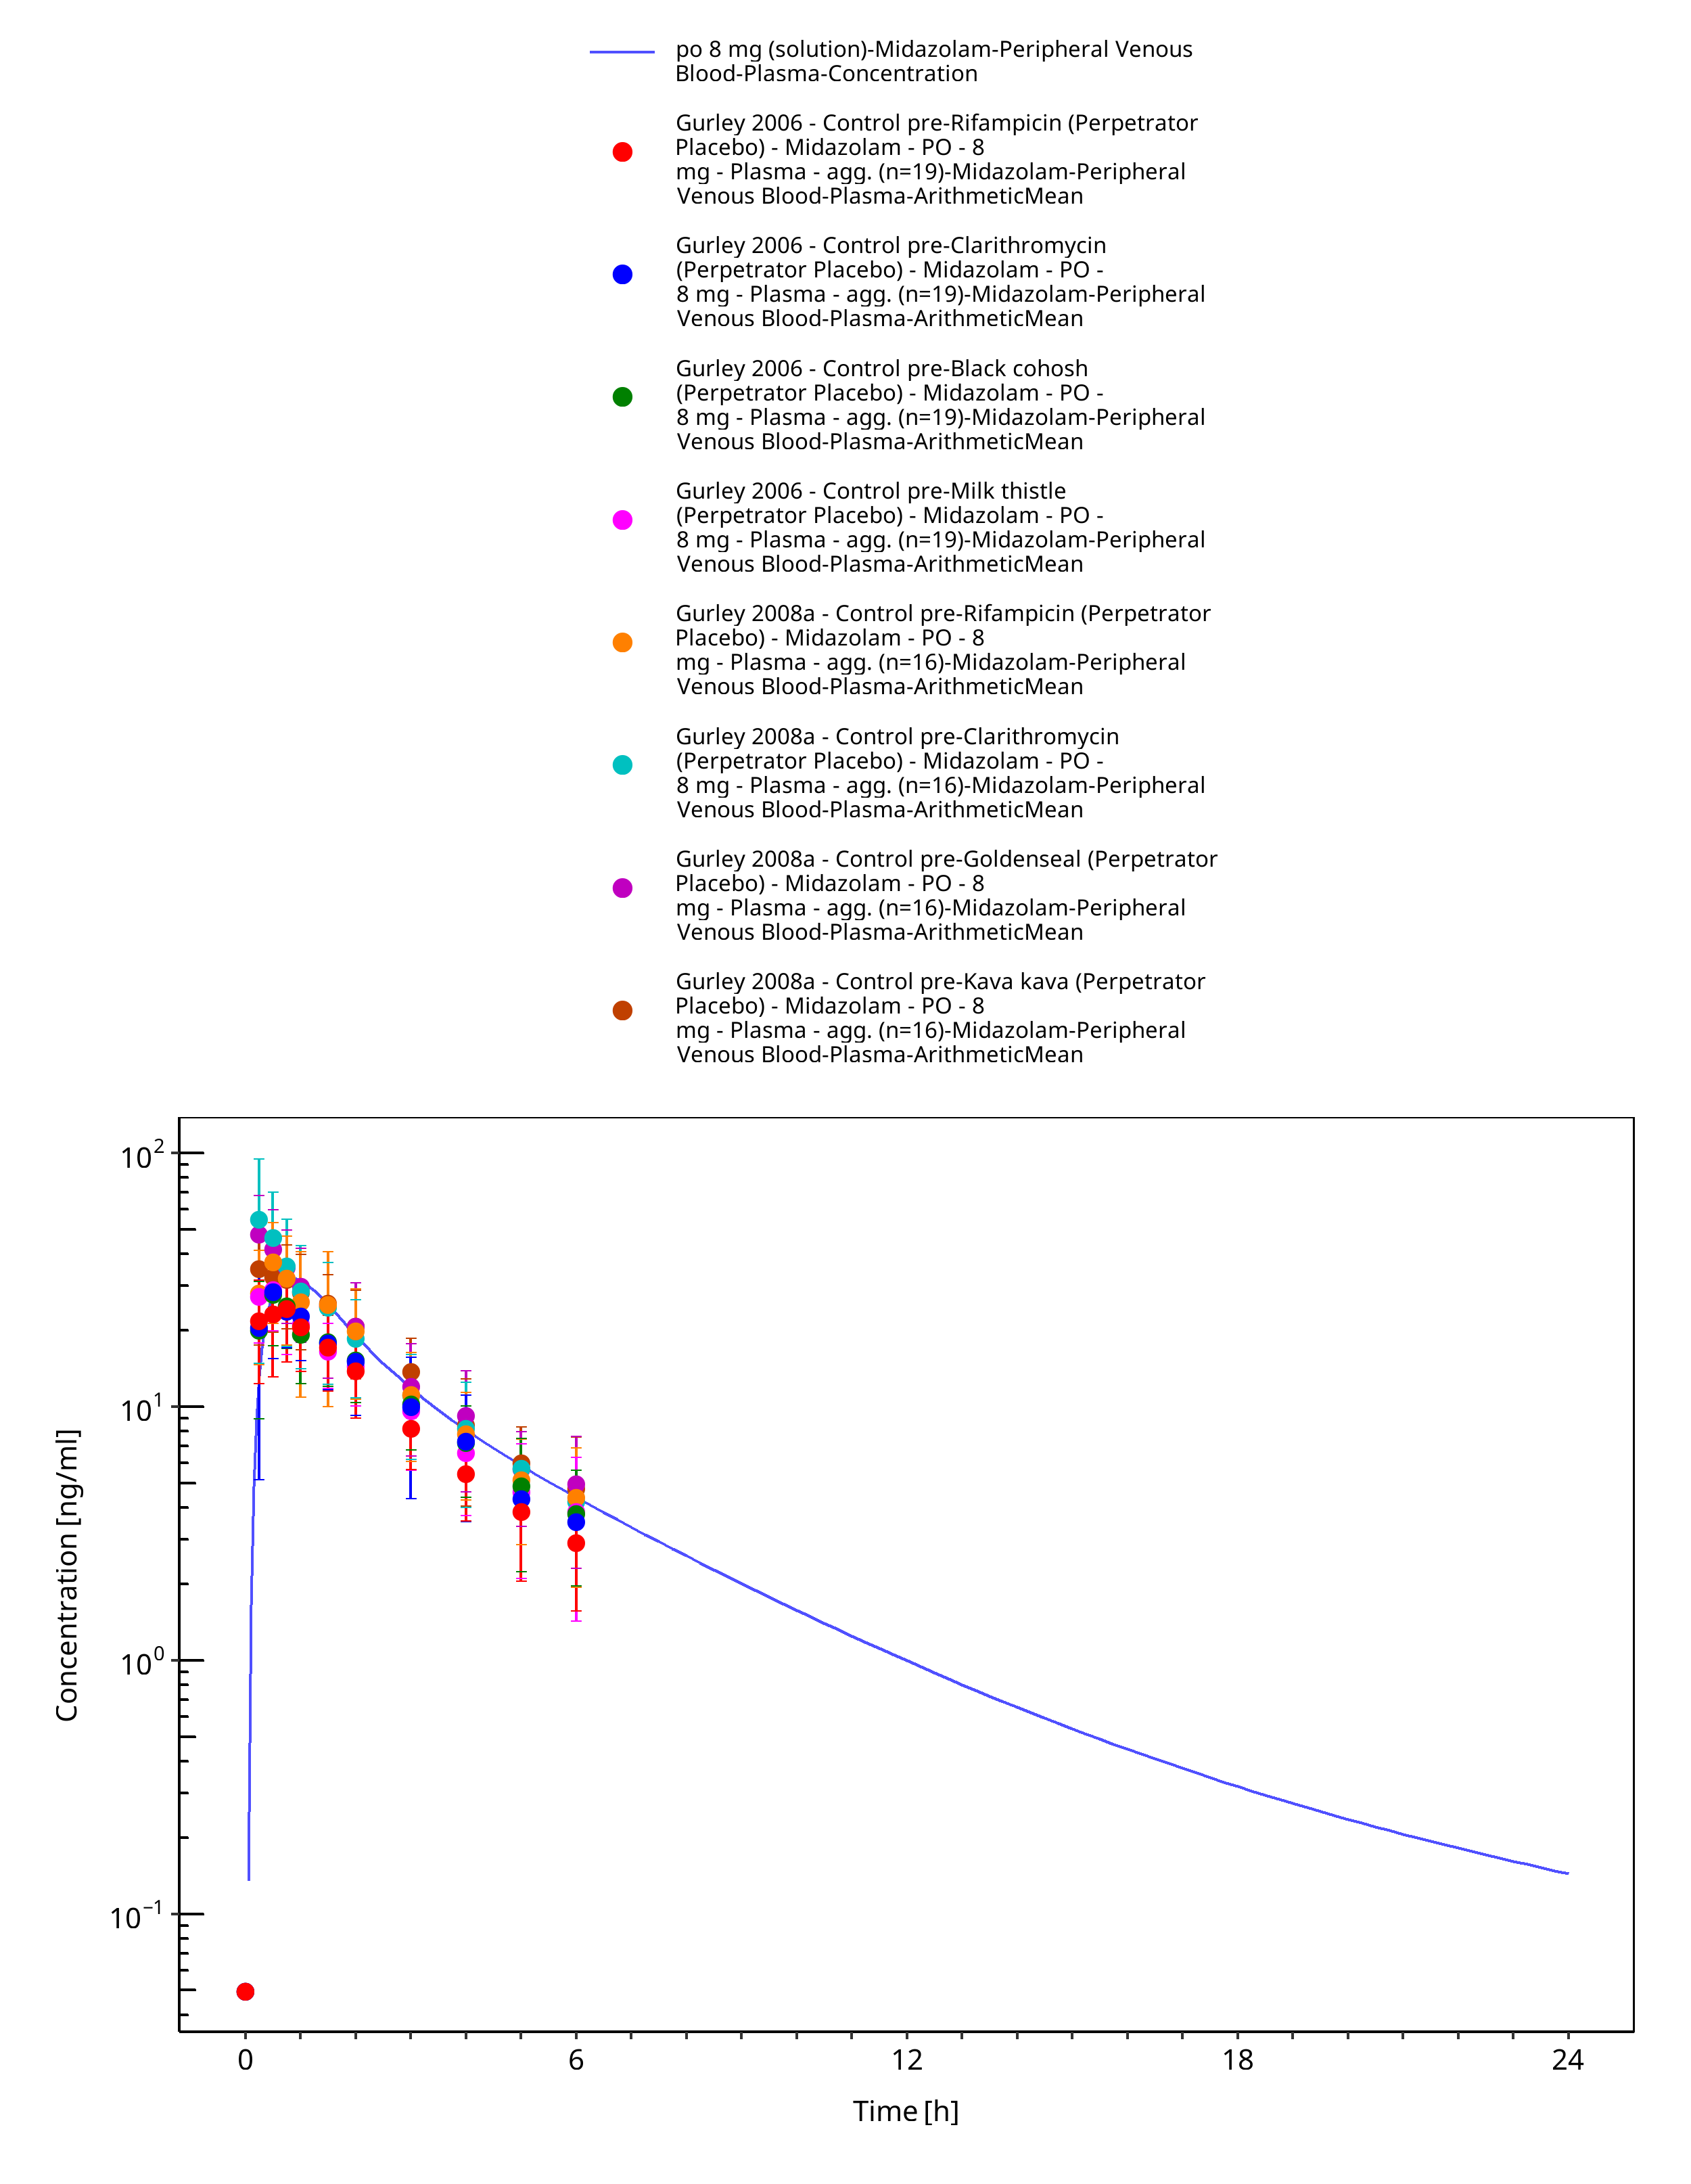
Figure 3-42: po 8 mg (solution) - Plasma
4 Conclusion
The herein presented PBPK model adequately describes the pharmacokinetics of midazolam in adults.
In particular, it applies quantitative metabolism by CYP3A4. Thus, the model is fit for purpose to be applied for the investigation of drug-drug interactions with regard to its CYP3A4 metabolism.
5 References
Achour 2014 Achour B, Russell MR, Barber J, Rostami-Hodjegan A. Simultaneous quantification of the abundance of several cytochrome P450 and uridine 5'-diphospho-glucuronosyltransferase enzymes in human liver microsomes using multiplexed targeted proteomics. Drug Metab Dispos. 2014 Apr;42(4):500-10.
Ahonen 1995 Ahonen J, Olkkola KT, Neuvonen PJ. Effect of itraconazole and terbinafine on the pharmacokinetics and pharmacodynamics of midazolam in healthy volunteers. Br J Clin Pharmacol. 1995 Sep;40(3):270-2.
Allonen 1981 Allonen H, Ziegler G, Klotz U. Midazolam kinetics. Clin Pharmacol Ther. 1981 Nov;30(5):653-61.
Backman 1994 Backman JT, Olkkola KT, Aranko K, Himberg JJ, Neuvonen PJ. Dose of midazolam should be reduced during diltiazem and verapamil treatments. Br J Clin Pharmacol. 1994 Mar;37(3):221-5.
Backman 1996 Backman JT, Olkkola KT, Neuvonen PJ. Rifampin drastically reduces plasma concentrations and effects of oral midazolam. Clin Pharmacol Ther. 1996 Jan;59(1):7-13.
Backman 1998 Backman JT, Kivistö KT, Olkkola KT, Neuvonen PJ. The area under the plasma concentration-time curve for oral midazolam is 400-fold larger during treatment with itraconazole than with rifampicin. Eur J Clin Pharmacol. 1998 Mar;54(1):53-8.
Björkman 2001 Björkman S, Wada DR, Berling BM, Benoni G. Prediction of the disposition of midazolam in surgical patients by a physiologically based pharmacokinetic model. J Pharm Sci. 2001 Sep;90(9):1226-41.
Bolger 2006 Bolger M Physiologically-based Pharmacokinetics (PBPK) Linked to Pharmacodynamics: In silico and in vitro Parameterization Presentation @ Globalization of Pharmaceutics Education Network (GPEN) , Kansas, 2006 (https://kuscholarworks.ku.edu/handle/1808/1168)
Bornemann 1986 Bornemann LD, Crews T, Chen SS, Twardak S, Patel IH. Influence of food on midazolam absorption. J Clin Pharmacol. 1986 Jan;26(1):55-9.
Buhr 1997 Buhr A, Baur R, Sigel E. Subtle changes in residue 77 of the gamma subunit of alpha1beta2gamma2 GABAA receptors drastically alter the affinity for ligands of the benzodiazepine binding site. J Biol Chem. 1997 May 2;272(18):11799-804.
Chattopadhyay 2018 Chattopadhyay N, Kanacher K, Casjens M, Frechen S, Ligges S, Zimmermann T, Rottmann A, Ploeger B, Höchel J, Schultze-Mosgau M-H. CYP3A4-mediated effects of rifampicin on the pharmacokinetics of vilaprisan and its UGT1A1-mediated effects on bilirubin glucuronidation in humans. Br J Clin Pharmacol . 2018 Dec;84(12):2857-2866.
Chung 2006 Chung E, Nafziger AN, Kazierad DJ, Bertino JS Jr. Comparison of midazolam and simvastatin as cytochrome P450 3A probes. Clin Pharmacol Ther. 2006 Apr;79(4):350-61.
Dagenais 2009 Dagenais C, Avdeef A, Tsinman O, Dudley A, Beliveau R. P-glycoprotein deficient mouse in situ blood-brain barrier permeability and its prediction using an in combo PAMPA model. Eur J Pharm Sci. 2009 Sep 10;38(2):121-37.
Darwish 2008 Darwish M, Kirby M, Robertson P Jr, Hellriegel ET. Interaction profile of armodafinil with medications metabolized by cytochrome P450 enzymes 1A2, 3A4 and 2C19 in healthy subjects. Clin Pharmacokinet. 2008;47(1):61-74.
DrugBank DB00683 (https://www.drugbank.ca/drugs/DB00683)
Eap 2004 Eap CB, Buclin T, Cucchia G, Zullino D, Hustert E, Bleiber G, Golay KP, Aubert AC, Baumann P, Telenti A, Kerb R. Oral administration of a low dose of midazolam (75 microg) as an in vivo probe for CYP3A activity. Eur J Clin Pharmacol. 2004 Jun;60(4):237-46.
Galetin 2004 Galetin A, Brown C, Hallifax D, Ito K, Houston JB. Utility of recombinant enzyme kinetics in prediction of human clearance: impact of variability, CYP3A5, and CYP2C19 on CYP3A4 probe substrates. Drug Metab Dispos. 2004 Dec;32(12):1411-20.
Gertz 2010 Gertz M, Harrison A, Houston JB, Galetin A. Prediction of human intestinal first-pass metabolism of 25 CYP3A substrates from in vitro clearance and permeability data. Drug Metab Dispos. 2010 Jul;38(7):1147-58.
Gorski 1998 Gorski JC, Jones DR, Haehner-Daniels BD, Hamman MA, O'Mara EM Jr, Hall SD. The contribution of intestinal and hepatic CYP3A to the interaction between midazolam and clarithromycin. Clin Pharmacol Ther. 1998 Aug;64(2):133-43.
Gorski 2003 Gorski JC, Vannaprasaht S, Hamman MA, Ambrosius WT, Bruce MA, Haehner-Daniels B, Hall SD. The effect of age, sex, and rifampin administration on intestinal and hepatic cytochrome P450 3A activity. Clin Pharmacol Ther. 2003 Sep;74(3):275-87.
Greenblat 2003 Greenblatt DJ, von Moltke LL, Harmatz JS, Chen G, Weemhoff JL, Jen C, Kelley CJ, LeDuc BW, Zinny MA. Time course of recovery of cytochrome p450 3A function after single doses of grapefruit juice. Clin Pharmacol Ther. 2003 Aug;74(2):121-9.
Greenblat 2003 Werner U, Werner D, Rau T, Fromm MF, Hinz B, Brune K. Celecoxib inhibits metabolism of cytochrome P450 2D6 substrate metoprolol in humans. Clin Pharmacol Ther. 2003 Aug;74(2):130-7.
Gurley 2006 Gurley B, Hubbard MA, Williams DK, Thaden J, Tong Y, Gentry WB, Breen P, Carrier DJ, Cheboyina S. Assessing the clinical significance of botanical supplementation on human cytochrome P450 3A activity: comparison of a milk thistle and black cohosh product to rifampin and clarithromycin. J Clin Pharmacol. 2006 Feb;46(2):201-13.
Gurley 2008a Gurley BJ, Swain A, Hubbard MA, Hartsfield F, Thaden J, Williams DK, Gentry WB, Tong Y. Supplementation with goldenseal (Hydrastis canadensis), but not kava kava (Piper methysticum), inhibits human CYP3A activity in vivo. Clin Pharmacol Ther. 2008 Jan;83(1):61-9.
Hanke 2018 Hanke N, Frechen S, Moj D, Britz H, Eissing T, Wendl T, Lehr T. PBPK Models for CYP3A4 and P-gp DDI Prediction: A Modeling Network of Rifampicin, Itraconazole, Clarithromycin, Midazolam, Alfentanil, and Digoxin. CPT Pharmacometrics Syst Pharmacol. 2018 Oct;7(10):647-659.
Heikkinen 2012 Heikkinen AT, Baneyx G, Caruso A, Parrott N. Application of PBPK modeling to predict human intestinal metabolism of CYP3A substrates - an evaluation and case study using GastroPlus. Eur J Pharm Sci. 2012 Sep 29;47(2):375-86.
Heizmann 1983 Heizmann P, Eckert M, Ziegler WH. Pharmacokinetics and bioavailability of midazolam in man. Br J Clin Pharmacol. 1983;16 Suppl 1:43S-49S.
Hohmann 2015 Hohmann N, Kocheise F, Carls A, Burhenne J, Haefeli WE, Mikus G. Midazolam microdose to determine systemic and pre-systemic metabolic CYP3A activity in humans. Br J Clin Pharmacol. 2015 Feb;79(2):278-85.
Hyland 2009 Hyland R, Osborne T, Payne A, Kempshall S, Logan YR, Ezzeddine K, Jones B. In vitro and in vivo glucuronidation of midazolam in humans. Br J Clin Pharmacol. 2009 Apr;67(4):445-54.
Ito 2003 Ito K, Ogihara K, Kanamitsu S, Itoh T. Prediction of the in vivo interaction between midazolam and macrolides based on in vitro studies using human liver microsomes. Drug Metab Dispos. 2003 Jul;31(7):945-54.
Katzenmaier 2010 Katzenmaier S, Markert C, Mikus G. Proposal of a new limited sampling strategy to predict CYP3A activity using a partial AUC of midazolam. Eur J Clin Pharmacol. 2010 Nov;66(11):1137-41.
Kharasch 1997 Kharasch ED, Russell M, Mautz D, Thummel KE, Kunze KL, Bowdle A, Cox K. The role of cytochrome P450 3A4 in alfentanil clearance. Implications for interindividual variability in disposition and perioperative drug interactions. Anesthesiology. 1997 Jul;87(1):36-50.
Kharasch 2004 Kharasch ED, Walker A, Hoffer C, Sheffels P. Intravenous and oral alfentanil as in vivo probes for hepatic and first-pass cytochrome P450 3A activity: noninvasive assessment by use of pupillary miosis. Clin Pharmacol Ther. 2004 Nov;76(5):452-66.
Kharasch 2011 Kharasch ED, Francis A, London A, Frey K, Kim T, Blood J. Sensitivity of intravenous and oral alfentanil and pupillary miosis as minimal and noninvasive probes for hepatic and first-pass CYP3A induction. Clin Pharmacol Ther. 2011 Jul;90(1):100-8.
Klieber 2008 Klieber S, Hugla S, Ngo R, Arabeyre-Fabre C, Meunier V, Sadoun F, Fedeli O, Rival M, Bourrie M, Guillou F, Maurel P, Fabre G. Contribution of the N-glucuronidation pathway to the overall in vitro metabolic clearance of midazolam in humans. Drug Metab Dispos. 2008 May;36(5):851-62.
Kuepfer 2016 Kuepfer L, Niederalt C, Wendl T, Schlender JF, Willmann S, Lippert J, Block M, Eissing T, Teutonico D. Applied Concepts in PBPK Modeling: How to Build a PBPK/PD Model.CPT Pharmacometrics Syst Pharmacol. 2016 Oct;5(10):516-531.
Lam 2003 Lam YW, Alfaro CL, Ereshefsky L, Miller M. Pharmacokinetic and pharmacodynamic interactions of oral midazolam with ketoconazole, fluoxetine, fluvoxamine, and nefazodone. J Clin Pharmacol. 2003 Nov;43(11):1274-82.
Link 2008 Link B, Haschke M, Grignaschi N, Bodmer M, Aschmann YZ, Wenk M, Krähenbühl S. Pharmacokinetics of intravenous and oral midazolam in plasma and saliva in humans: usefulness of saliva as matrix for CYP3A phenotyping. Br J Clin Pharmacol. 2008 Oct;66(4):473-84.
Lown 1995 Lown KS, Thummel KE, Benedict PE, Shen DD, Turgeon DK, Berent S, Watkins PB. The erythromycin breath test predicts the clearance of midazolam. Clin Pharmacol Ther. 1995 Jan;57(1):16-24.
Lutz 2018 Lutz JD, Kirby BJ, Wang L, Song Q, Ling J, Massetto B, Worth A, Kearney BP, Mathias A. Cytochrome P450 3A Induction Predicts P-glycoprotein Induction; Part 1: Establishing Induction Relationships Using Ascending Dose Rifampin. Clin Pharmacol Ther . 2018 Dec;104(6):1182-1190.
Majumdar 2007 Majumdar AK, Yan KX, Selverian DV, Barlas S, Constanzer M, Dru J, McCrea JB, Ahmed T, Frick GS, Kraft WK, Petty KJ, Greenberg HE. Effect of aprepitant on the pharmacokinetics of intravenous midazolam. J Clin Pharmacol. 2007 Jun;47(6):744-50.
Markert 2013 Markert C, Hellwig R, Burhenne J, Hoffmann MM, Weiss J, Mikus G, Haefeli WE. Interaction of ambrisentan with clarithromycin and its modulation by polymorphic SLCO1B1. Eur J Clin Pharmacol. 2013 Oct;69(10):1785-93.
Meyer 2012 Meyer M, Schneckener S, Ludewig B, Kuepfer L, Lippert J. Using expression data for quantification of active processes in physiologically based pharmacokinetic modeling. Drug Metab Dispos. 2012 May;40(5):892-901.
Mikus 2017 Mikus G, Heinrich T, Bödigheimer J, Röder C, Matthee AK, Weiss J, Burhenne J, Haefeli WE. Semisimultaneous Midazolam Administration to Evaluate the Time Course of CYP3A Activation by a Single Oral Dose of Efavirenz. J Clin Pharmacol. 2017 Jul;57(7):899-905.
Nishimura 2013 Nishimura M, Yaguti H, Yoshitsugu H, Naito S, Satoh T. Tissue distribution of mRNA expression of human cytochrome P450 isoforms assessed by high-sensitivity real-time reverse transcription PCR. Yakugaku Zasshi. 2003 May;123(5):369-75.
Okudaira 2007 Okudaira T, Kotegawa T, Imai H, Tsutsumi K, Nakano S, Ohashi K. Effect of the treatment period with erythromycin on cytochrome P450 3A activity in humans. J Clin Pharmacol. 2007 Jul;47(7):871-6.
Olkkola 1993 Olkkola KT, Aranko K, Luurila H, Hiller A, Saarnivaara L, Himberg JJ, Neuvonen PJ. A potentially hazardous interaction between erythromycin and midazolam. Clin Pharmacol Ther. 1993 Mar;53(3):298-305.
Olkkola 1994 Olkkola KT, Backman JT, Neuvonen PJ. Midazolam should be avoided in patients receiving the systemic antimycotics ketoconazole or itraconazole. Clin Pharmacol Ther. 1994 May;55(5):481-5.
Olkkola 1996 Olkkola KT, Ahonen J, Neuvonen PJ. The effects of the systemic antimycotics, itraconazole and fluconazole, on the pharmacokinetics and pharmacodynamics of intravenous and oral midazolam. Anesth Analg. 1996 Mar;82(3):511-6.
OSP Database https://github.com/Open-Systems-Pharmacology/Database-for-observed-data
Patki 2003 Patki KC, Von Moltke LL, Greenblatt DJ. In vitro metabolism of midazolam, triazolam, nifedipine, and testosterone by human liver microsomes and recombinant cytochromes p450: role of cyp3a4 and cyp3a5. Drug Metab Dispos. 2003 Jul;31(7):938-44.
Phimmasone 2001 Phimmasone S, Kharasch ED. A pilot evaluation of alfentanil-induced miosis as a noninvasive probe for hepatic cytochrome P450 3A4 (CYP3A4) activity in humans. Clin Pharmacol Ther. 2001 Dec;70(6):505-17.
PK-Sim Ontogeny Database Version 7.3 (https://github.com/Open-Systems-Pharmacology/OSPSuite.Documentation/blob/38cf71b384cfc25cfa0ce4d2f3addfd32757e13b/PK-Sim%20Ontogeny%20Database%20Version%207.3.pdf)
Prueksaritanont 2017 Prueksaritanont T,, Tatosian DA, Chu X, Railkar R, Evers R, Chavez-Eng C, Lutz R, Zeng W, Yabut J, Chan GH, Cai X, Latham AH, Hehman J, Stypinski D, Brejda J, Zhou C, Thornton B, Bateman KP, Fraser I,, Stoch SA. Validation of a microdose probe drug cocktail for clinical drug interaction assessments for drug transporters and CYP3A. Clin Pharmacol Ther. 2017 Apr;101(4):519-530.
Quinney 2008 Quinney SK, Haehner BD, Rhoades MB, Lin Z, Gorski JC, Hall SD. Interaction between midazolam and clarithromycin in the elderly. Br J Clin Pharmacol. 2008 Jan;65(1):98-109.
Rodgers 2006 Rodgers T, Rowland M. Physiologically based pharmacokinetic modelling 2: predicting the tissue distribution of acids, very weak bases, neutrals and zwitterions. J Pharm Sci. 2006 Jun;95(6):1238-57.
Rodrigues 1999 Rodrigues AD. Integrated cytochrome P450 reaction phenotyping: attempting to bridge the gap between cDNA-expressed cytochromes P450 and native human liver microsomes. Biochem Pharmacol. 1999 Mar 1;57(5):465-80.
Saari 2006 Saari TI, Laine K, Leino K, Valtonen M, Neuvonen PJ, Olkkola KT. Effect of voriconazole on the pharmacokinetics and pharmacodynamics of intravenous and oral midazolam. Clin Pharmacol Ther. 2006 Apr;79(4):362-70.
Schwagmeier 1998 Schwagmeier R, Alincic S, Striebel HW. Midazolam pharmacokinetics following intravenous and buccal administration. Br J Clin Pharmacol. 1998 Sep;46(3):203-6.
Shin 2013 Shin KH, Choi MH, Lim KS, Yu KS, Jang IJ, Cho JY. Evaluation of endogenous metabolic markers of hepatic CYP3A activity using metabolic profiling and midazolam clearance. Clin Pharmacol Ther. 2013 Nov;94(5):601-9.
Shin 2016 Shin KH, Ahn LY, Choi MH, Moon JY, Lee J, Jang IJ, Yu KS, Cho JY. Urinary 6β-Hydroxycortisol/Cortisol Ratio Most Highly Correlates With Midazolam Clearance Under Hepatic CYP3A Inhibition and Induction in Females: A Pharmacometabolomics Approach. AAPS J. 2016 Sep;18(5):1254-1261.
Smith 1981 Smith MT, Eadie MJ, Brophy TO. The pharmacokinetics of midazolam in man. Eur J Clin Pharmacol. 1981 Mar;19(4):271-8.
Swart 2002 Swart EL, van der Hoven B, Groeneveld AB, Touw DJ, Danhof M. Correlation between midazolam and lignocaine pharmacokinetics and MEGX formation in healthy volunteers. Br J Clin Pharmacol. 2002 Feb;53(2):133-9.
Szalat 2007 Szalat A, Gershkovich P, Ben-Ari A, Shaish A, Liberman Y, Boutboul E, Gotkine M, Hoffman A, Harats D, Leitersdorf E, Meiner V. Rifampicin-induced CYP3A4 activation in CTX patients cannot replace chenodeoxycholic acid treatment. Biochim Biophys Acta. 2007 Jul;1771(7):839-44.
Templeton 2010 Templeton I, Peng CC, Thummel KE, Davis C, Kunze KL, Isoherranen N. Accurate prediction of dose-dependent CYP3A4 inhibition by itraconazole and its metabolites from in vitro inhibition data. Clin Pharmacol Ther. 2010 Oct;88(4):499-505.
Tham 2006 Tham LS, Lee HS, Wang L, Yong WP, Fan L, Ong AB, Sukri N, Soo R, Lee SC, Goh BC. Ketoconazole renders poor CYP3A phenotype status with midazolam as probe drug. Ther Drug Monit. 2006 Apr;28(2):255-61.
Thummel 1996 Thummel KE, O'Shea D, Paine MF, Shen DD, Kunze KL, Perkins JD, Wilkinson GR. Oral first-pass elimination of midazolam involves both gastrointestinal and hepatic CYP3A-mediated metabolism. Clin Pharmacol Ther. 1996 May;59(5):491-502.
van Dyk 2018 van Dyk M, Marshall JC, Sorich MJ, Wood LS, Rowland A. Assessment of inter-racial variability in CYP3A4 activity and inducibility among healthy adult males of Caucasian and South Asian ancestries. Eur J Clin Pharmacol. 2018 Jul;74(7):913-920.
Wang 2019 Wang YH, Chen D, Hartmann G, Cho CR, Menzel K. PBPK Modeling Strategy for Predicting Complex Drug Interactions of Letermovir as a Perpetrator in Support of Product Labeling. Clin Pharmacol Ther. 2019 Feb;105(2):515-523.
Wiesinger 2020 Wiesinger H, Klein S, Rottmann A, Nowotn B, Riecke K, Gashaw I, Brudny-Klöppel M, Fricke R, Höchel J, Friedrich C. The effects of weak and strong CYP3A induction by rifampicin on the pharmacokinetics of five progestins and ethinylestradiol compared to midazolam. Clin Pharmacol Ther. 2020 Apr 10.
Willmann 2007 Willmann S, Höhn K, Edginton A, Sevestre M, Solodenko J, Weiss W, Lippert J, Schmitt W. Development of a physiology-based whole-body population model for assessing the influence of individual variability on the pharmacokinetics of drugs. J Pharmacokinet Pharmacodyn. 2007, 34(3): 401-431.
Yeates 1996 Yeates RA, Laufen H, Zimmermann T. Interaction between midazolam and clarithromycin: comparison with azithromycin. Int J Clin Pharmacol Ther. 1996 Sep;34(9):400-5.
Yu 2004 Yu KS, Cho JY, Jang IJ, Hong KS, Chung JY, Kim JR, Lim HS, Oh DS, Yi SY, Liu KH, Shin JG, Shin SG. Effect of the CYP3A5 genotype on the pharmacokinetics of intravenous midazolam during inhibited and induced metabolic states. Clin Pharmacol Ther. 2004 Aug;76(2):104-12.
Zimmermann 1996 Zimmermann T, Yeates RA, Laufen H, Scharpf F, Leitold M, Wildfeuer A. Influence of the antibiotics erythromycin and azithromycin on the pharmacokinetics and pharmacodynamics of midazolam. Arzneimittelforschung. 1996 Feb;46(2):213-7.
Related Models
Explore other Sedatives & Anxiolytics models in this library:
- Alprazolam - PBPK model and evaluation report
- Triazolam - PBPK model and evaluation report