Building and evaluation of a PBPK model for Itraconazole in healthy adults¶
| Version | 2.0-OSP12.3 |
|---|---|
| based on Model Snapshot and Evaluation Plan | https://github.com/Open-Systems-Pharmacology/Itraconazole-Model/releases/tag/v2.0 |
| OSP Version | 12.3 |
| Qualification Framework Version | 3.7 |
This evaluation report and the corresponding PK-Sim project file are filed at:
https://github.com/Open-Systems-Pharmacology/OSP-PBPK-Model-Library/
Table of Contents¶
- 1 Introduction
- 2 Methods
- 2.1 Modeling Strategy
- 2.2 Data
- 2.3 Model Parameters and Assumptions
- 3 Results and Discussion
- 3.1 Final input parameters
- 3.2 Diagnostics Plots
- 3.3 Concentration-Time Profiles
- 4 Conclusion
- 5 References
1 Introduction¶
Itraconazole is a triazole agent prescribed for the treatment of fungal infections. It is predominantly metabolized by CYP3A4, resulting in the sequential formation of several metabolites, starting with the major metabolite hydroxy-itraconazole, followed by keto-itraconazole and N-desalkyl-itraconazole. All three metabolites are further metabolized by CYP3A4 and parent and metabolites are reported to competitively inhibit CYP3A4 (Isoherranen 2004). Therefore, the metabolites inhibit their own formation and itraconazole inhibits further conversion of its metabolites by CYP3A4. Itraconazole has been proposed as one of the most appropriate CYP3A4 inhibitors for clinical DDI studies, to replace the currently no longer recommended CYP3A4 inhibitor drug ketoconazole.
The herein presented model represents an update of the itraconazole model publisdhed by Hanke et al. (Hanke 2018). The model was originally established using various clinical studies, covering a dosing range from 100 to 200 mg in different formulations (solution and capsules), administered under fasted conditions or together with food. Although the plasma concentrations of keto-itraconazole and N-desalkyl-itraconazole are lower than those of itraconazole and hydroxy-itraconazole, N-desalkyl-itraconazole is reported to be a very potent inhibitor in vitro, and integration of the two further metabolites into the model with their inhibitory effects enabled the description the strong non-linearity and plasma accumulation of itraconazole. The model applies sequential metabolism of itraconazole to hydroxy-itraconazole to keto-itraconazole to N-desalkyl-itraconazole by CYP3A4, including competitive inhibition of CYP3A4 by the parent drug and all three metabolites, and glomerular filtration. Competitive inhibition of P-gp was included for itracaonazole.
In comparison to the published version by Hanke et al. 2018 (Hanke 2018), the dissolution and solubility has been optimized and updated for the administration of itraconazole capsules in fasted state (by integrating additional data (Jalava 1997) into the optimization routine).
2 Methods¶
2.1 Modeling Strategy¶
The general concept of building a PBPK model has previously been described by Kuepfer et al. (Kuepfer 2016). Relevant information on anthropometric (height, weight) and physiological parameters (e.g. blood flows, organ volumes, binding protein concentrations, hematocrit, cardiac output) in adults was gathered from the literature and has been previously published (Willmann 2007). The information was incorporated into PK-Sim® and was used as default values for the simulations in adults.
The applied activity and variability of plasma proteins and active processes that are integrated into PK-Sim® are described in the publicly available PK-Sim® Ontogeny Database Version 7.3 (PK-Sim Ontogeny Database Version 7.3) or otherwise referenced for the specific process.
First, a mean model including sequential metabolism of itraconazole to hydroxy-itraconazole to keto-itraconazole to N-desalkyl-itraconazole by CYP3A4 was built using clinical data from single dose and multiple dose studies with intravenous and oral administration (solution, fasted state) of itraconazole. Hereby, competitive inhibition of CYP3A4 was considered for all four compounds. The mean PBPK model was developed using a typical European individual. The relative tissue-specific expressions of enzymes predominantly being involved in the metabolism of midazolam (CYP3A4) were considered.
A specific set of parameters (see below) was optimized using the Parameter Identification module provided in PK-Sim®. Structural model selection was mainly guided by visual inspection of the resulting description of data and biological plausibility.
Once the appropriate structural model was identified, additional parameters for different administration states (solution fed, capsule fasted and capsule fed versus the reference state solution fasted) were empirically optimized. Clinical data suggest that the bioavailability of itraconazole is enhanced when an oral solution is given in the fasted state compared to fed state (Van de Welde 1996, Barone 1998a). In contrast, a meal significantly enhances the amount of itraconazole absorbed after administrations of capsules (in comparison to fasted state administrations of capsules) (Barone 1993a). To reflect these observations, relevant parameters, in particular solubility and those describing dissolution kinetics (of capsules), were assumed to be variable between these four scenarios and were independently identified using the Parameter Identification module provided in PK-Sim®.
Details about compound properties (physicochemical, in vitro and clinical) can be found in Section 2.2.
Details about the structural model and its parameters can be found in Section 2.3.
2.2 Data¶
2.2.1 In vitro and physicochemical data¶
A literature search was performed to collect available information on physicochemical properties of itraconazole and metabolites. The obtained information from literature is summarized in the table below and was used for model building. Note that not all parameters were used in the final model. A list of final model parameters is provided below in later sections.
Itraconazole¶
| Parameter | Unit | Value | Source | Description |
|---|---|---|---|---|
| MW | g/mol | 705.633 | DrugBank DB01167 | Molecular weight |
| pKa,base | 3.7 | Heykants 1989 | acid dissociation constant of conjugate acid; compound type: base | |
| Solubility (pH) | mg/L | 8.0 (6.5) |
Taupitz 2013 | Solubility in FaSSIF (fasted state simulated intestinal fluid) |
| logP | 5.66 | Heykants 1989 | Partition coefficient between octanol and water | |
| fu | % | 0.2 | Heykants 1989 | Fraction unbound in plasma |
| % | 0.2 | Riccardi 2015 | Fraction unbound in plasma | |
| % | 1.58 | Ishigam 2001 | Fraction unbound in plasma | |
| % | 3.6 | Templeton 2008 | Fraction unbound in plasma | |
| Vmax, Km CYP3A4 | pmol/min/nmol, nmol/L |
270 3.9 |
Isoherranen 2004 | CYP3A4 supersomes Michaelis-Menten kinetics |
| Ki CYP3A4 | nmol/L | 1.3 | Isoherranen 2004 | CYP3A4 inhibition constant |
| Ki P-gp | nmol/L | 8.0 | Shityakov 2014 | P-gp inhibition constant |
Hydroxy-itraconazole¶
| Parameter | Unit | Value | Source | Description |
|---|---|---|---|---|
| MW | g/mol | 721.633 | DrugBank DBMET00374 | Molecular weight |
| logP | 4.5 | PubChem CID 108222 | Partition coefficient between octanol and water, computed by XLogP3 3.0 | |
| fu | % | 0.5 | Templeton 2008 | Fraction unbound in plasma |
| % | 1.7 | Riccardi 2015 | Fraction unbound in plasma | |
| % | 2.12 | Chen 2016 | Fraction unbound in plasma | |
| Vmax, Km CYP3A4 | pmol/min/nmol, nmol/L |
543 27 |
Isoherranen 2004 | CYP3A4 supersomes Michaelis-Menten kinetics |
| Ki CYP3A4 | nmol/L | 14.4 | Isoherranen 2004 | CYP3A4 inhibition constant |
Keto-itraconazole¶
| Parameter | Unit | Value | Source | Description |
|---|---|---|---|---|
| MW | g/mol | 719.617 | PubChem CID 53865186 | Molecular weight |
| logP | 4.5 | PubChem CID 53865186 | Partition coefficient between octanol and water, computed by XLogP3 3.0 | |
| fu | % | 1.0 | Riccardi 2015 | Fraction unbound in plasma |
| % | 5.3 | Templeton 2008 | Fraction unbound in plasma | |
| Vmax, Km CYP3A4 | pmol/min/nmol, nmol/L |
86.9 1.4 |
Isoherranen 2004 | CYP3A4 supersomes Michaelis-Menten kinetics |
| IC50 CYP3A4† | nmol/L | 7.0 | Isoherranen 2004 | CYP3A4 inhibition constant for half maximal inhibitory concentration at constant substrate concentration |
† The IC50 values was converted to a Ki value via Cheng-Prusoff equation (Chen 1973) with a substrate (midazolam) concentration of 1 µmol/L and an assumed substrate (midazolam) Km value of 2.73 µmol/L: 5.12 nmol/L
N-Desalkyl-itraconazole¶
| Parameter | Unit | Value | Source | Description |
|---|---|---|---|---|
| MW | g/mol | 649.527 | PubChem CID 53789808 | Molecular weight |
| logP | 4.2 | PubChem CID 53789808 | Partition coefficient between octanol and water, computed by XLogP3 3.0 | |
| fu | % | 1.1 | Riccardi 2015 | Fraction unbound in plasma |
| % | 1.2 | Templeton 2008 | Fraction unbound in plasma | |
| IC50 CYP3A4† | nmol/L | 0.44 | Isoherranen 2004 | CYP3A4 inhibition constant for half maximal inhibitory concentration at constant substrate concentration |
† The IC50 values was converted to a Ki value via Cheng-Prusoff equation (Chen 1973) with a substrate (midazolam) concentration of 1 µmol/L and an assumed substrate (midazolam) Km value of 2.73 µmol/L: 0.32 nmol/L
2.2.2 Clinical data¶
A literature search was performed to collect available clinical data on itraconazole and its metabolites in adults. The itraconazole model was built and verified using various clinical studies, covering a dosing range of 100 to 200 mg with different formulations (solution vs. capsule), administered under fasting conditions or together with food.
The following dosing senarios were simulated and compared to respective data:
| Route | Formulation | Food state | Dose [mg] |
Dosing | PK Data | Used for† | Reference |
|---|---|---|---|---|---|---|---|
| iv | - | - | 100 | SD | Itraconazole | mv | Heykants 1989 |
| 200 | OD | Itraconazole Hydroxy-Itr. |
mbb | Mouton 2006 | |||
| po | solution | fasted | 100 | SD | Itraconazole | mbb | Van de Velde 1996 |
| Itraconazole Hydroxy-Itr. |
mbb | Van Peer 1989 | |||||
| OD | Itraconazole Hydroxy-Itr. Keto-Itr. N-Desalkyl-Itr. |
mbb | Templeton 2008 | ||||
| 200 | OD | Itraconazole Hydroxy-Itr. |
mbb | Barone 1998a | |||
| fed | 100 | SD | Itraconazole Hydroxy-Itr. |
mbe | Van de Velde 1996 | ||
| Itraconazole | mbe | Heykants 1989 | |||||
| 200 | SD | Itraconazole Hydroxy-Itr. |
mbe | Barone 1998b | |||
| OD | Itraconazole Hydroxy-Itr. |
mbe | Barone 1998a | ||||
| capsule | fasted | 100 | SD | Itraconazole | mbe | Van Peer 1989 | |
| BID | Itraconazole | mv | Kivistö 1997 | ||||
| 200 | SD | Itraconazole Hydroxy-Itr. |
mbe | Barone 1993 | |||
| Itraconazole | mv | Neuvonen 1996 | |||||
| OD | Itraconazole | mbe | Jalava 1997 | ||||
| Itraconazole | mbe | Olkkola 1994 | |||||
| Itraconazole | mv | Varhe 1994 | |||||
| fed | 100 | SD | Itraconazole | mbe | Van Peer 1989 | ||
| OD | Itraconazole | mbe | Van Peer 1989 | ||||
| Itraconazole | mv | Hardin 1988 | |||||
| 200 | SD | Itraconazole Hydroxy-Itr. |
mbe | Barone 1993 | |||
| Itraconazole Hydroxy-Itr. |
mbe | Barone 1998b | |||||
| Itraconazole | mv | Neuvonen 1996 | |||||
| 200 | OD | Itraconazole | mv | Hardin 1988 | |||
| BID | Itraconazole | mbe | Barone 1993 | ||||
| Itraconazole Hydroxy-Itr. |
mv | Hardin 1988 |
† mbb model building basic: used to inform the basic model parameters (see Section 2.3.5); mbe model building extended: used to inform solubility and, if applicable, formulation-depenendent parameters only (see Section 2.3.5); mv model verification only
2.3 Model Parameters and Assumptions¶
2.3.1 Absorption¶
Clinical data suggest that the bioavailability of itraconazole is enhanced when an oral solution is given in the fasted state compared to fed state (Van de Welde 1996, Barone 1998a). In contrast, a meal significantly enhances the amount of itraconazole absorbed after administrations of capsules (in comparison to fasted state administrations of capsules) (Barone 1993a). Thus, four different scenarios can be identified: solution fasted, solution fed, capsule fasted and capsule fed. The solution fasted scenario was considered to be the reference scenario.
Herein, the model parameter Specific intestinal permeability was optimized to best match clinical data (see Section 2.3.5). The default solubility was assumed to be the measured value in FaSSIF (fasted state simulated intestinal fluid; see Section 2.2.1).
In a next step, the solubility was optimized for the solution fed scenario (in comparison to solution fasted).
Then, for the scenarios capsule fasted and capsule fed, solubility and the dissolution rate of the capsules (implemented via an empirical Weibull dissolution) were optimized.
The results of the optimization can be found in Section 2.3.5.
2.3.2 Distribution¶
Various values for the fraction unbound of itraconazole have been reported in literature, ranging from 0.2 to 3.6% (see Section 2.2.1). For this model, the final value was optimized within this range to best match observed clinical data (see Section 2.3.5). For the metabolites, the measured values reported by Riccardi et al. (Riccardi 2015) were incorporated into the model. It was assumed that the major binding partner is albumin.
No pKa values were reported for the three metabolites. Here, it was assumed that the metabolites are similar to the parent drug and the reported basic pKa value of 3.7 was applied (see also Section 2.2.1)
An important parameter influencing the resulting volume of distribution is lipophilicty. The reported experimental or predicted logP values served as starting values for the four compounds. Finally, the model parameters Lipophilicity were optimized to match best clinical data (see also Section 2.3.5).
After testing the available organ-plasma partition coefficient and cell permeability calculation methods built in PK-Sim®, observed clinical data was best described by choosing the partition coefficient calculation by Rodgers and Rowland and cellular permeability calculation by PK-Sim Standard for itraconazole and its metabolites.
2.3.3 Metabolism and Elimination¶
Metabolic pathways via CYP3A4 were implemented in the model via Michaelis-Menten kinetics for all four compounds. If available, in vitro determined unbound Km values (Isoherranen 2004) served as starting values. Respective kcat values were optimized to best match clinical data (see also Section 2.3.5).
The CYP3A4 expression profile is based on high-sensitivity real-time RT-PCR (Nishimura 2013). Absolute tissue-specific concentrations were obtained by considering the respective absolute concentration in the liver. The PK-Sim® Ontogeny Database Version 7.3 provides a default value for CYP3A4 reference concentration in the liver (compare Rodrigues 1999 and assume 40 mg protein per gram liver).
Additionally, for all four compounds a renal clearance (assumed to be driven by glomerular filtration) was implemented.
2.3.4 DDI Parameters¶
The following subsections describe the model input for DDI-related parameters, i.e. inhibition of certain enzymes and transporters, for which itraconazole may act in a perpetrator role. Verification of these model parameters and linked processes in combination with sensitive CYP3A4 / P-gp substrates is not evaluated in this report. Applications are assessed in specific use cases and reported elsewhere. Note, however, that the competitive CYP3A4 inhibition of the four compounds results in inhibition of metabolite formation (of hydroxy-itraconazole, keto-itraconazole, N-desalkyl-itraconazole) and the metabolism of N-desalkyl-itraconazole. This effectively contributes to the PK non-linearity of itraconazole and its metabolites, especially after multiple doses.
CYP3A4 inhibition¶
In vitro determined unbound Ki values for itraconazole and hydroxy-itraconazole (Isoherranen 2004) served directly as model input (see Section 2.2.1).
In vitro determined unbound IC50 values for keto-itraconazole and N-desalkyl-itraconazol (Isoherranen 2004) were converted to Ki values via the Cheng-Prusoff equation (Chen 1973) with a substrate (midazolam) concentration of 1 µmol/L and an assumed substrate (midazolam) Km value of 2.73 µmol/L (see Section 2.2.1).
P-gp inhibition¶
An in vitro determined Ki values for itraconazole (Shityakov 2014) served directly as model input (see Section 2.2.1).
2.3.5 Automated Parameter Identification¶
This is the result of the final parameter identification for the basic model:
| Compound | Model Parameter | Optimized Value | Unit |
|---|---|---|---|
| Itraconazole | Lipophilicity |
4.62 | Log Units |
Specific intestinal permeability |
5.33E-05 | dm/min | |
Fraction unbound (plasma, reference value) |
0.6 | % | |
Km (CYP3A4) |
2.07 | nmol/L | |
kcat (CYP3A4) |
0.040 | 1/min | |
| Hydroxy-Itr. | Lipophilicity |
3.72 | Log Units |
Fraction unbound (plasma, reference value) |
1.7 FIXED (see Section 2.2.1) | % | |
Km (CYP3A4) |
4.17 | nmol/L | |
kcat (CYP3A4) |
0.020 | 1/min | |
| Keto-Itr. | Lipophilicity |
4.21 | Log Units |
Fraction unbound (plasma, reference value) |
1.0 FIXED (see Section 2.2.1) | % | |
Km (CYP3A4) |
2.22 | nmol/L | |
kcat (CYP3A4) |
0.393 | 1/min | |
| N-Desalkyl-Itr. | Lipophilicity |
5.18 | Log Units |
Fraction unbound (plasma, reference value) |
1.1 FIXED (see Section 2.2.1) | % | |
Km (CYP3A4) |
0.63 | nmol/L | |
kcat (CYP3A4) |
0.061 | 1/min |
This is the result of the final parameter identification for the solubility and, in case of capsule administrations, the dissolution parameters of an empirical Weibull function according to the different administration scenarios of itraconazole:
| Scenario | Model Parameter | Optimized Value | Unit |
|---|---|---|---|
| Solution fasted | Solubility at reference pH |
8.0 FIXED (see Section 2.2.1) | mg/L |
| Solution fed | Solubility at reference pH |
1.58 | mg/L |
| Capsule fasted | Solubility at reference pH |
0.97 | mg/L |
Dissolution time (50% dissolved) |
406 | min | |
Dissolution shape |
1.43 | ||
| Capsule fed | Solubility at reference pH |
0.70 | mg/L |
Dissolution time (50% dissolved) |
139 | min | |
Dissolution shape |
0.82 |
3 Results and Discussion¶
The PBPK model for itraconazole was developed and verified with clinical pharmacokinetic data.
The model was built and evaluated covering data from various clinical studies, covering a dosing range of 100 to 200 mg in different formulations (solution vs. capsule), administered under fasting conditions or together with food.
The model quantifies metabolism via CYP3A4 and inhibition of CYP3A4.
The next sections show:
- the final model input parameters for the building blocks: Section 3.1.
- the overall goodness of fit: Section 3.2.
- simulated vs. observed concentration-time profiles for the clinical studies used for model building and for model verification: Section 3.3.
3.1 Final input parameters¶
The compound parameter values of the final PBPK model are illustrated below.
Compound: Itraconazole¶
Parameters¶
| Name | Value | Value Origin | Alternative | Default |
|---|---|---|---|---|
| Solubility at reference pH | 8 mg/l | Publication-Taupitz et al. 2013 | Solution fasted (Taupitz et al. 2013) | True |
| Reference pH | 6.5 | Publication-Taupitz et al. 2013 | Solution fasted (Taupitz et al. 2013) | True |
| Solubility at reference pH | 1.58 mg/l | Solution fed | False | |
| Reference pH | 6.5 | Solution fed | False | |
| Solubility at reference pH | 0.9728307177 mg/l | Parameter Identification-Parameter Identification-Value updated from 'Capsule fasted' on 2019-05-15 12:25 | Capsule fasted | False |
| Reference pH | 6.5 | Capsule fasted | False | |
| Solubility at reference pH | 0.7 mg/l | Capsule fed | False | |
| Reference pH | 6.5 | Capsule fed | False | |
| Lipophilicity | 4.624 Log Units | Parameter Identification-Fit | Fit | True |
| Fraction unbound (plasma, reference value) | 0.6016197247 % | Templeton, 2008 | True | |
| Specific intestinal permeability (transcellular) | 5.3261558344E-05 dm/min | Parameter Identification-Fit | Fit | True |
| Cl | 2 | |||
| Is small molecule | Yes | |||
| Molecular weight | 705.633 g/mol | |||
| Plasma protein binding partner | Albumin |
Calculation methods¶
| Name | Value |
|---|---|
| Partition coefficients | Rodgers and Rowland |
| Cellular permeabilities | PK-Sim Standard |
Processes¶
Metabolizing Enzyme: CYP3A4-Isoherranen 2004¶
Molecule: CYP3A4
Metabolite: Hydroxy-Itraconazole
Parameters¶
| Name | Value | Value Origin |
|---|---|---|
| In vitro Vmax/recombinant enzyme | 0.27 pmol/min/pmol rec. enzyme | Publication-Isoherranen 2004 |
| Km | 2.0688492598 nmol/l | Publication-Isoherranen 2004 |
| kcat | 0.0402937875 1/min | Unknown |
Systemic Process: Glomerular Filtration-GFR¶
Species: Human
Parameters¶
| Name | Value | Value Origin |
|---|---|---|
| GFR fraction | 1 | Publication-Isoherranen 2004 |
Inhibition: CYP3A4-Isoherranen, 2004¶
Molecule: CYP3A4
Parameters¶
| Name | Value | Value Origin |
|---|---|---|
| Ki | 1.3 nmol/l | Parameter Identification-Isoherranen, 2004 |
Inhibition: ABCB1-Shityakov 2014¶
Molecule: ABCB1
Parameters¶
| Name | Value | Value Origin |
|---|---|---|
| Ki | 0.008 µmol/l | Publication-Shityakov 2014 |
Compound: Hydroxy-Itraconazole¶
Parameters¶
| Name | Value | Value Origin | Alternative | Default |
|---|---|---|---|---|
| Solubility at reference pH | 1 mg/l | No value available | True | |
| Reference pH | 7 | No value available | True | |
| Lipophilicity | 3.718 Log Units | Fit | True | |
| Fraction unbound (plasma, reference value) | 1.7 % | Publication-Templeton, 2008 | Templeton, 2008 | True |
| Cl | 2 | |||
| Is small molecule | Yes | |||
| Molecular weight | 721.633 g/mol | |||
| Plasma protein binding partner | Albumin |
Calculation methods¶
| Name | Value |
|---|---|
| Partition coefficients | Rodgers and Rowland |
| Cellular permeabilities | PK-Sim Standard |
Processes¶
Metabolizing Enzyme: CYP3A4-Isoherranen 2004¶
Molecule: CYP3A4
Metabolite: Keto-Itraconazole
Parameters¶
| Name | Value | Value Origin |
|---|---|---|
| In vitro Vmax/recombinant enzyme | 0.543 nmol/min/pmol rec. enzyme | Publication-Isoherranen 2004 |
| Km | 4.1716224833 nmol/l | Publication-Isoherranen 2004 |
| kcat | 0.0203370845 1/min | Unknown |
Systemic Process: Glomerular Filtration-GFR¶
Species: Human
Parameters¶
| Name | Value | Value Origin |
|---|---|---|
| GFR fraction | 1 | Publication-Isoherranen, 2004 |
Inhibition: CYP3A4-Isoherranen, 2004¶
Molecule: CYP3A4
Parameters¶
| Name | Value | Value Origin |
|---|---|---|
| Ki | 14.4 nmol/l | Publication-Isoherranen, 2004 |
Inhibition: OATP1B1-Tuerk 2019¶
Molecule: OATP1B1
Parameters¶
| Name | Value | Value Origin |
|---|---|---|
| Ki | 0.0177818488 µmol/l | Parameter Identification-Parameter Identification |
Inhibition: OATP1B3-Tuerk 2019¶
Molecule: OATP1B3
Parameters¶
| Name | Value | Value Origin |
|---|---|---|
| Ki | 0.0111606334 µmol/l | Parameter Identification-Parameter Identification |
Compound: Keto-Itraconazole¶
Parameters¶
| Name | Value | Value Origin | Alternative | Default |
|---|---|---|---|---|
| Solubility at reference pH | 1 mg/l | No value available | True | |
| Reference pH | 7 | No value available | True | |
| Lipophilicity | 4.2109086248 Log Units | Fit | True | |
| Fraction unbound (plasma, reference value) | 1 % | Publication-Templeton, 2008 | Templeton, 2008 | True |
| Cl | 2 | |||
| Is small molecule | Yes | |||
| Molecular weight | 719.617 g/mol | |||
| Plasma protein binding partner | Albumin |
Calculation methods¶
| Name | Value |
|---|---|
| Partition coefficients | Rodgers and Rowland |
| Cellular permeabilities | PK-Sim Standard |
Processes¶
Metabolizing Enzyme: CYP3A4-Isoherranen 2004¶
Molecule: CYP3A4
Metabolite: N-desalkyl-Itraconazole
Parameters¶
| Name | Value | Value Origin |
|---|---|---|
| In vitro Vmax/recombinant enzyme | 0.0869 pmol/min/pmol rec. enzyme | Publication-Isoherranen 2004 |
| Km | 2.2214874285 nmol/l | Publication-Isoherranen 2004 |
| kcat | 0.3933927416 1/min | Unknown |
Systemic Process: Glomerular Filtration-GFR¶
Species: Human
Parameters¶
| Name | Value | Value Origin |
|---|---|---|
| GFR fraction | 1 | Publication-Isoherranen 2004 |
Inhibition: CYP3A4-Isoherranen, 2004¶
Molecule: CYP3A4
Parameters¶
| Name | Value | Value Origin |
|---|---|---|
| Ki | 5.12 nmol/l | Publication-Isoherranen 2004 |
Compound: N-desalkyl-Itraconazole¶
Parameters¶
| Name | Value | Value Origin | Alternative | Default |
|---|---|---|---|---|
| Solubility at reference pH | 1 mg/l | No value available | True | |
| Reference pH | 7 | No value available | True | |
| Lipophilicity | 5.1837535822 Log Units | Fit | True | |
| Fraction unbound (plasma, reference value) | 1.1 % | Publication-Templeton, 2008 | Templeton, 2008 | True |
| Cl | 2 | |||
| Is small molecule | Yes | |||
| Molecular weight | 649.527 g/mol | |||
| Plasma protein binding partner | Albumin |
Calculation methods¶
| Name | Value |
|---|---|
| Partition coefficients | Rodgers and Rowland |
| Cellular permeabilities | PK-Sim Standard |
Processes¶
Metabolizing Enzyme: CYP3A4-Isoherranen 2004¶
Molecule: CYP3A4
Parameters¶
| Name | Value | Value Origin |
|---|---|---|
| In vitro Vmax/recombinant enzyme | 0 nmol/min/pmol rec. enzyme | |
| Km | 0.6284266369 nmol/l | Publication-Isoherranen 2004 |
| kcat | 0.0605873508 1/min | Unknown |
Systemic Process: Glomerular Filtration-GFR¶
Species: Human
Parameters¶
| Name | Value | Value Origin |
|---|---|---|
| GFR fraction | 1 | Publication-Isoherranen 2004 |
Inhibition: CYP3A4-Isoherranen, 2004¶
Molecule: CYP3A4
Parameters¶
| Name | Value | Value Origin |
|---|---|---|
| Ki | 0.32 nmol/l | Publication-Isoherranen, 2004 |
Formulation: Capsule fasted¶
Type: Weibull
Parameters¶
| Name | Value | Value Origin |
|---|---|---|
| Dissolution time (50% dissolved) | 406.3001802552 min | Parameter Identification-Parameter Identification-Value updated from 'Capsule fasted' on 2019-05-15 12:25 |
| Lag time | 0 min | |
| Dissolution shape | 1.4297720052 | Parameter Identification-Parameter Identification-Value updated from 'Capsule fasted' on 2019-05-15 12:25 |
| Use as suspension | Yes |
Formulation: Capsule fed¶
Type: Weibull
Parameters¶
| Name | Value | Value Origin |
|---|---|---|
| Dissolution time (50% dissolved) | 138.95 min | |
| Lag time | 0 min | |
| Dissolution shape | 0.82 | |
| Use as suspension | Yes |
3.2 Diagnostics Plots¶
Below you find the goodness-of-fit visual diagnostic plots for the PBPK model performance of all data used presented in Section 2.2.2.
The plot show observed versus simulated plasma concentration and second weighted residuals versus time for itraconazole, hydroxy-itraconazole, keto-itraconazole and N-desalkyl-itraconazole.
Table 3-1: GMFE for Itraconazole concentration in plasma
| Group | GMFE |
|---|---|
| Itraconazole iv | 1.29 |
| Itraconazole po capsule fasted | 1.74 |
| Itraconazole po capsule fed | 1.57 |
| Itraconazole po solution fasted | 1.54 |
| Itraconazole po solution fed | 1.46 |
| All | 1.54 |
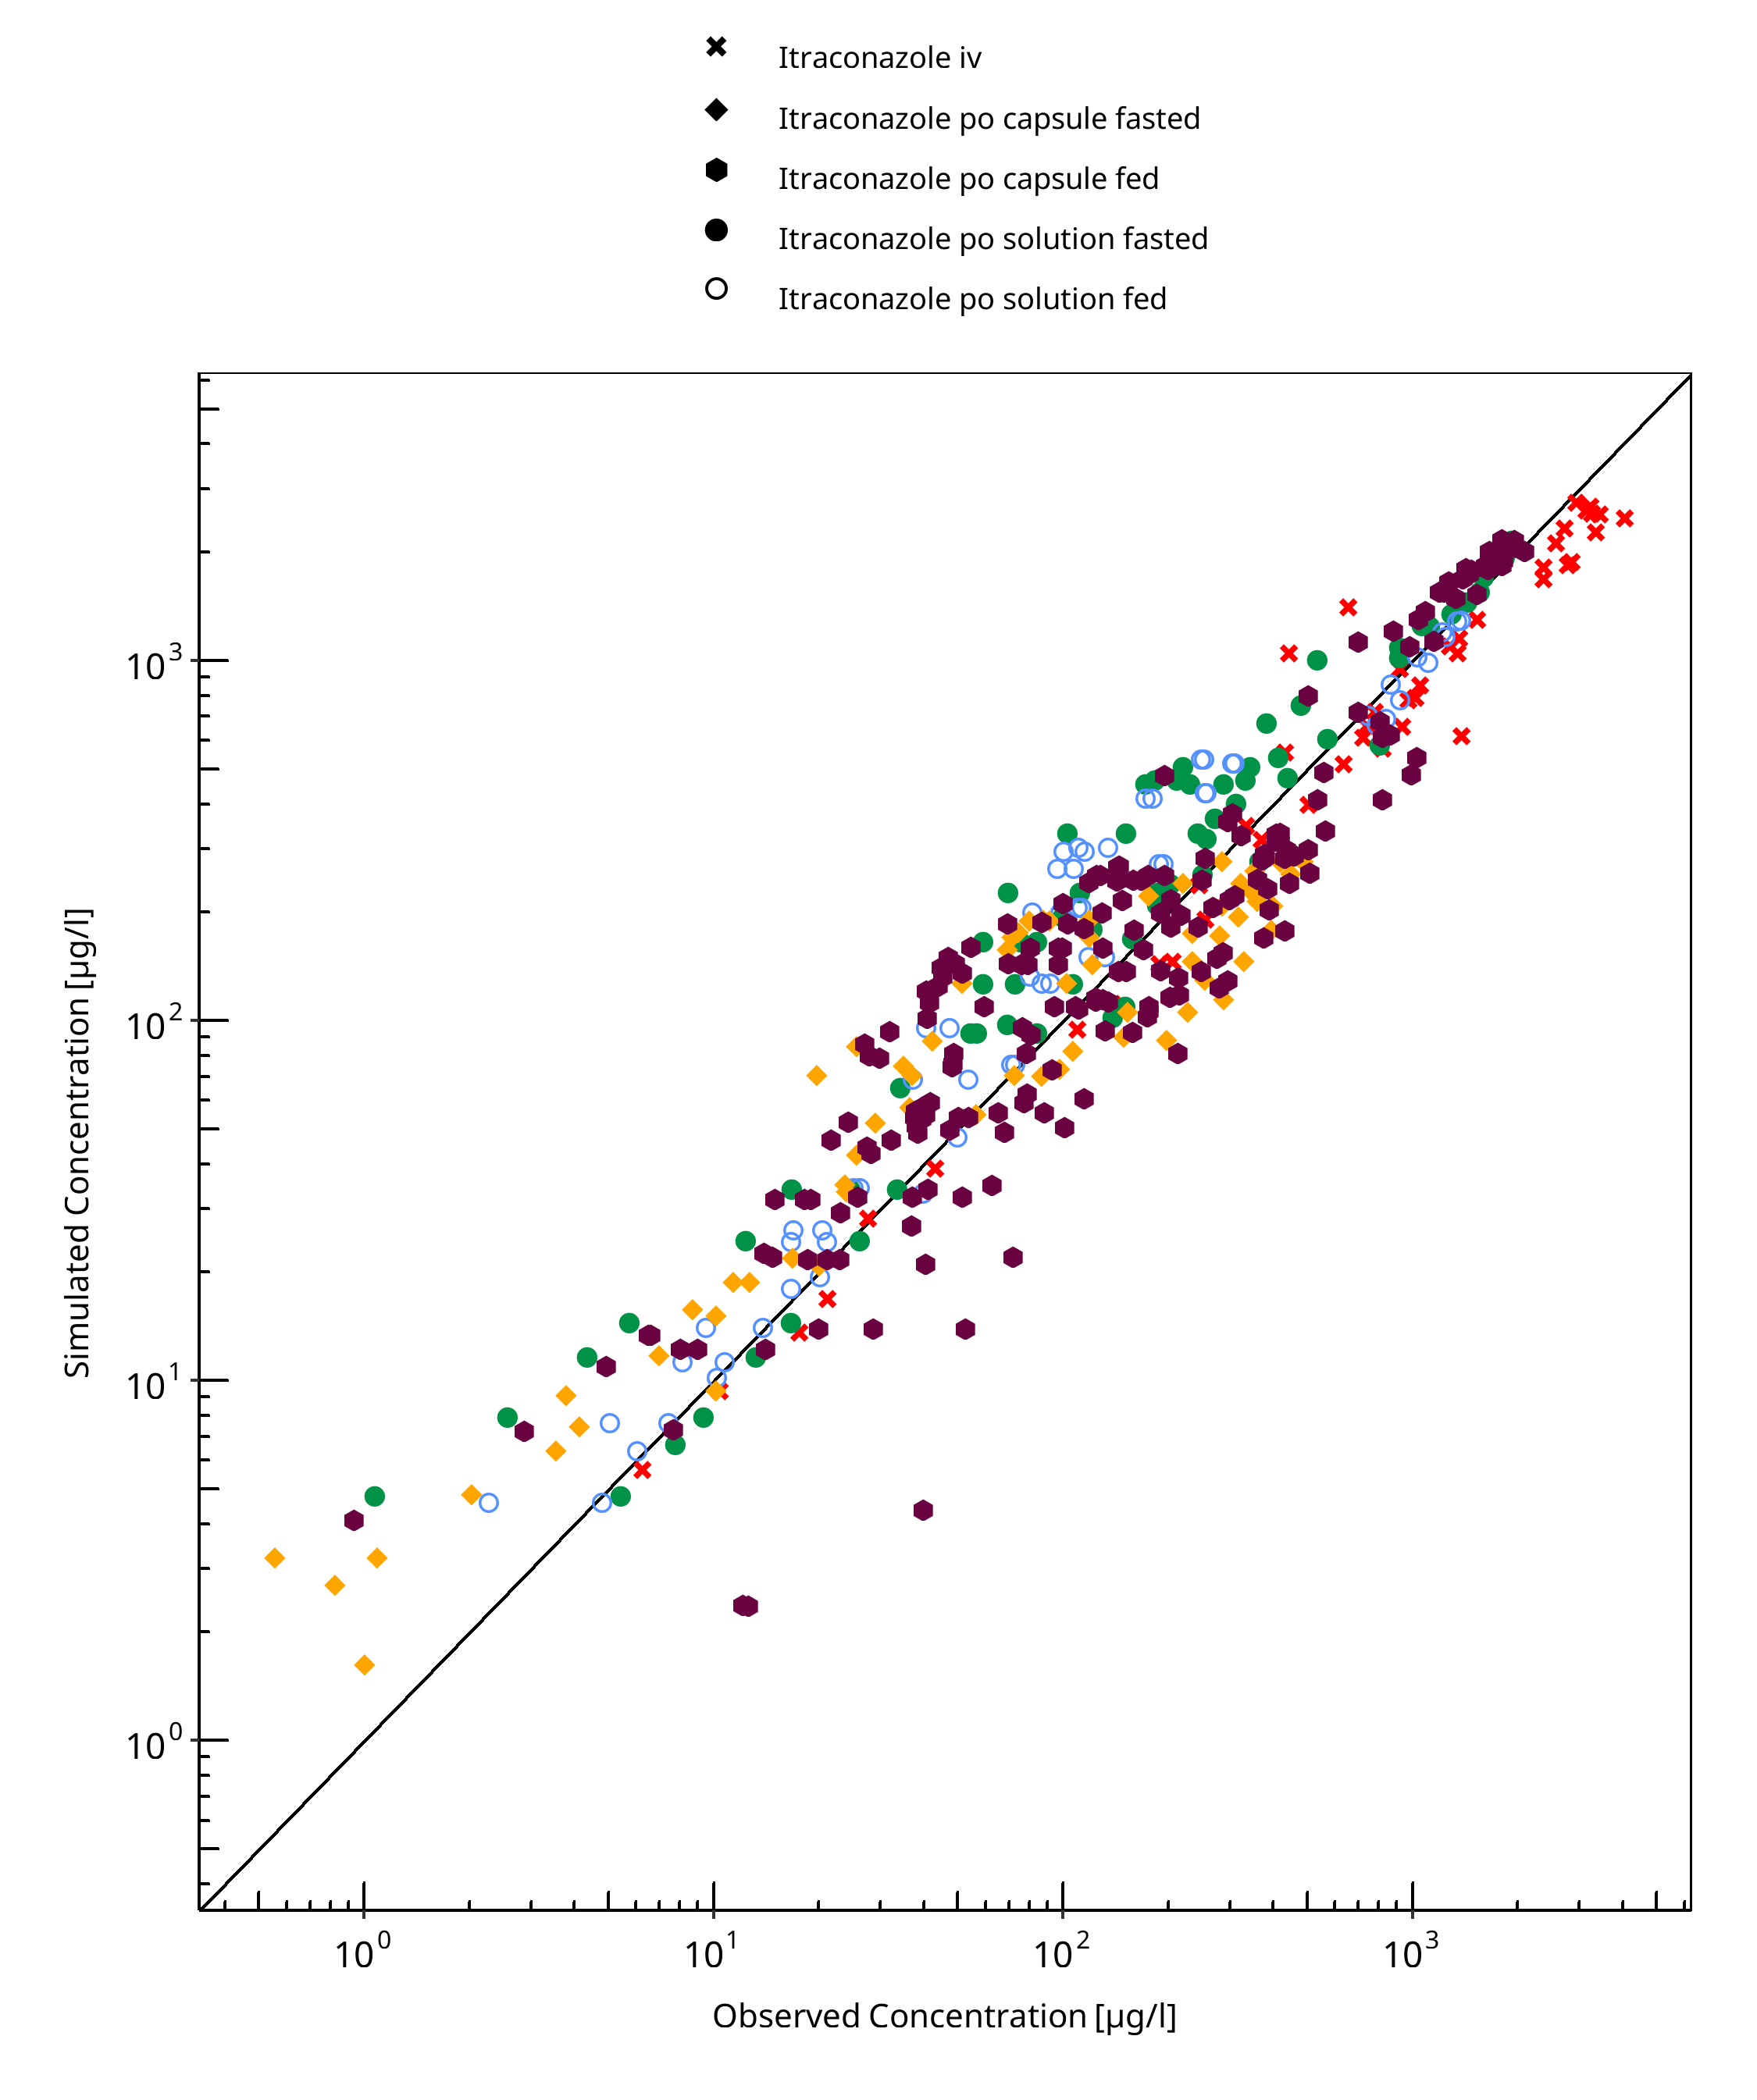
Figure 3-1: Itraconazole concentration in plasma
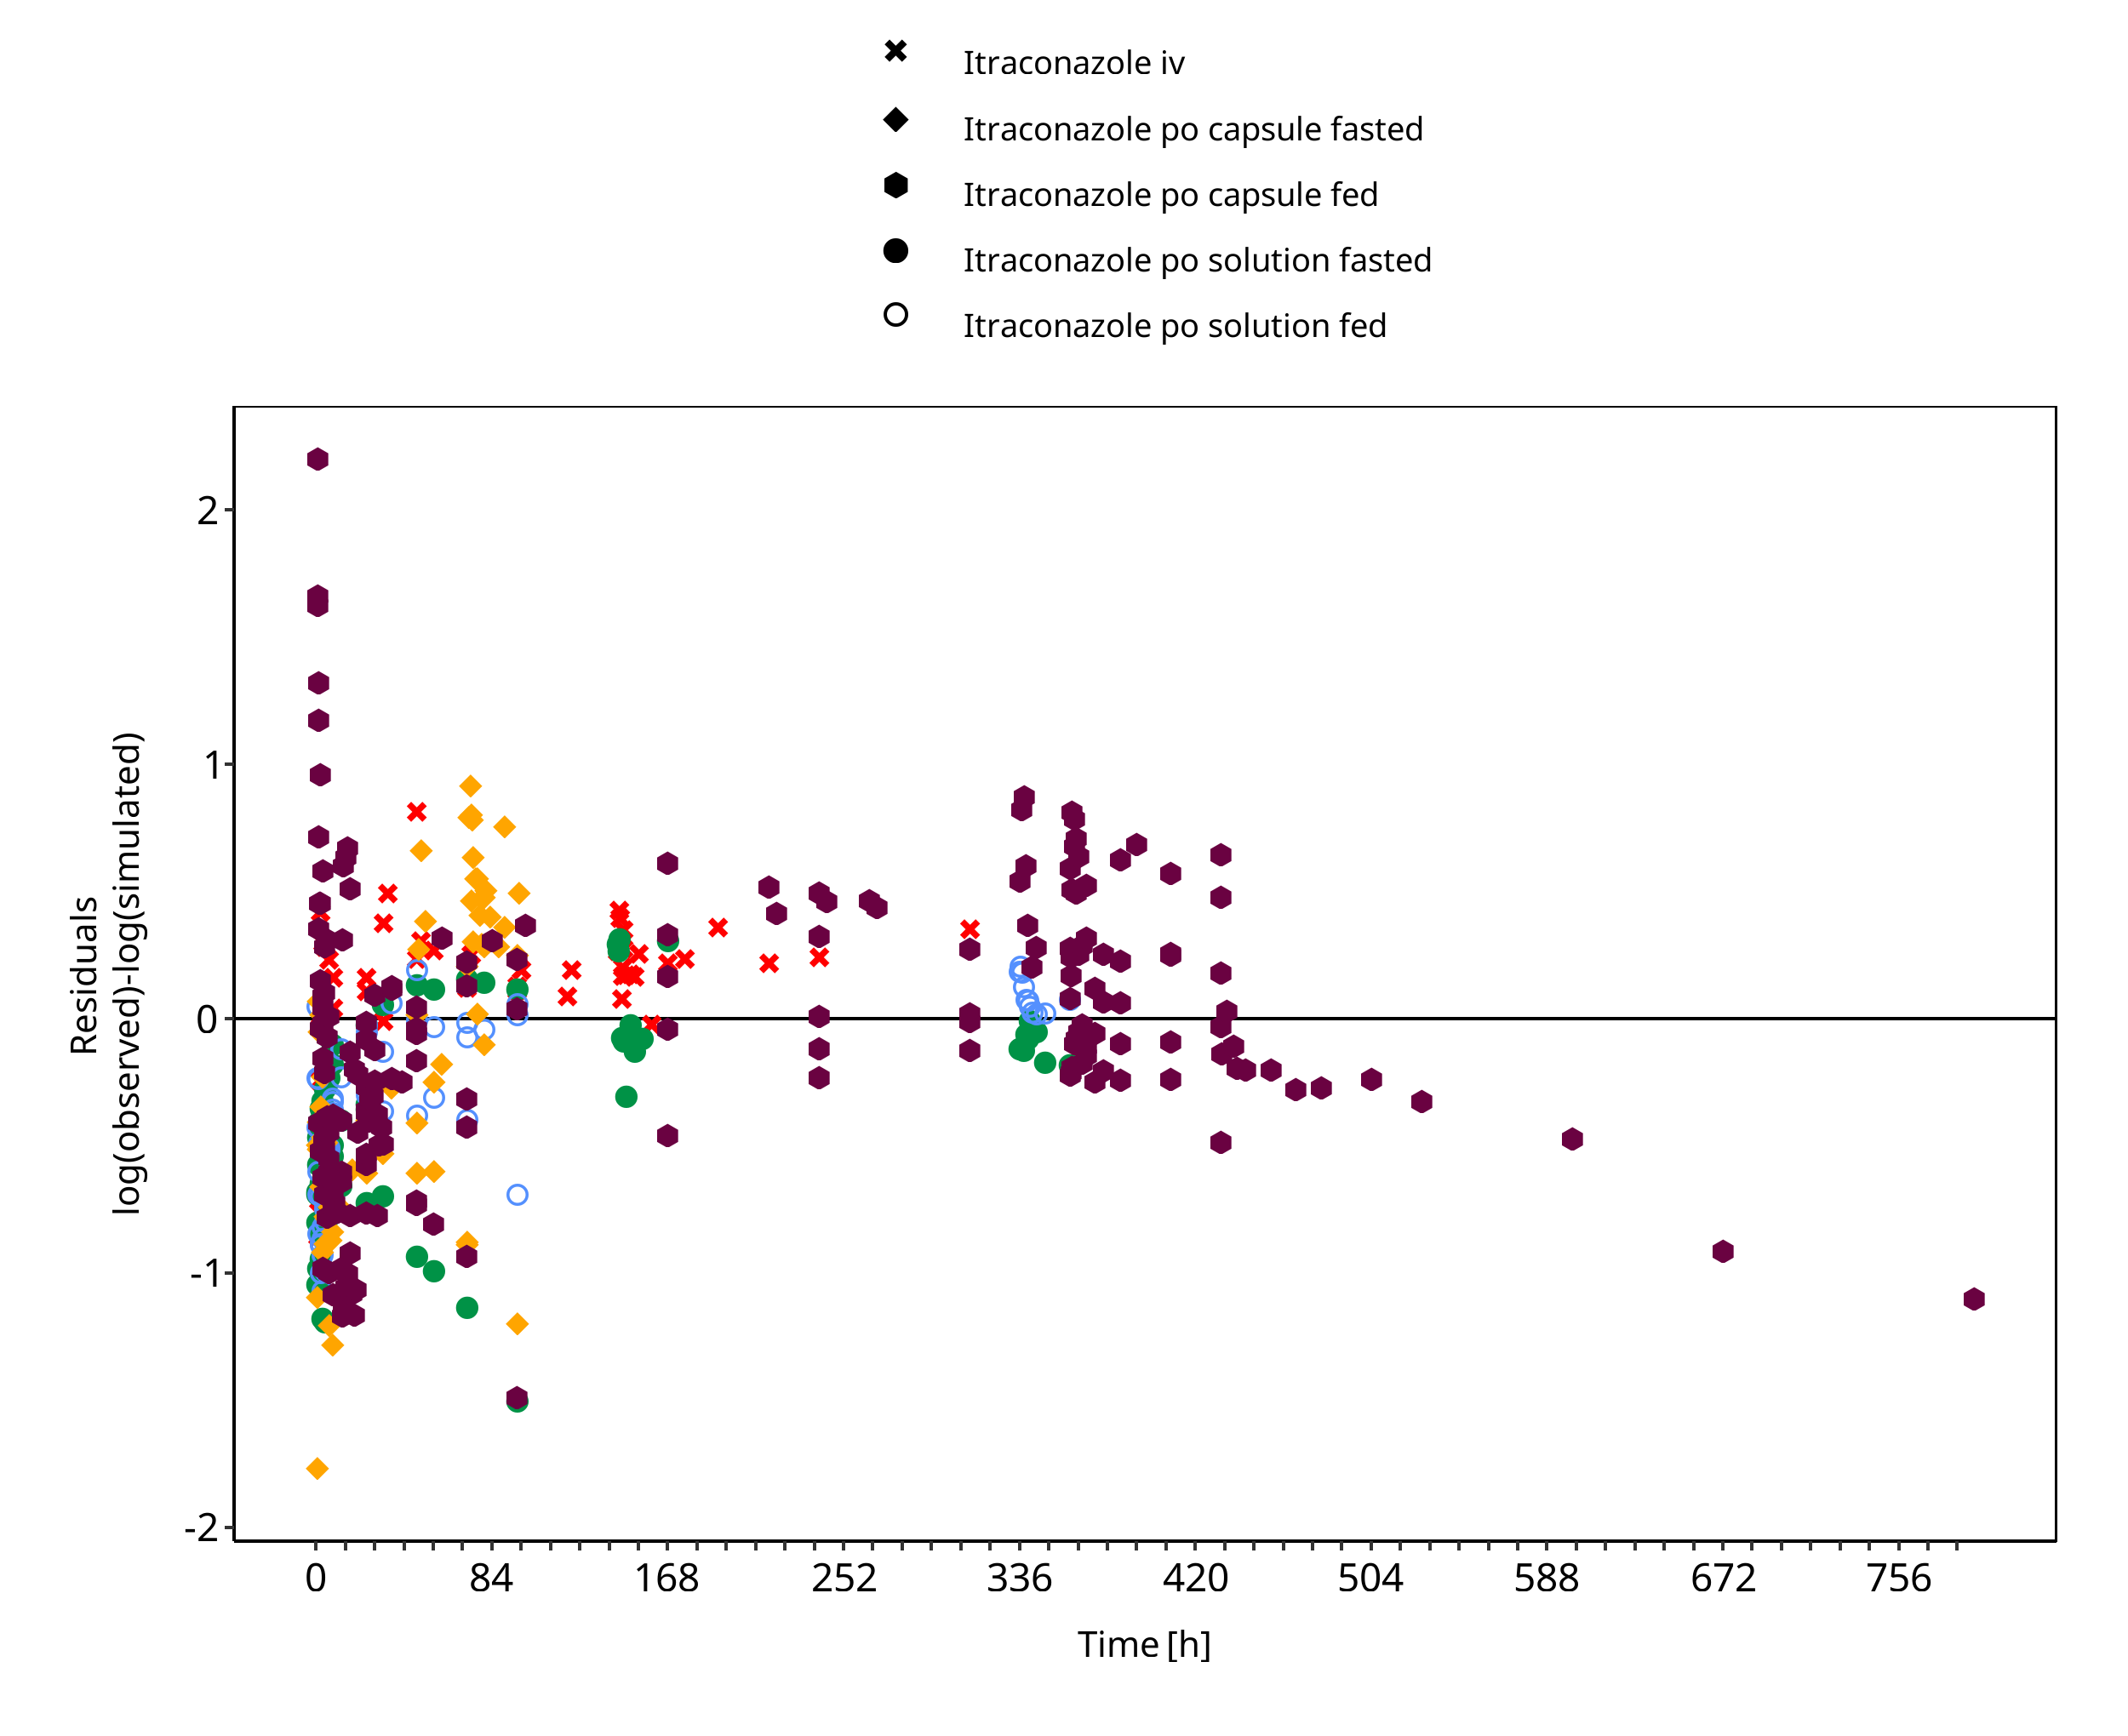
Figure 3-2: Itraconazole concentration in plasma
Table 3-2: GMFE for Hydroxy-Itraconazole concentration in plasma
| Group | GMFE |
|---|---|
| Itraconazole iv | 1.21 |
| Itraconazole po capsule fasted | 1.68 |
| Itraconazole po capsule fed | 1.95 |
| Itraconazole po solution fasted | 1.38 |
| Itraconazole po solution fed | 1.48 |
| All | 1.50 |
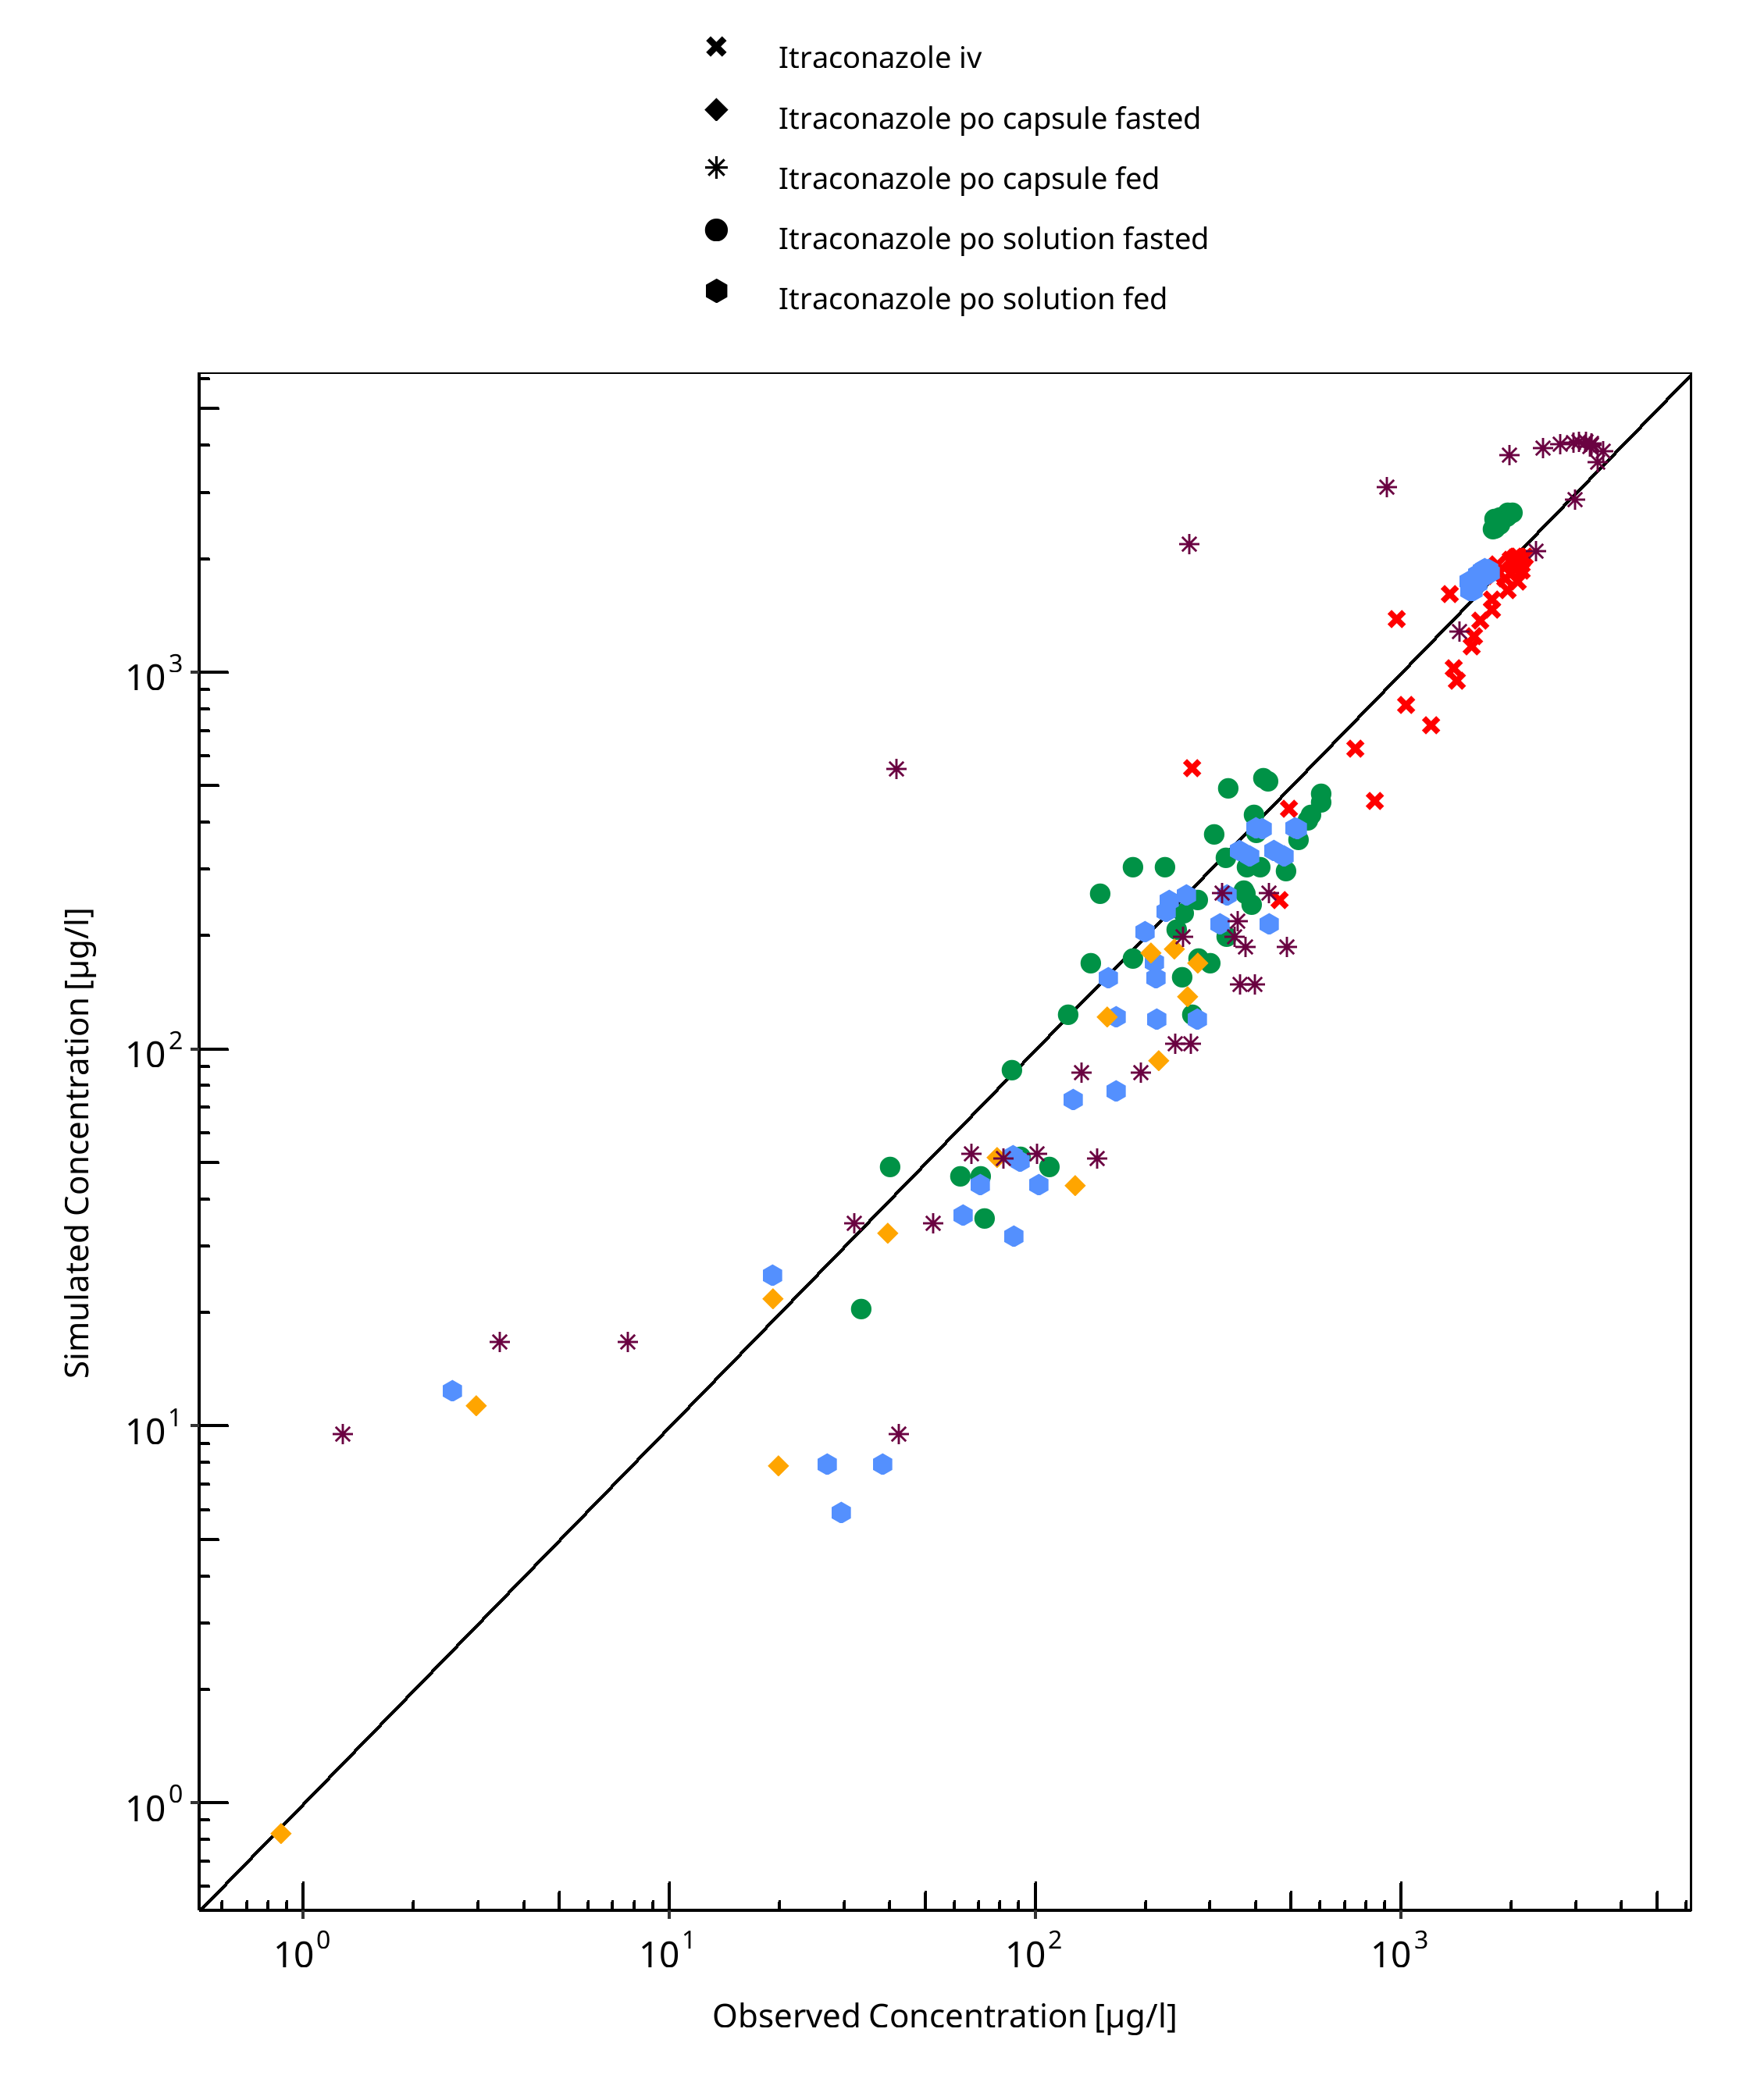
Figure 3-3: Hydroxy-Itraconazole concentration in plasma
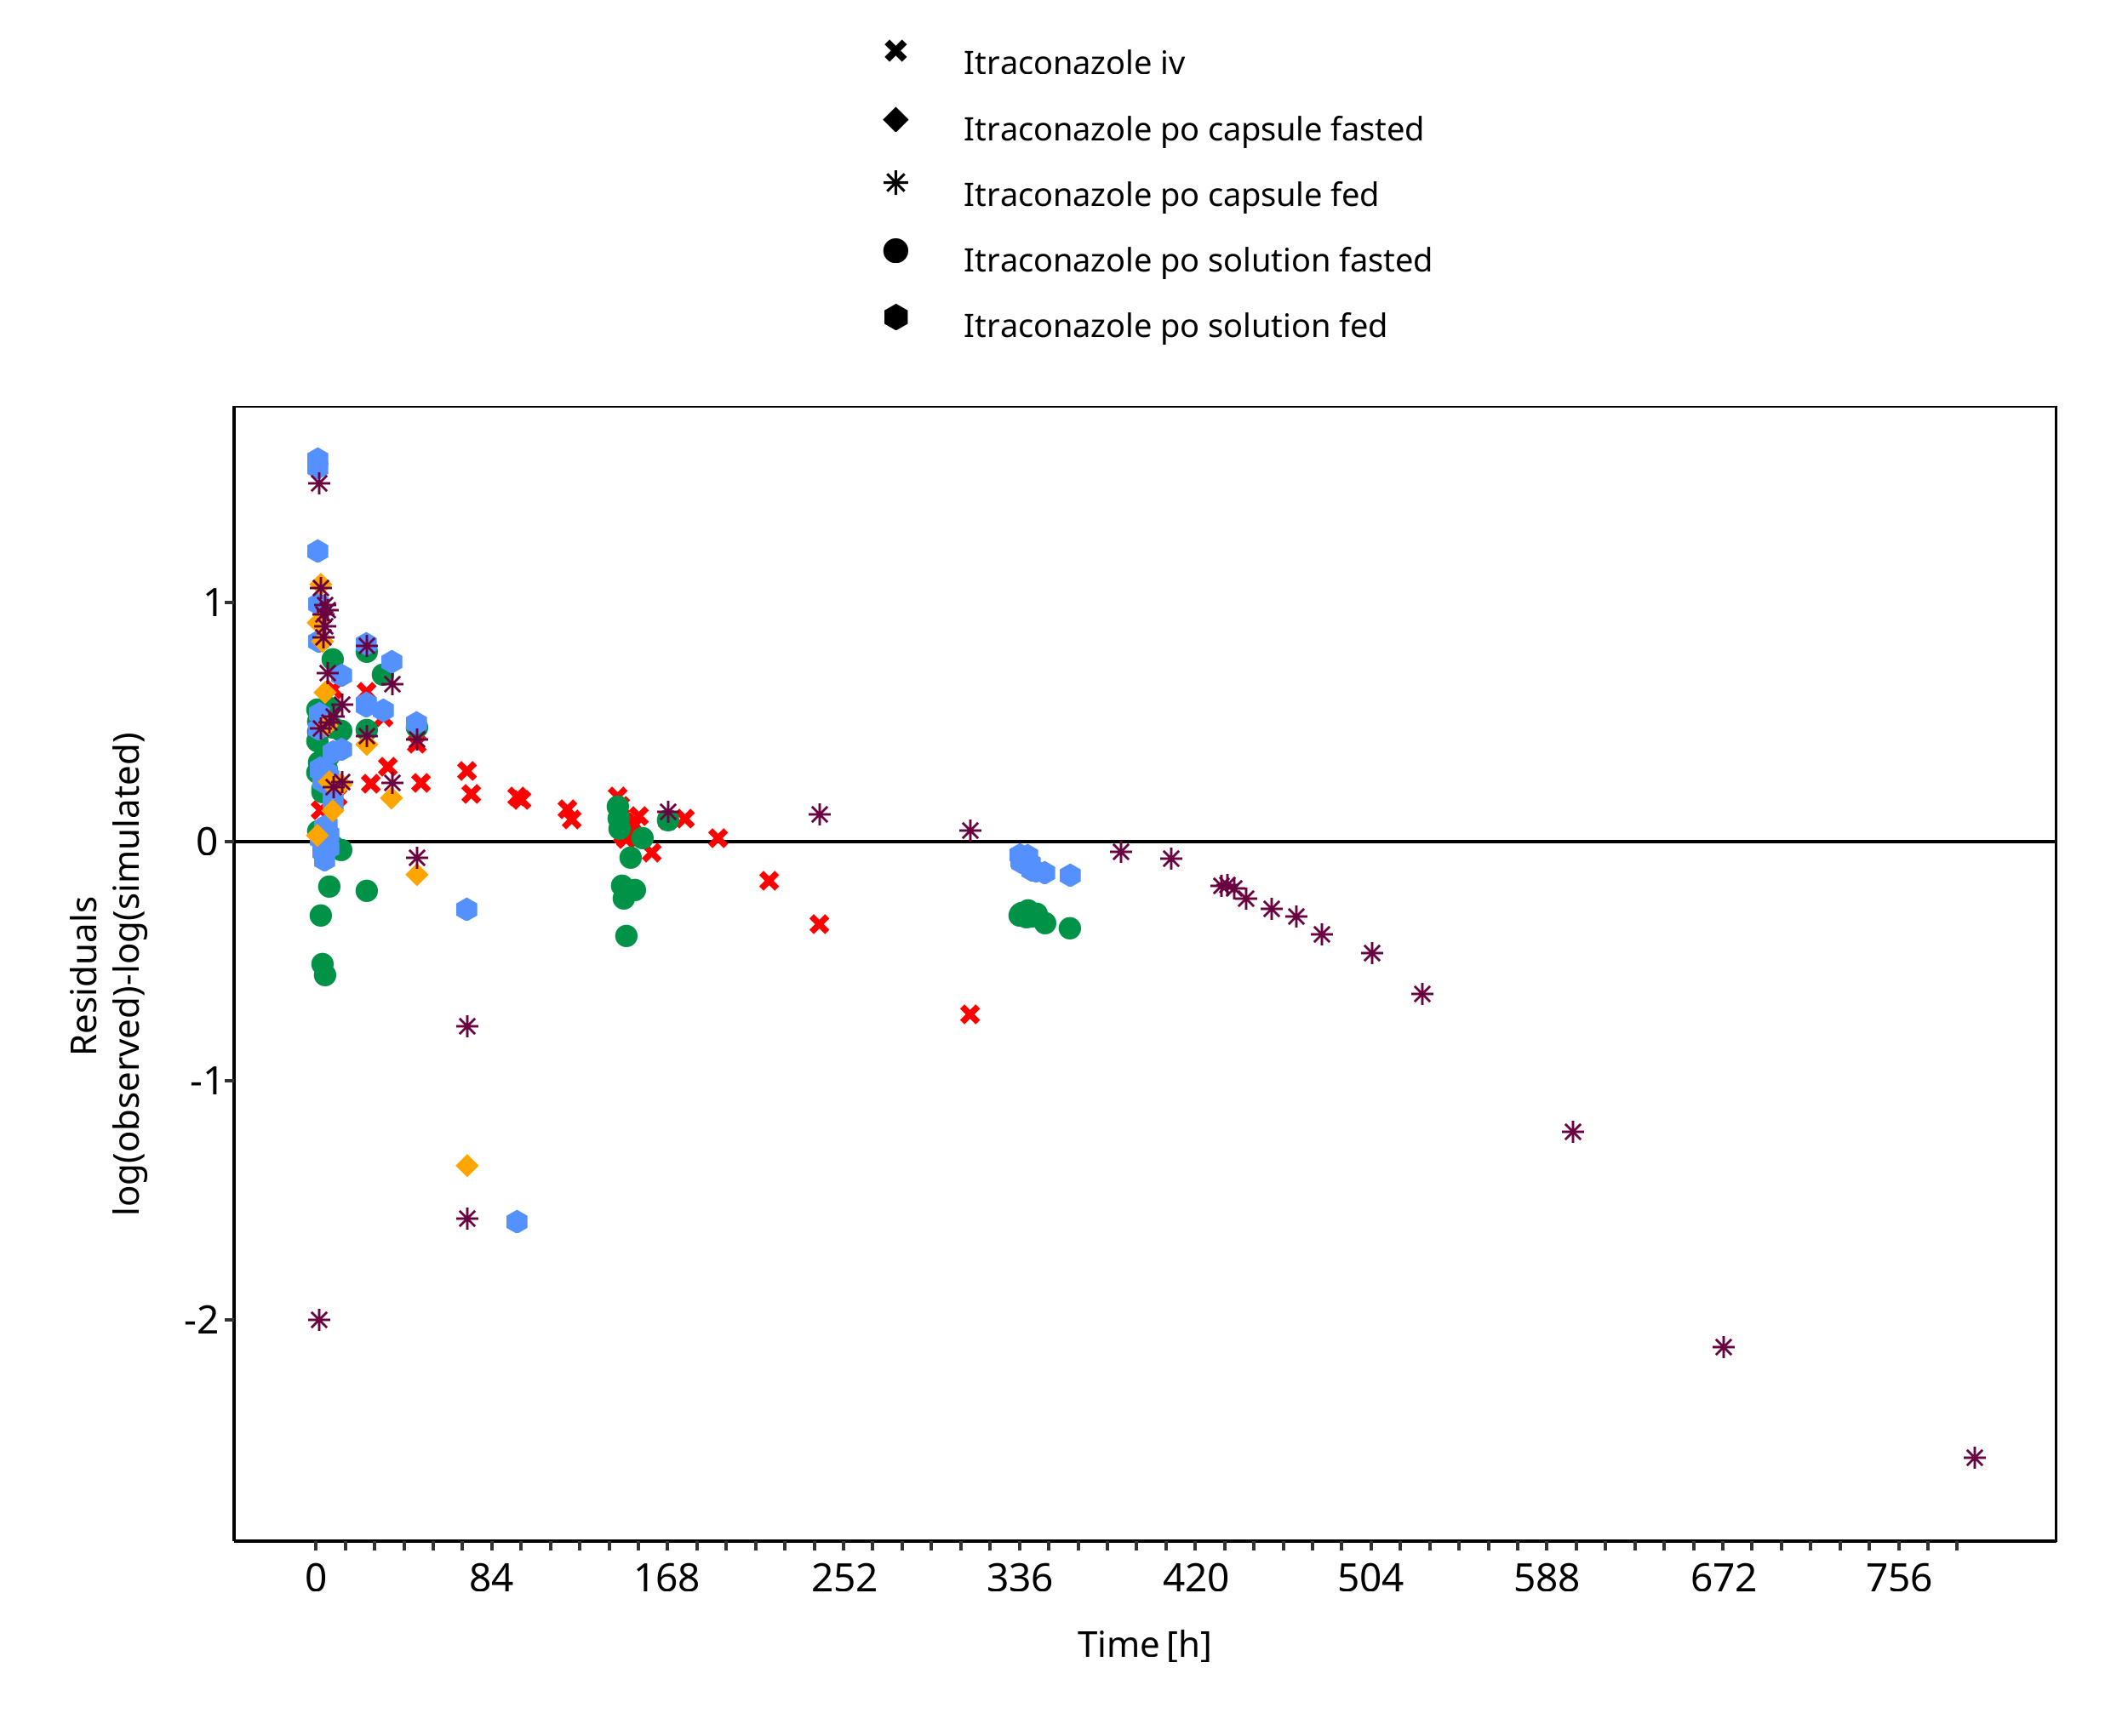
Figure 3-4: Hydroxy-Itraconazole concentration in plasma
Table 3-3: GMFE for Keto-Itraconazole concentration in plasma
| Group | GMFE |
|---|---|
| Itraconazole po solution fasted | 1.66 |
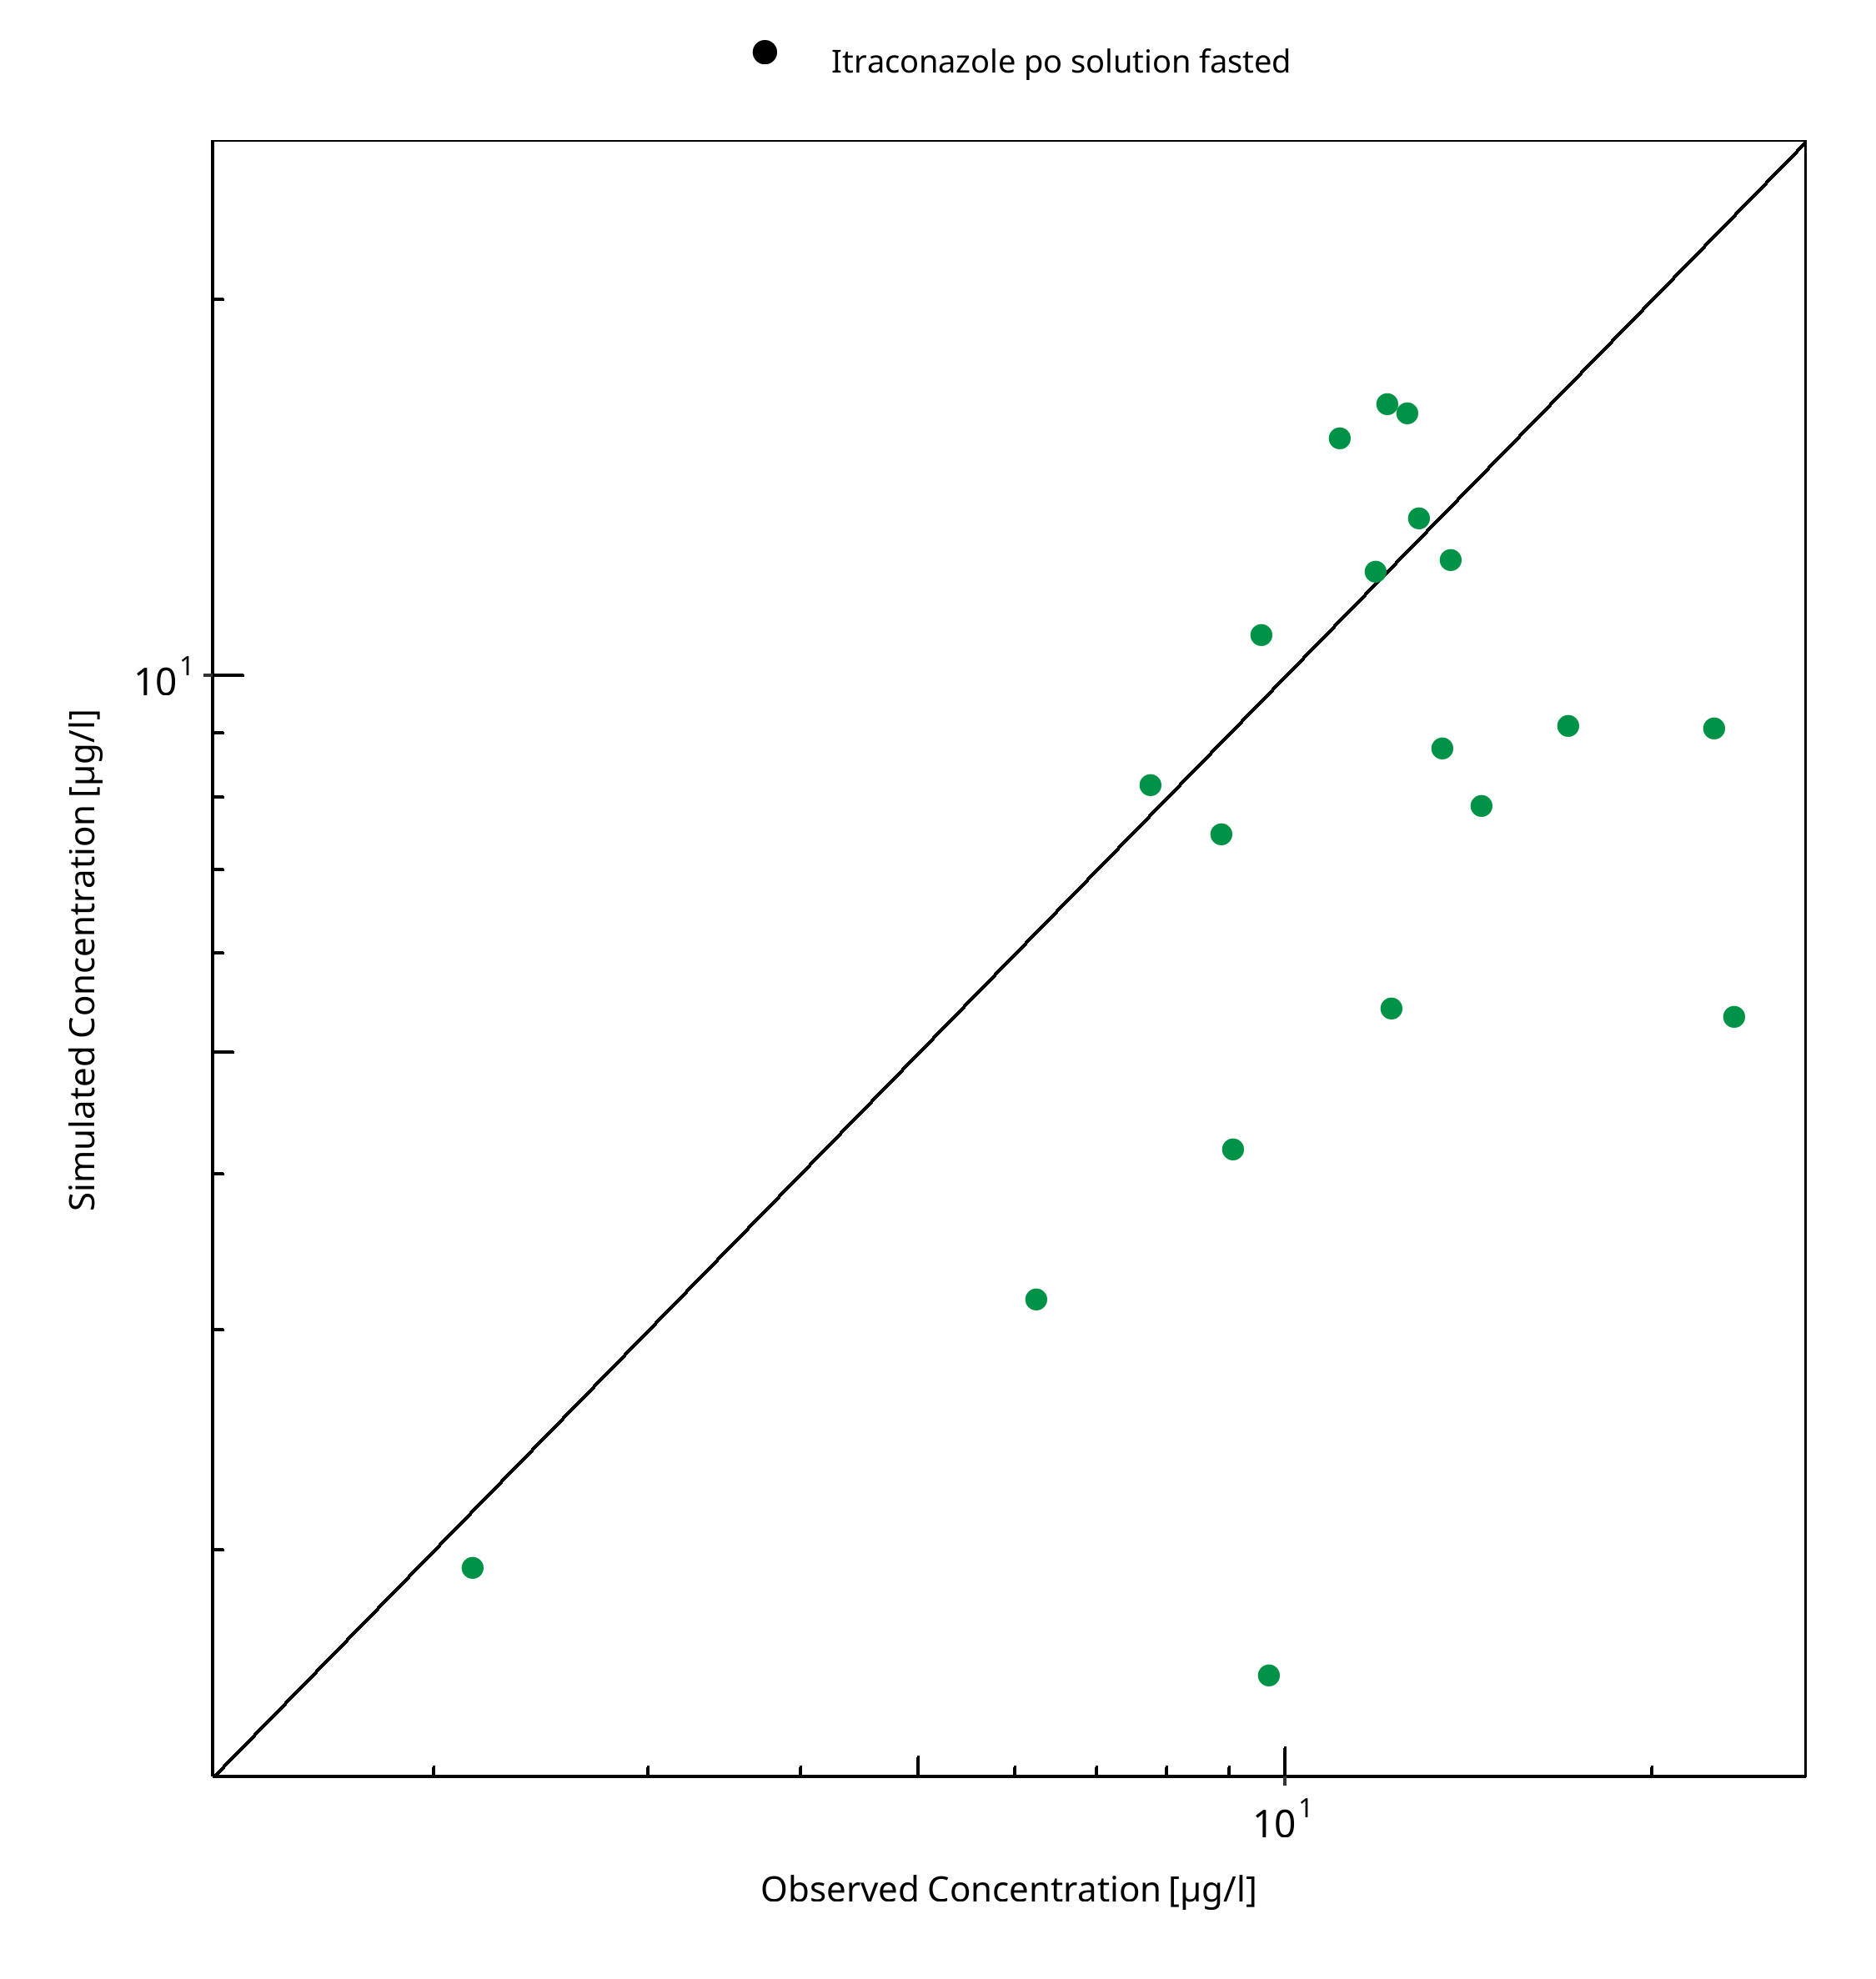
Figure 3-5: Keto-Itraconazole concentration in plasma
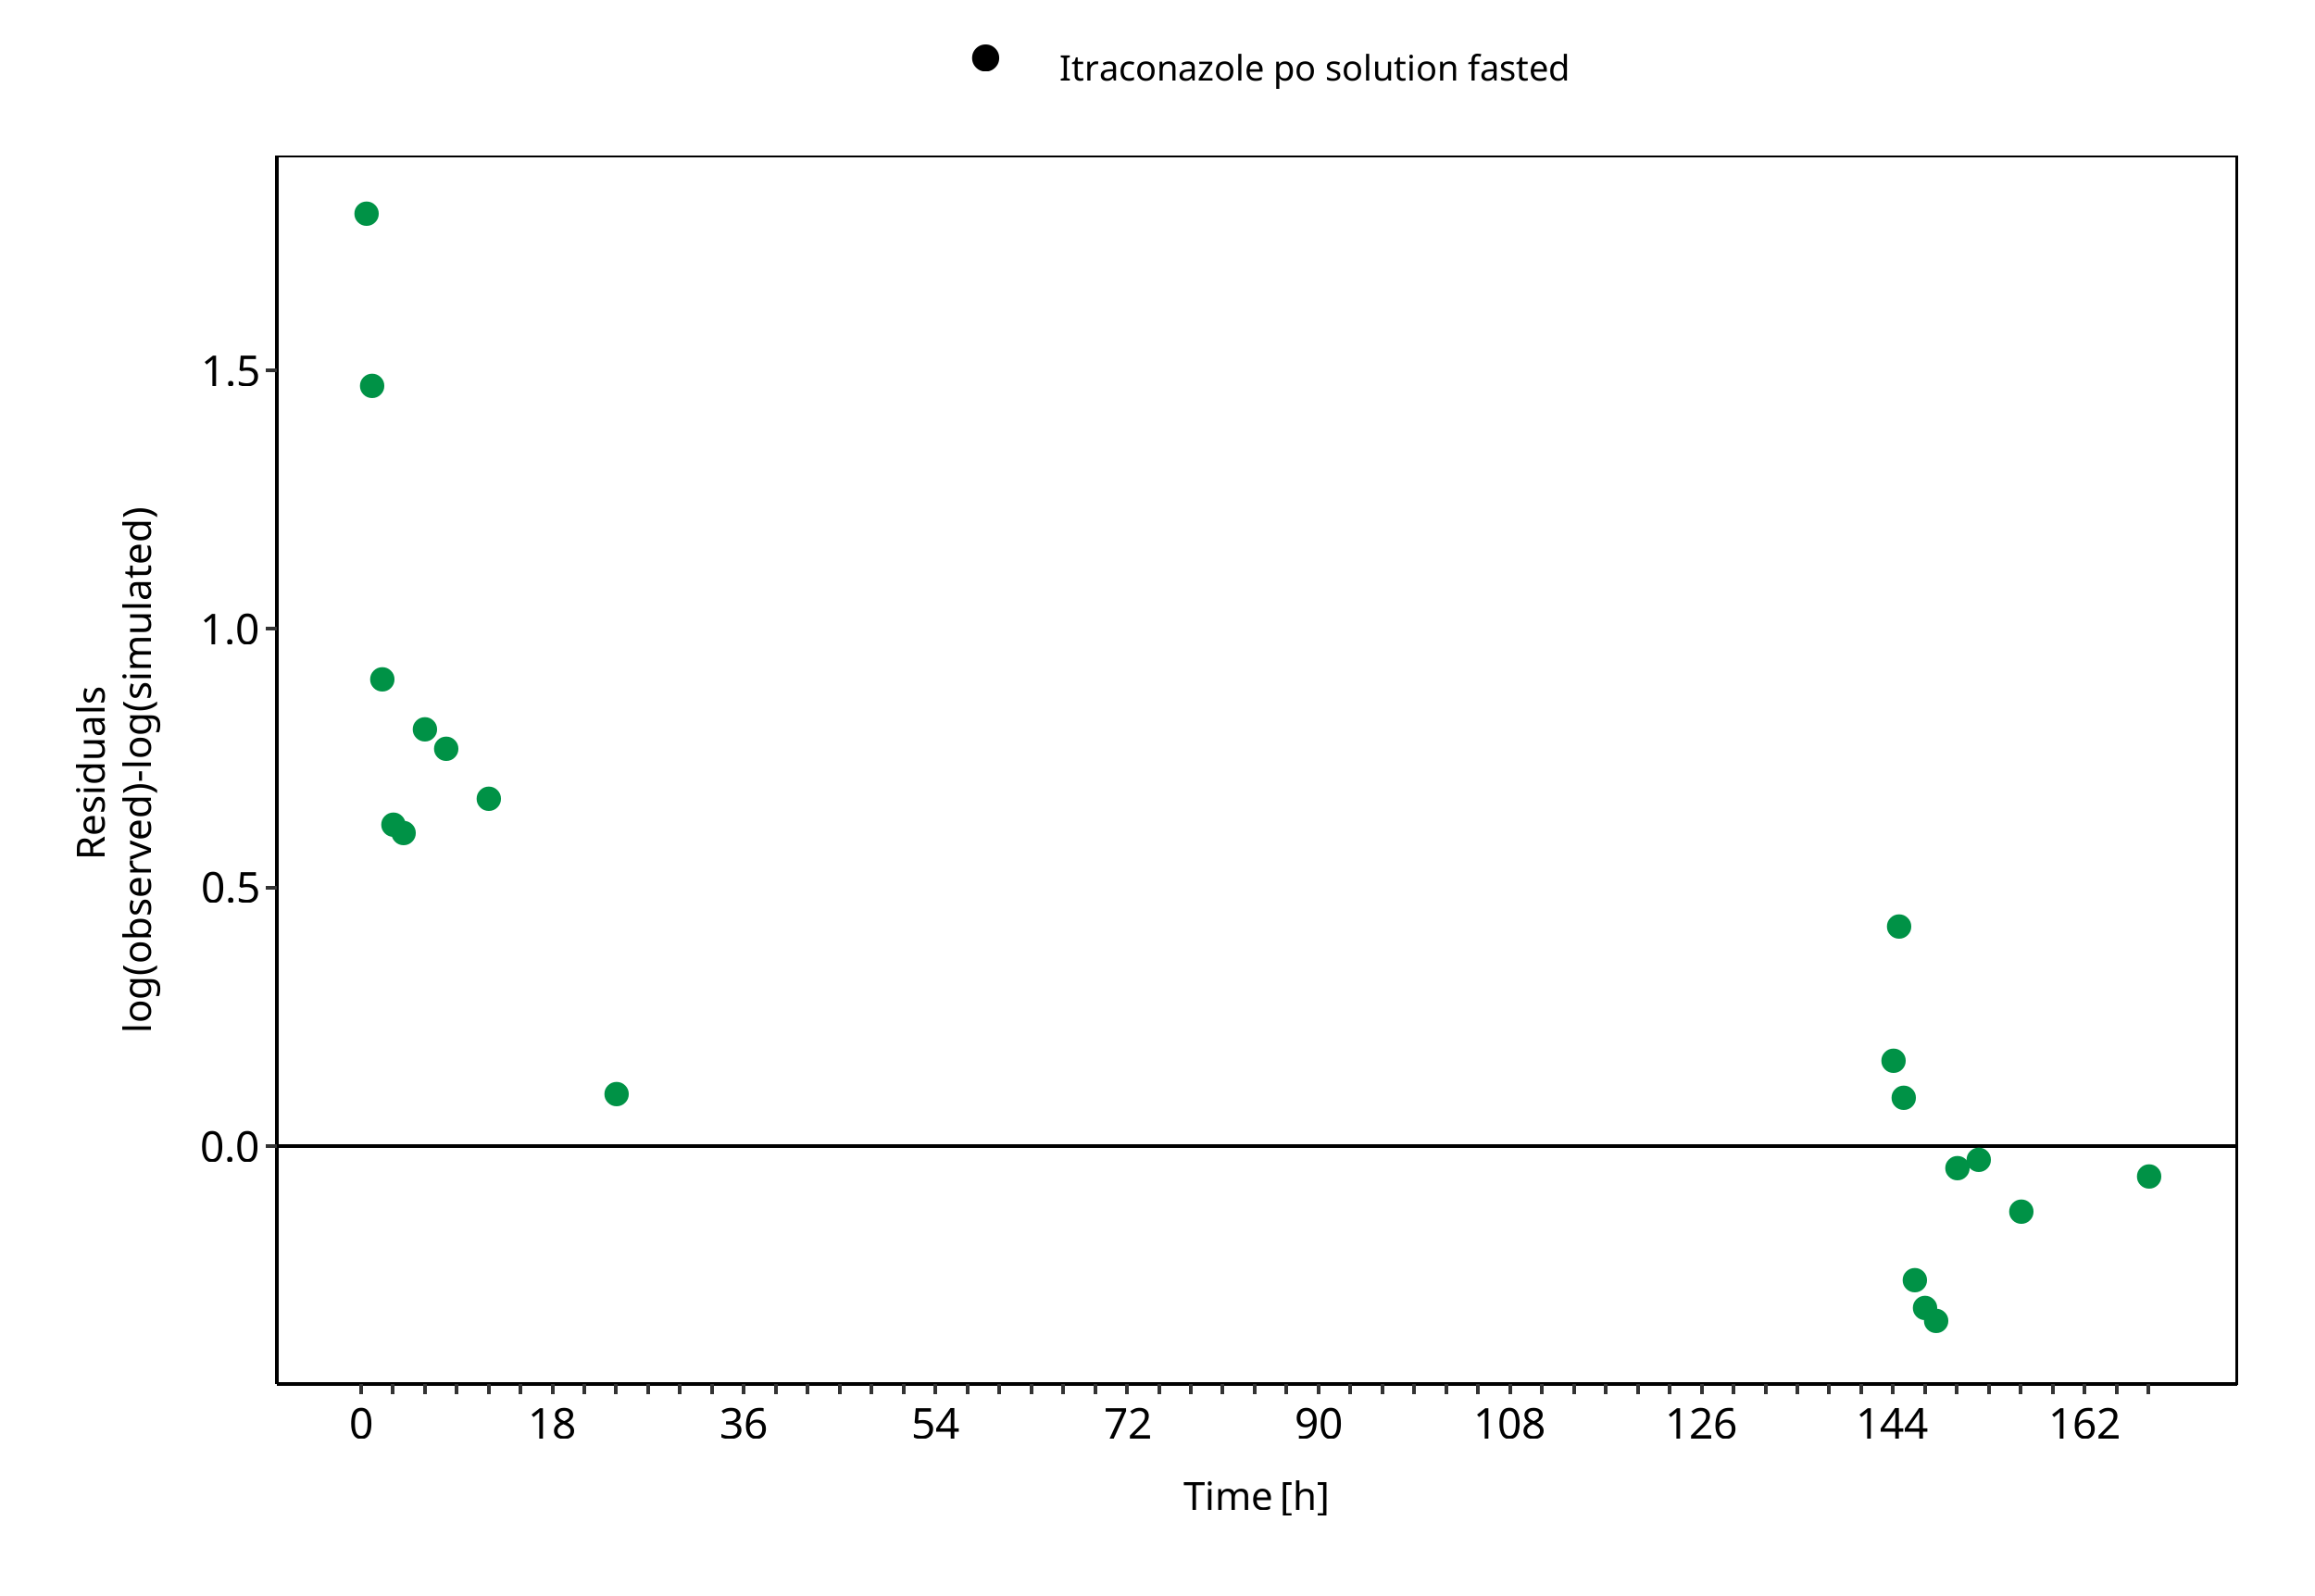
Figure 3-6: Keto-Itraconazole concentration in plasma
Table 3-4: GMFE for N-desalkyl-Itraconazole concentration in plasma
| Group | GMFE |
|---|---|
| Itraconazole po solution fasted | 1.53 |
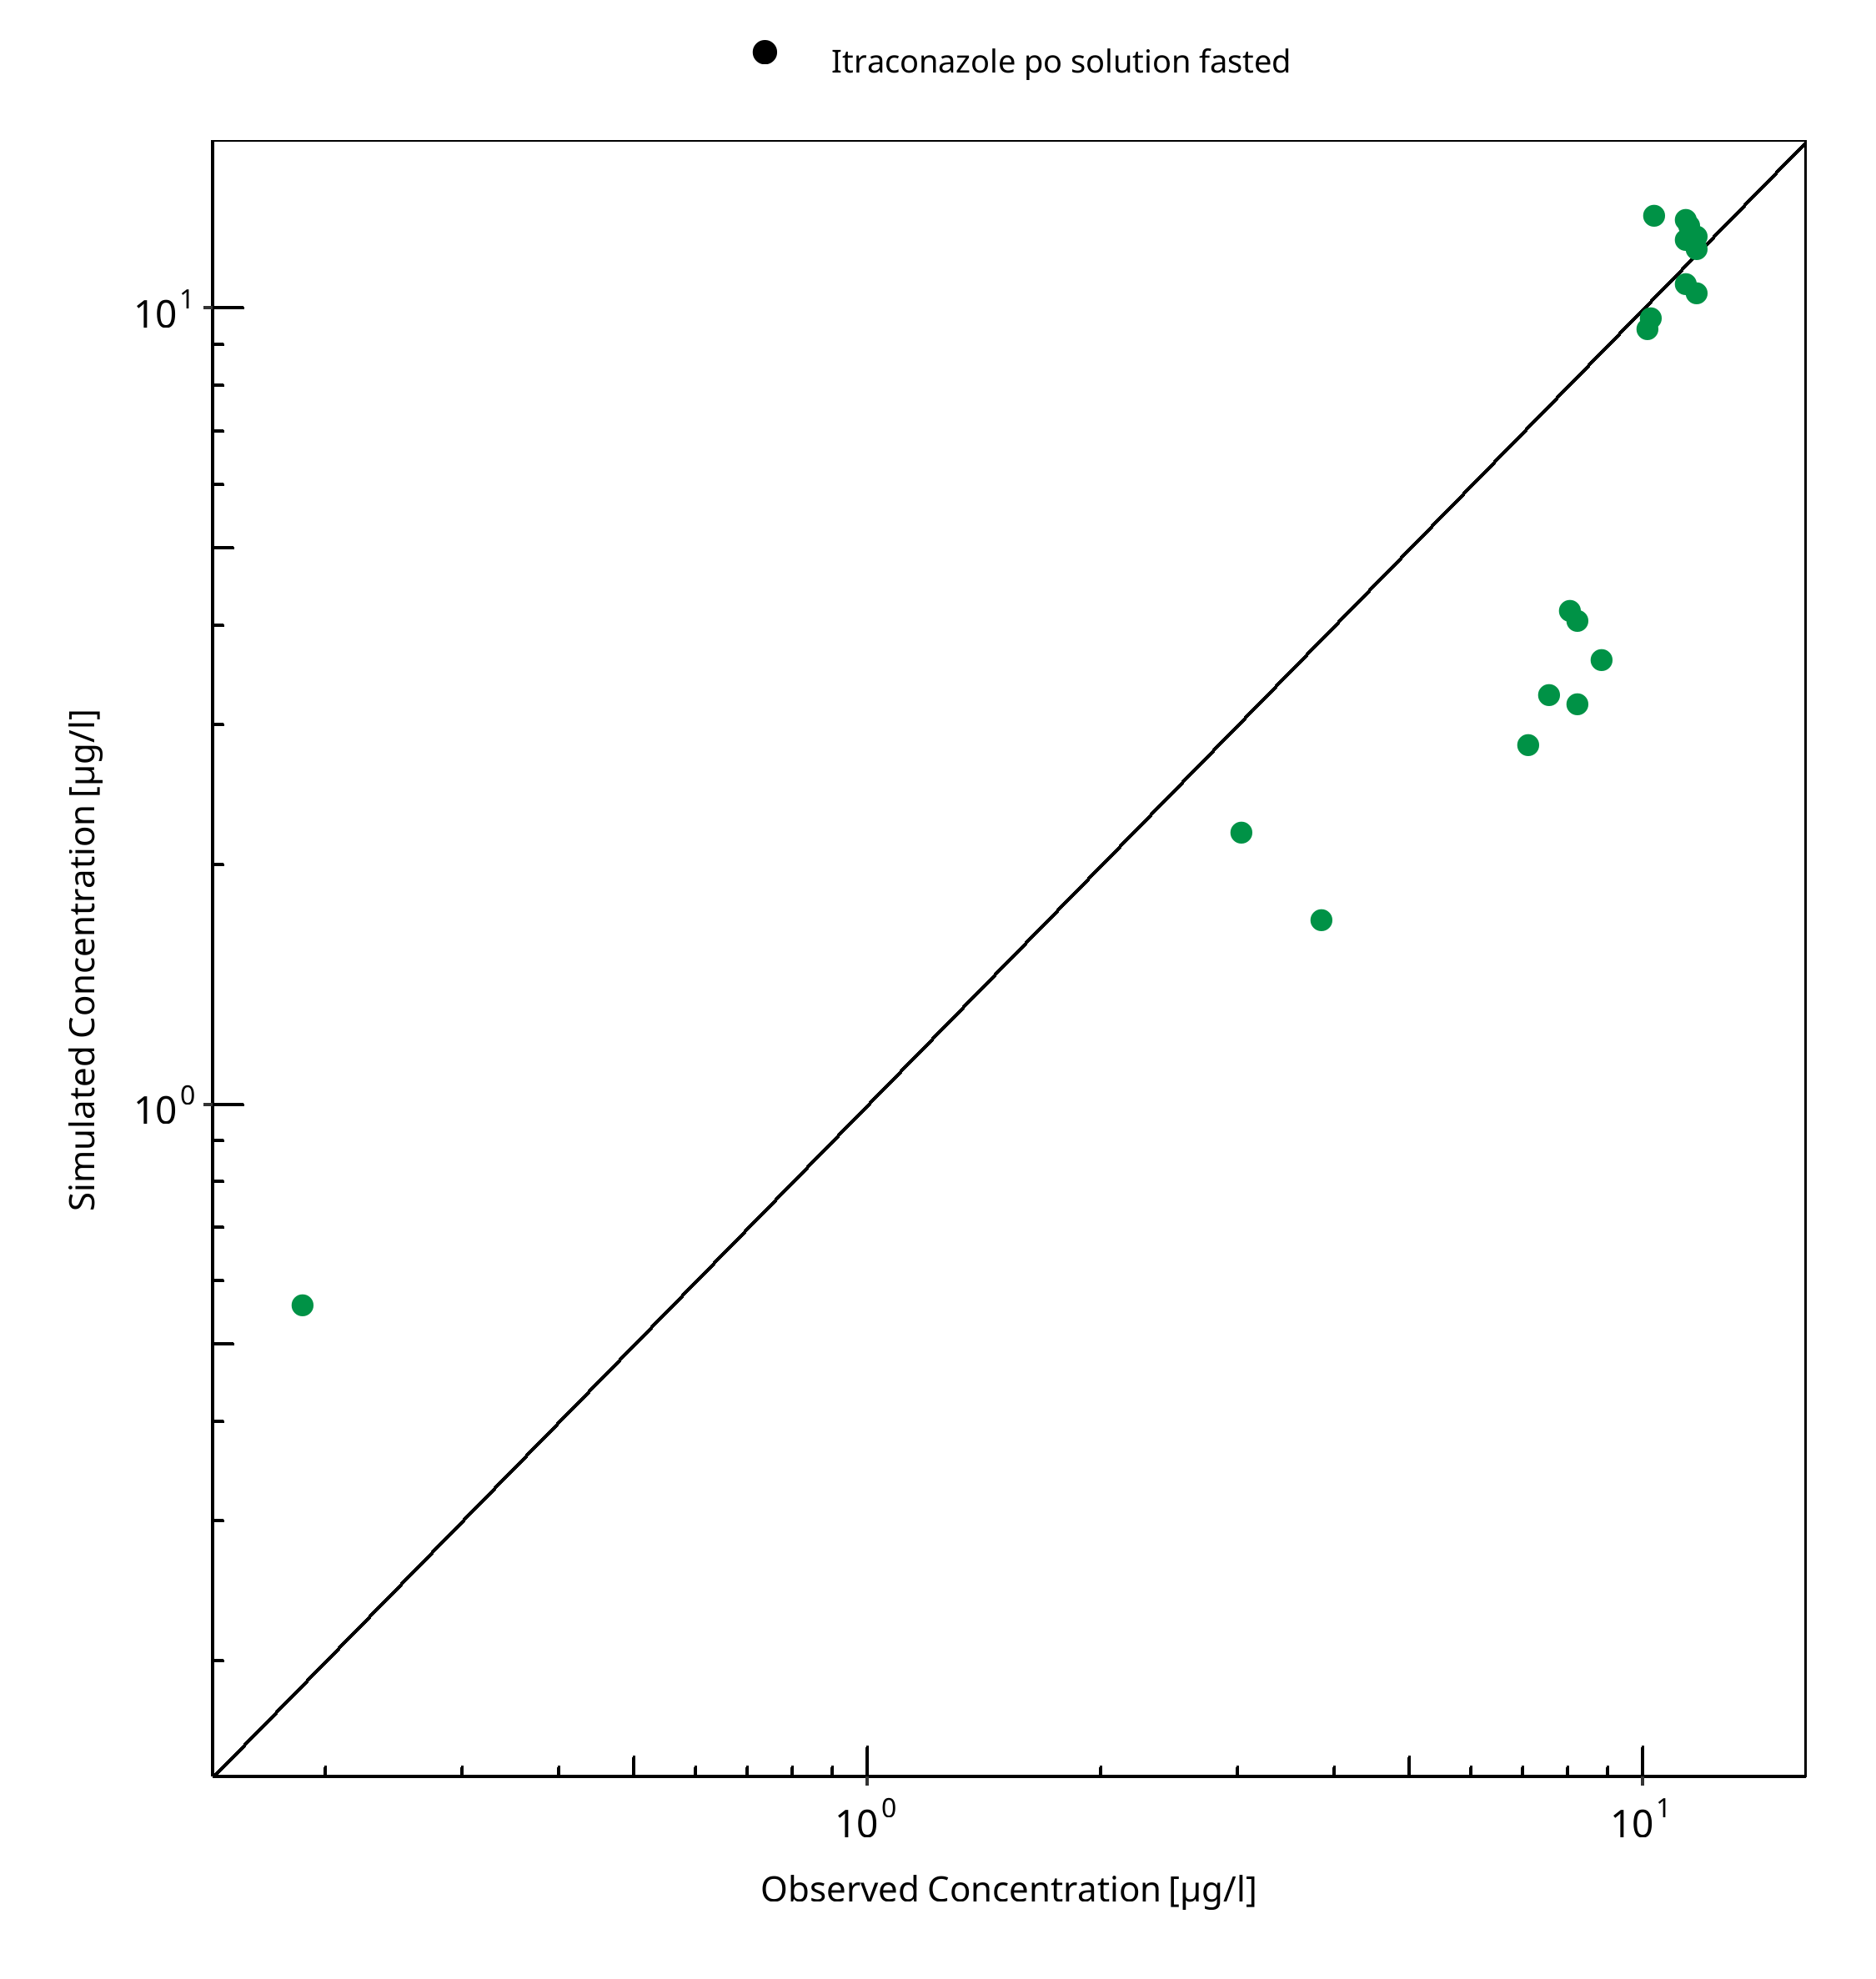
Figure 3-7: N-desalkyl-Itraconazole concentration in plasma
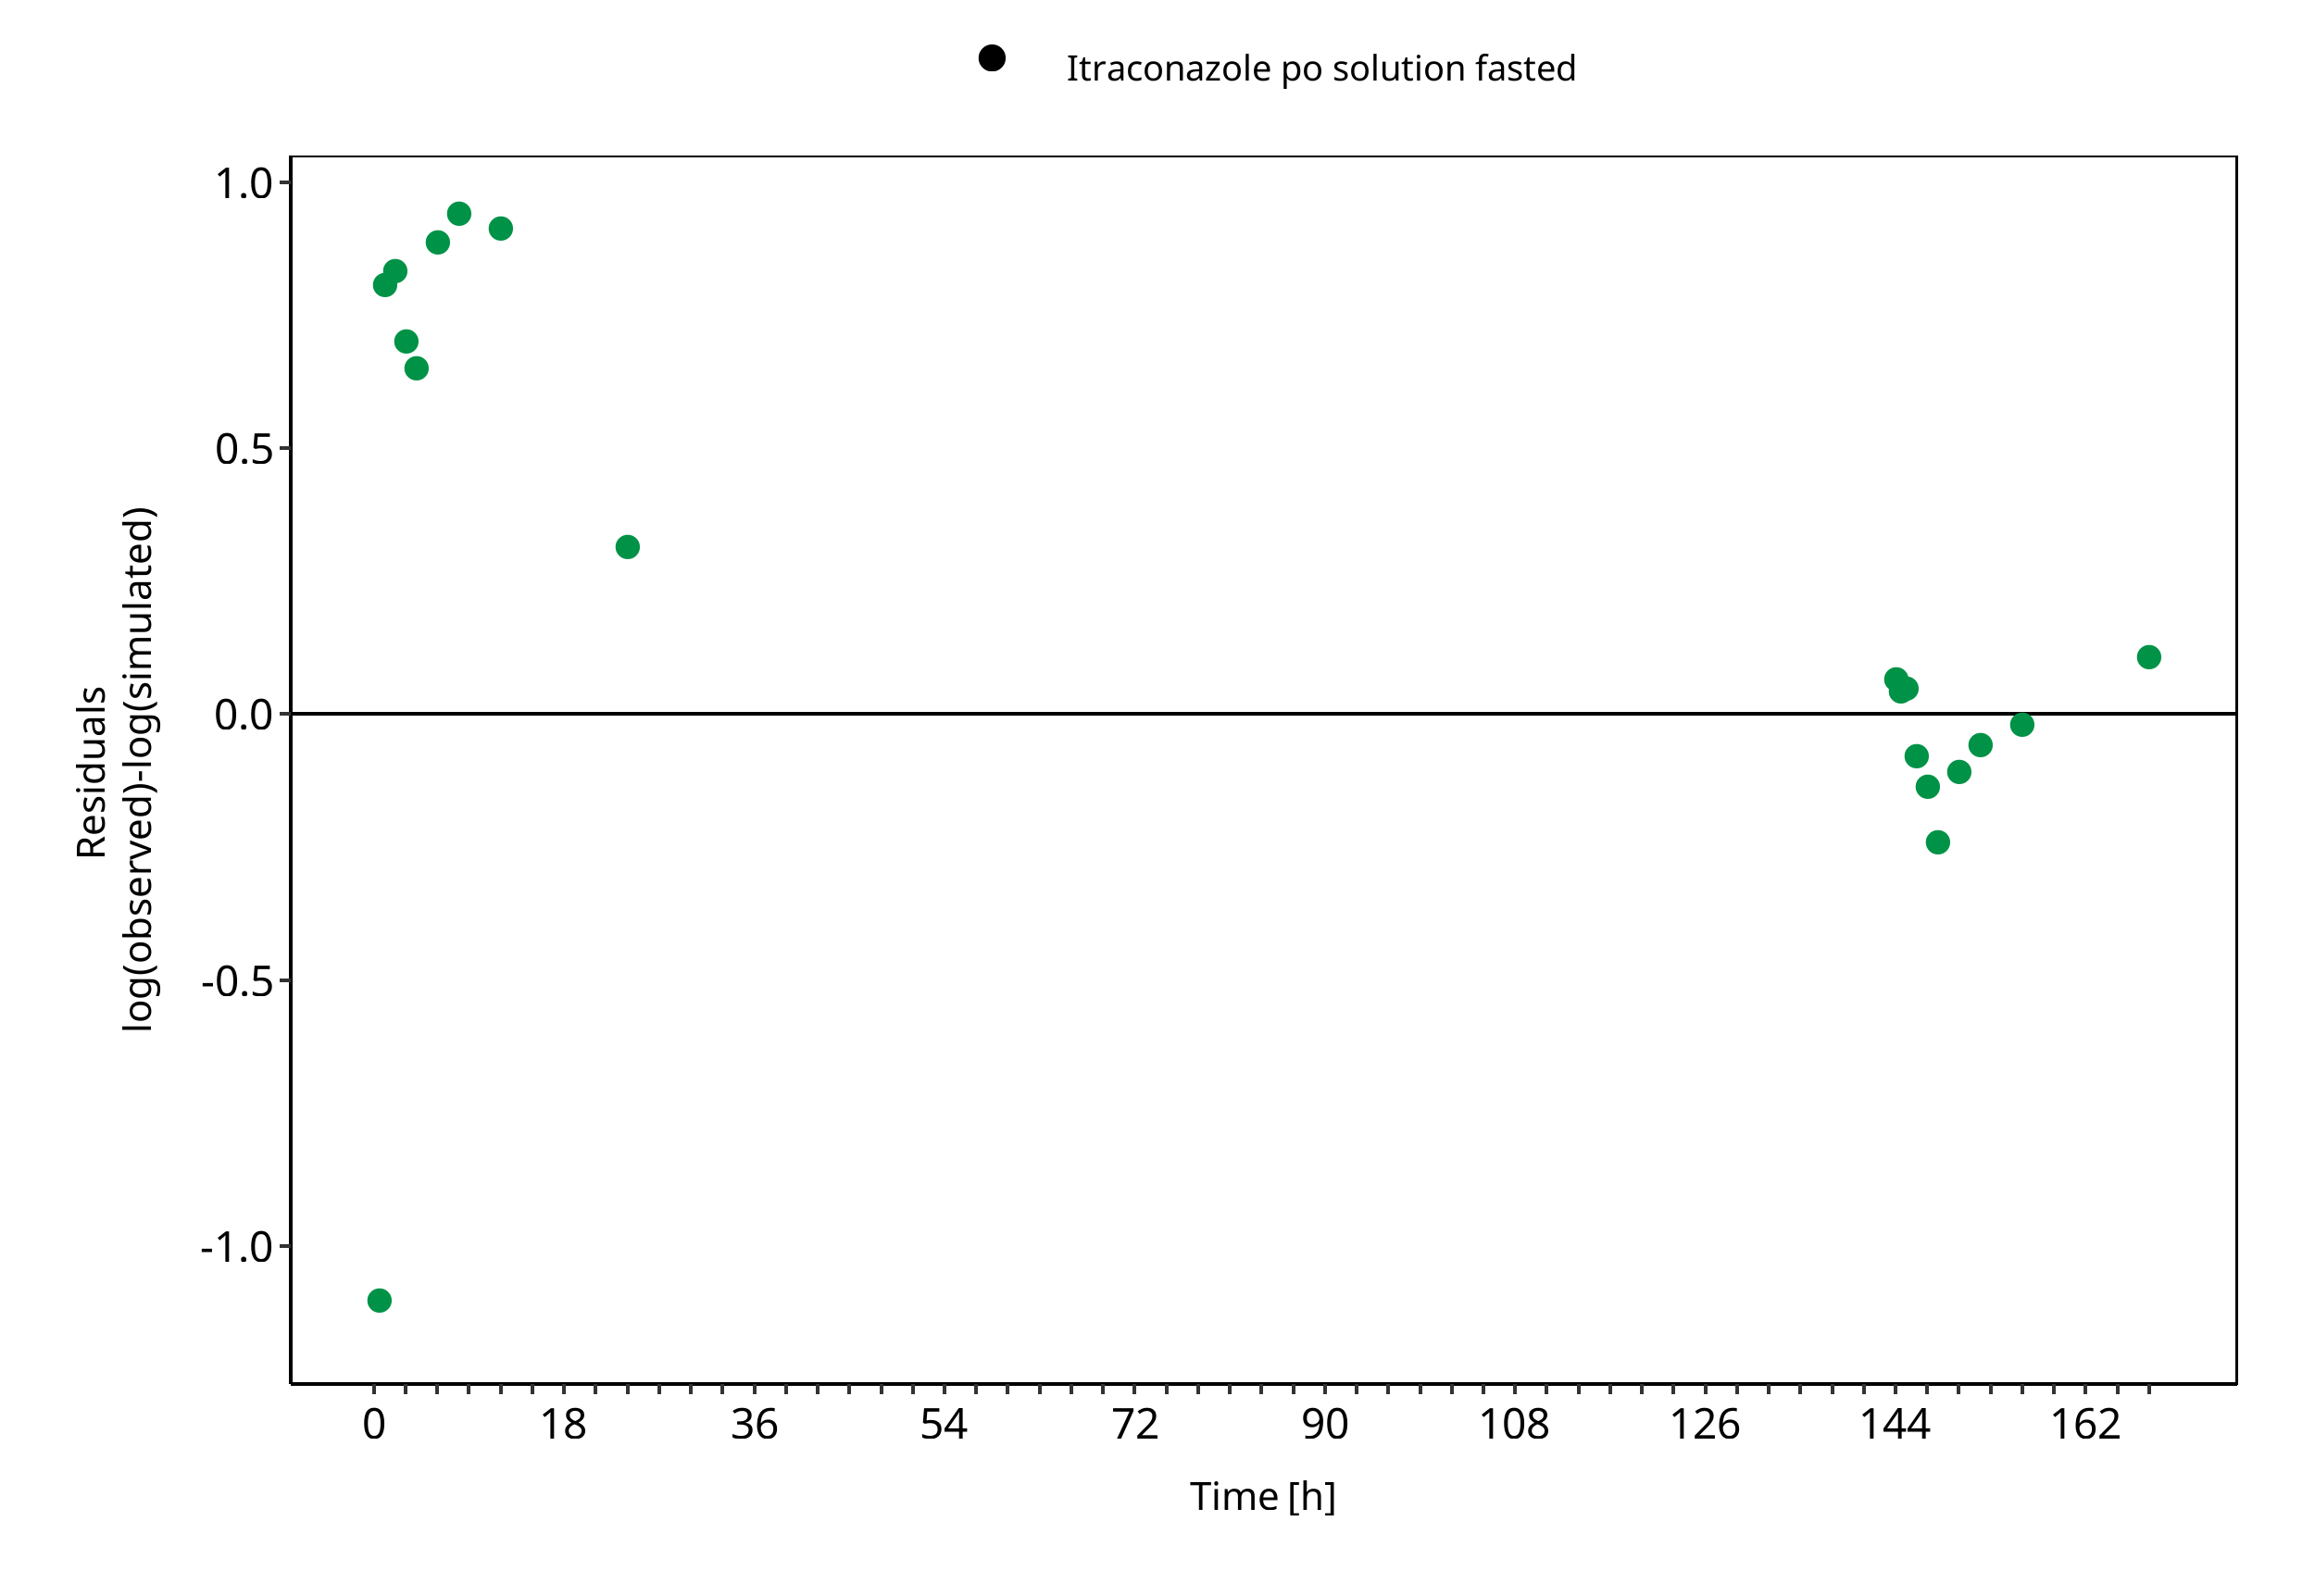
Figure 3-8: N-desalkyl-Itraconazole concentration in plasma
3.3 Concentration-Time Profiles¶
Simulated versus observed concentration-time profiles of all data listed in Section 2.2.2 are presented below.
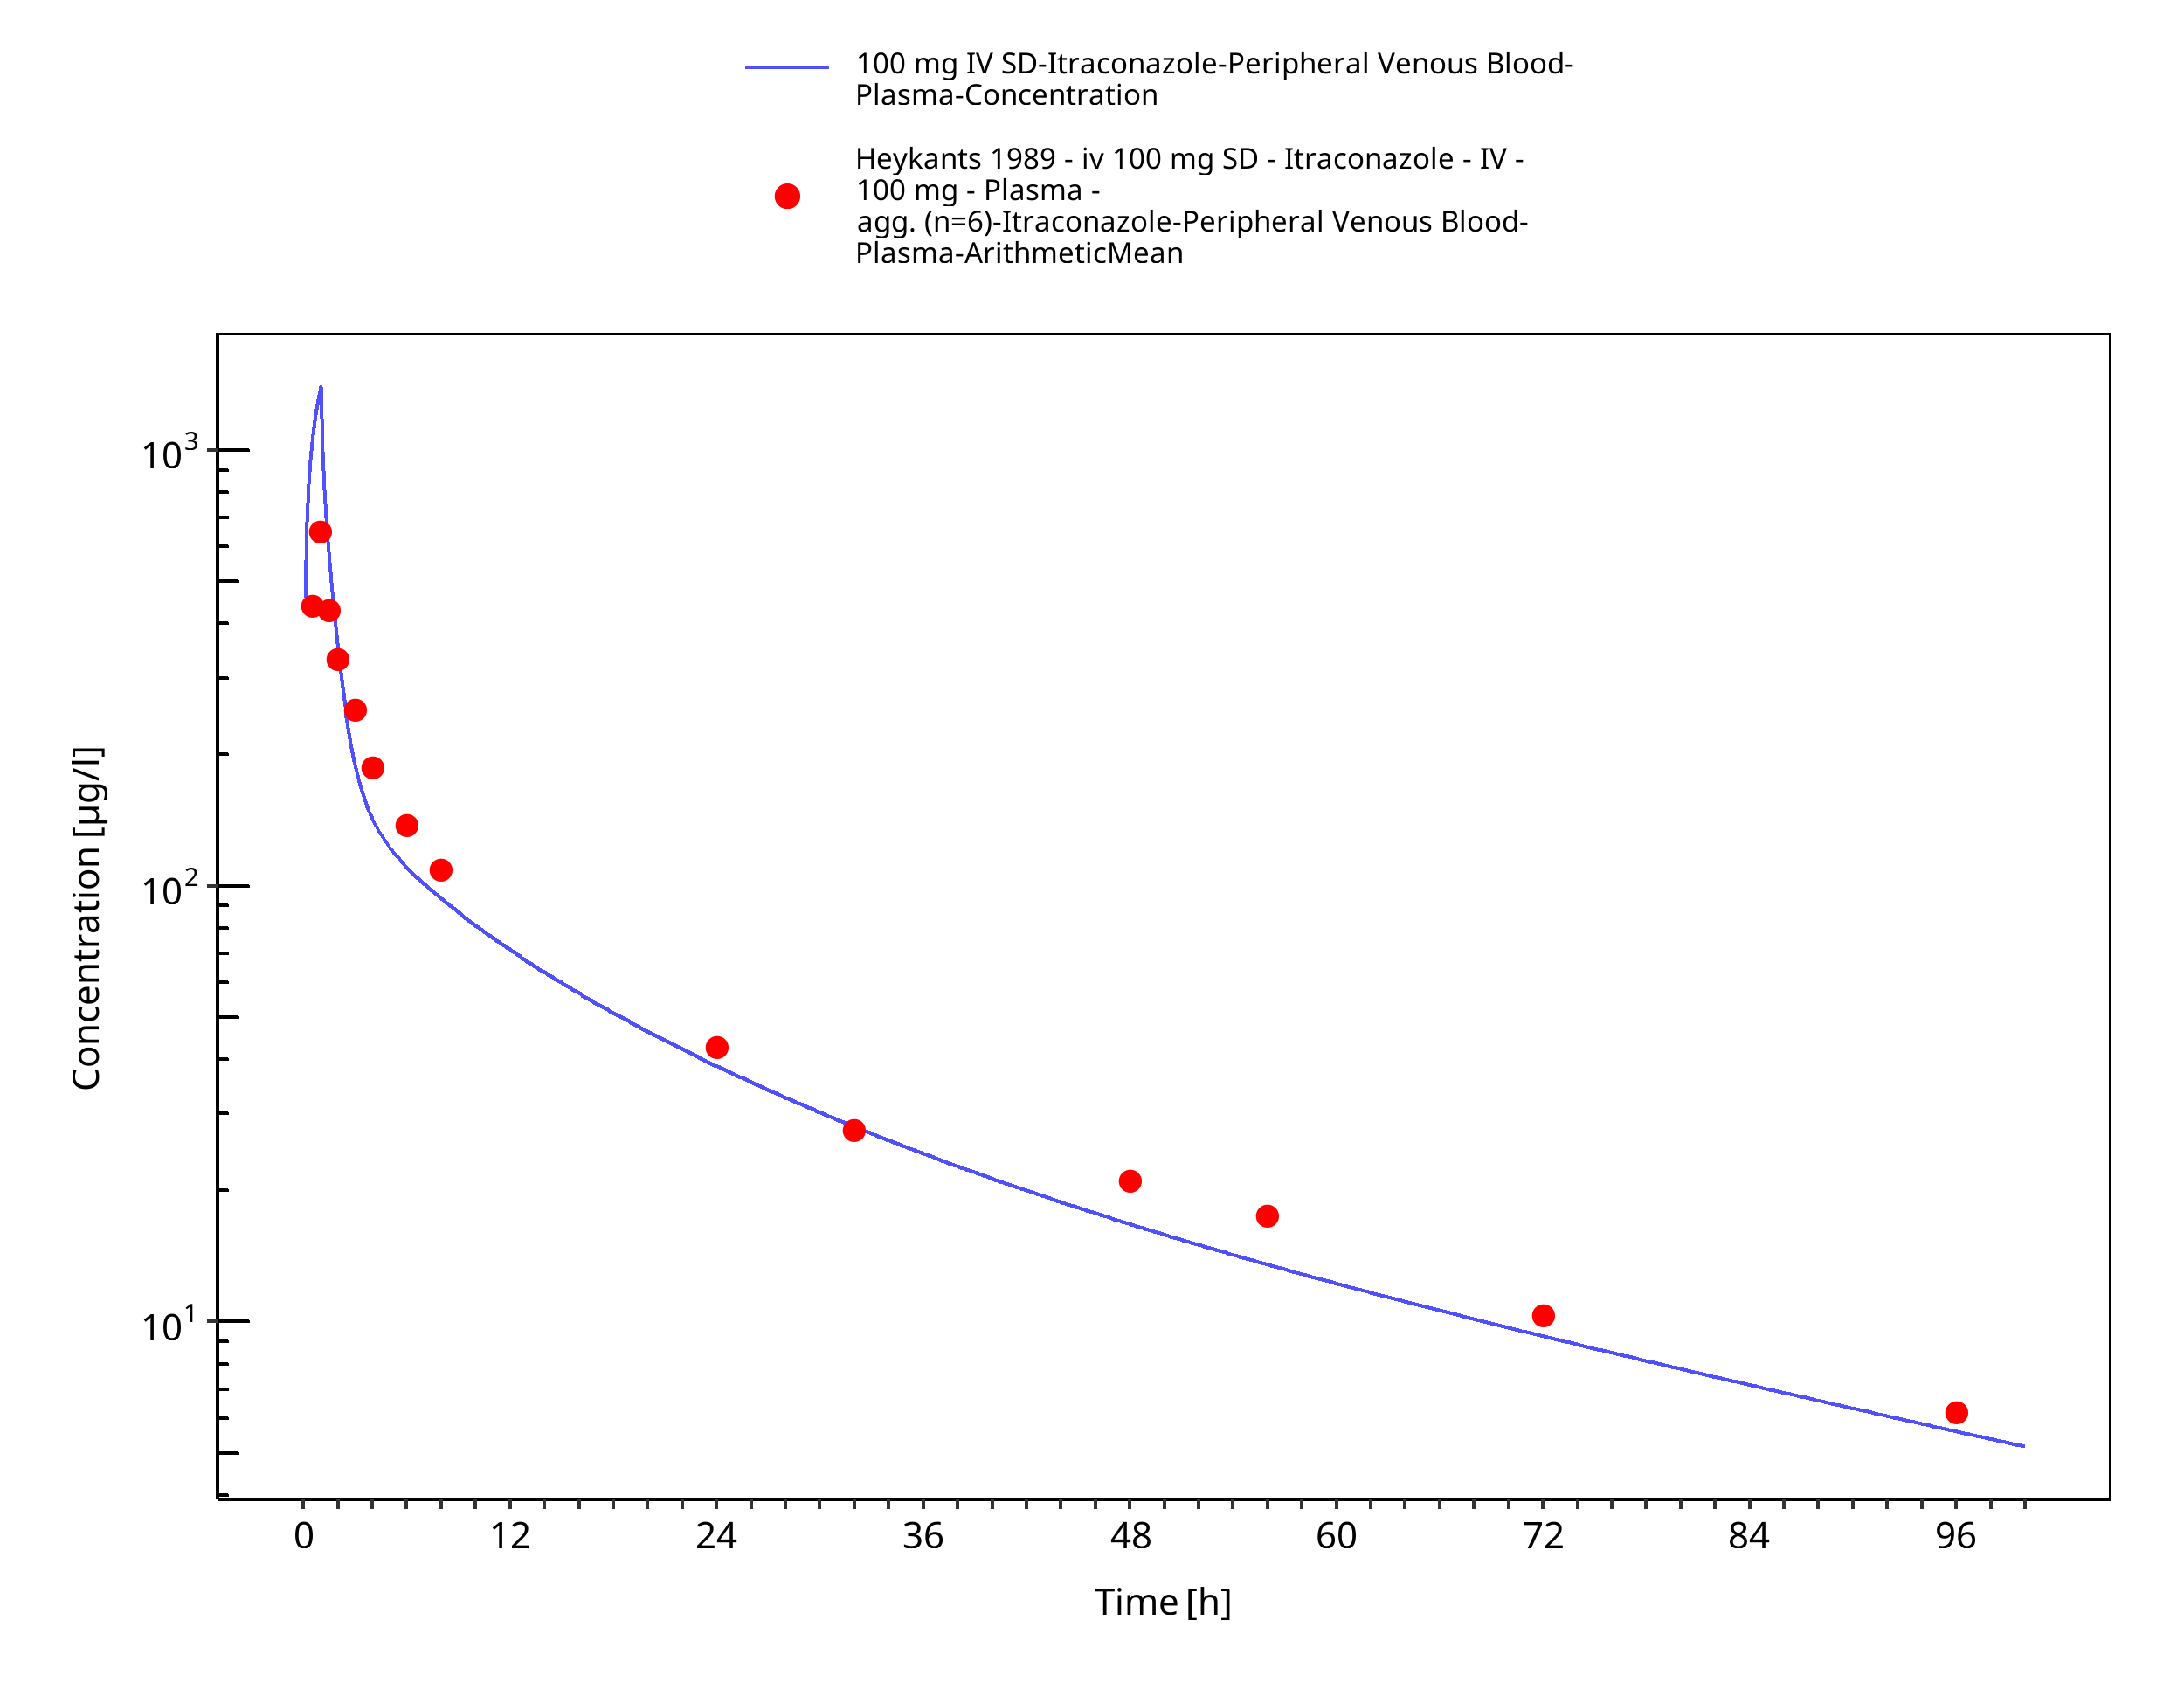
Figure 3-9: 100 mg IV SD - Plasma
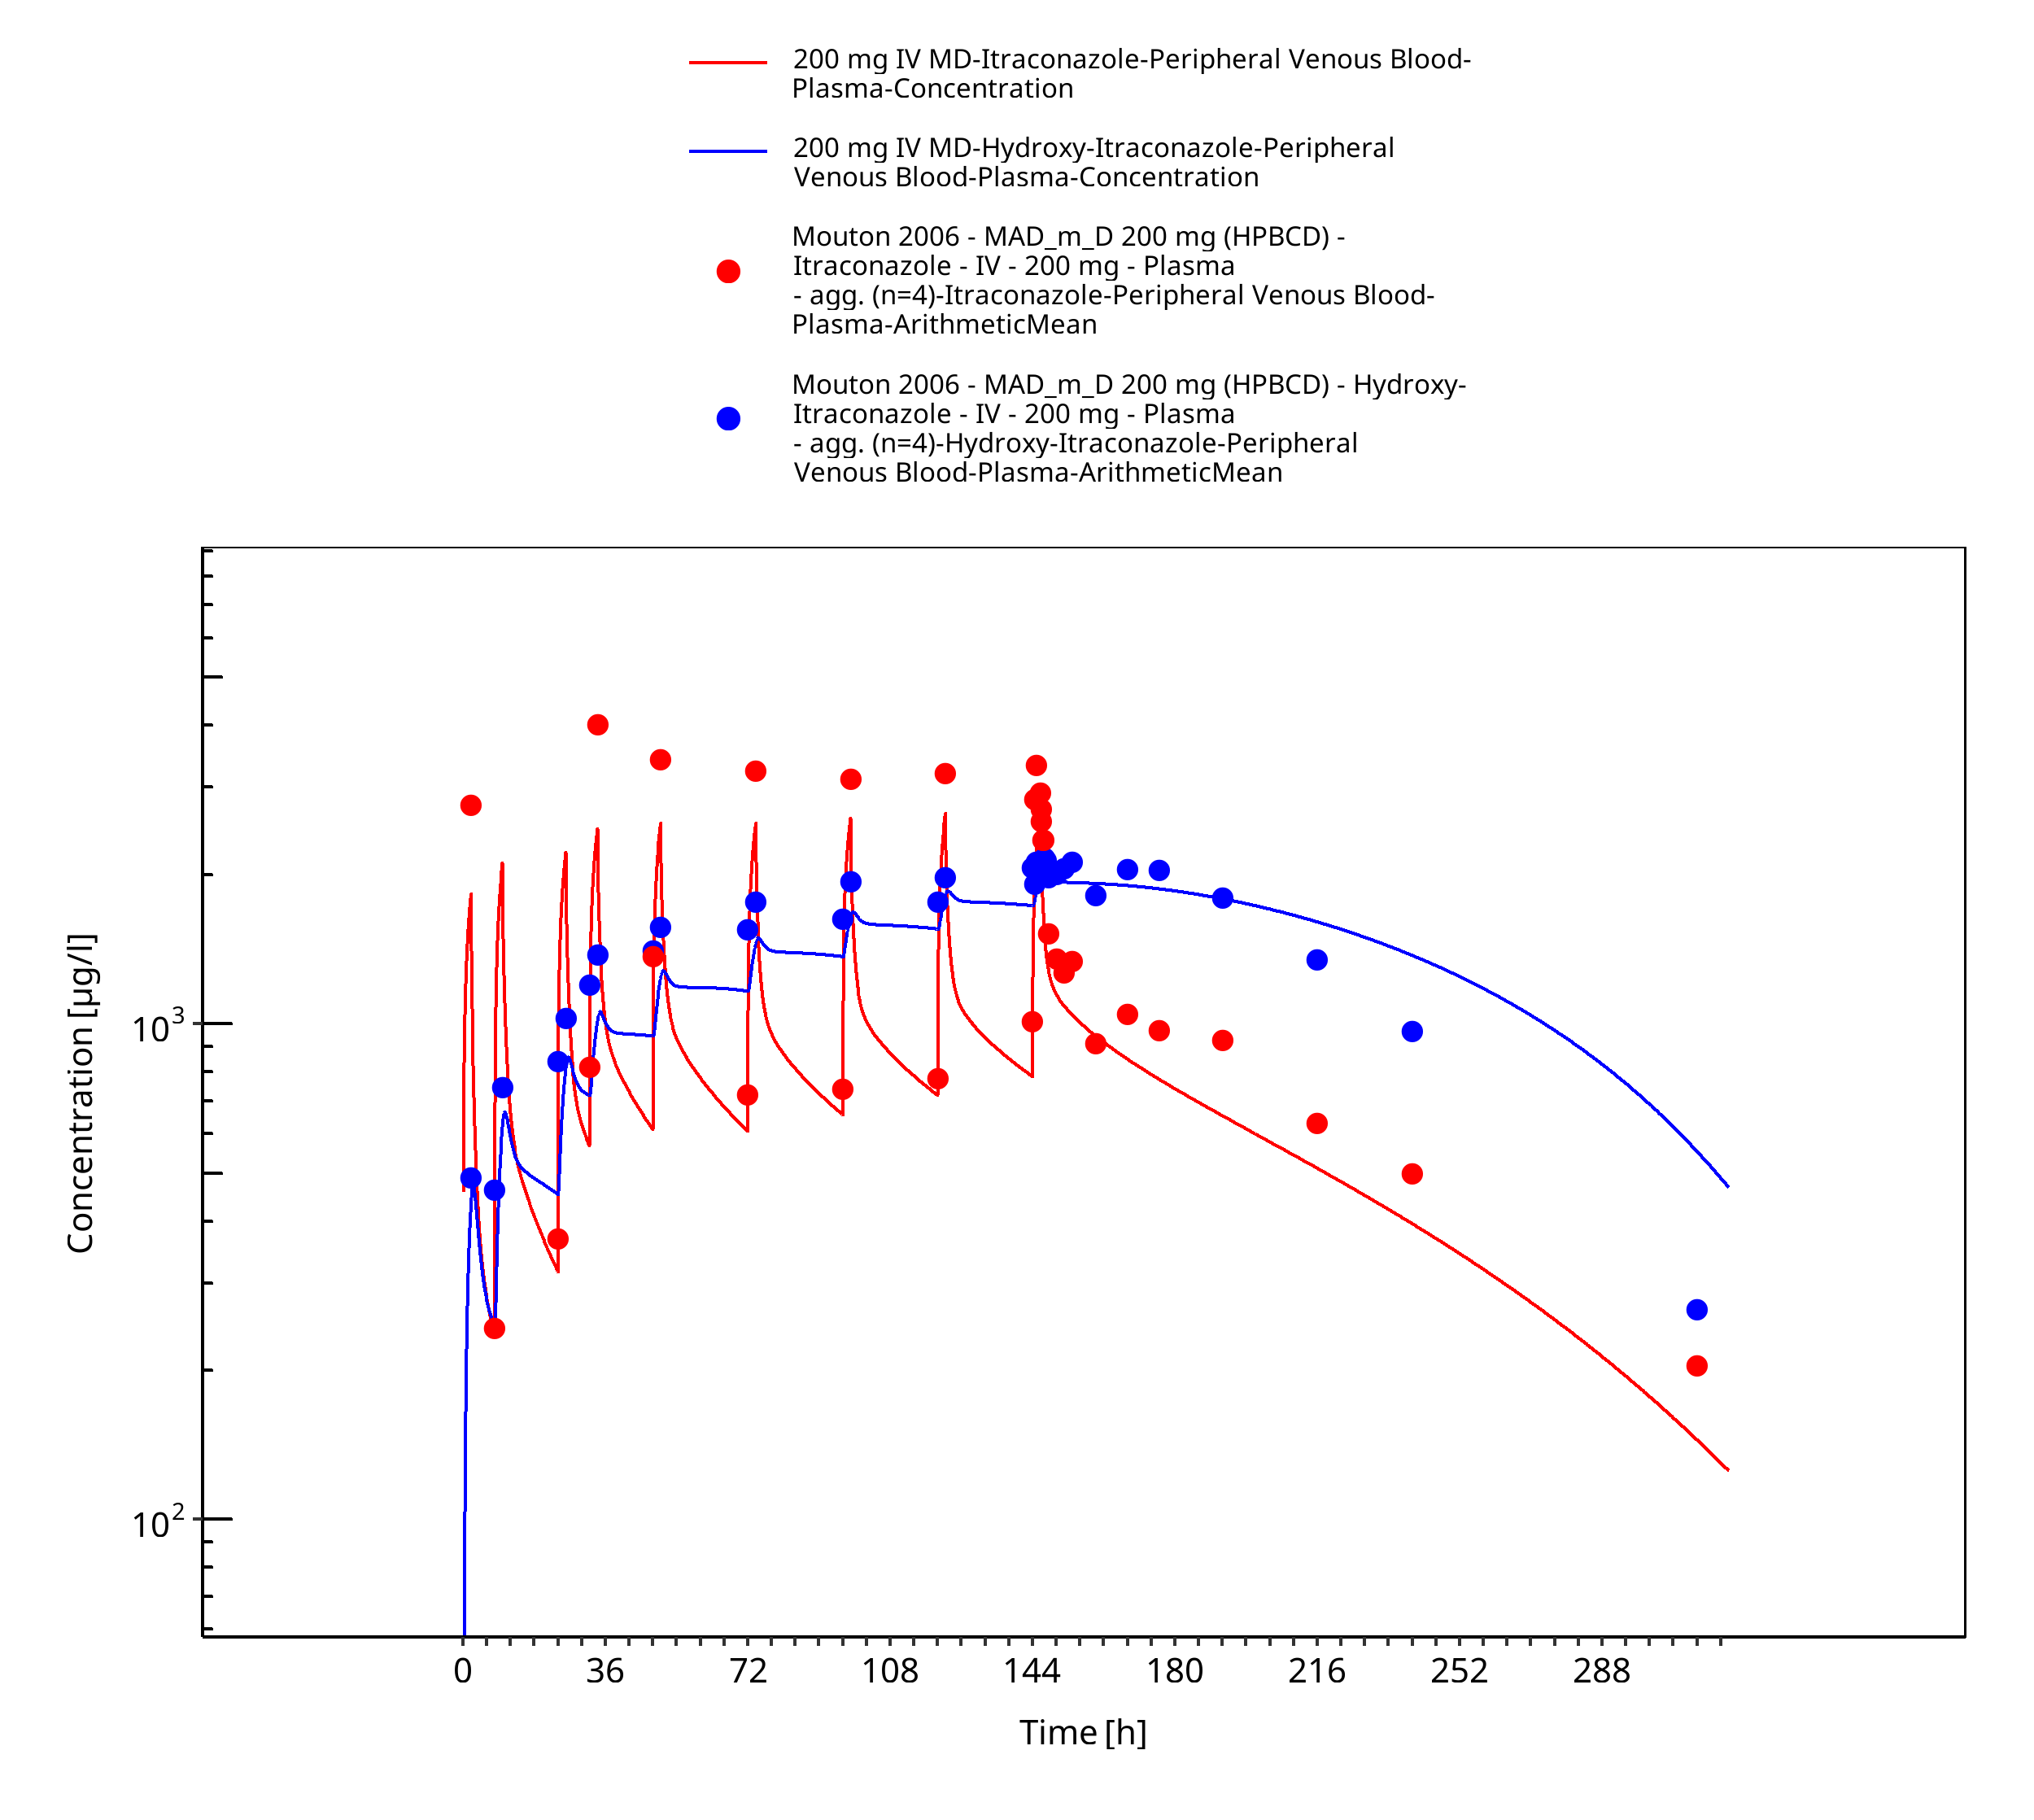
Figure 3-10: 200 mg IV MD - Plasma
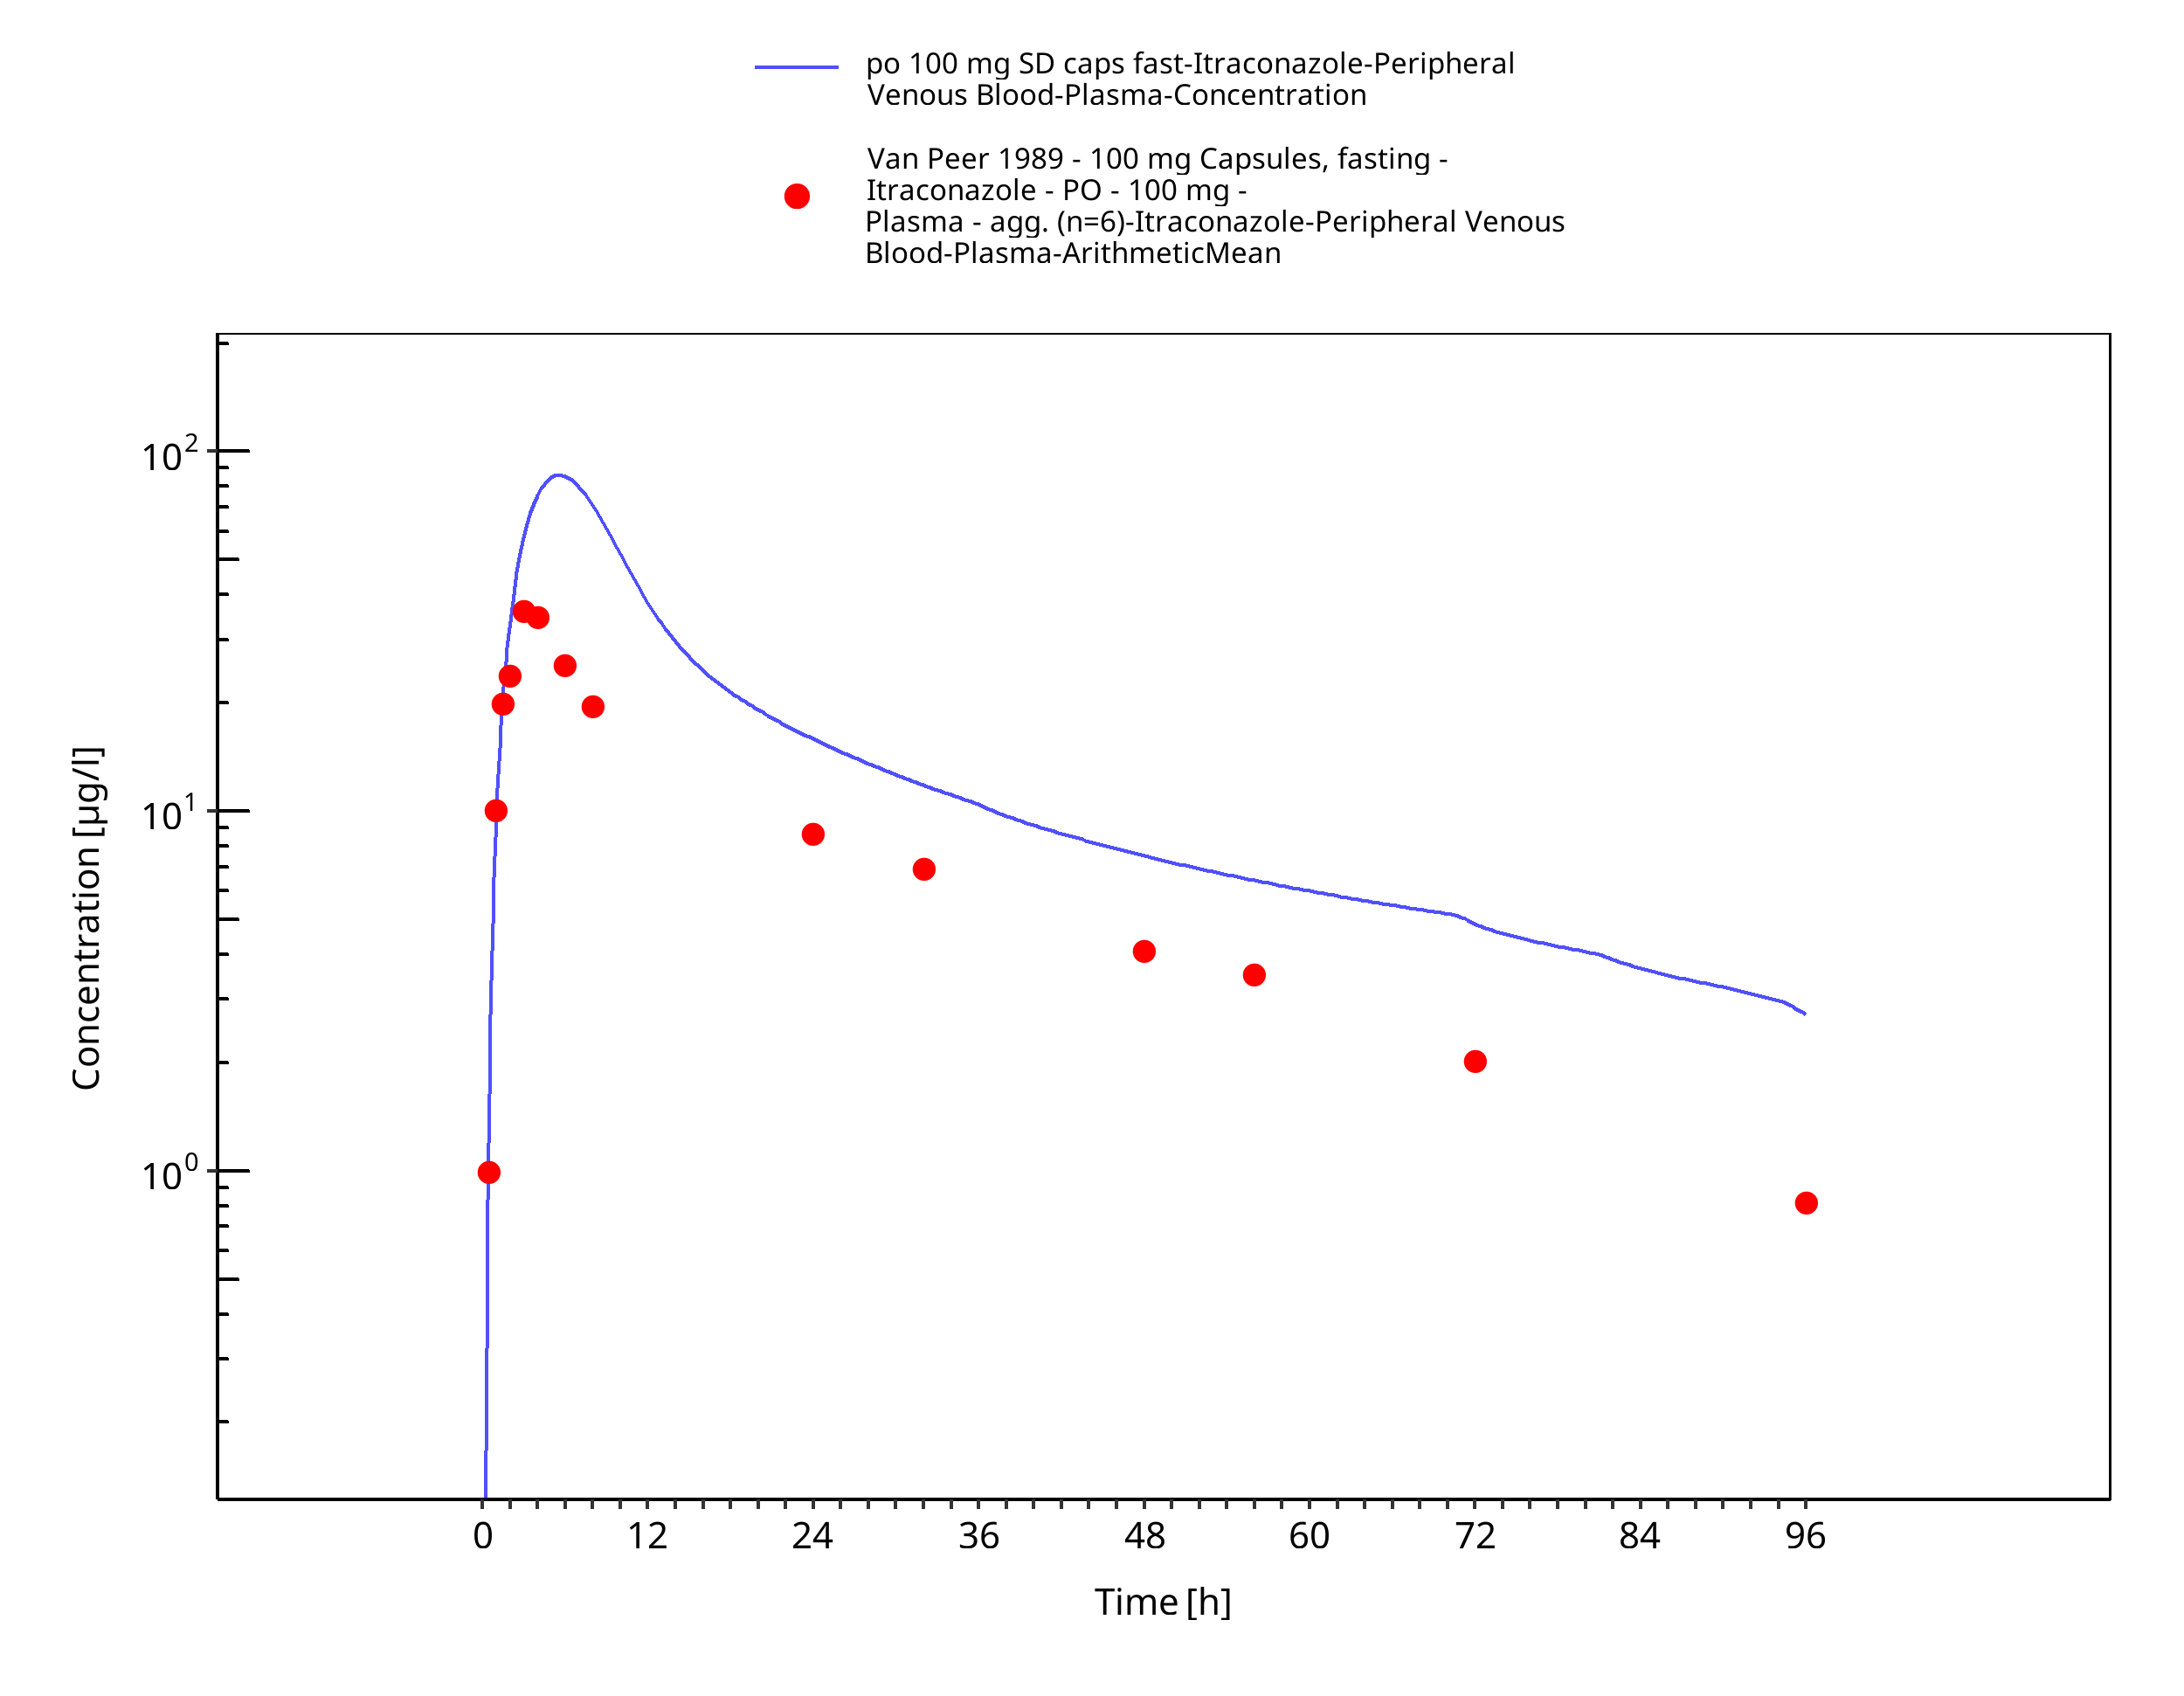
Figure 3-11: po 100 mg SD caps fast - Plasma
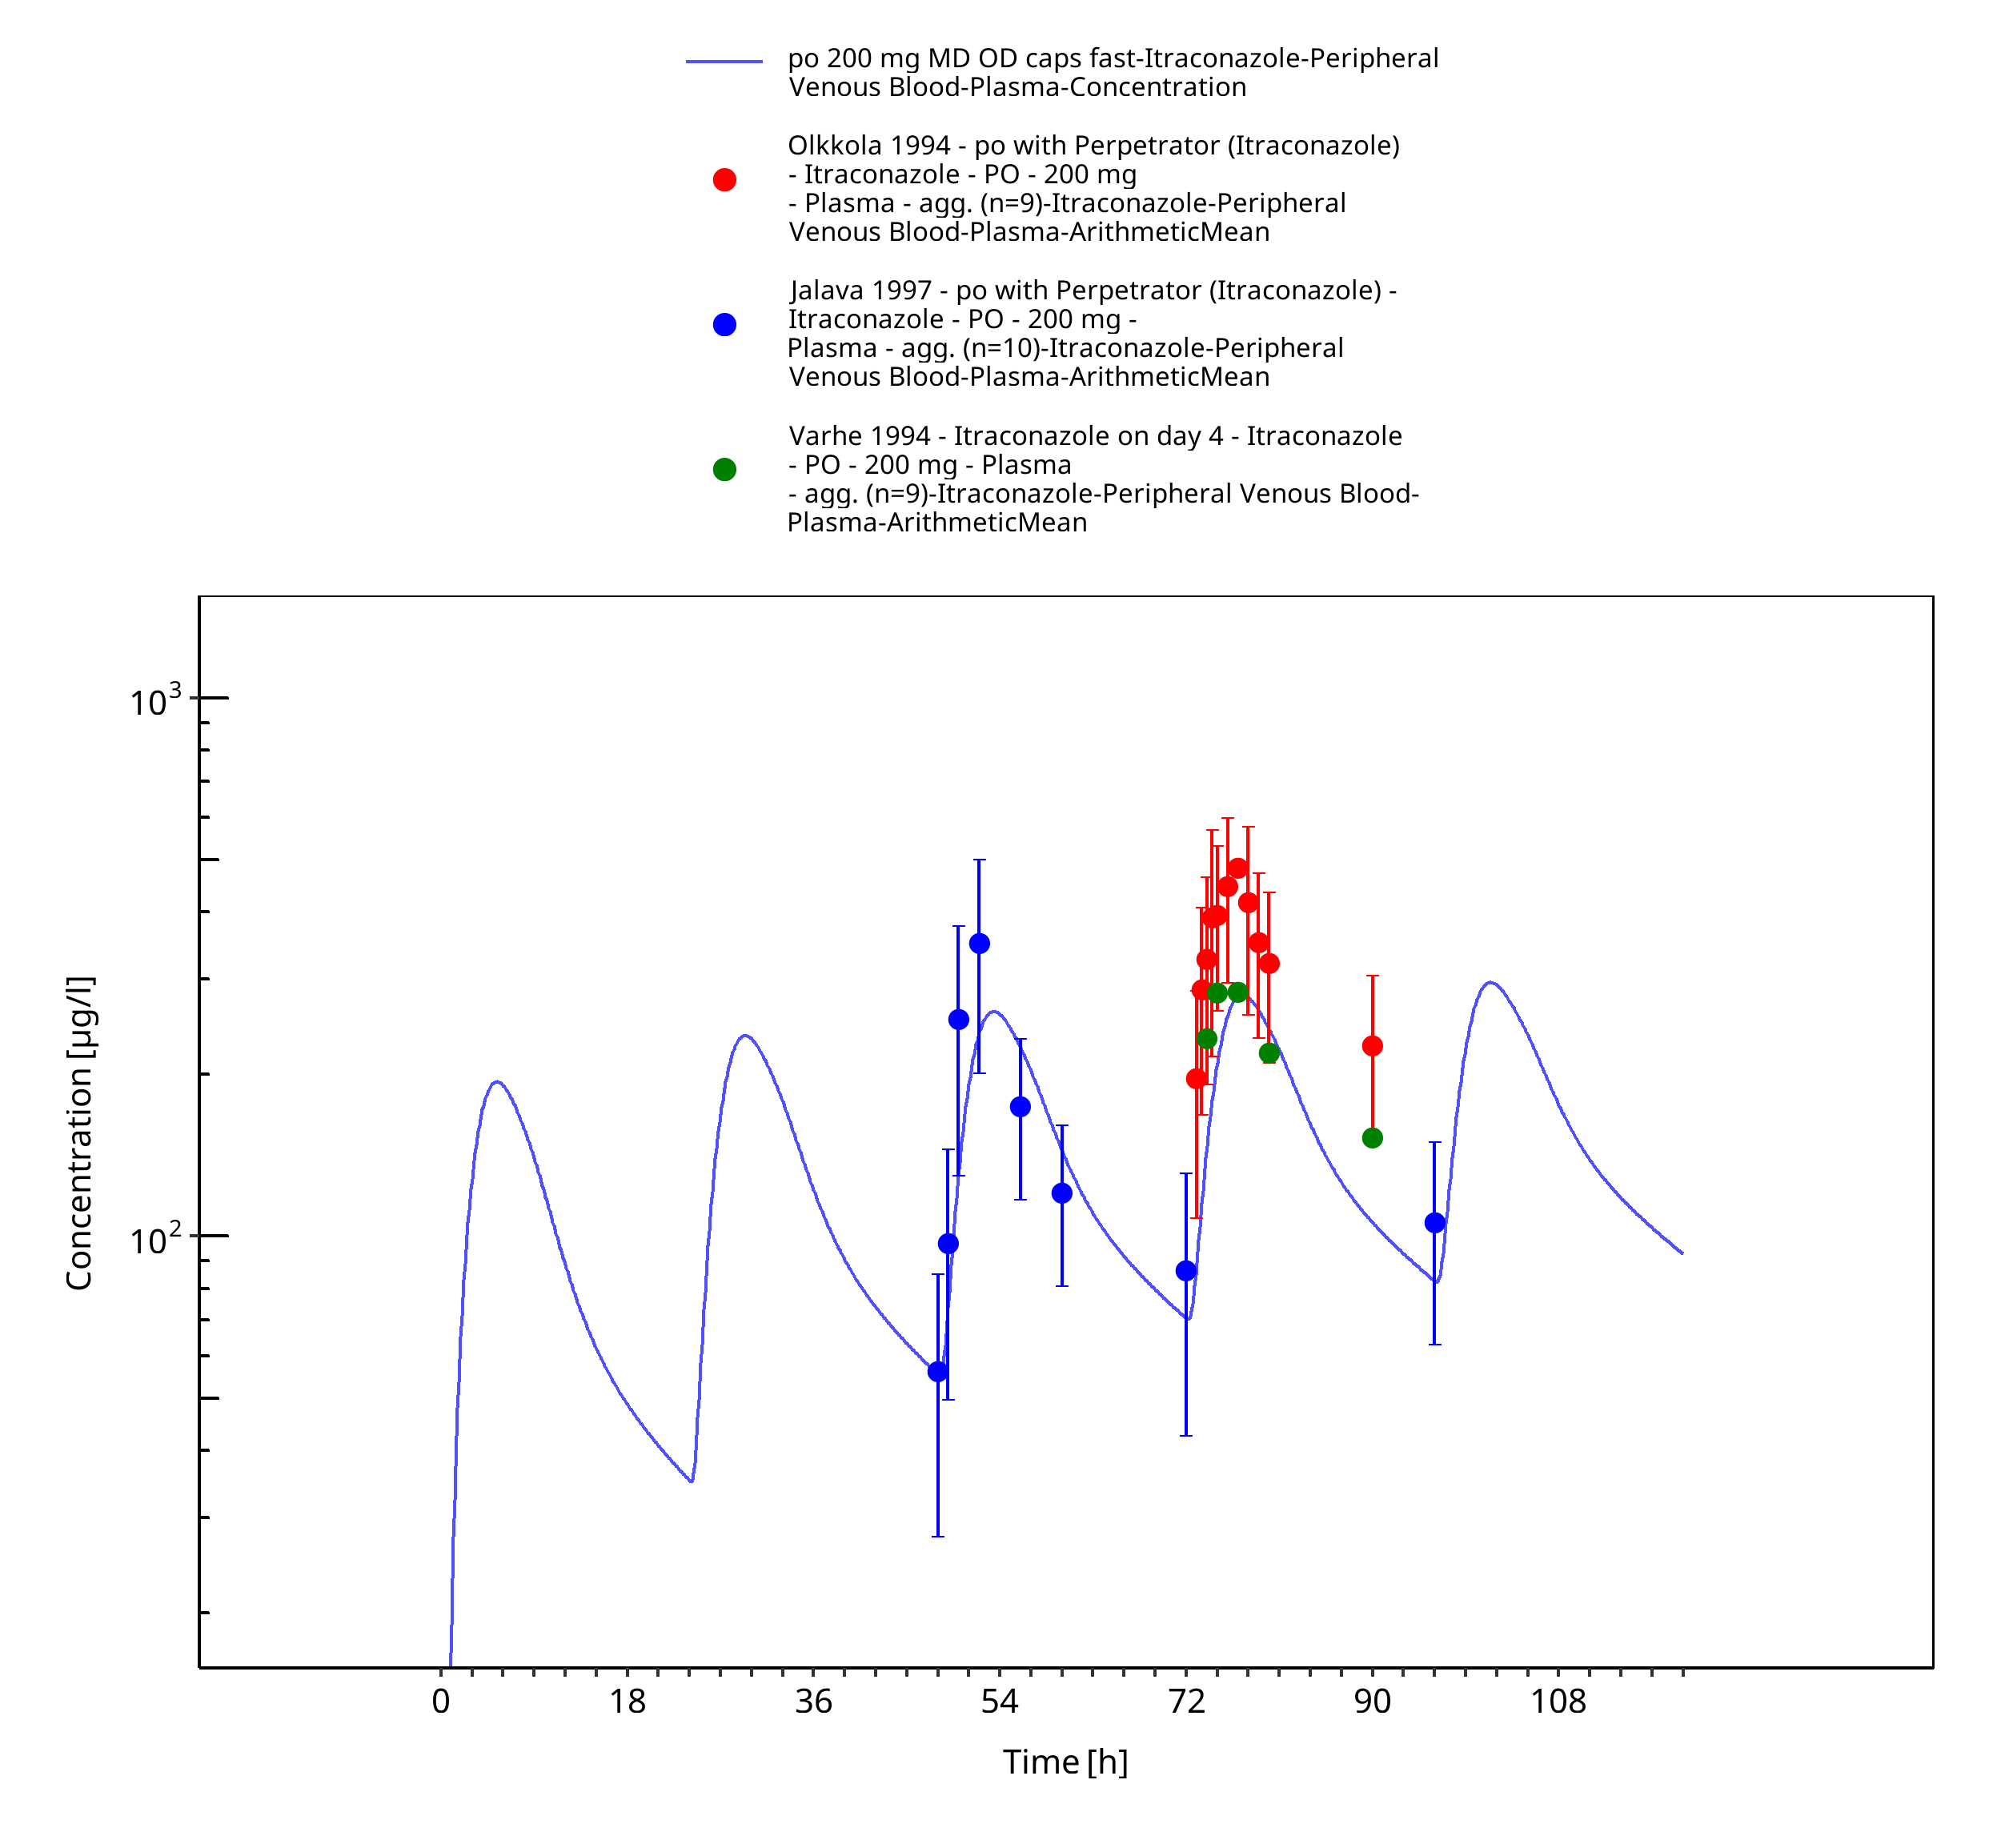
Figure 3-12: po 200 mg MD OD caps fast - Plasma
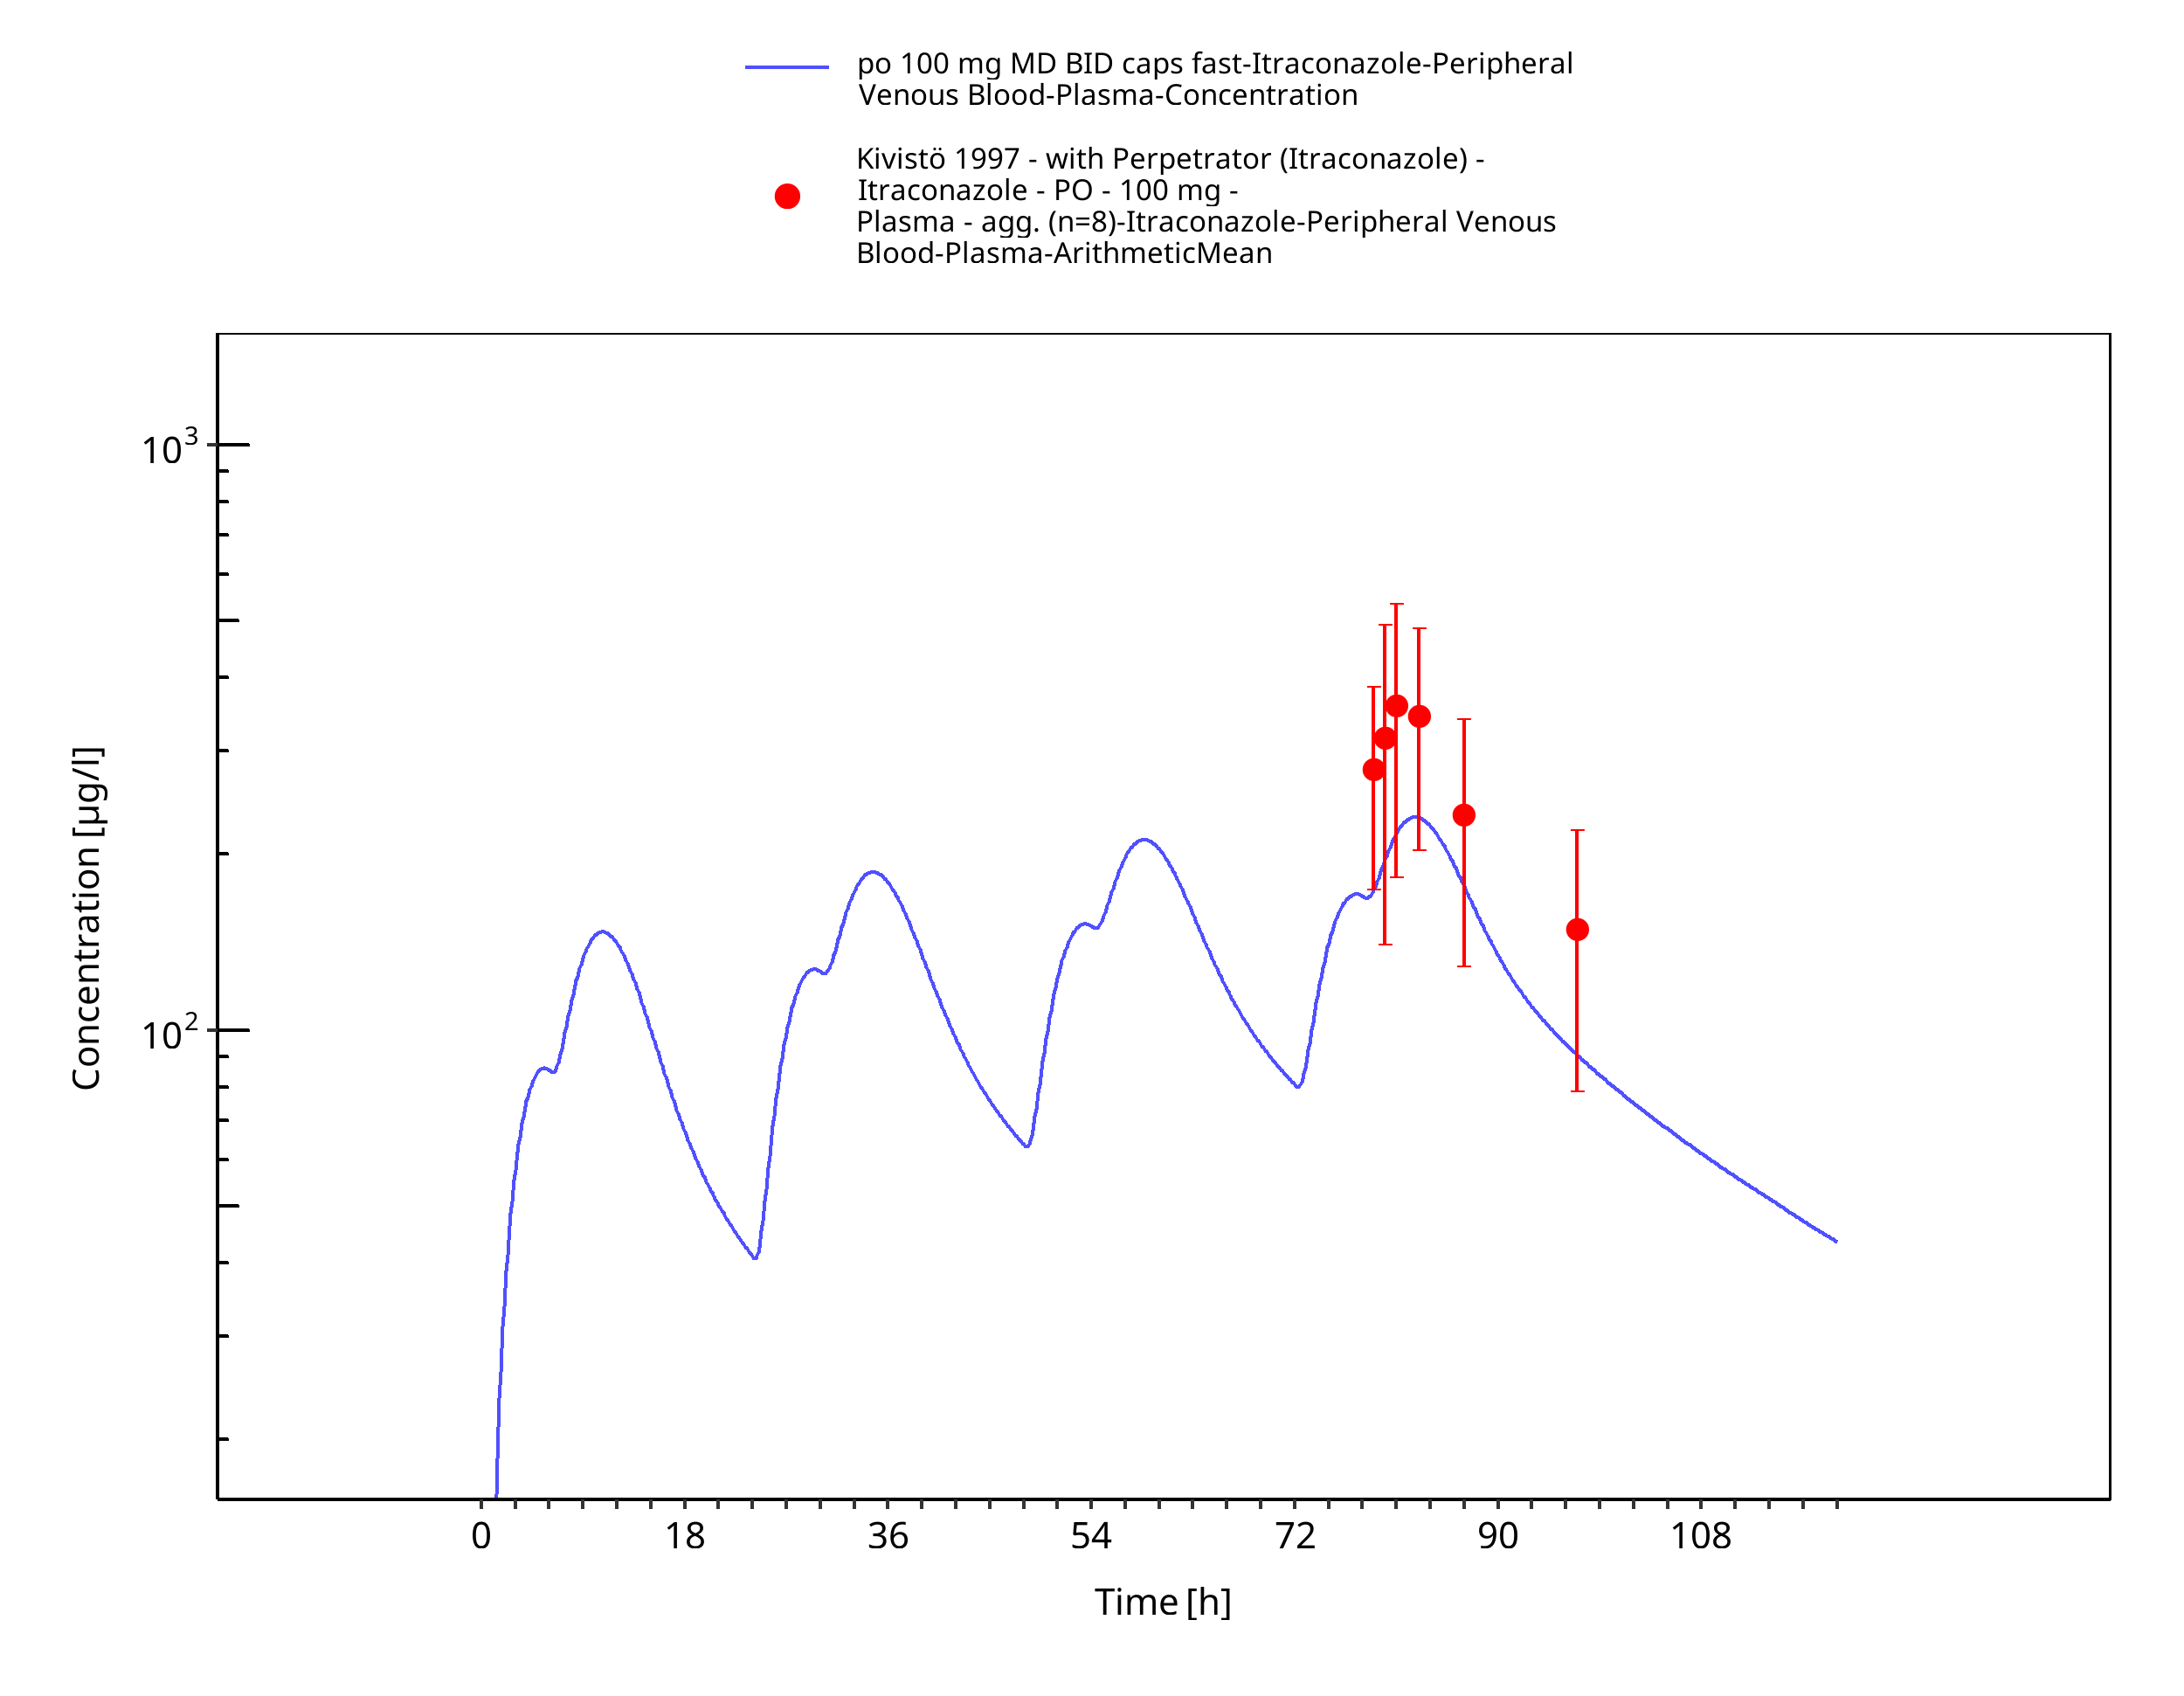
Figure 3-13: po 100 mg MD BID caps fast - Plasma
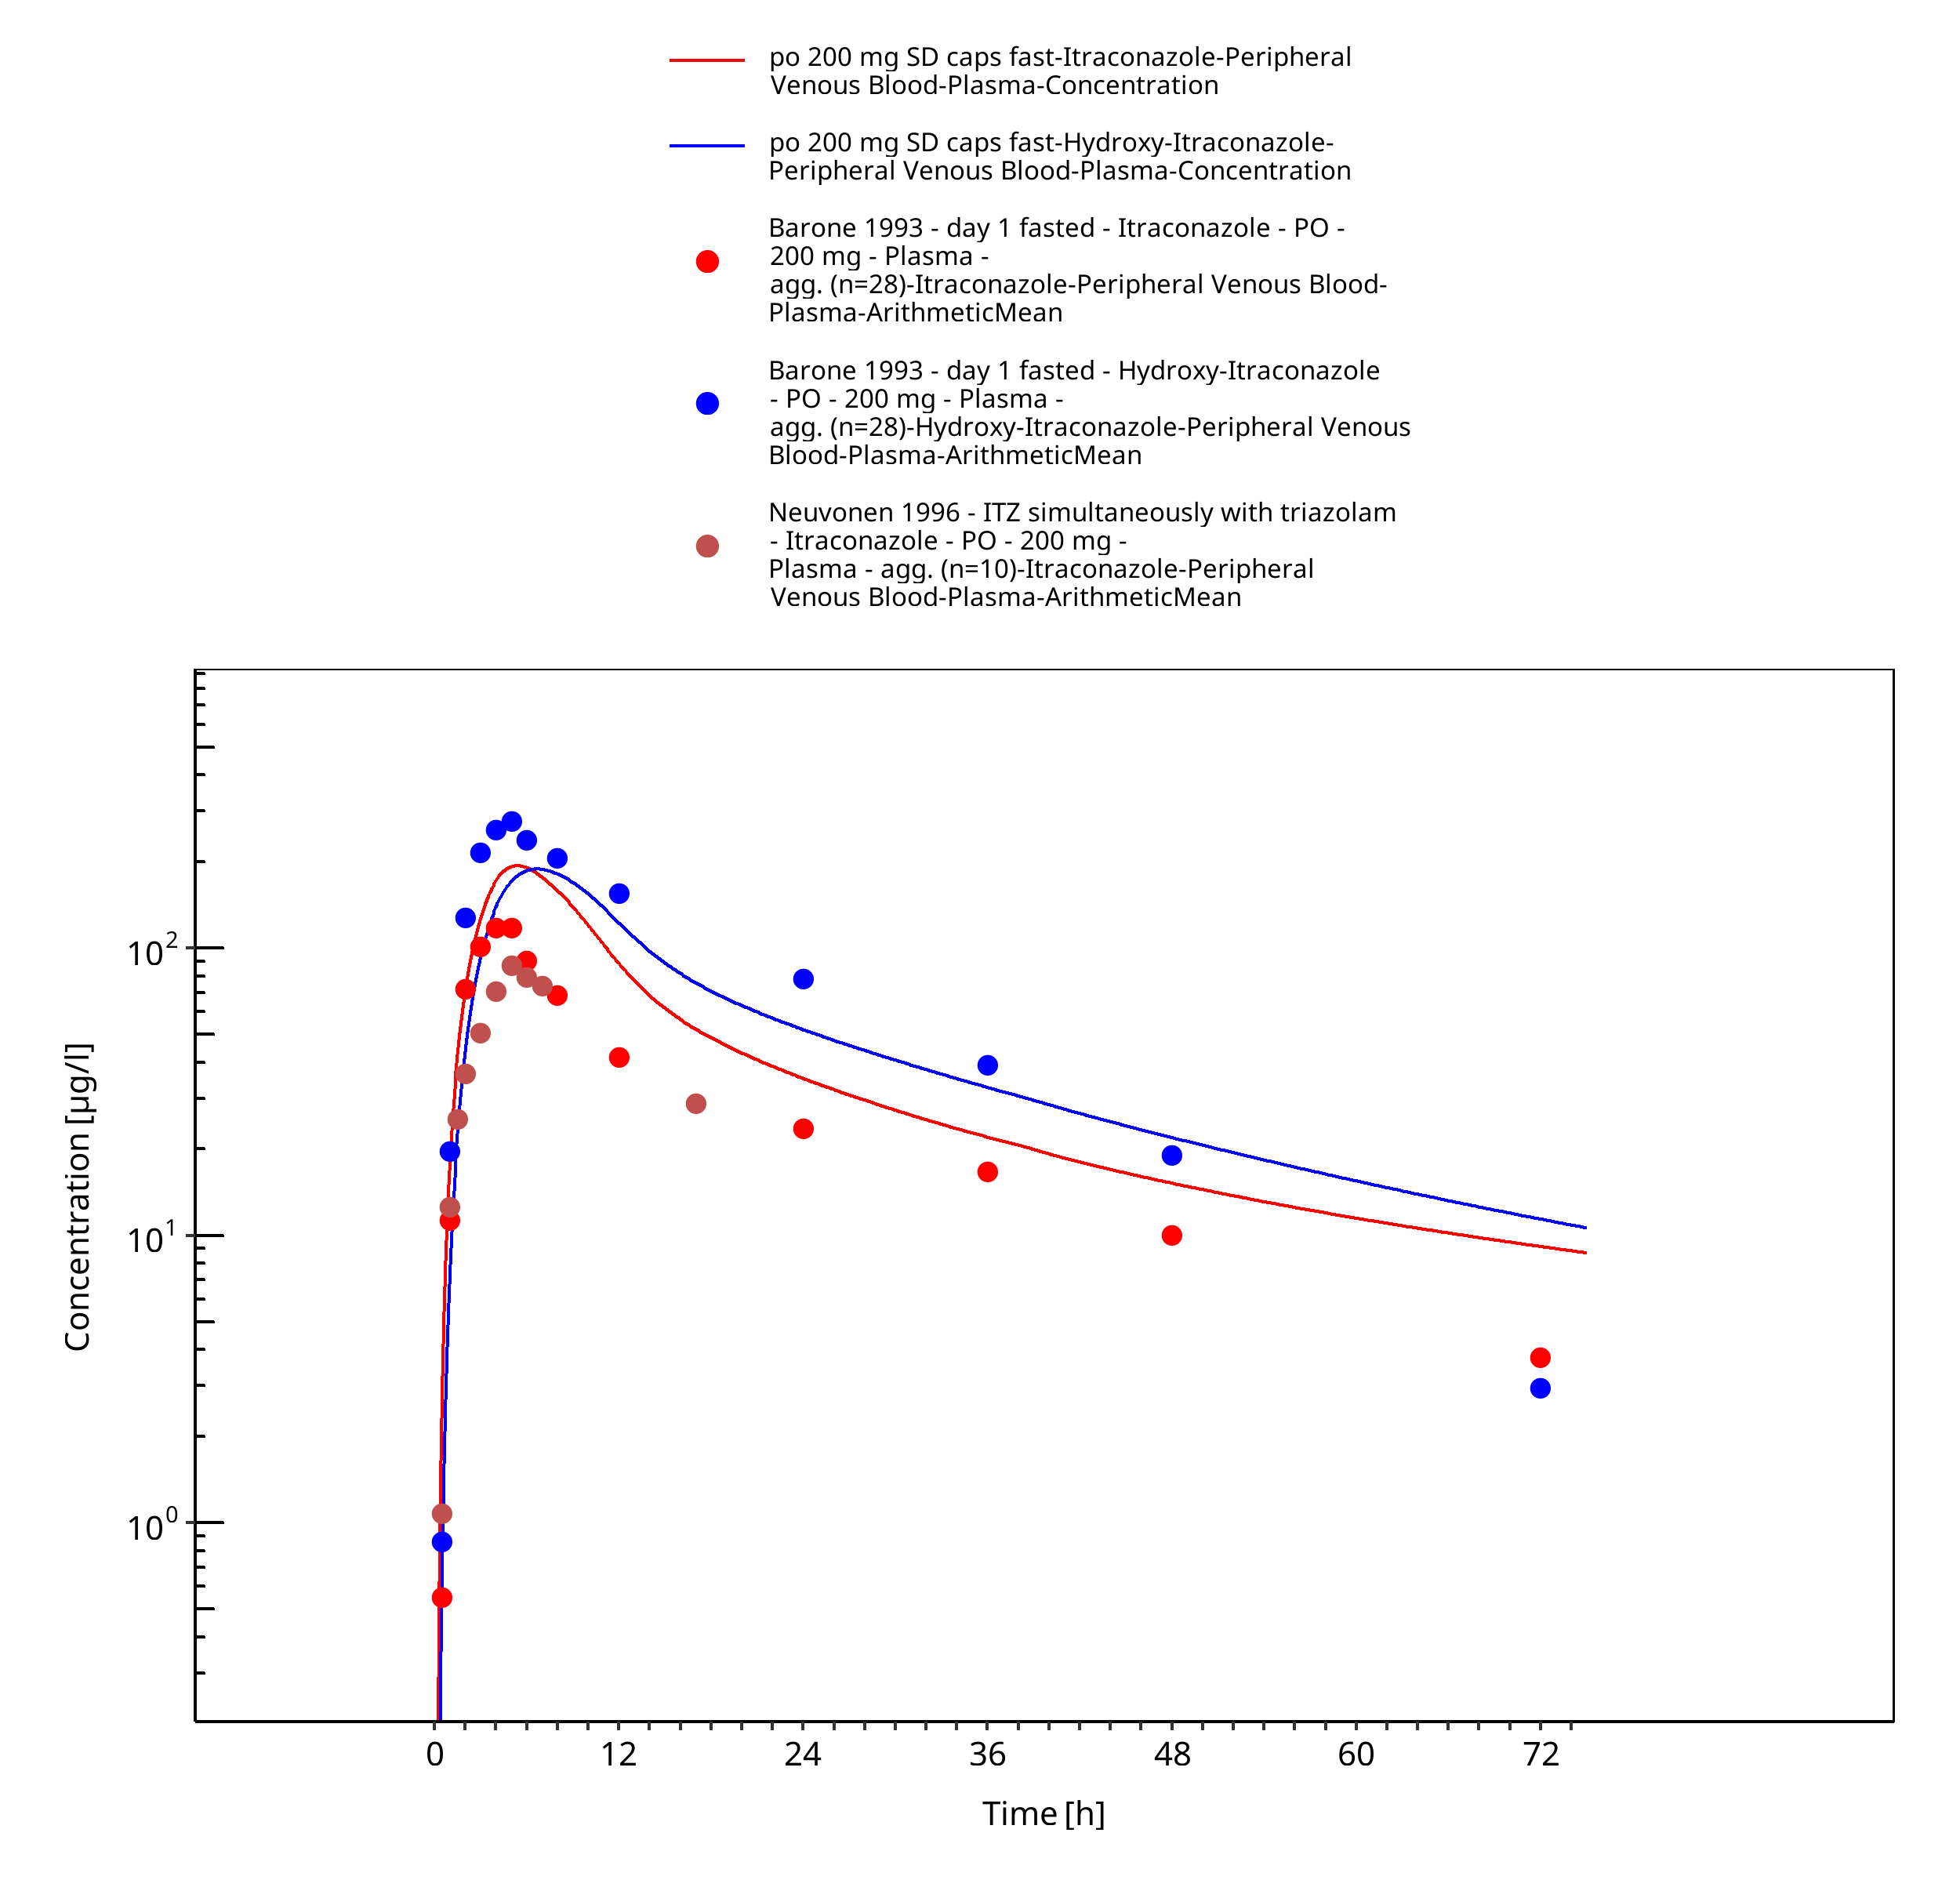
Figure 3-14: po 200 mg SD caps fast - Plasma
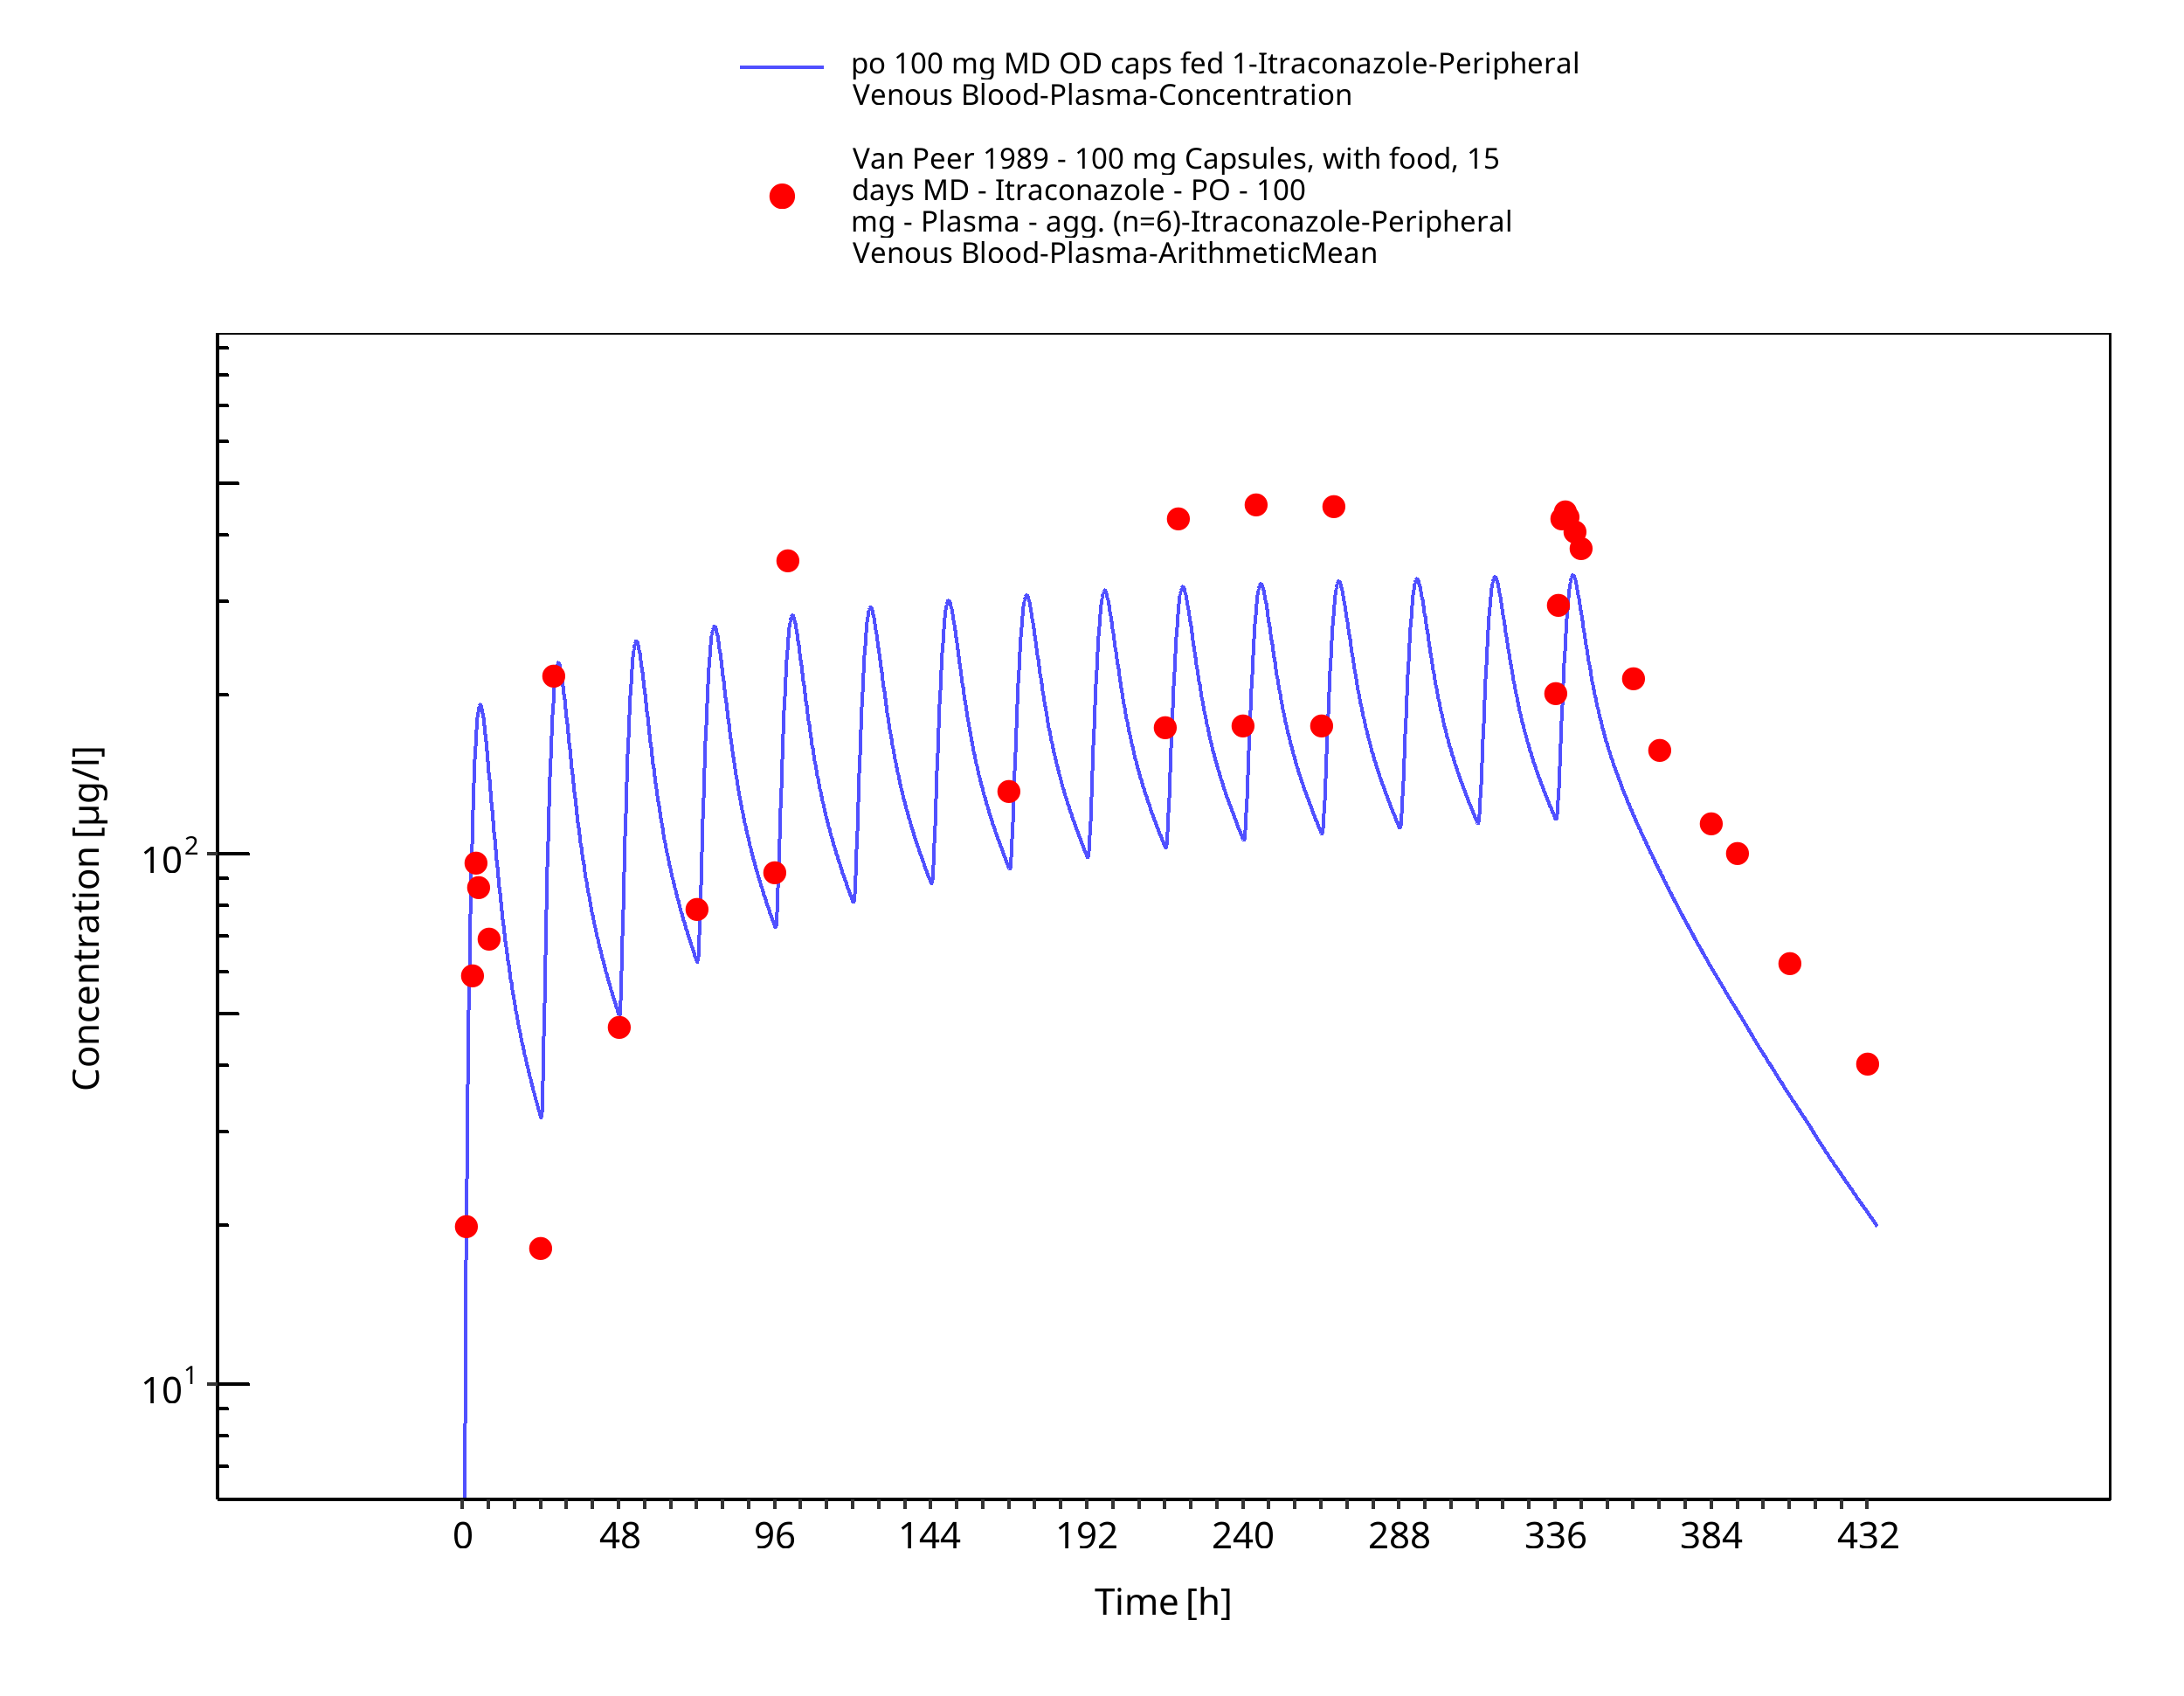
Figure 3-15: po 100 mg MD OD caps fed 1 - Plasma
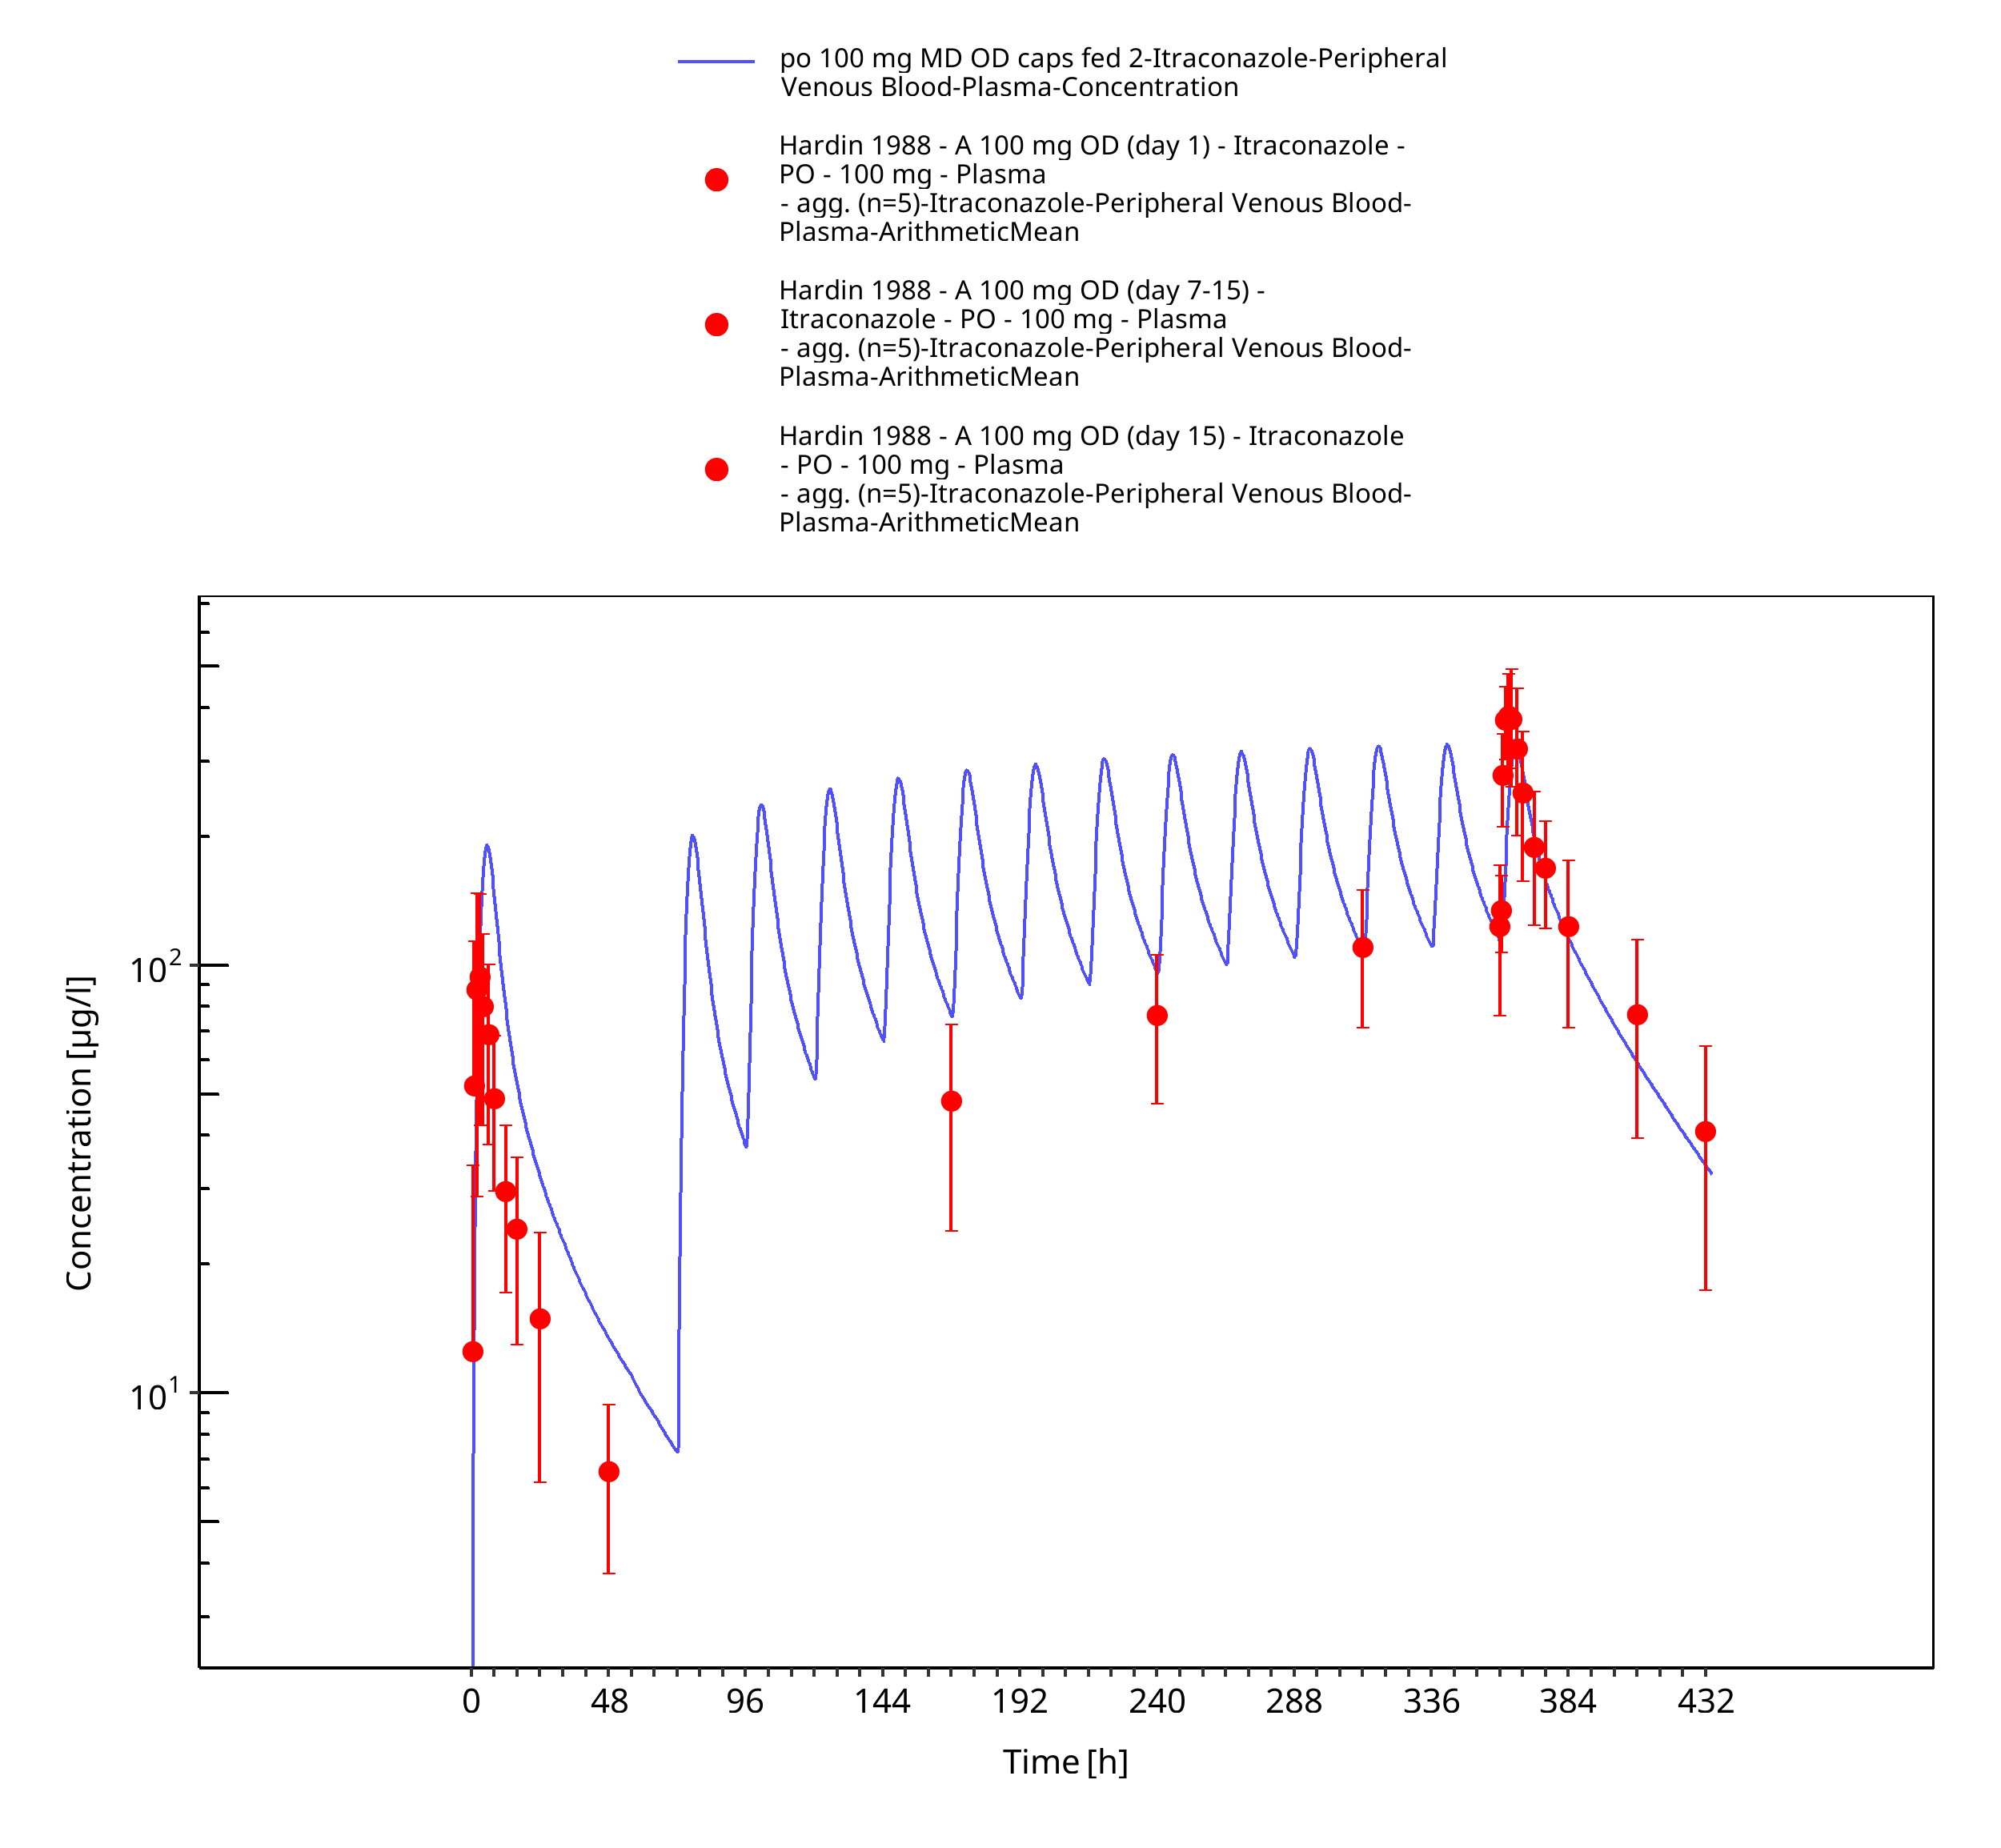
Figure 3-16: po 100 mg MD OD caps fed 2 - Plasma
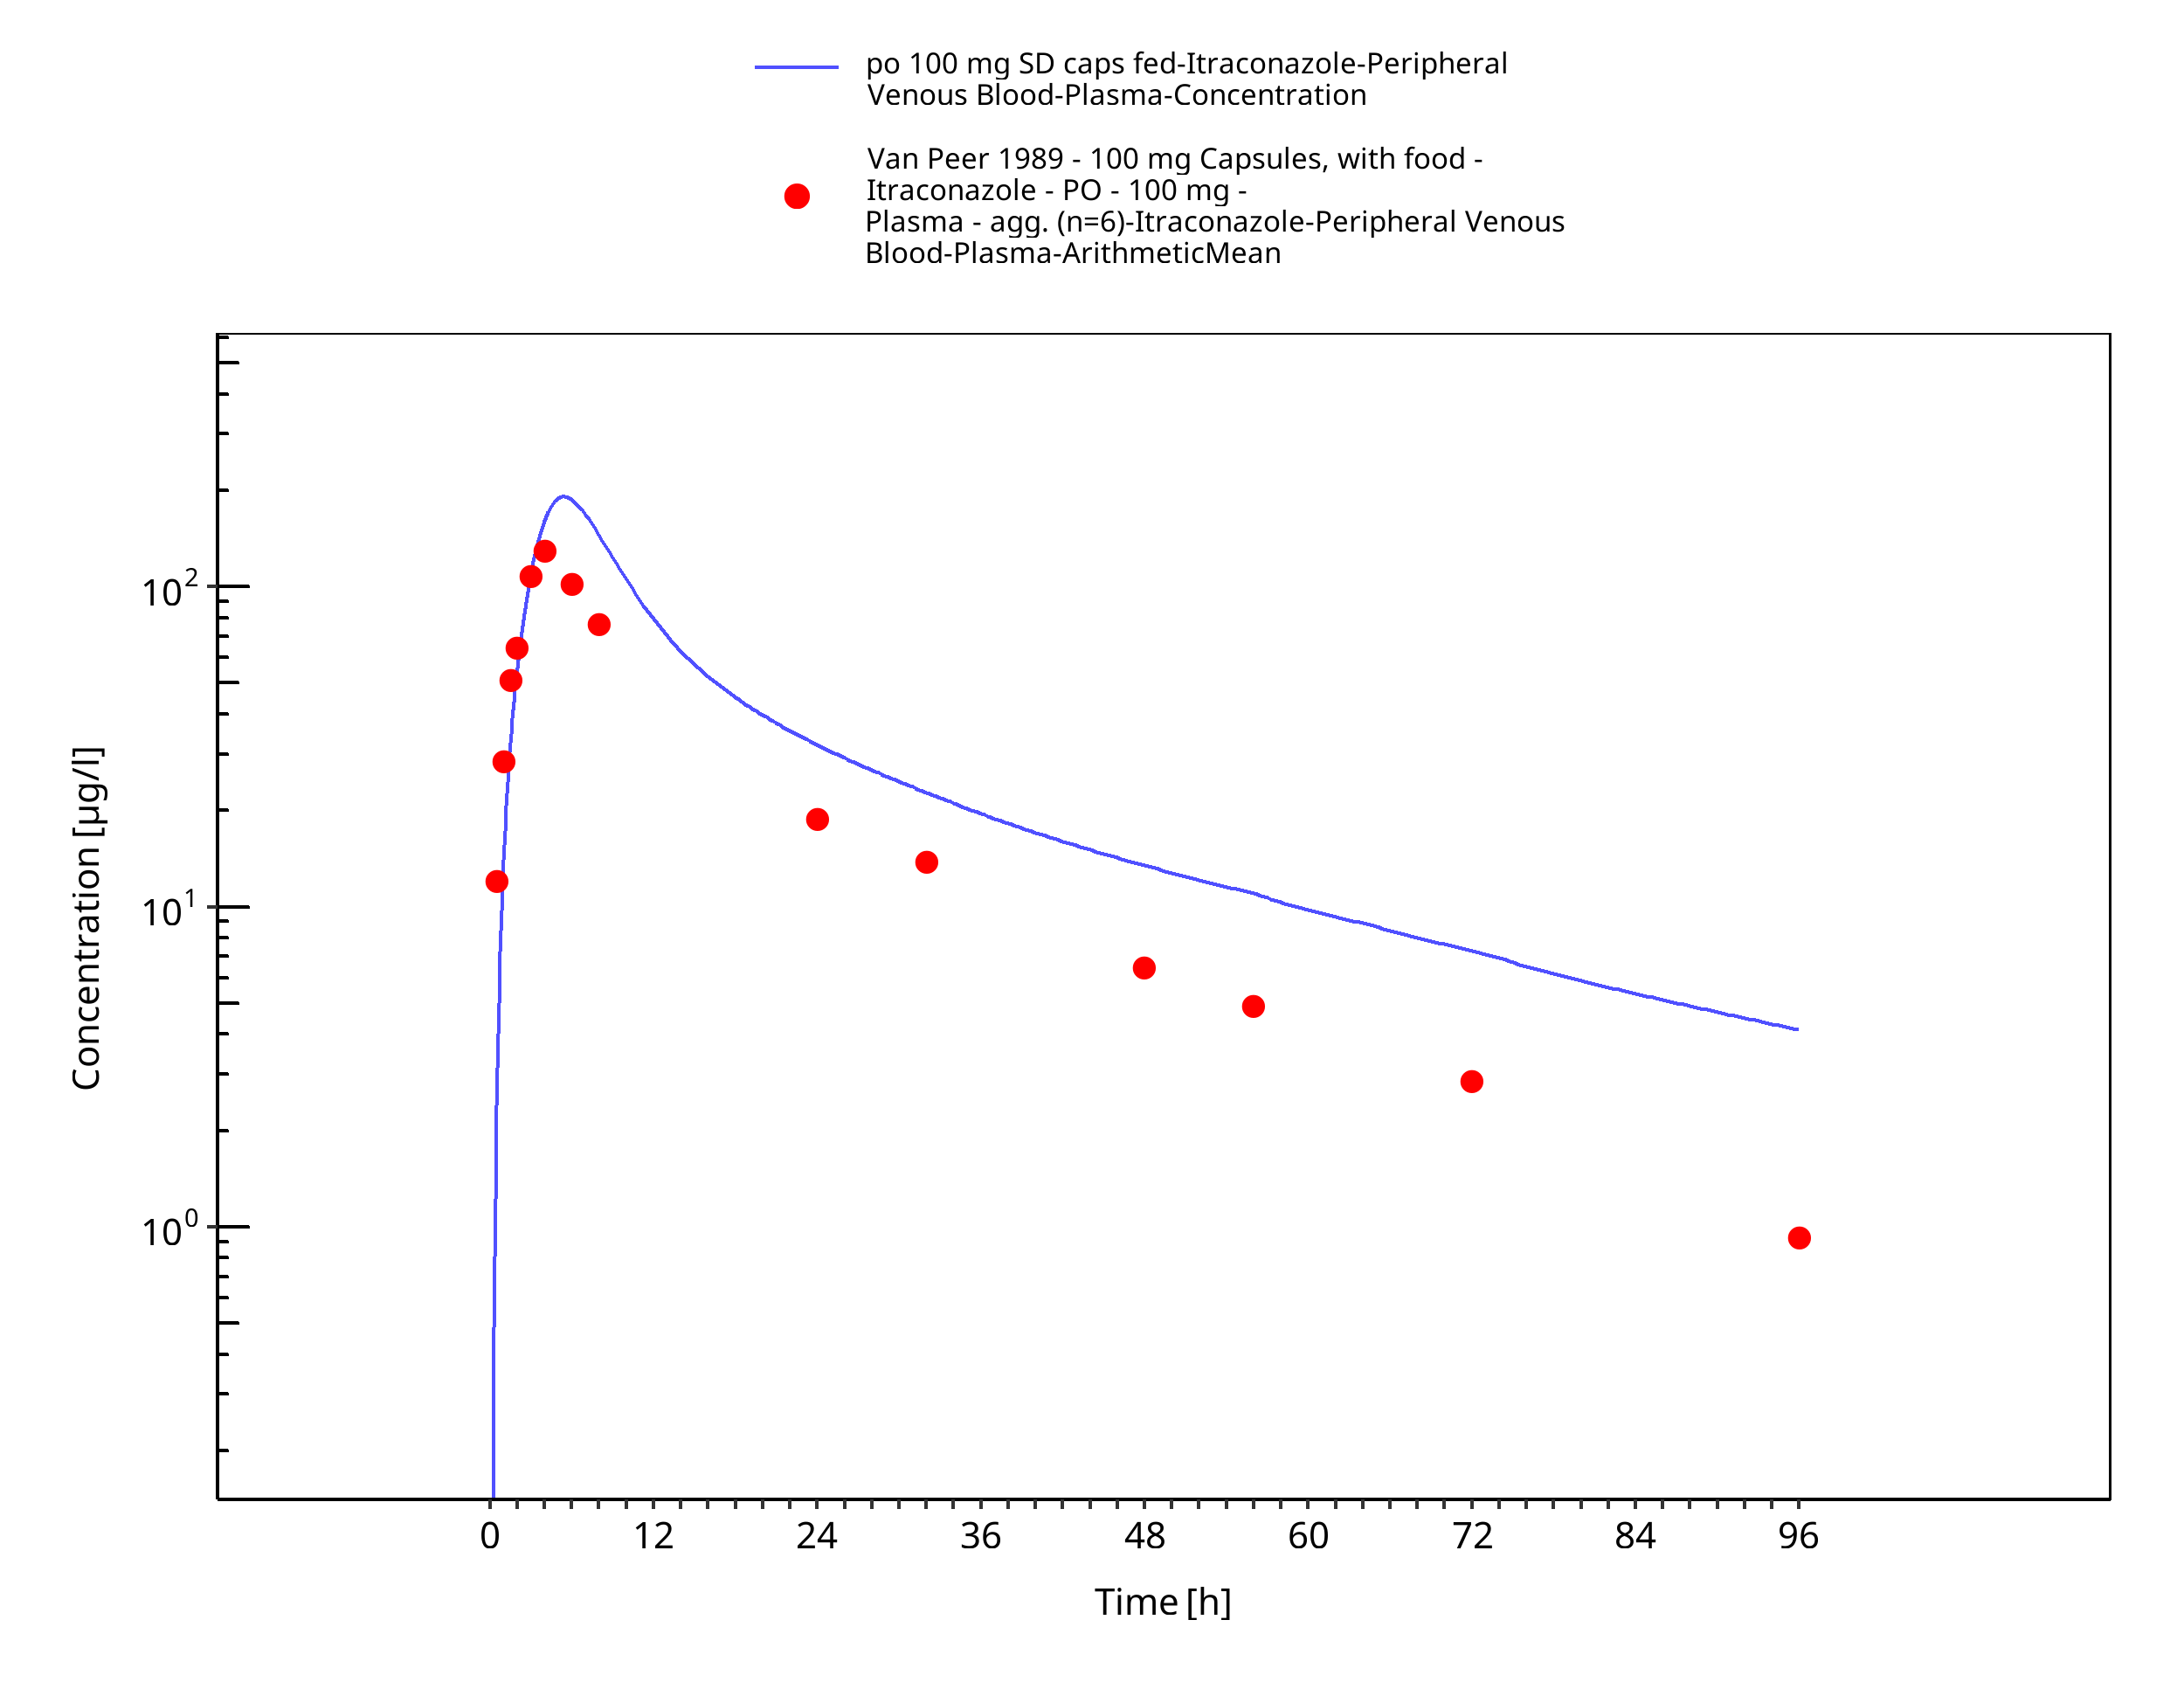
Figure 3-17: po 100 mg SD caps fed - Plasma
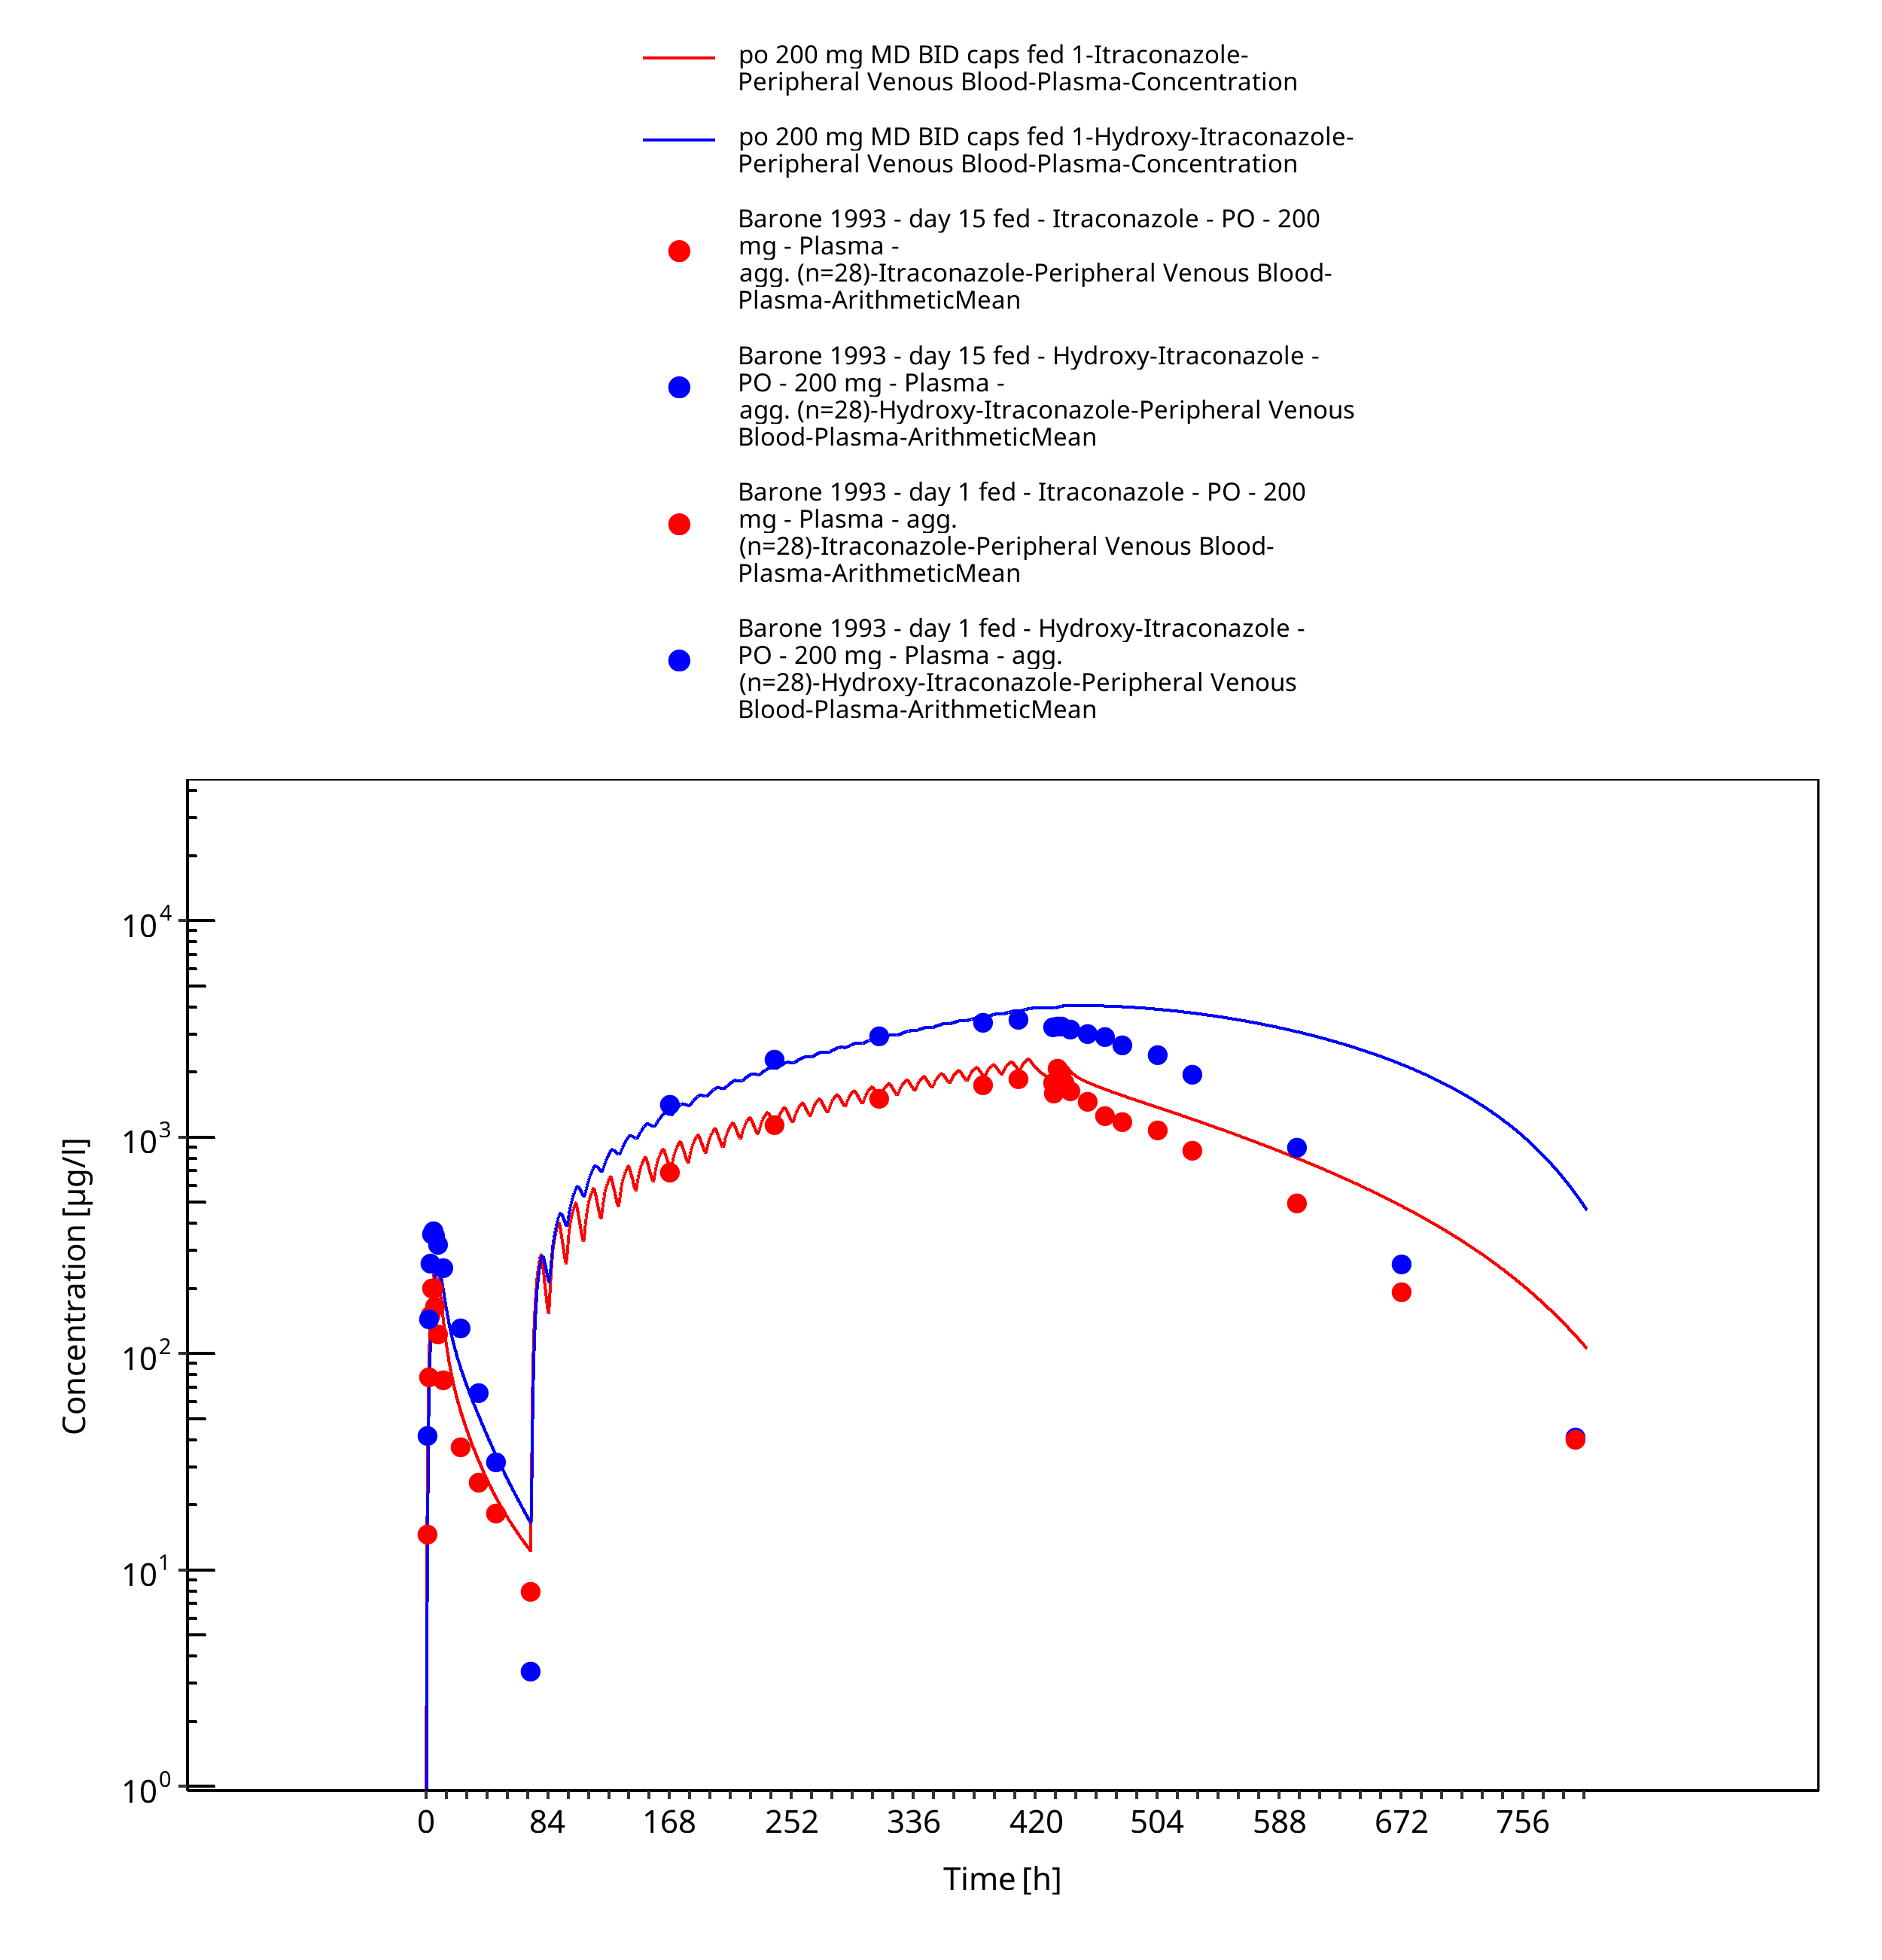
Figure 3-18: po 200 mg MD BID caps fed 1 - Plasma
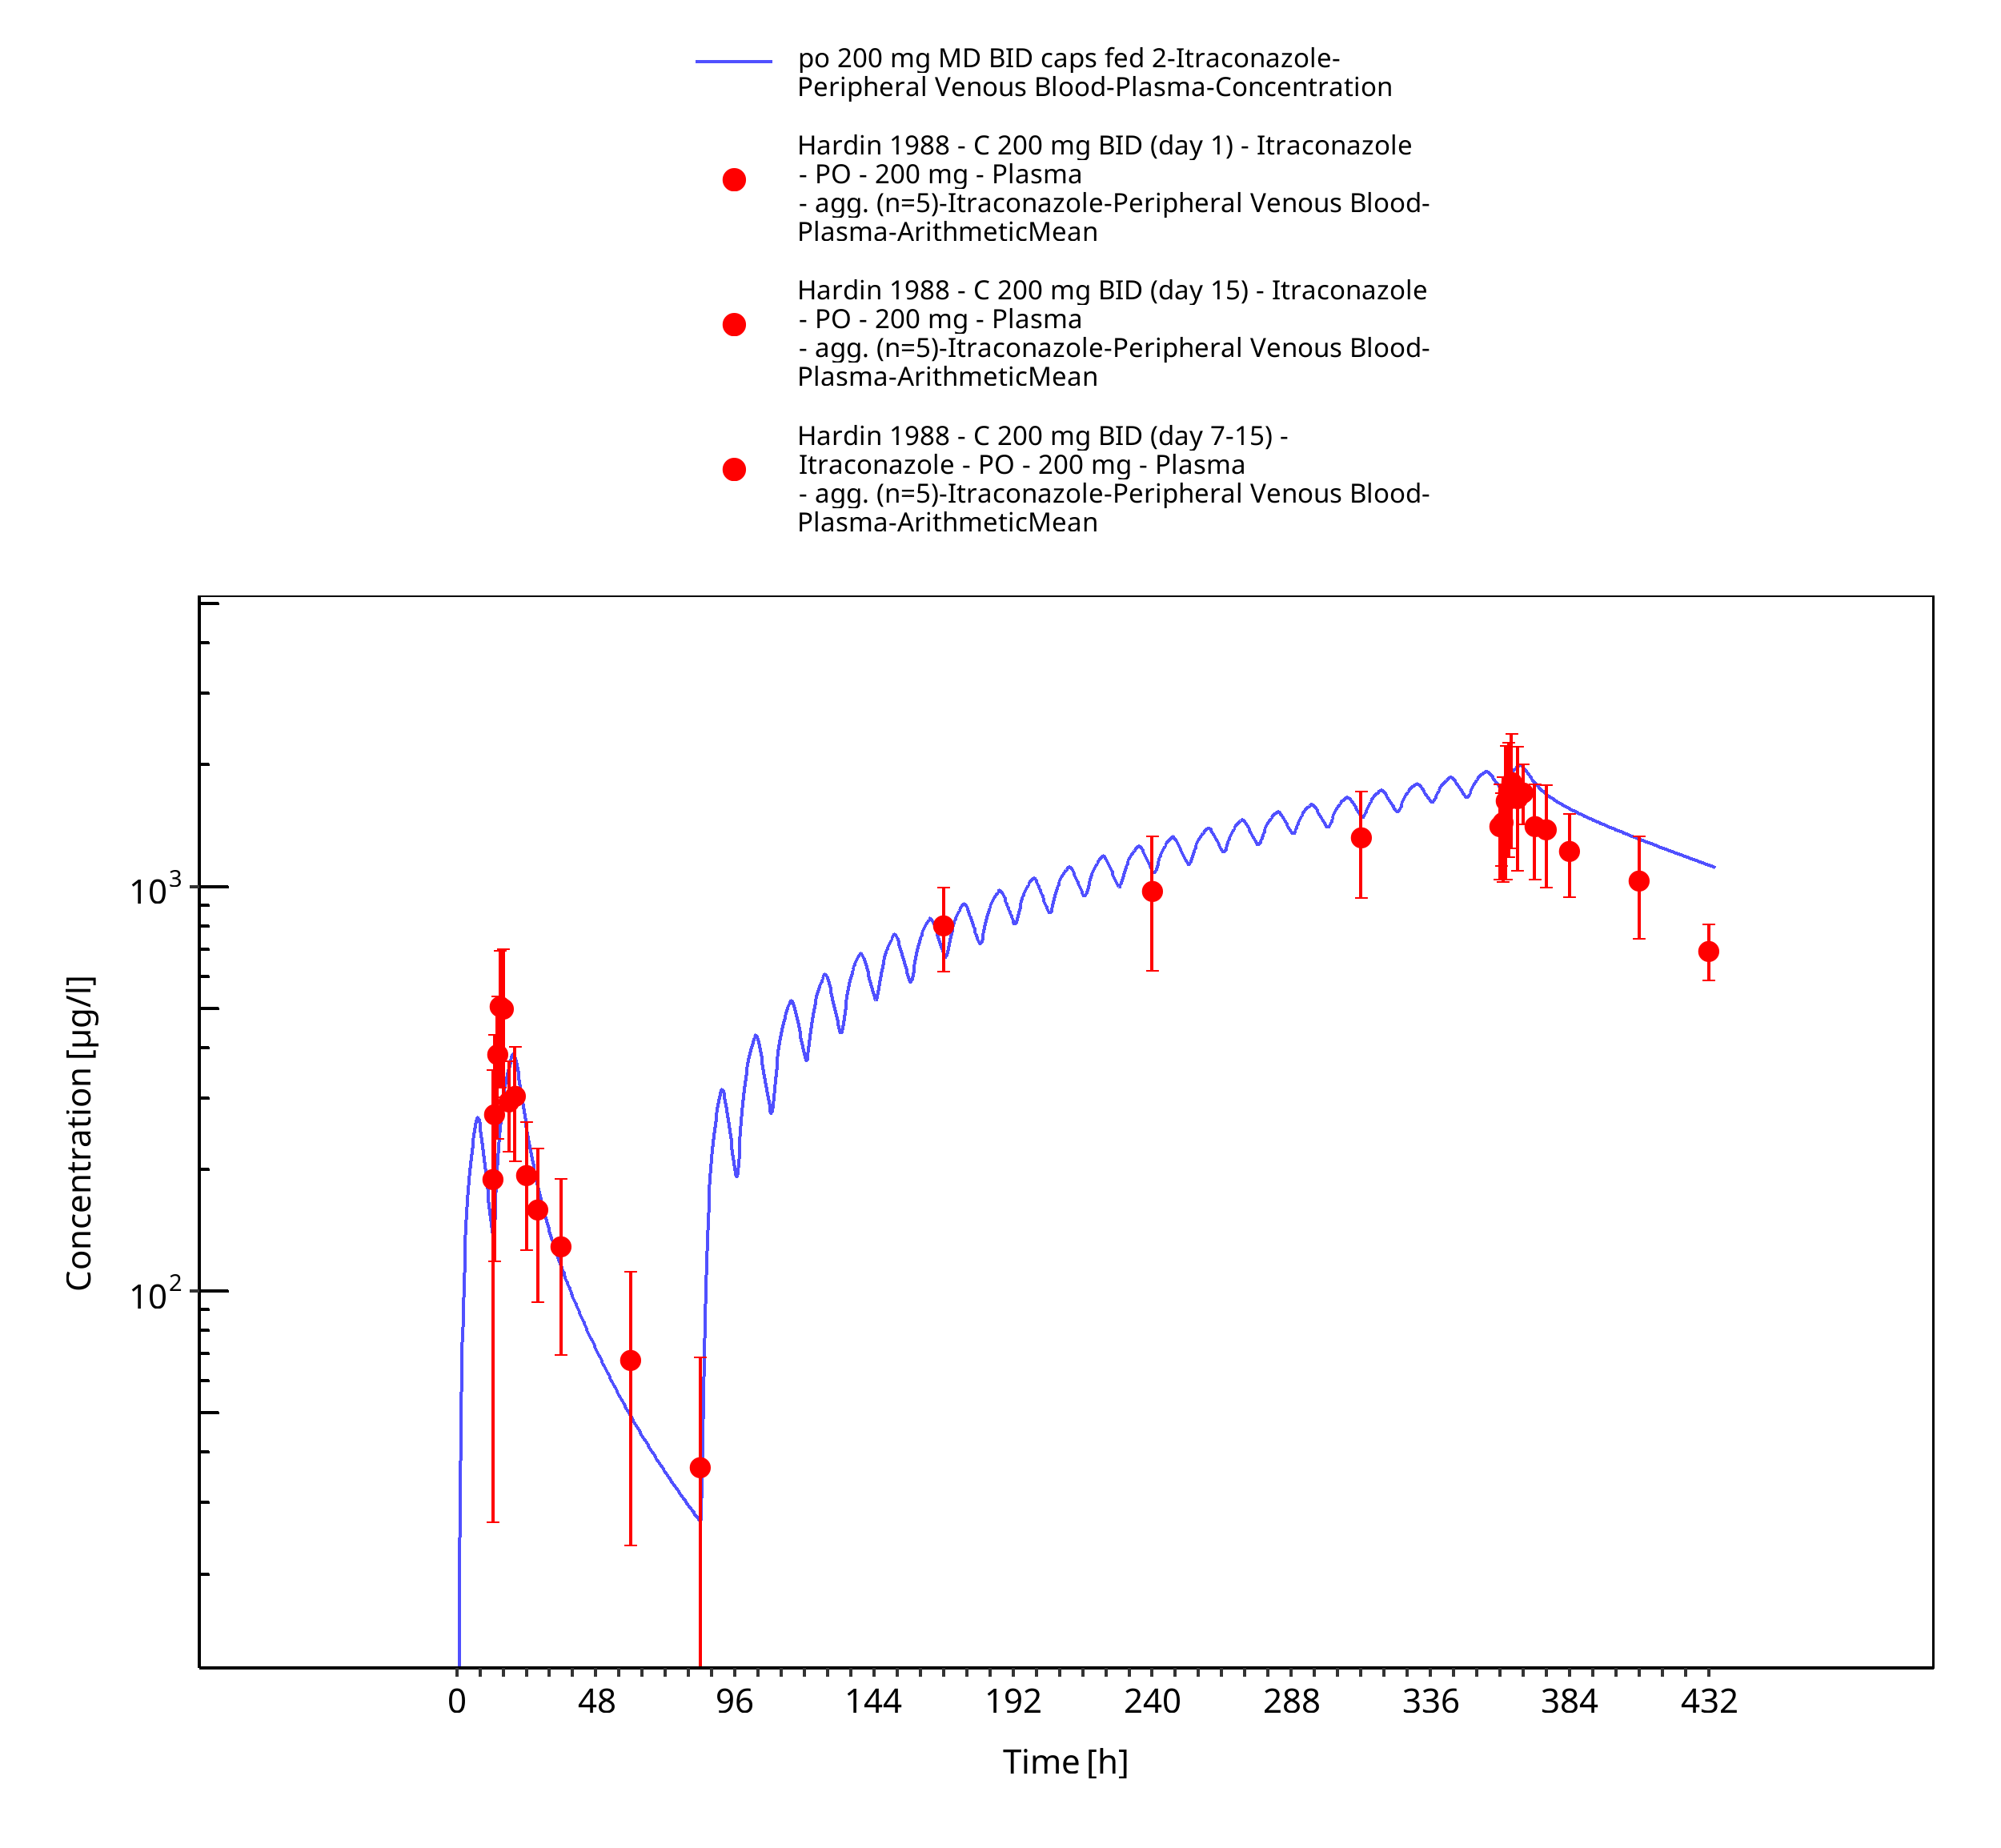
Figure 3-19: po 200 mg MD BID caps fed 2 - Plasma
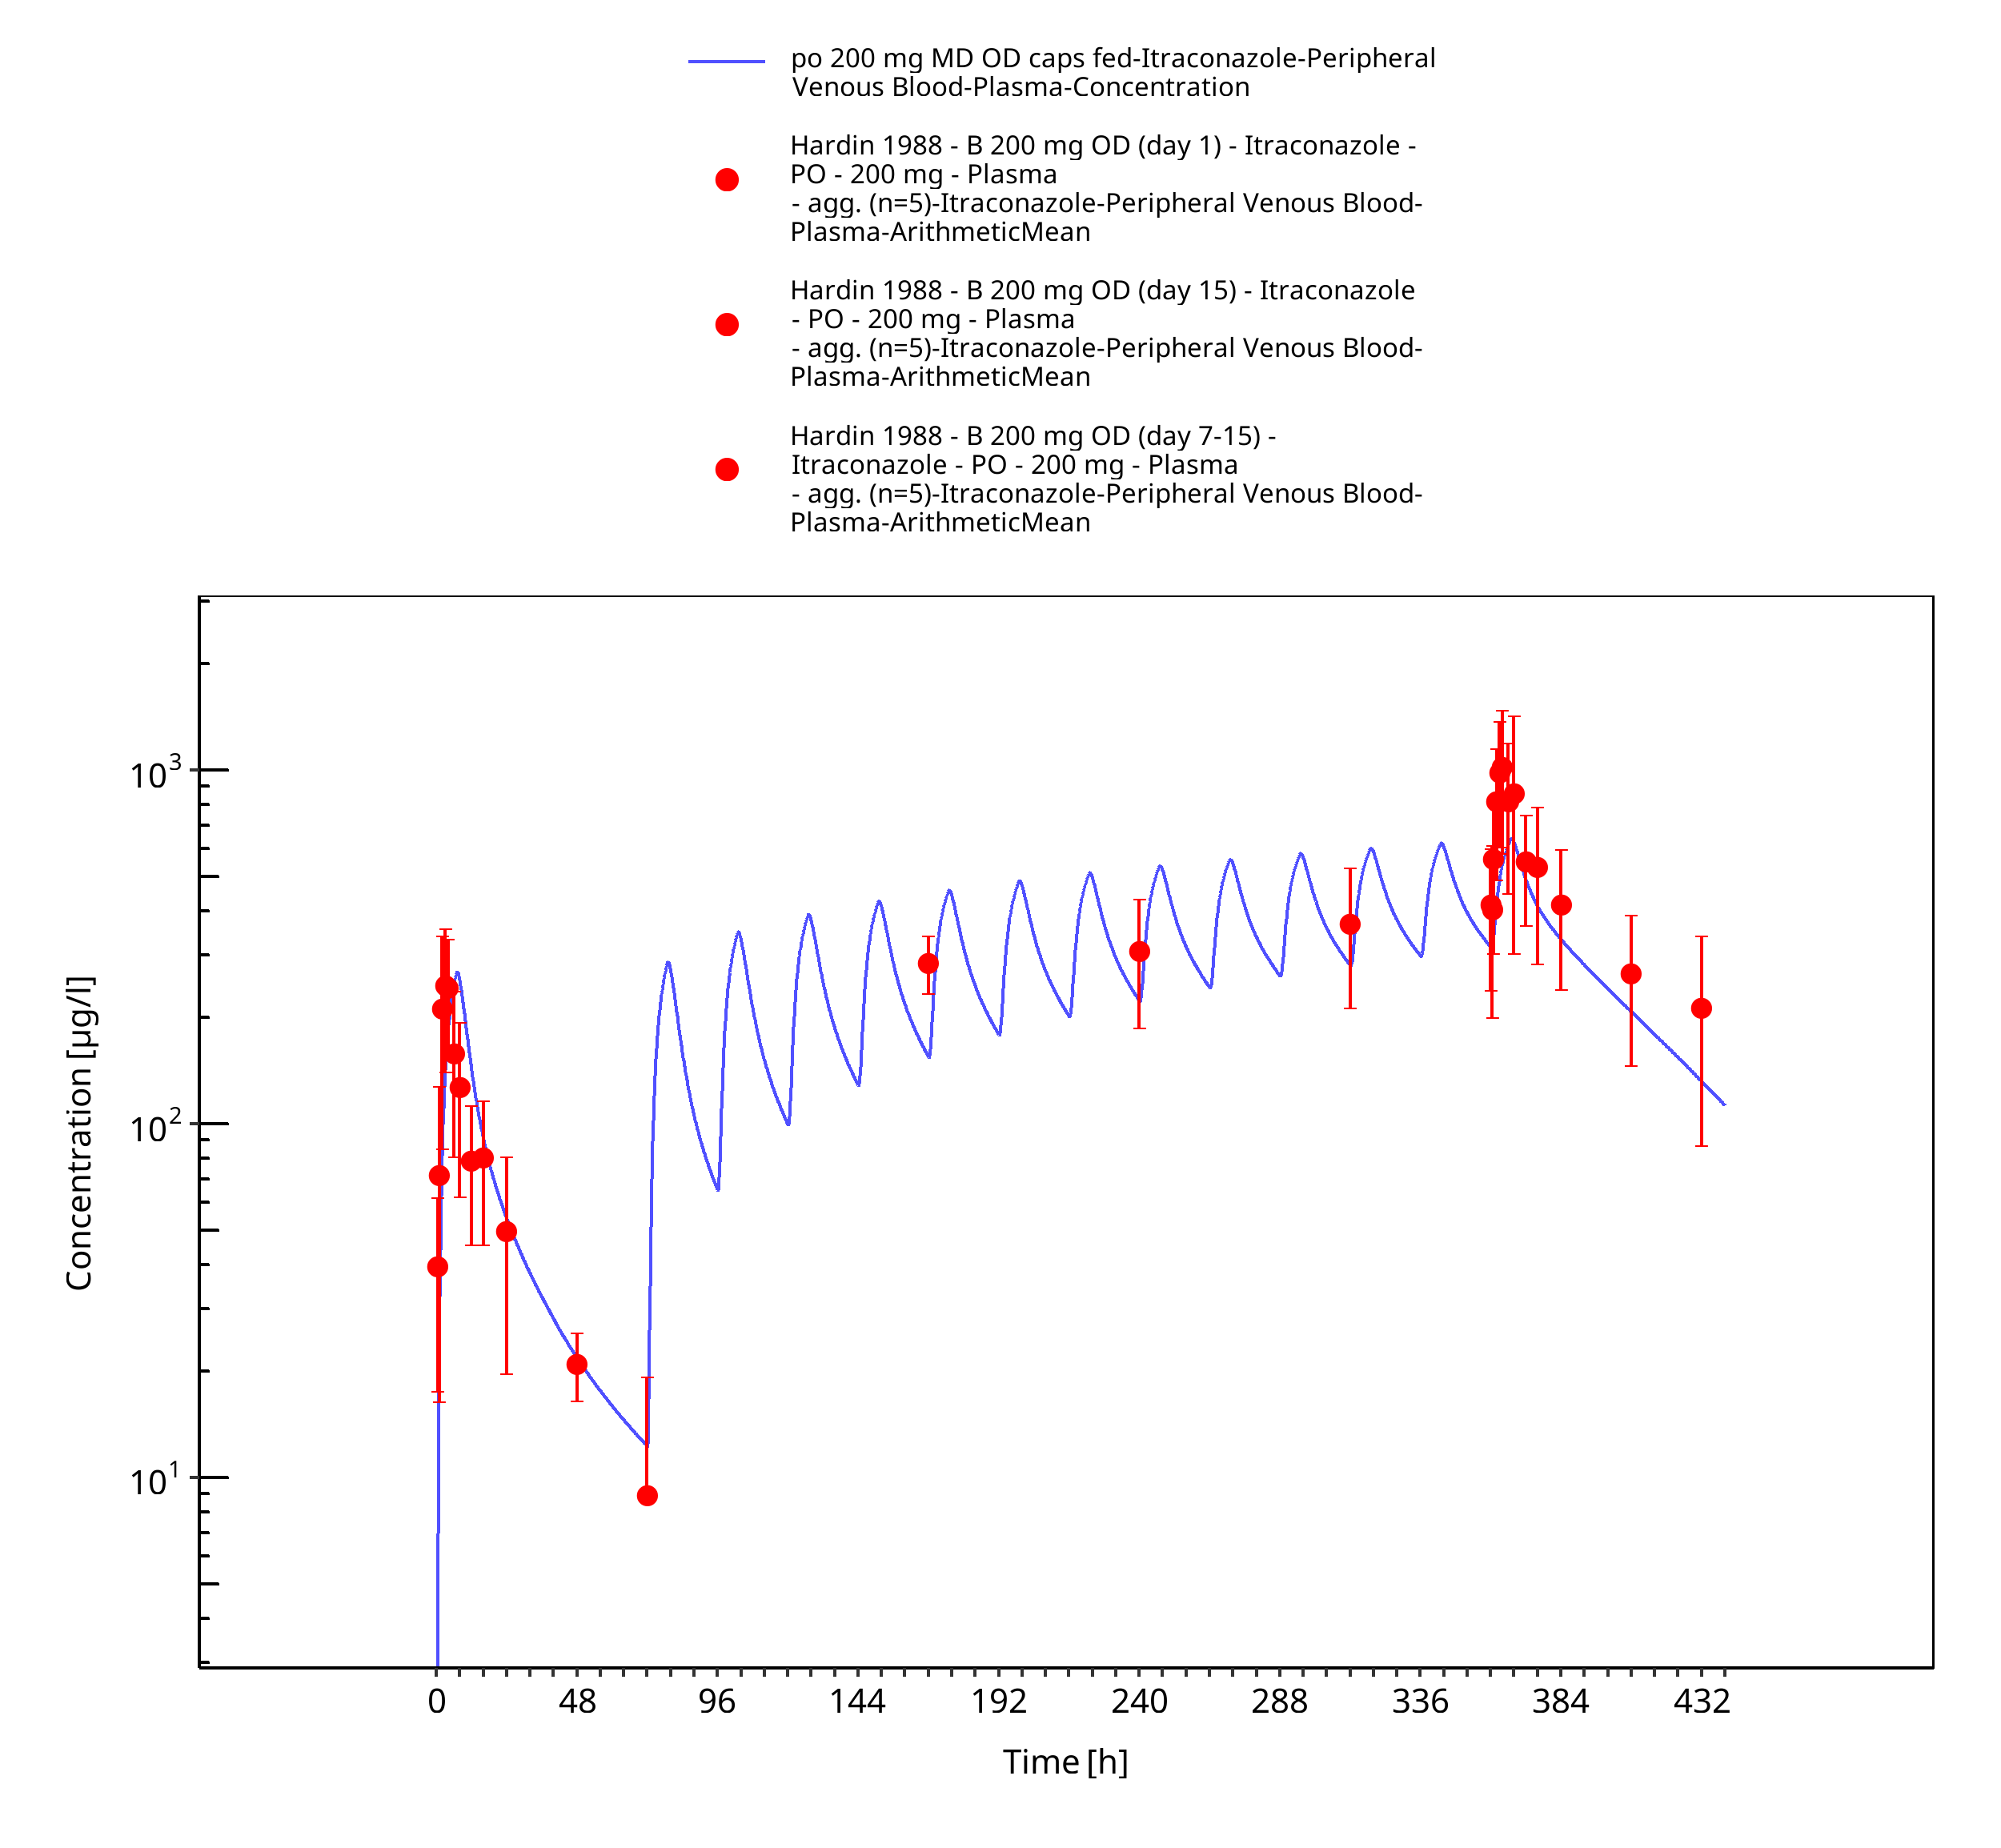
Figure 3-20: po 200 mg MD OD caps fed - Plasma
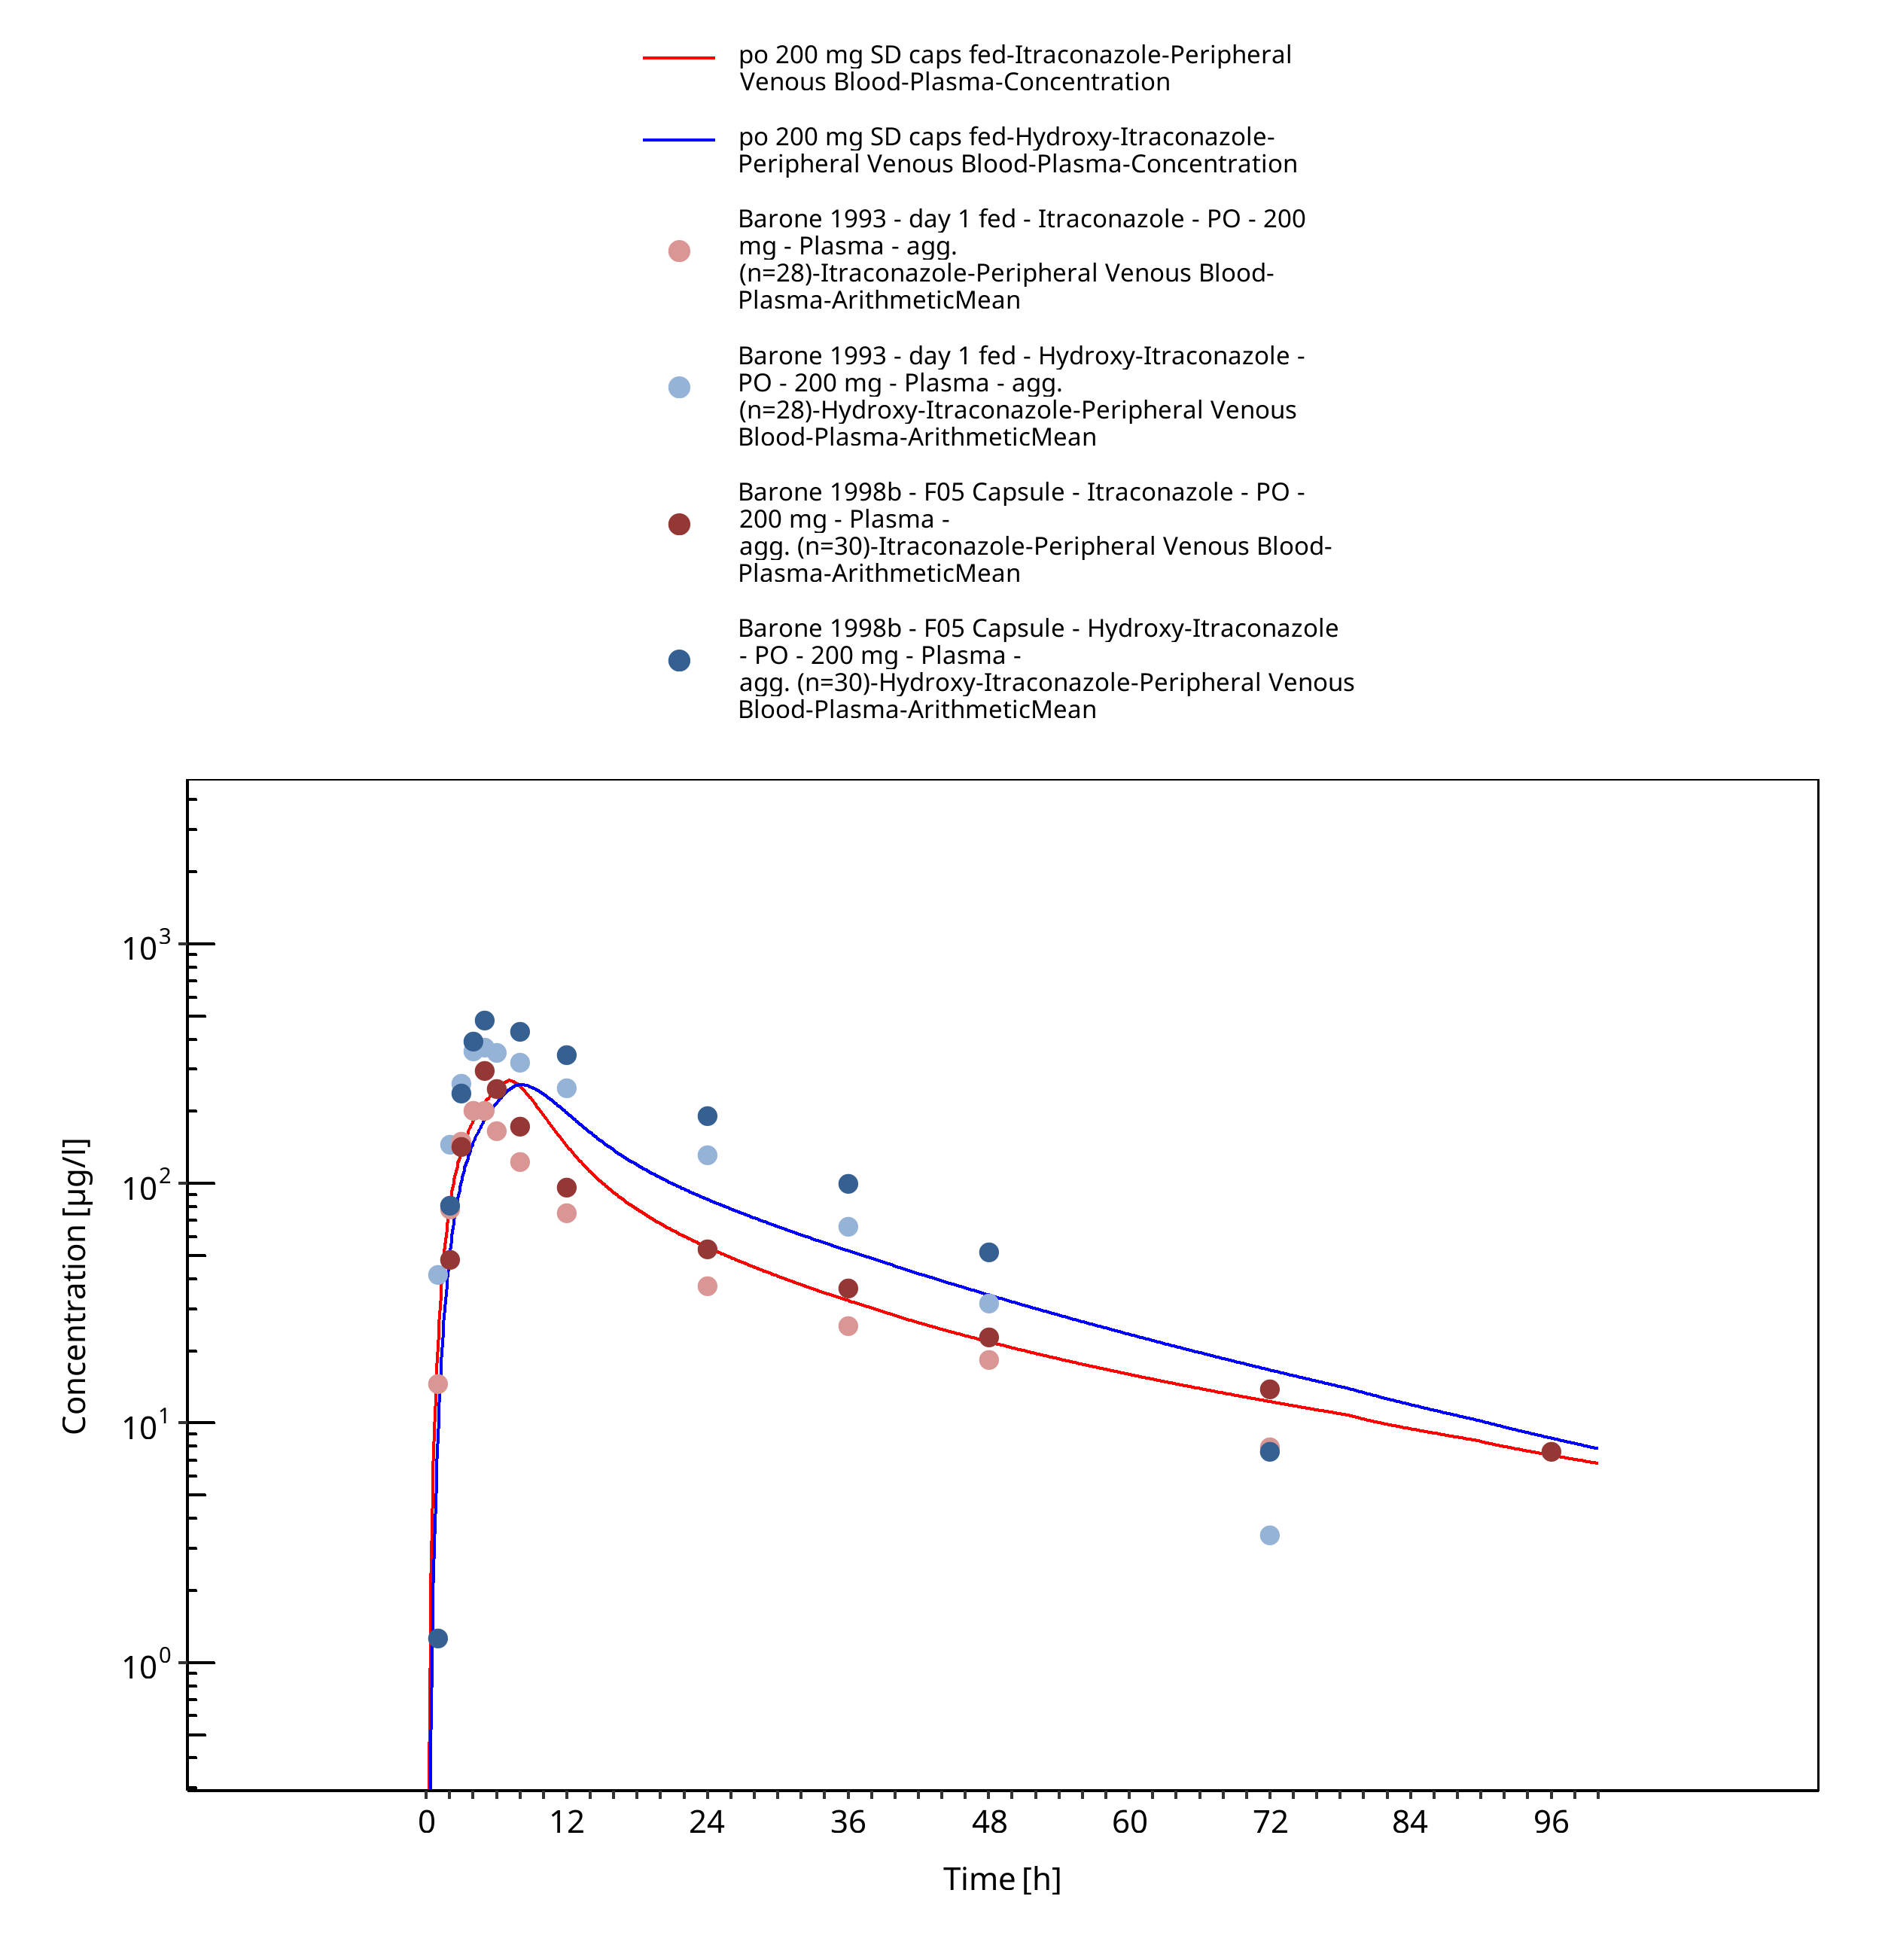
Figure 3-21: po 200 mg SD caps fed - Plasma
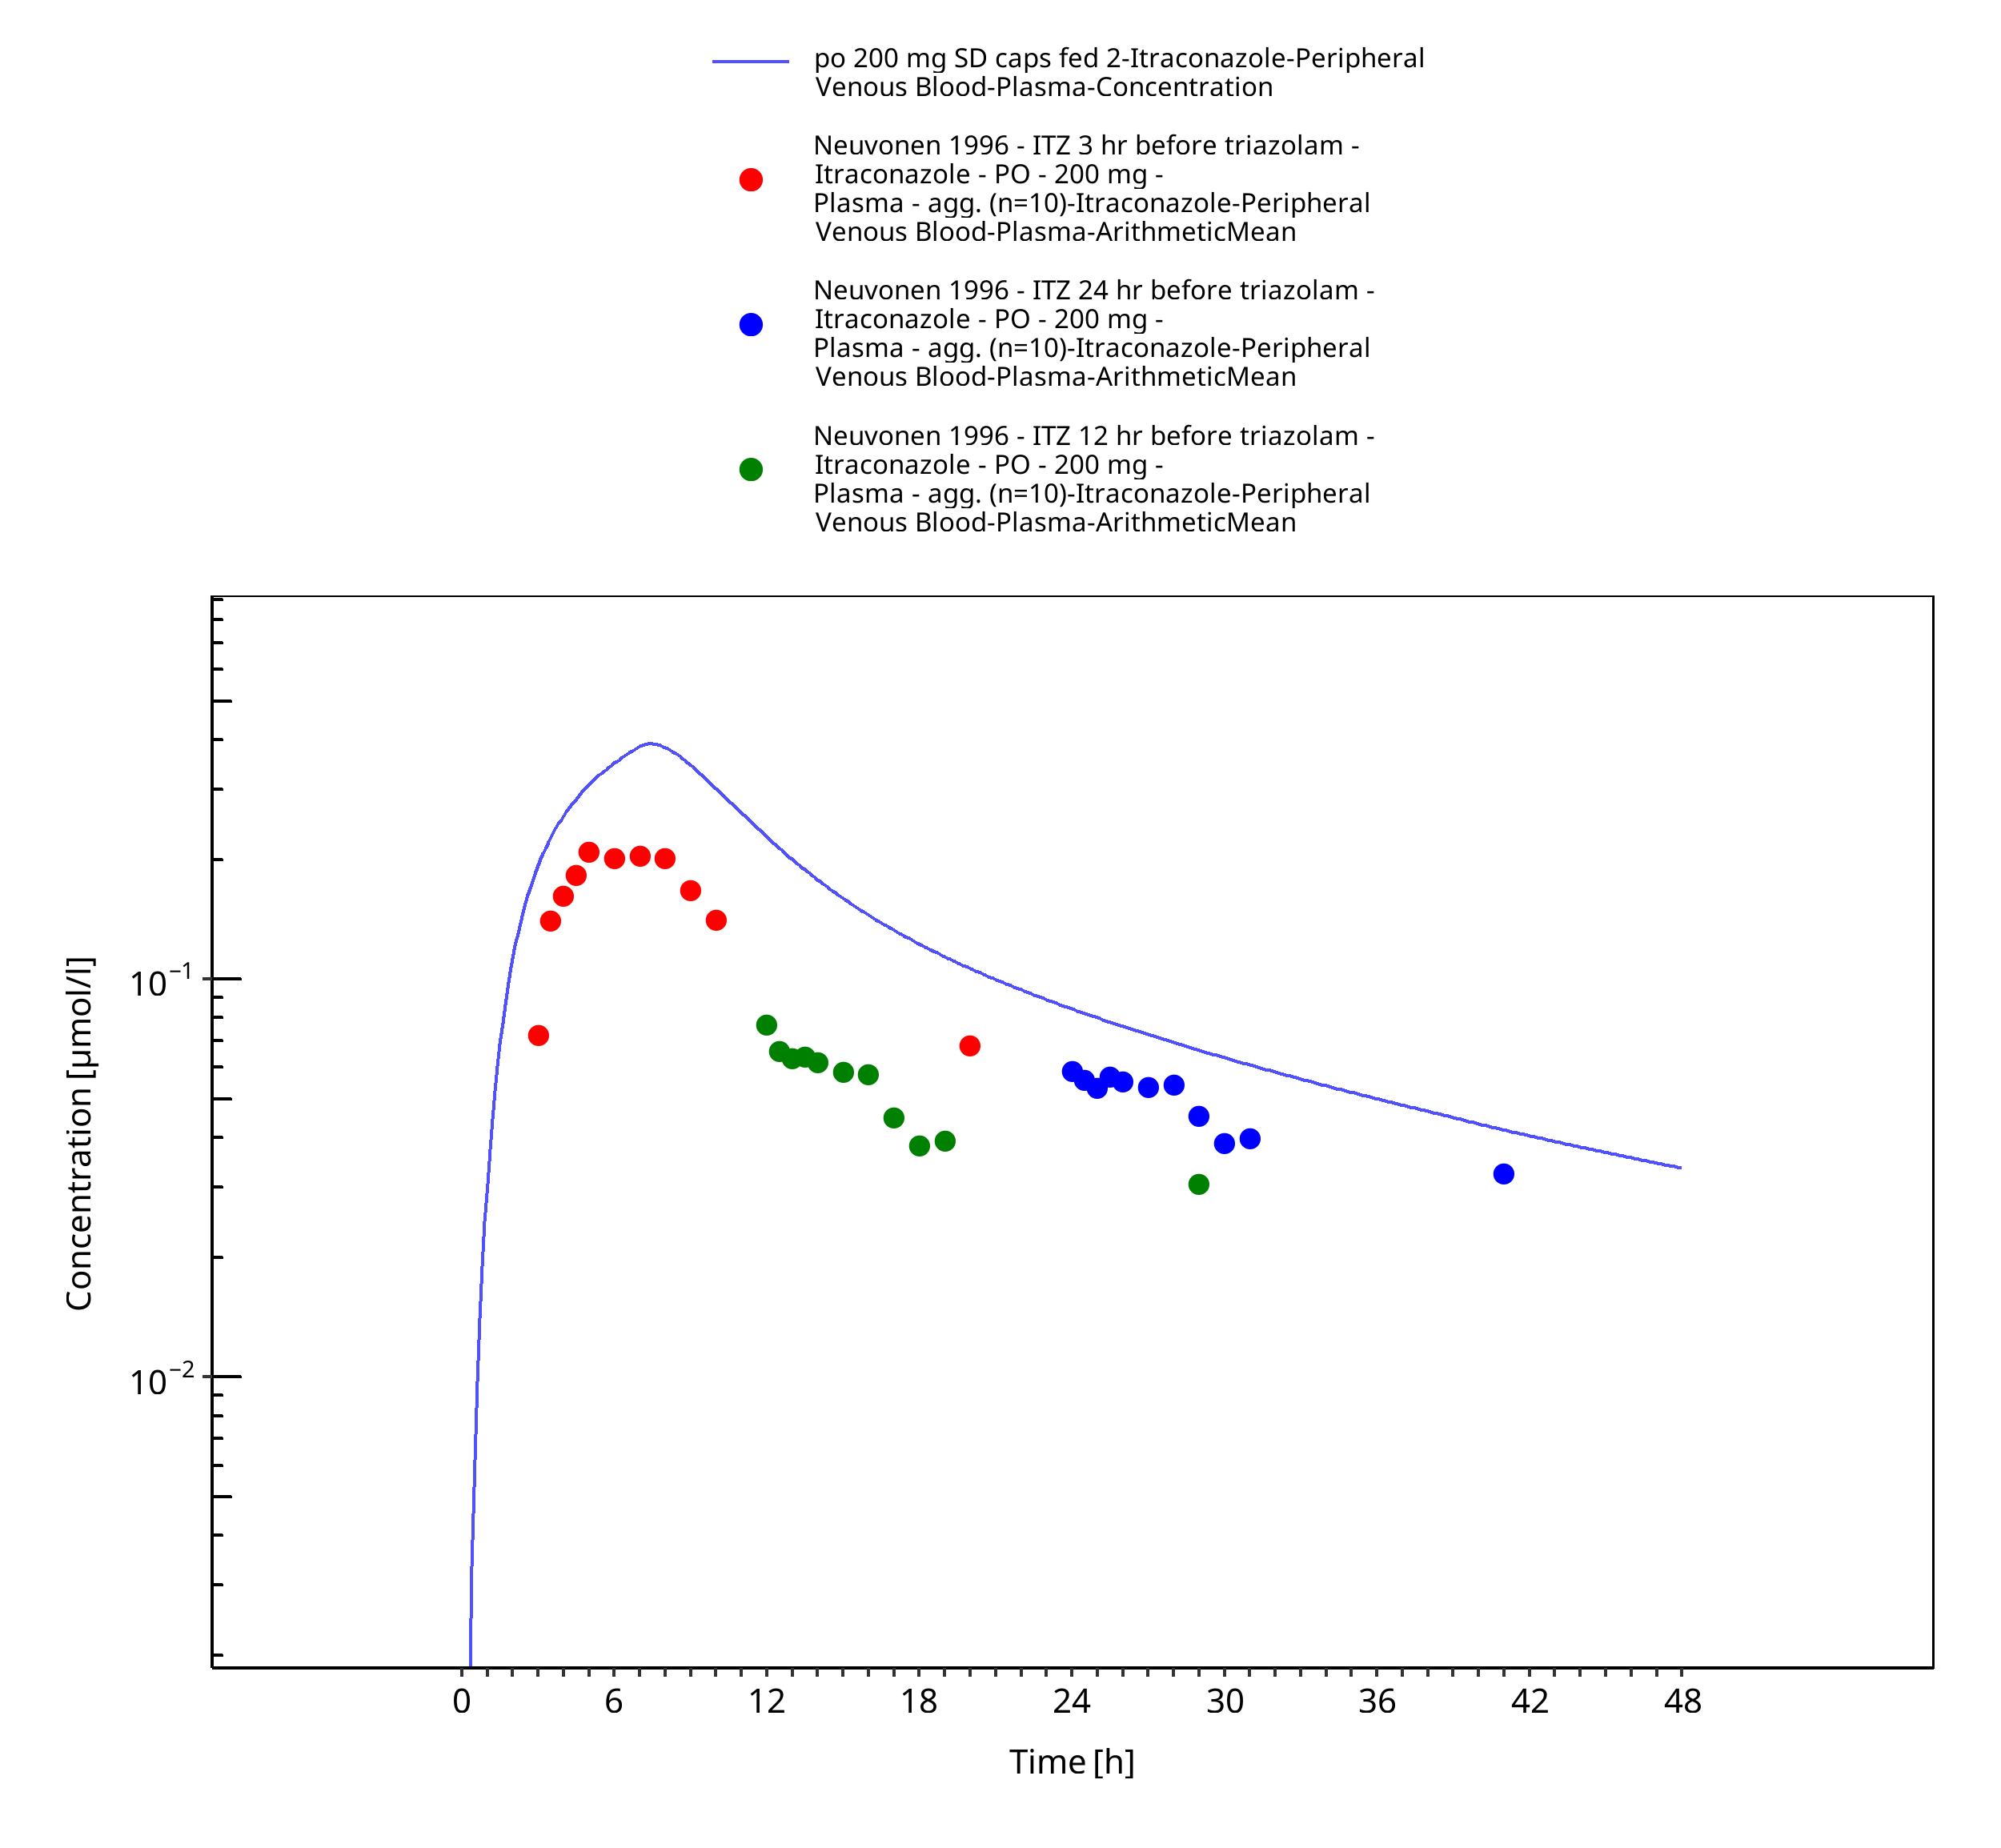
Figure 3-22: po 200 mg SD caps fed 2 - Plasma
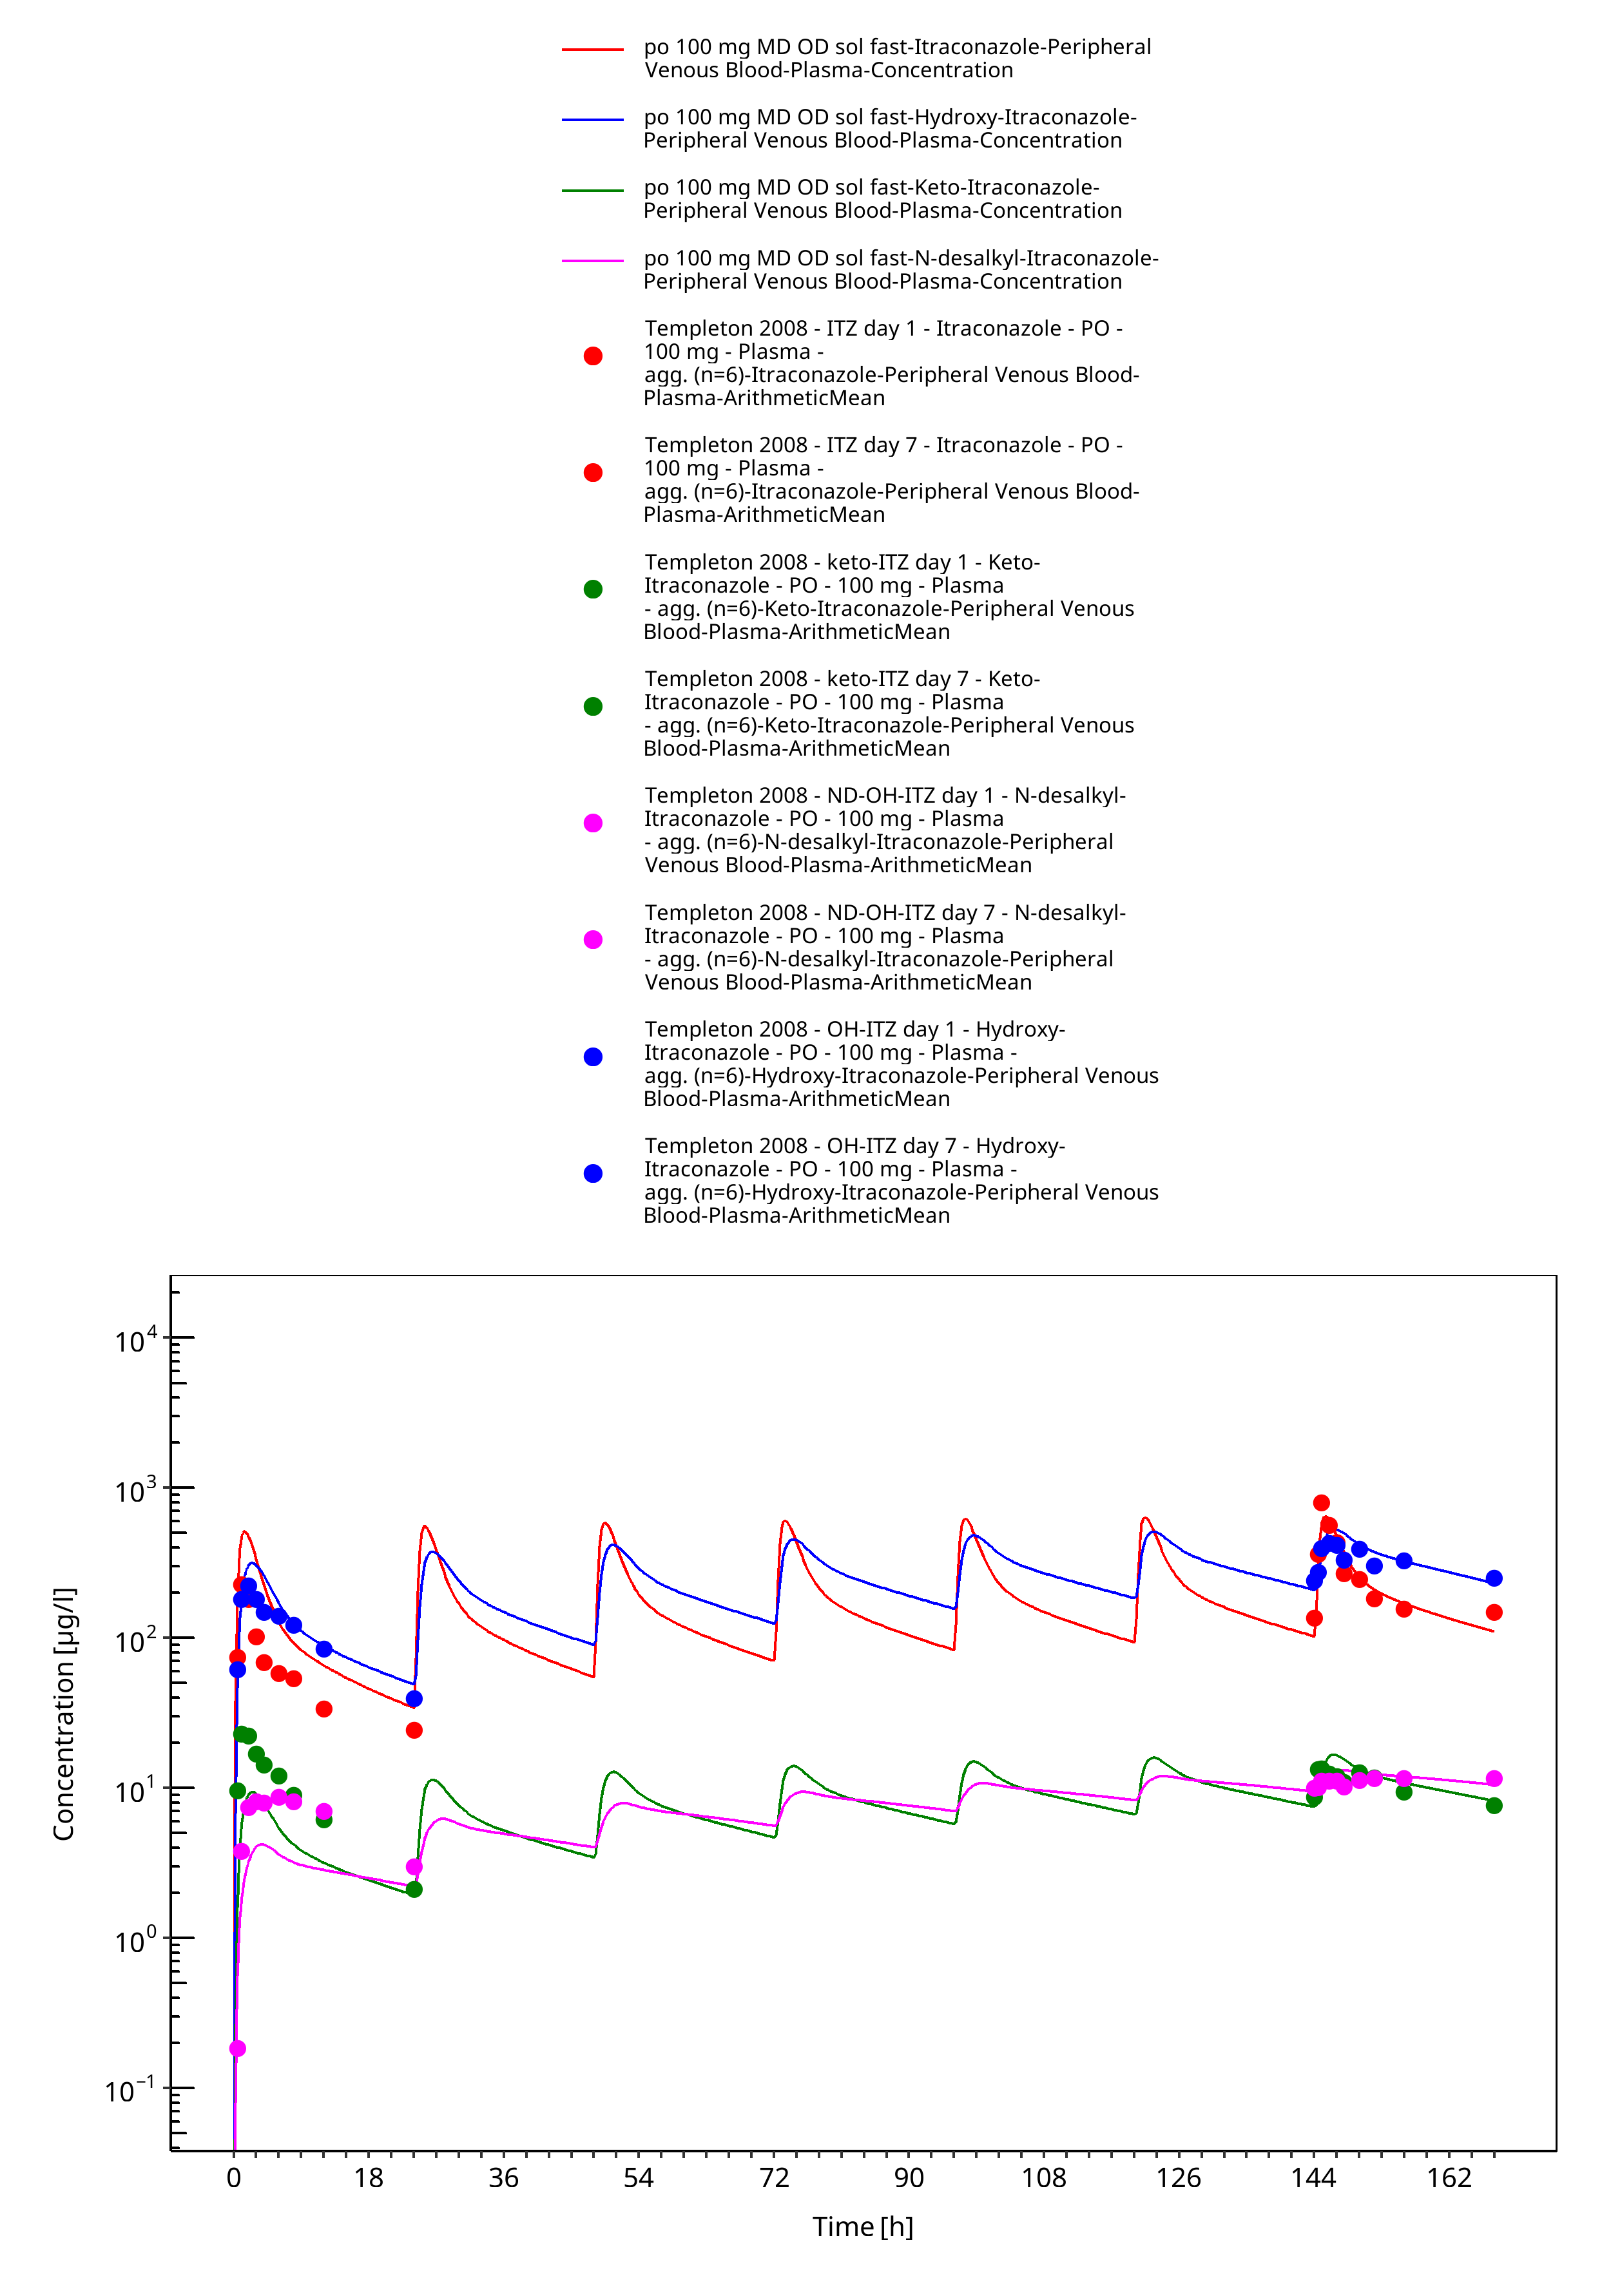
Figure 3-23: po 100 mg MD OD sol fast - Plasma
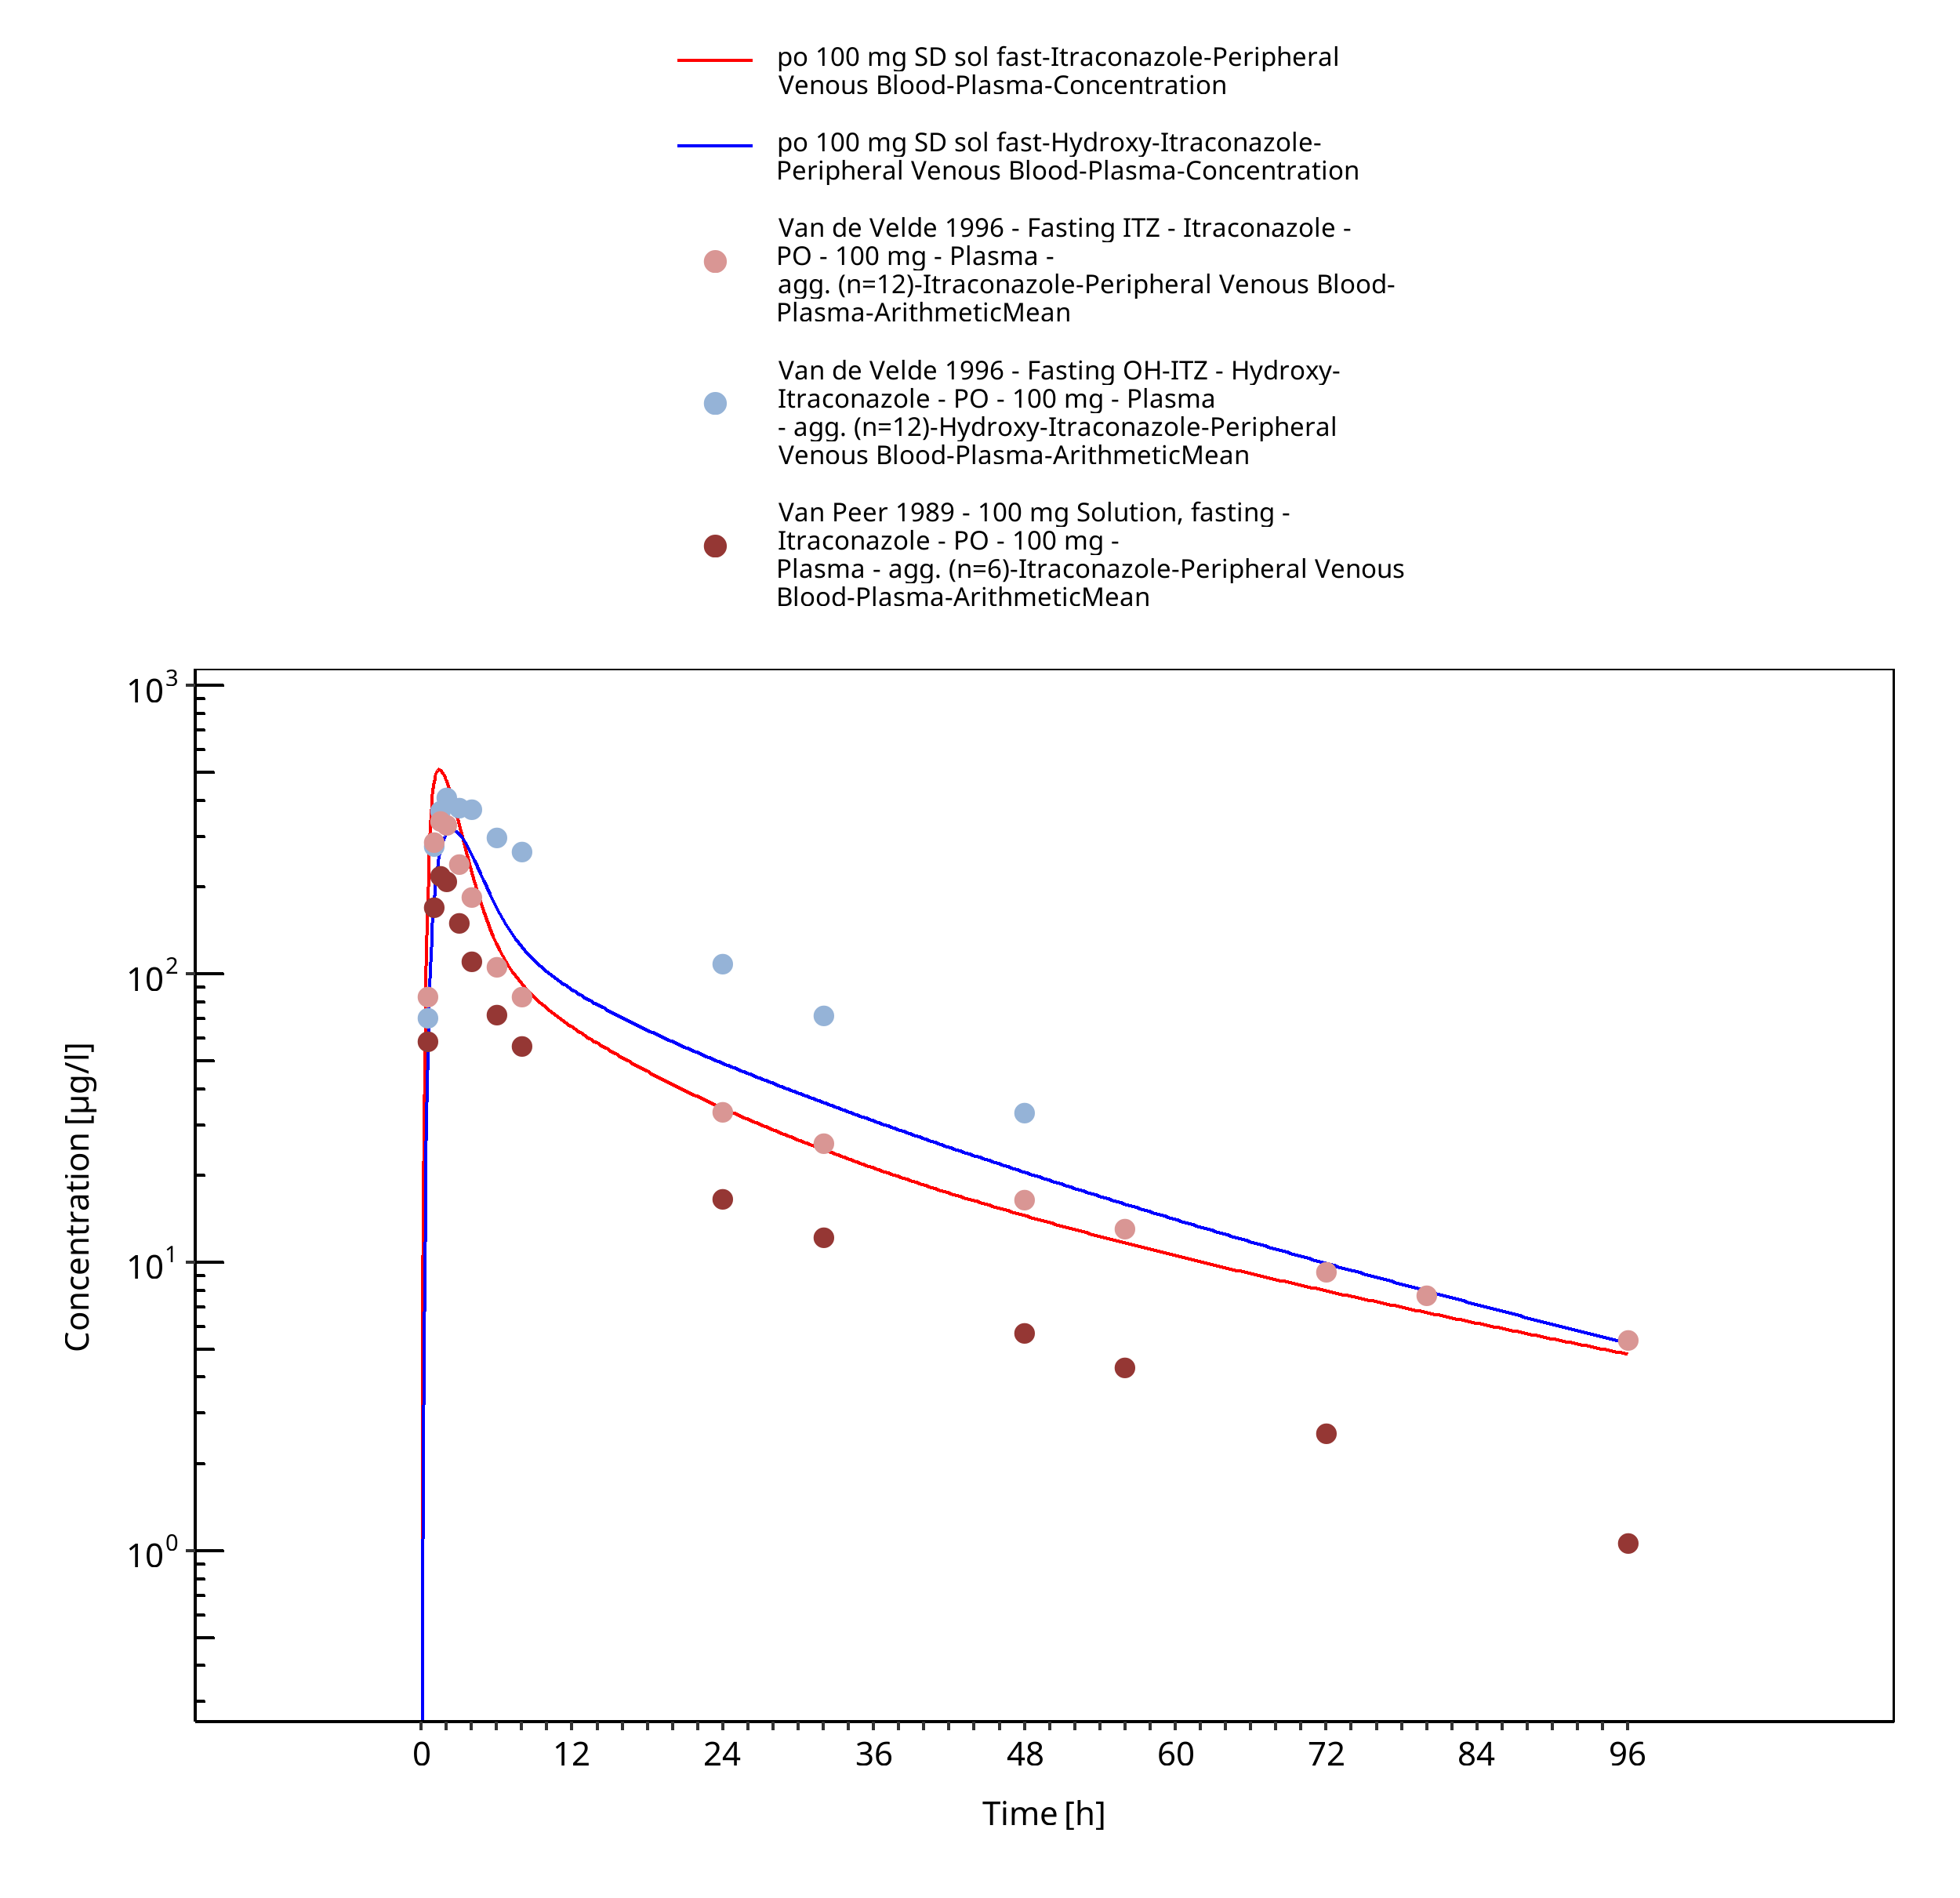
Figure 3-24: po 100 mg SD sol fast - Plasma
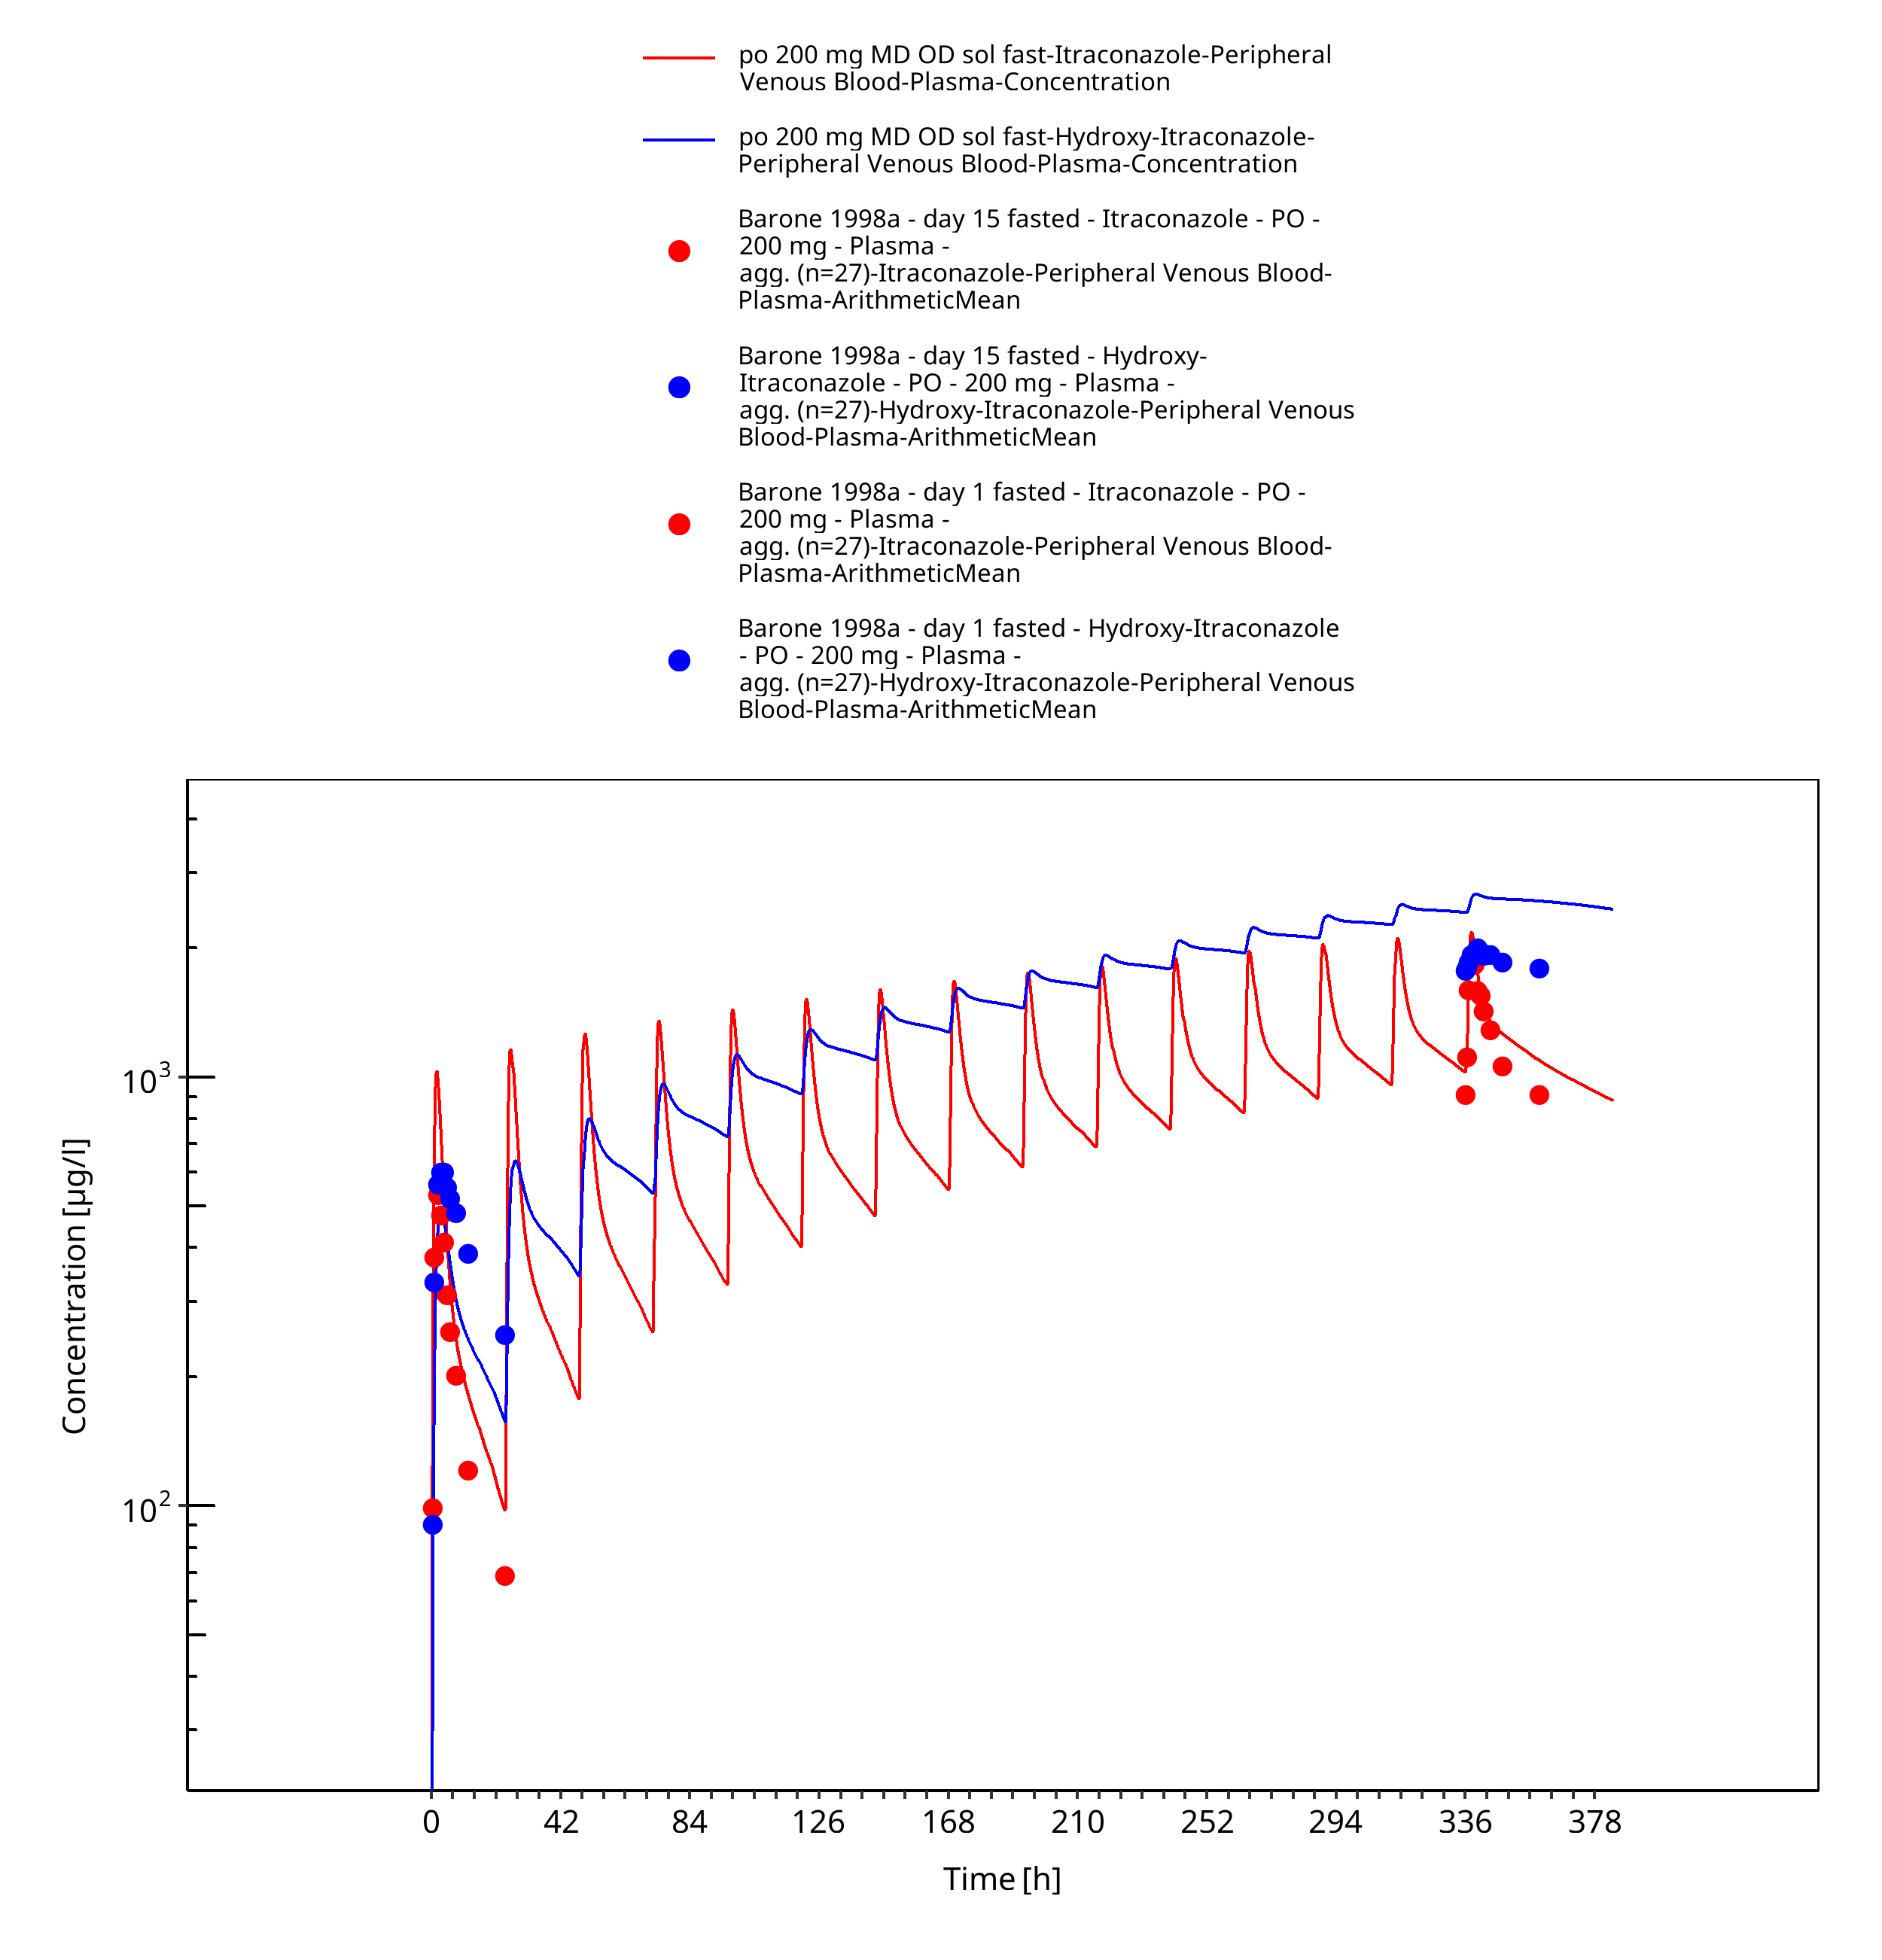
Figure 3-25: po 200 mg MD OD sol fast - Plasma
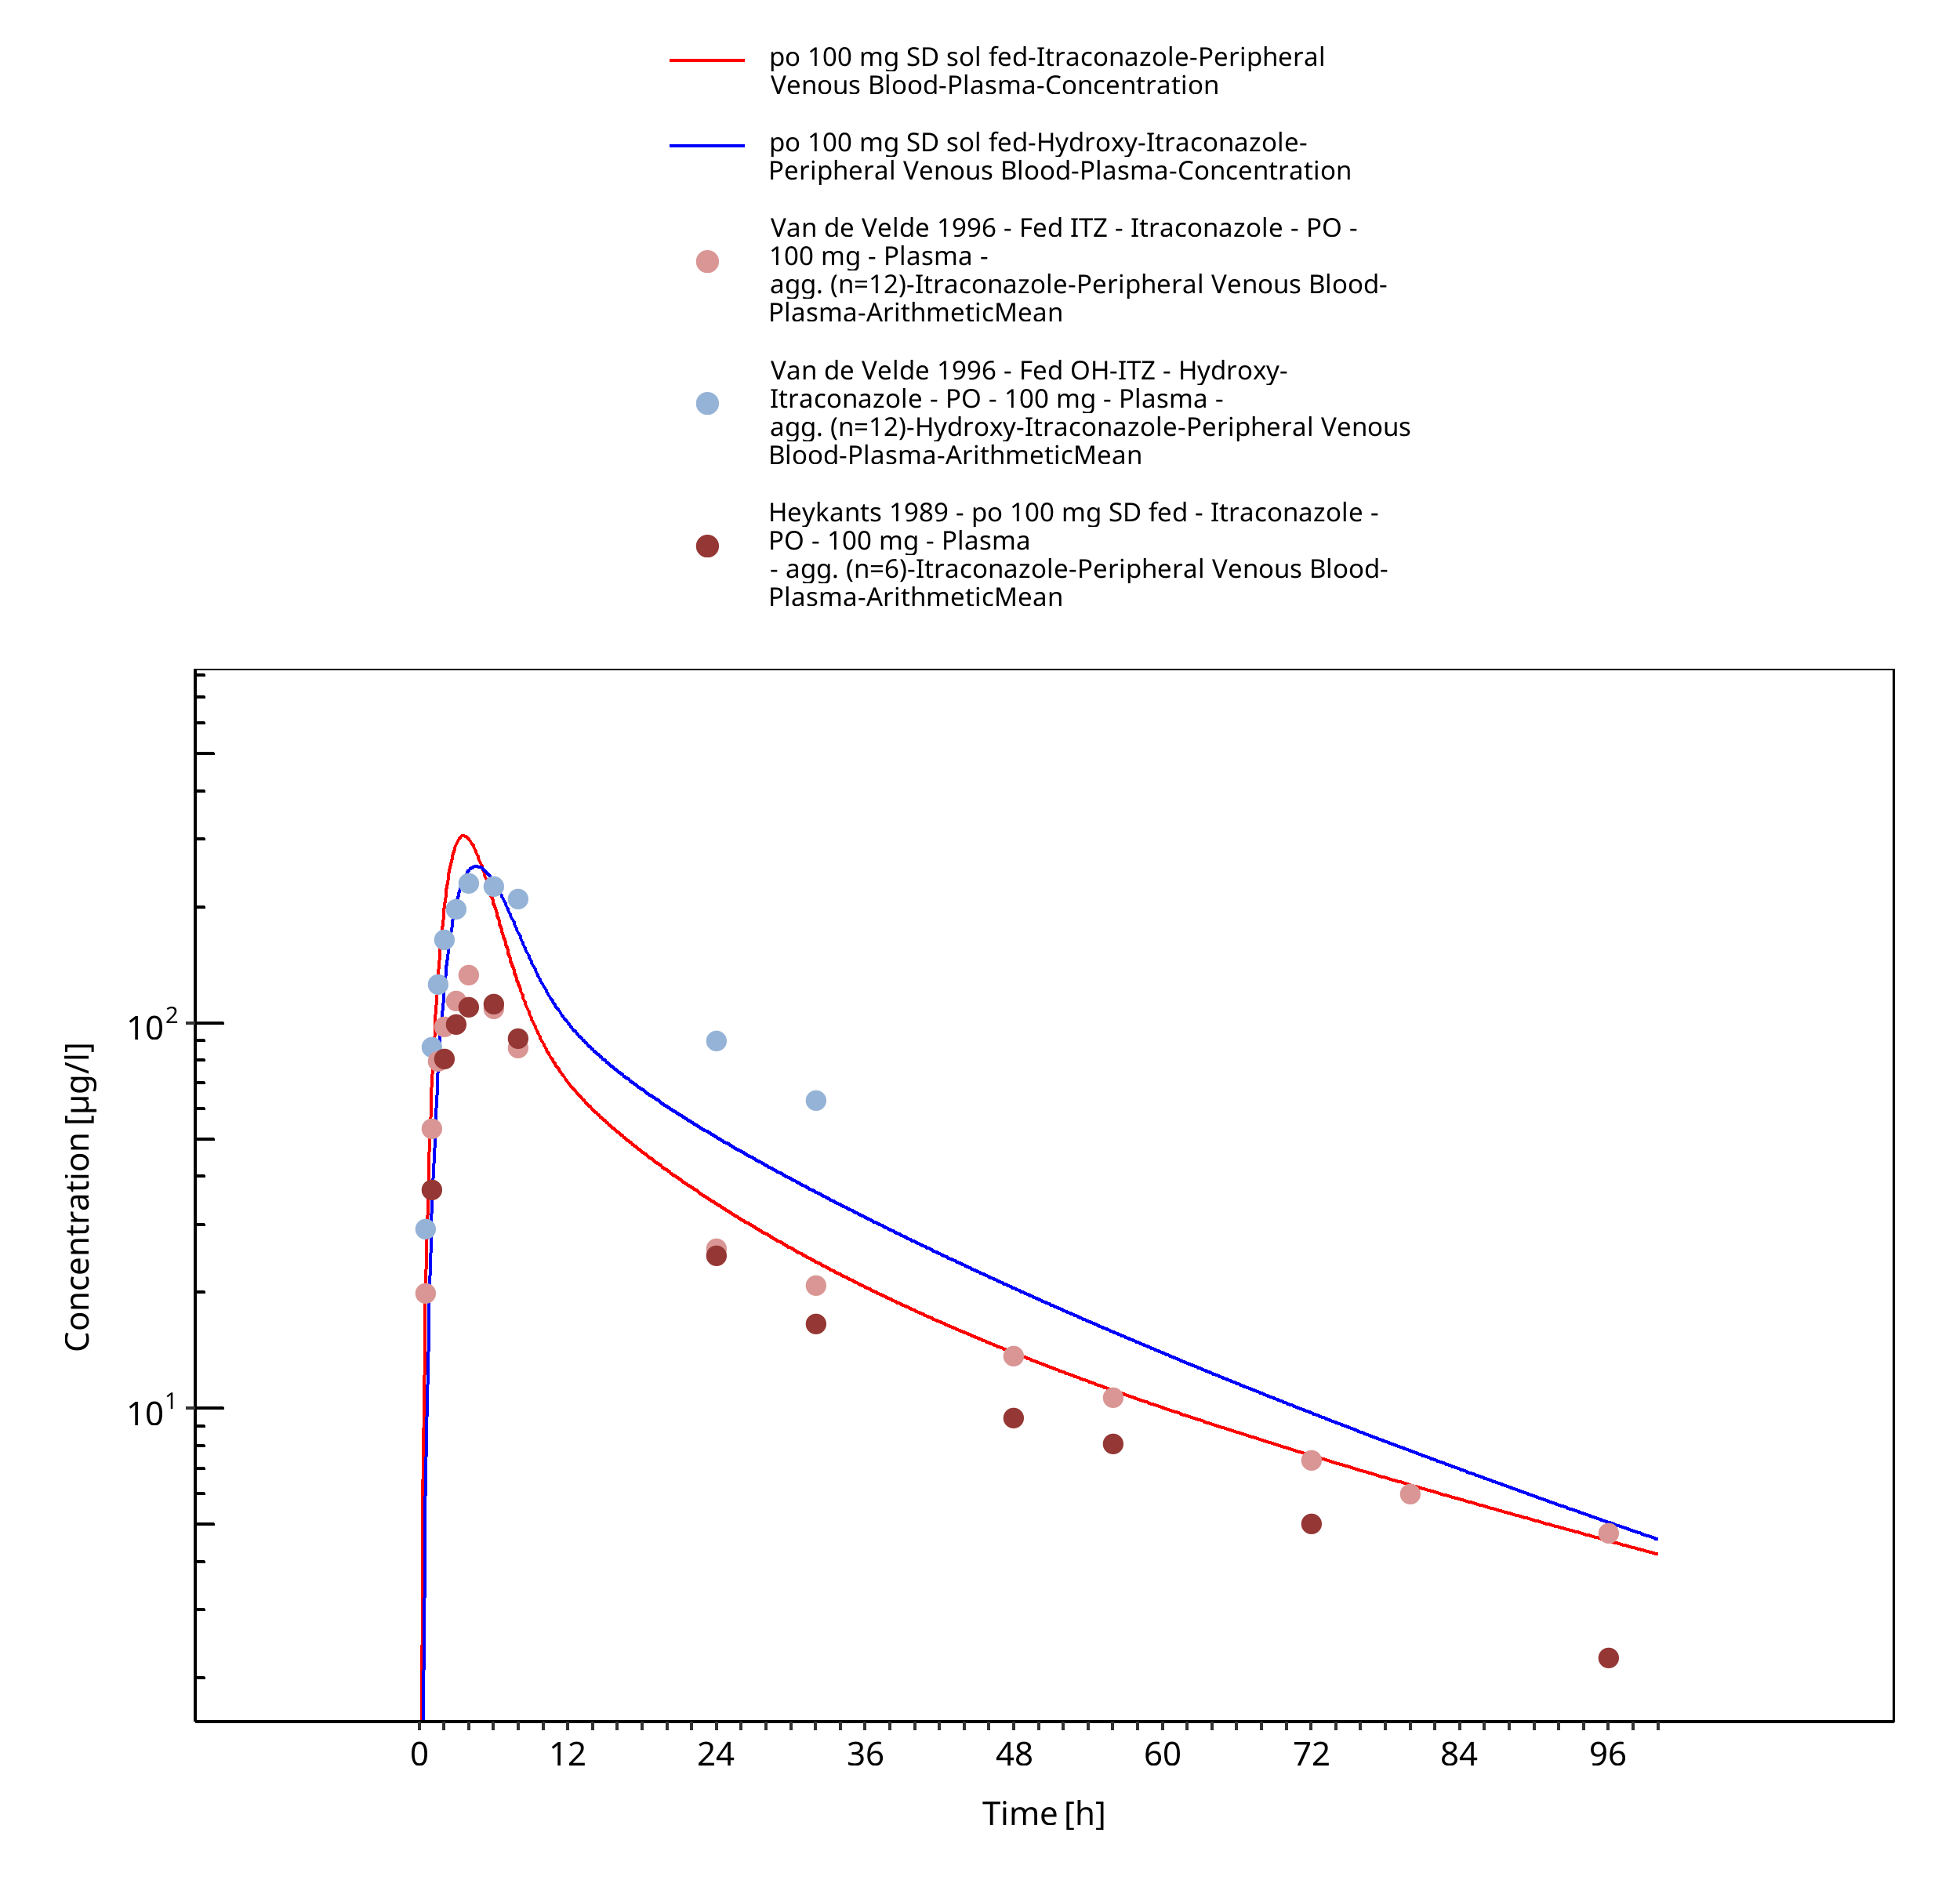
Figure 3-26: po 100 mg SD sol fed - Plasma
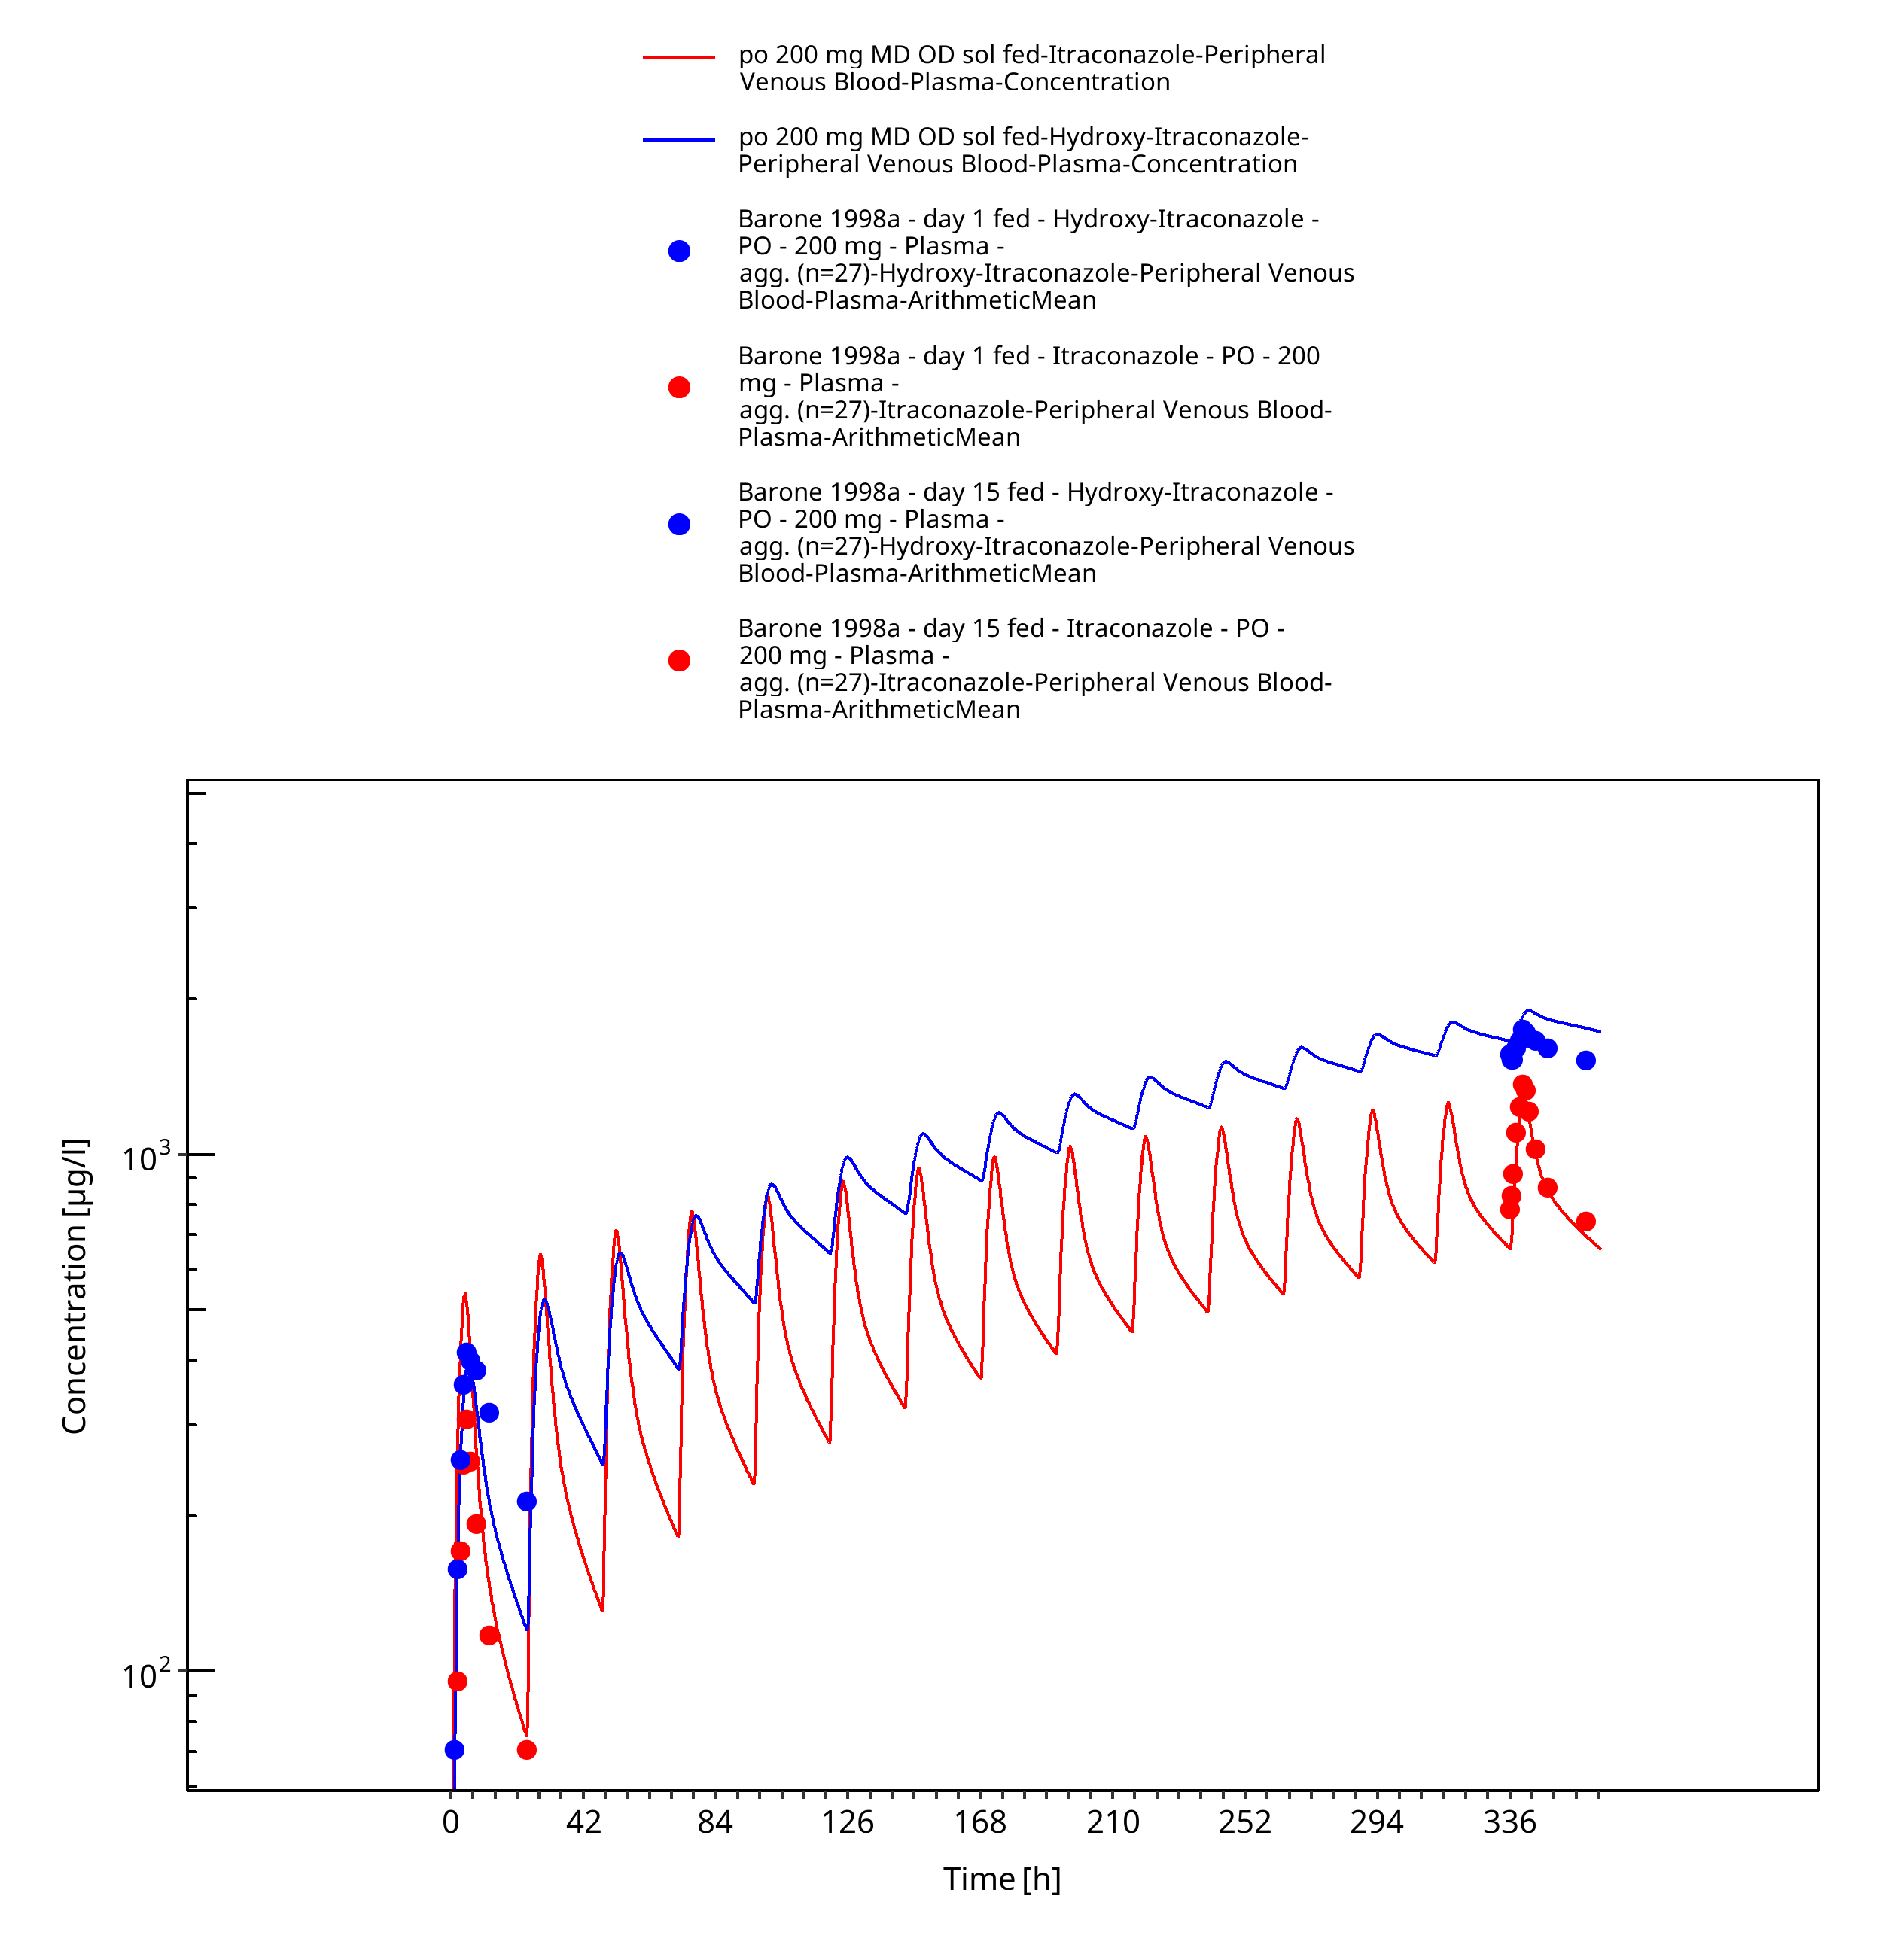
Figure 3-27: po 200 mg MD OD sol fed - Plasma
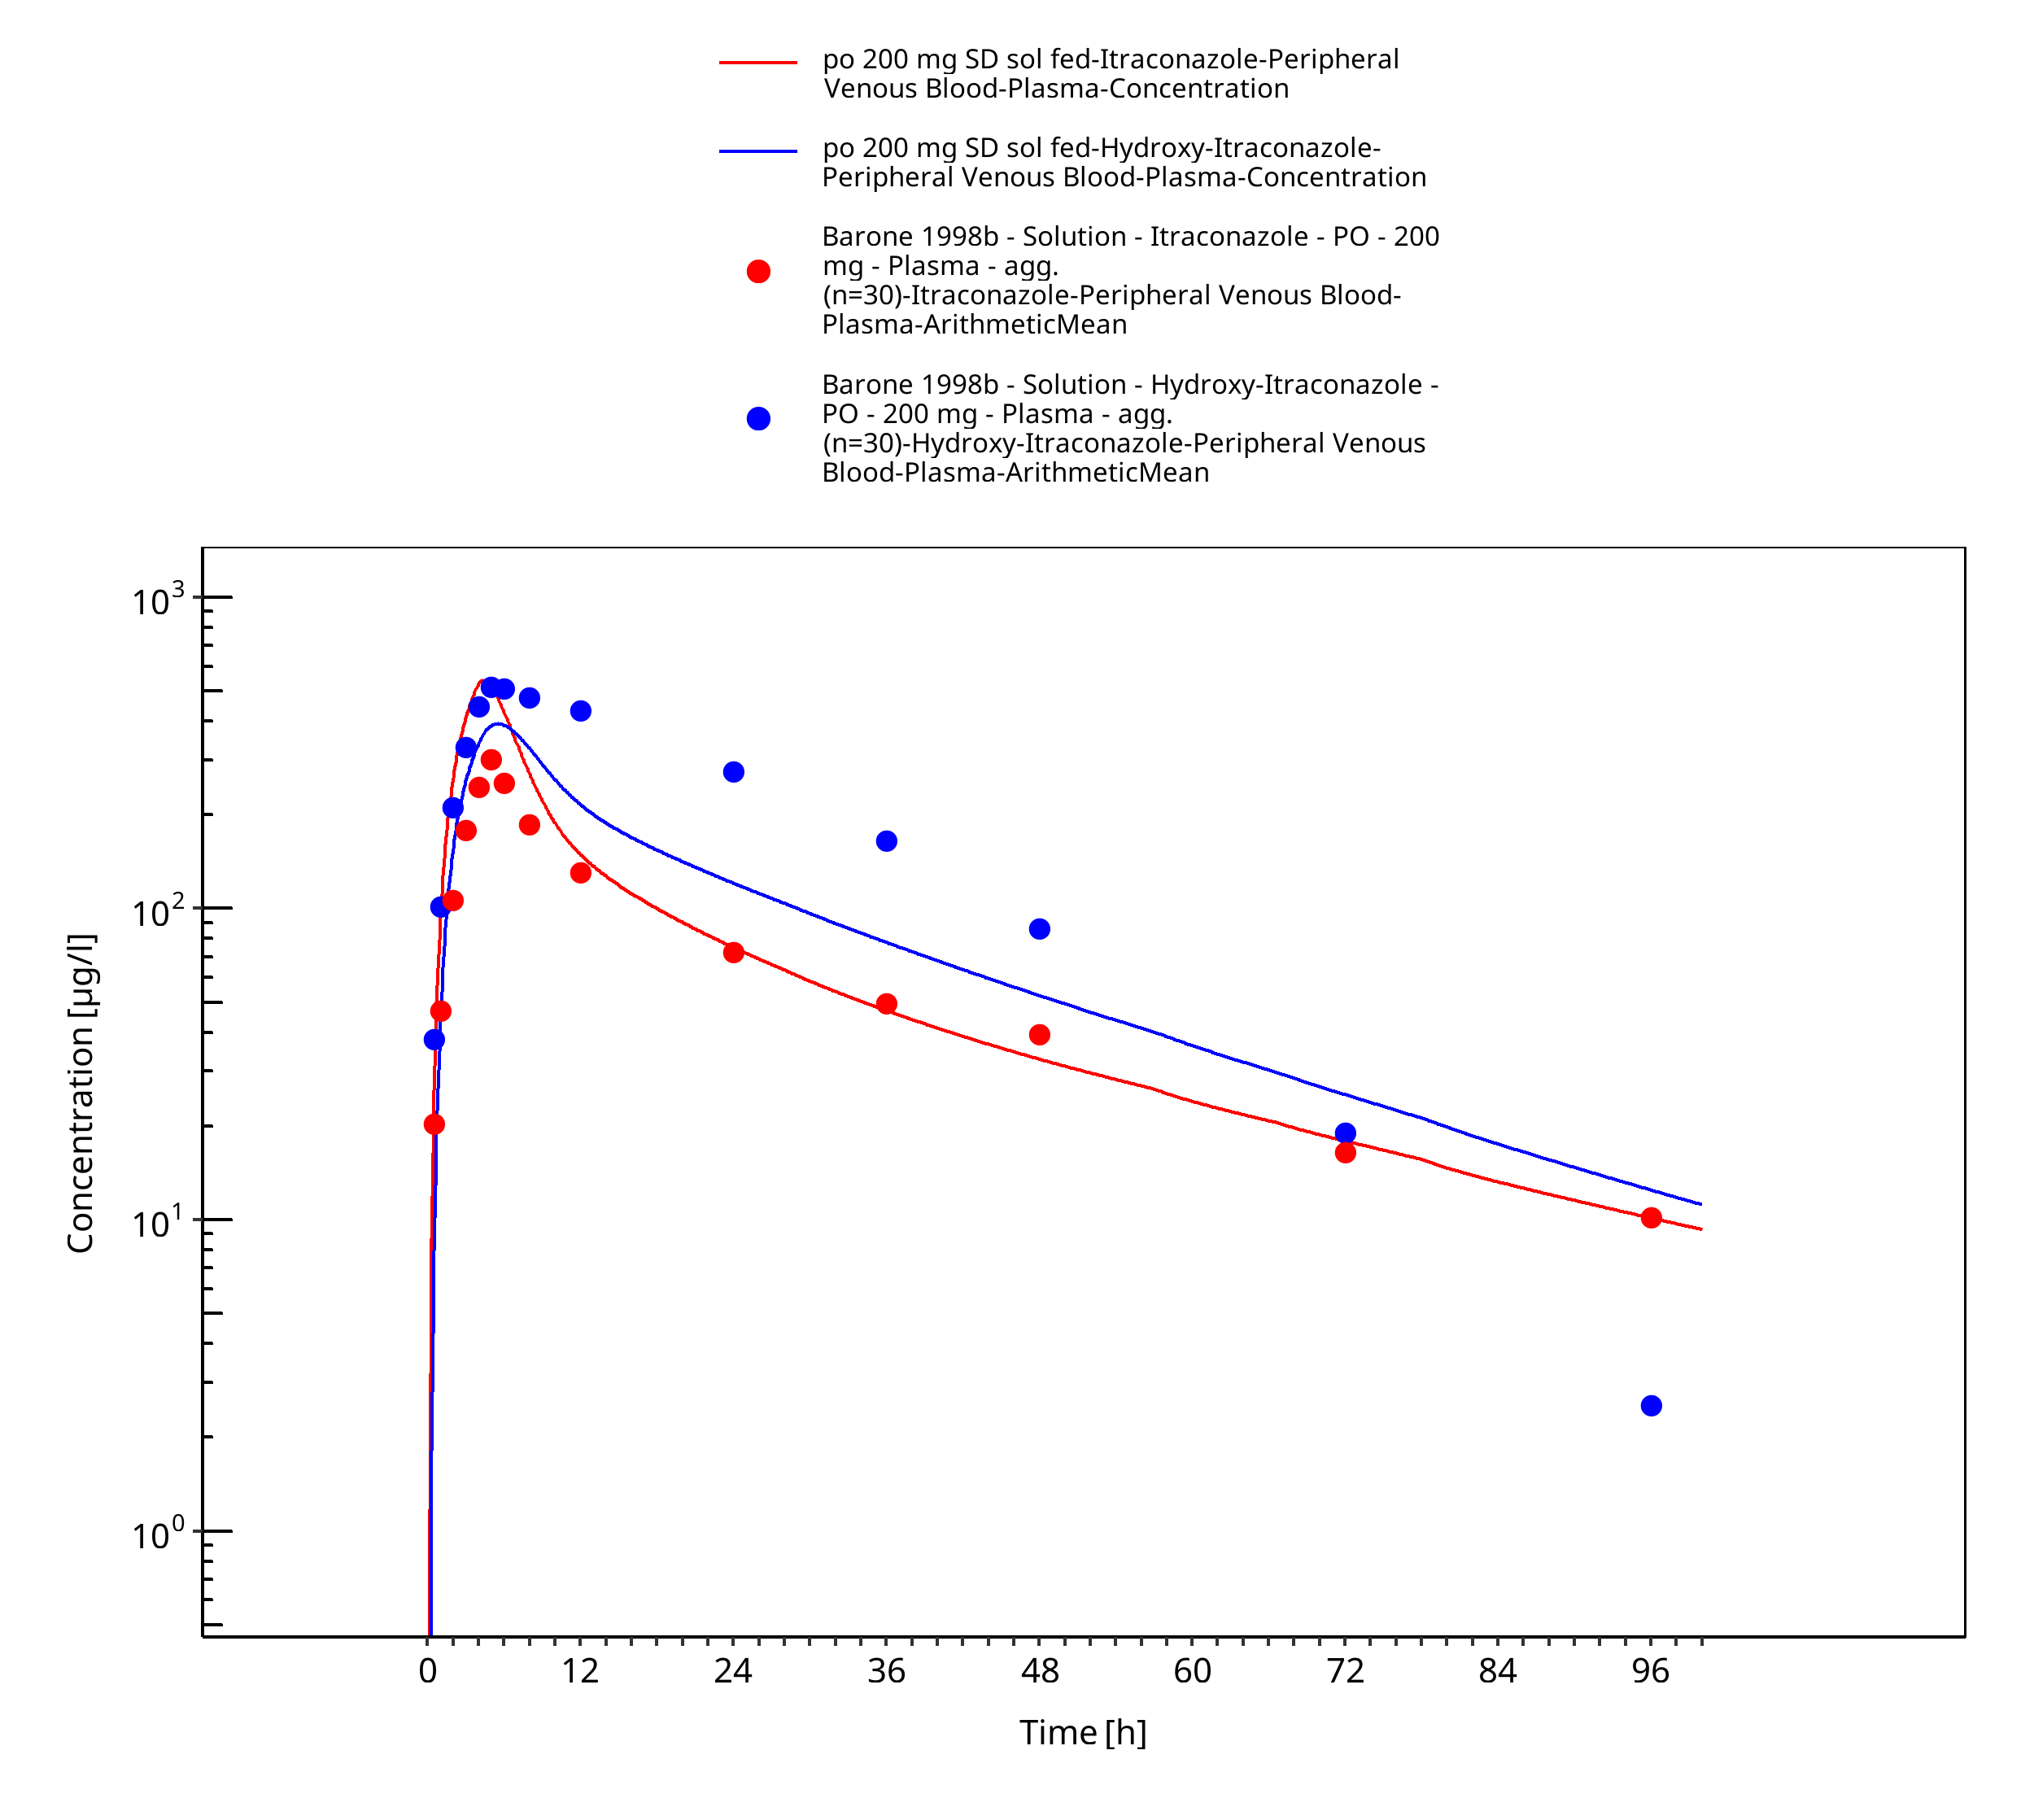
Figure 3-28: po 200 mg SD sol fed - Plasma
4 Conclusion¶
The herein presented PBPK model adequately describes the pharmacokinetics of itraconazole in adults.
In particular, the model includes the sequential metabolites hydroxy-itraconazole, keto-itraconazola and N-desalkyl-itraconazole - all of them formed by CYP3A4. The model applies competitive inhibition of CYP3A4 by itraconzaole and the three metabolites. Thus, the model is fit for purpose to be applied for the investigation of drug-drug interactions with regard to strong CYP3A4 inhibition.
5 References¶
Barone 1993 Barone JA, Koh JG, Bierman RH, Colaizzi JL, Swanson KA, Gaffar MC, Moskovitz BL, Mechlinski W, Van de Velde V. Food interaction and steady-state pharmacokinetics of itraconazole capsules in healthy male volunteers. Antimicrob Agents Chemother. 1993 Apr;37(4):778-84.
Barone 1998a Barone JA, Moskovitz BL, Guarnieri J, Hassell AE, Colaizzi JL, Bierman RH, Jessen L. Food interaction and steady-state pharmacokinetics of itraconazole oral solution in healthy volunteers. Pharmacotherapy. 1998 Mar-Apr;18(2):295-301.
Barone 1998b Barone JA, Moskovitz BL, Guarnieri J, Hassell AE, Colaizzi JL, Bierman RH, Jessen L. Enhanced bioavailability of itraconazole in hydroxypropyl-beta-cyclodextrin solution versus capsules in healthy volunteers. Antimicrob Agents Chemother. 1998 Jul;42(7):1862-5.
Chen 2016 Chen Y, Ma F,, Lu T, Budha N, Jin JY, Kenny JR, Wong H,, Hop CE, Mao J. Development of a Physiologically Based Pharmacokinetic Model for Itraconazole Pharmacokinetics and Drug-Drug Interaction Prediction. Clin Pharmacokinet. 2016 Jun;55(6):735-49.
Cheng 1973 Cheng Y, Prusoff WH. Relationship between the inhibition constant (K1) and the concentration of inhibitor which causes 50 per cent inhibition (I50) of an enzymatic reaction. Biochem Pharmacol. 1973 Dec 1;22(23):3099-108.
DrugBank DB01167 (https://www.drugbank.ca/drugs/DB01167)
DrugBank DBMET00374 (https://www.drugbank.ca/metabolites/DBMET00374)
Hanke 2018 Hanke N, Frechen S, Moj D, Britz H, Eissing T, Wendl T, Lehr T. PBPK Models for CYP3A4 and P-gp DDI Prediction: A Modeling Network of Rifampicin, Itraconazole, Clarithromycin, Midazolam, Alfentanil, and Digoxin. CPT Pharmacometrics Syst Pharmacol. 2018 Oct;7(10):647-659.
Hardin 1988 Hardin TC, Graybill JR, Fetchick R, Woestenborghs R, Rinaldi MG, Kuhn JG. Pharmacokinetics of itraconazole following oral administration to normal volunteers. Antimicrob Agents Chemother. 1988 Sep;32(9):1310-3.
Heykants 1989 Heykants J, Van Peer A, Van de Velde V, Van Rooy P, Meuldermans W, Lavrijsen K, Woestenborghs R, Van Cutsem J, Cauwenbergh G. The clinical pharmacokinetics of itraconazole: an overview. Mycoses. 1989;32 Suppl 1:67-87.
Ishigam 2001 Ishigam M, Uchiyama M, Kondo T, Iwabuchi H, Inoue S, Takasaki W, Ikeda T, Komai T, Ito K, Sugiyama Y. Inhibition of in vitro metabolism of simvastatin by itraconazole in humans and prediction of in vivo drug-drug interactions. Pharm Res. 2001 May;18(5):622-31.
Isoherranen 2004 Isoherranen N, Kunze KL, Allen KE, Nelson WL, Thummel KE. Role of itraconazole metabolites in CYP3A4 inhibition. Drug Metab Dispos. 2004 Oct;32(10):1121-31.
Jalava 1997 Jalava KM, Partanen J, Neuvonen PJ. Itraconazole decreases renal clearance of digoxin. Ther Drug Monit. 1997 Dec;19(6):609-13.
Kivistö 1997 Kivistö KT, Lamberg TS, Kantola T, Neuvonen PJ. Plasma buspirone concentrations are greatly increased by erythromycin and itraconazole. Clin Pharmacol Ther. 1997 Sep;62(3):348-54.
Kuepfer 2016 Kuepfer L, Niederalt C, Wendl T, Schlender JF, Willmann S, Lippert J, Block M, Eissing T, Teutonico D. Applied Concepts in PBPK Modeling: How to Build a PBPK/PD Model.CPT Pharmacometrics Syst Pharmacol. 2016 Oct;5(10):516-531.
Mouton 2006 Mouton JW, van Peer A, de Beule K, Van Vliet A, Donnelly JP, Soons PA. Pharmacokinetics of itraconazole and hydroxyitraconazole in healthy subjects after single and multiple doses of a novel formulation. Antimicrob Agents Chemother. 2006 Dec;50(12):4096-102.
Neuvonen 1996 Neuvonen PJ, Varhe A, Olkkola KT. The effect of ingestion time interval on the interaction between itraconazole and triazolam. Clin Pharmacol Ther. 1996 Sep;60(3):326-31.
Nishimura 2013 Nishimura M, Yaguti H, Yoshitsugu H, Naito S, Satoh T. Tissue distribution of mRNA expression of human cytochrome P450 isoforms assessed by high-sensitivity real-time reverse transcription PCR. Yakugaku Zasshi. 2003 May;123(5):369-75.
Olkkola 1994 Olkkola KT, Backman JT, Neuvonen PJ. Midazolam should be avoided in patients receiving the systemic antimycotics ketoconazole or itraconazole. Clin Pharmacol Ther. 1994 May;55(5):481-5.
PK-Sim Ontogeny Database Version 7.3 (https://github.com/Open-Systems-Pharmacology/OSPSuite.Documentation/blob/38cf71b384cfc25cfa0ce4d2f3addfd32757e13b/PK-Sim%20Ontogeny%20Database%20Version%207.3.pdf)
PubChem CID 108222 (https://pubchem.ncbi.nlm.nih.gov/compound/Hydroxy-Itraconazole)
PubChem CID 53865186 (https://pubchem.ncbi.nlm.nih.gov/compound/Keto-Itraconazole)
PubChem CID 53789808 (https://pubchem.ncbi.nlm.nih.gov/compound/169437521#section=Computed-Properties)
Riccardi 2015 Riccardi K, Cawley S, Yates PD, Chang C, Funk C, Niosi M, Lin J, Di L. Plasma Protein Binding of Challenging Compounds. J Pharm Sci. 2015 Aug;104(8):2627-36.
Rodrigues 1999 Rodrigues AD. Integrated cytochrome P450 reaction phenotyping: attempting to bridge the gap between cDNA-expressed cytochromes P450 and native human liver microsomes. Biochem Pharmacol. 1999 Mar 1;57(5):465-80.
Shityakov 2014 Shityakov S, Förster C. In silico structure-based screening of versatile P-glycoprotein inhibitors using polynomial empirical scoring functions. Adv Appl Bioinform Chem. 2014 Mar 24;7:1-9.
Taupitz 2013 Taupitz T, Dressman JB, Buchanan CM, Klein S. Cyclodextrin-water soluble polymer ternary complexes enhance the solubility and dissolution behaviour of poorly soluble drugs. Case example: itraconazole. Eur J Pharm Biopharm. 2013 Apr;83(3):378-87.
Templeton 2008 Templeton IE, Thummel KE, Kharasch ED, Kunze KL, Hoffer C, Nelson WL, Isoherranen N. Contribution of itraconazole metabolites to inhibition of CYP3A4 in vivo. Clin Pharmacol Ther. 2008 Jan;83(1):77-85.
Van de Velde 1996 Van de Velde VJ, Van Peer AP, Heykants JJ, Woestenborghs RJ, Van Rooy P, De Beule KL, Cauwenbergh GF. Effect of food on the pharmacokinetics of a new hydroxypropyl-beta-cyclodextrin formulation of itraconazole. Pharmacotherapy. 1996 May-Jun;16(3):424-8.
Van Peer 1989 Van Peer A, Woestenborghs R, Heykants J, Gasparini R, Gauwenbergh G. The effects of food and dose on the oral systemic availability of itraconazole in healthy subjects. Eur J Clin Pharmacol. 1989;36(4):423-6.
Varhe 1994 Varhe A, Olkkola KT, Neuvonen PJ. Oral triazolam is potentially hazardous to patients receiving systemic antimycotics ketoconazole or itraconazole. Clin Pharmacol Ther. 1994 Dec;56(6 Pt 1):601-7.
Willmann 2007 Willmann S, Höhn K, Edginton A, Sevestre M, Solodenko J, Weiss W, Lippert J, Schmitt W. Development of a physiology-based whole-body population model for assessing the influence of individual variability on the pharmacokinetics of drugs. J Pharmacokinet Pharmacodyn. 2007, 34(3):401-31.
Related Models¶
Explore other Cardiovascular Agents models in this library:
- Cimetidine - PBPK model and evaluation report
- Dapagliflozin - PBPK model and evaluation report
- Digoxin - PBPK model and evaluation report
- Felodipine - PBPK model and evaluation report
- Fluconazole - PBPK model and evaluation report