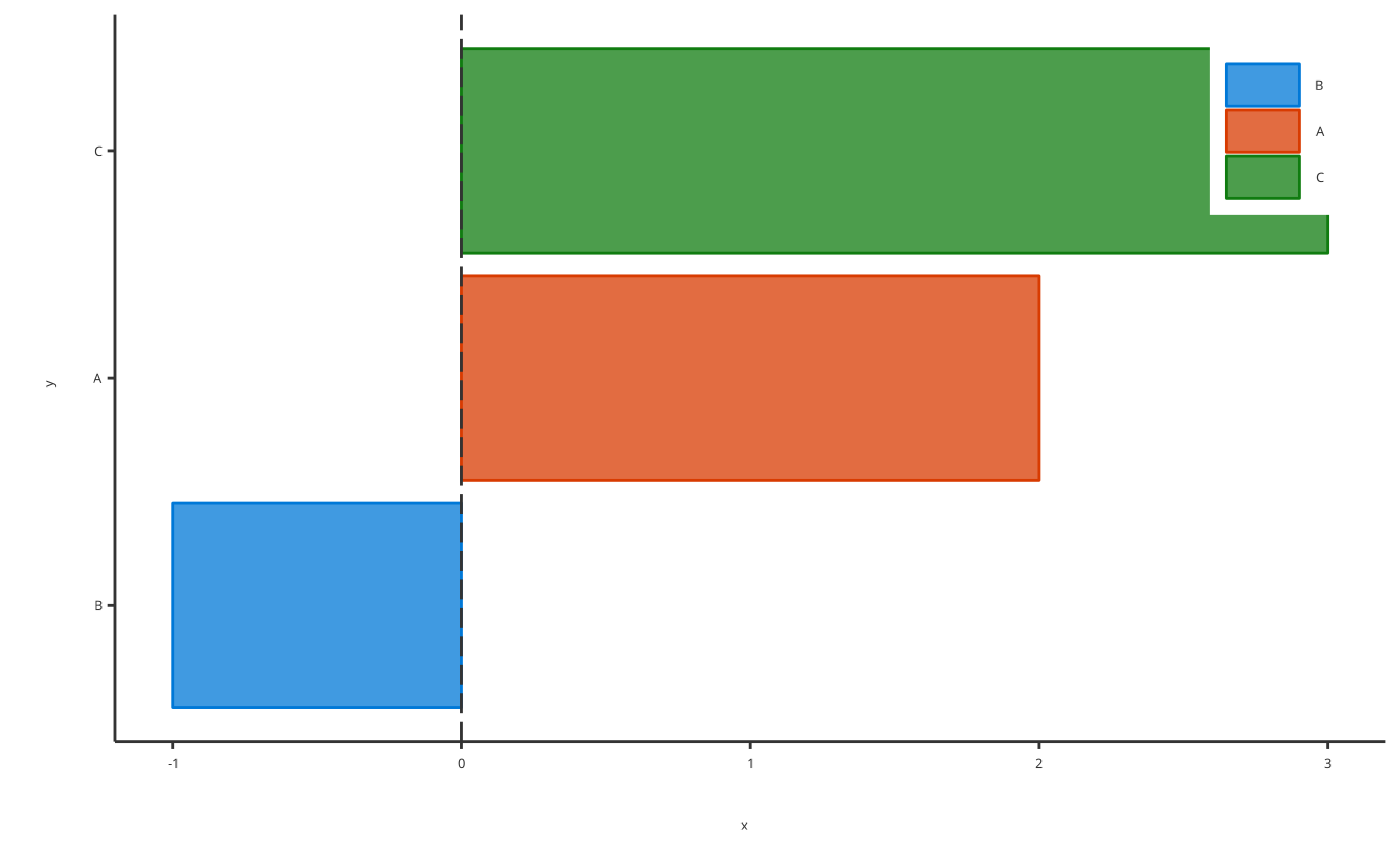
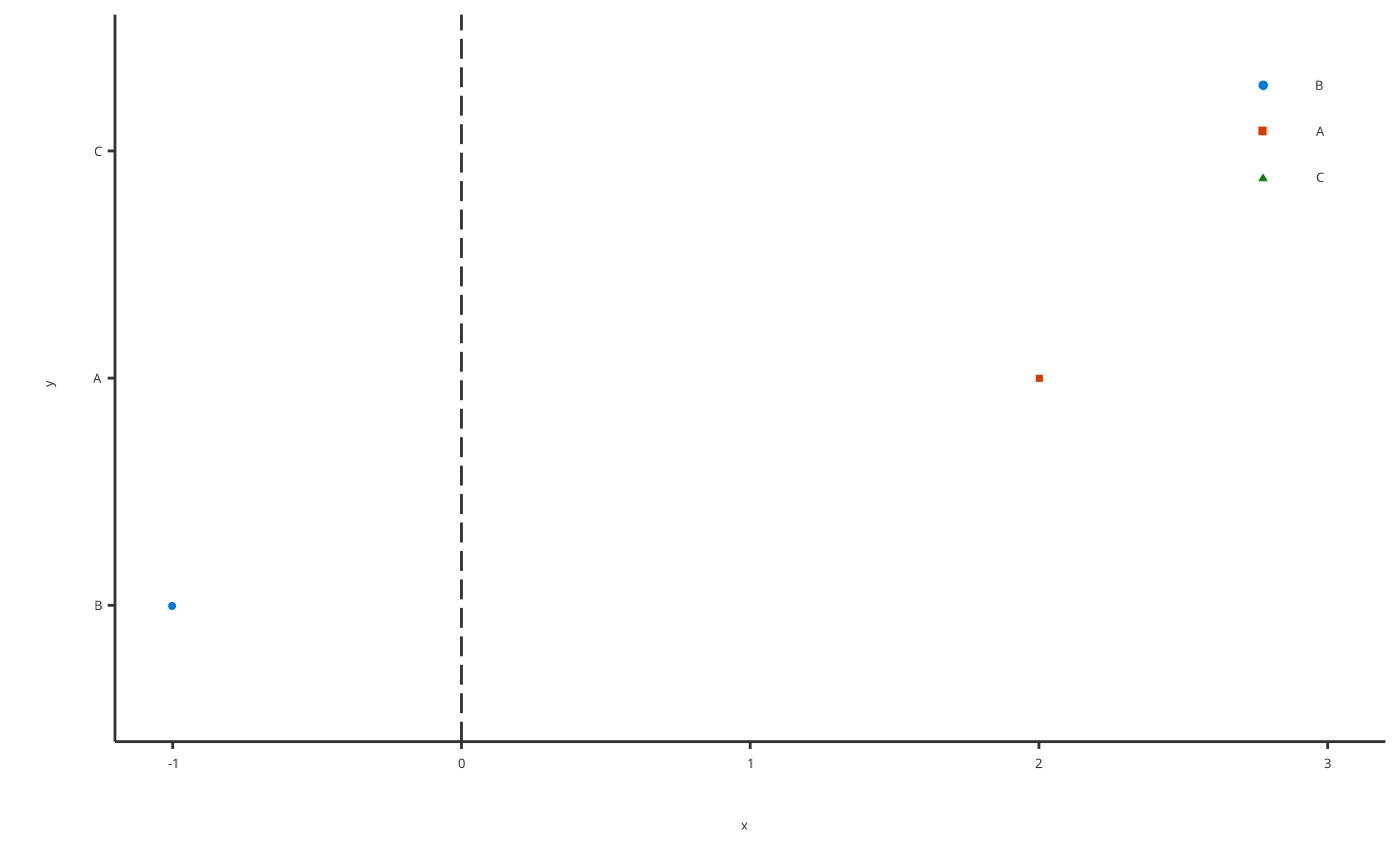
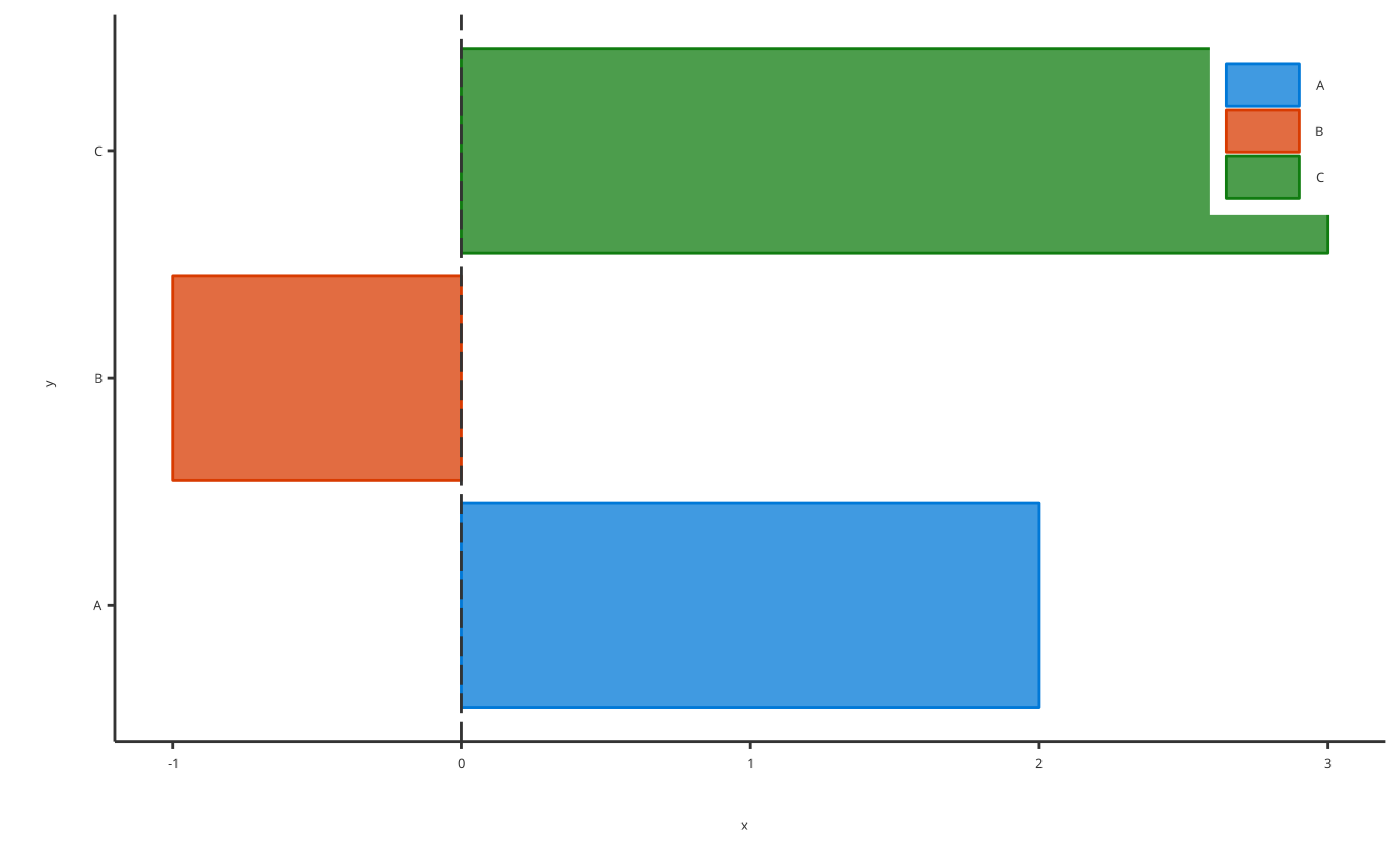
Producing tornado plots
Usage
plotTornado(
  data = NULL,
  metaData = NULL,
  x = NULL,
  y = NULL,
  sorted = NULL,
  colorPalette = NULL,
  bar = TRUE,
  dataMapping = NULL,
  plotConfiguration = NULL,
  plotObject = NULL
)
Arguments
- data
A data.frame to use for plot.
- metaData
A named list of information about
datasuch as thedimensionandunitof its variables.- x
Numeric values to plot along the
xaxis. Only used instead ofdataifdataisNULL.- y
Character values to plot along the
yaxis. Only used instead ofdataifdataisNULL.- sorted
Optional logical value defining if
yvalues are sorted by absolute values ofx.- colorPalette
Optional character values defining a
ggplot2colorPalette (e.g."Spectral")- bar
Optional logical value setting tornado plot as bar plot instead of scatter plot.
- dataMapping
A
TornadoDataMappingobject mappingx,yand aesthetic groups to their variable names ofdata.- plotConfiguration
An optional
TornadoPlotConfigurationobject defining labels, grid, background and watermark.- plotObject
An optional
ggplotobject on which to add the plot layer