Producing Time Profile plots
Usage
plotSimulatedTimeProfile(
  data = NULL,
  metaData = NULL,
  dataMapping = NULL,
  plotConfiguration = NULL,
  plotObject = NULL
)
Arguments
- data
A data.frame to use for plot.
- metaData
A named list of information about
datasuch as thedimensionandunitof its variables.- dataMapping
A
TimeProfileDataMappingobject mappingx,y,ymin,ymaxand aesthetic groups to their variable names ofdata.- plotConfiguration
An optional
TimeProfilePlotConfigurationobject defining labels, grid, background and watermark.- plotObject
An optional
ggplotobject on which to add the plot layer
Examples
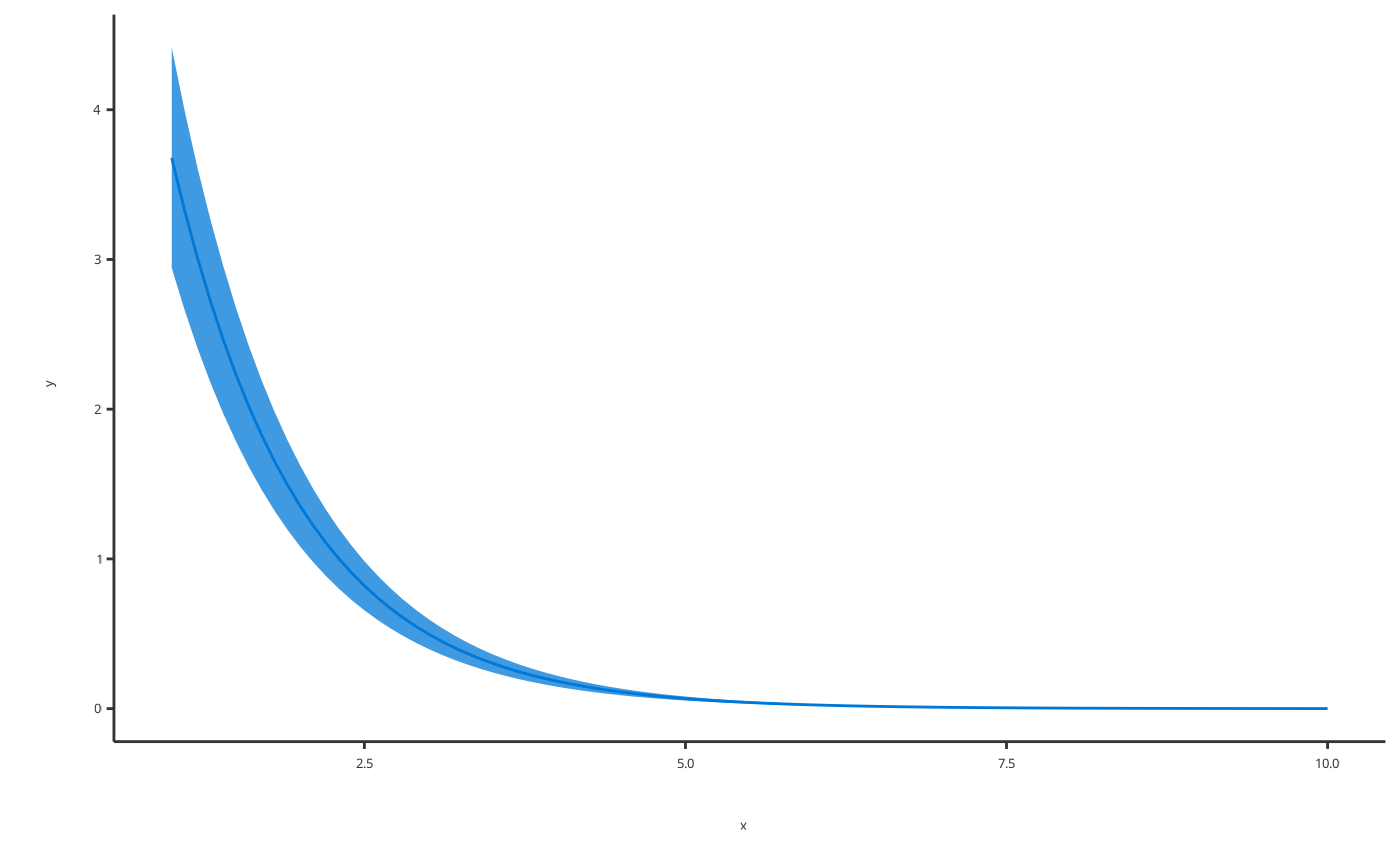
# Produce a Time profile plot with simulated data
simTime <- seq(1, 10, 0.1)
simData <- data.frame(
  x = simTime,
  y = 10 * exp(-simTime),
  ymin = 8 * exp(-simTime),
  ymax = 12 * exp(-simTime)
)

plotSimulatedTimeProfile(
  data = simData,
  dataMapping = TimeProfileDataMapping$new(x = "x", y = "y", ymin = "ymin", ymax = "ymax")
)