Producing residuals vs predicted plots
Usage
plotResVsPred(
  data,
  metaData = NULL,
  dataMapping = NULL,
  plotConfiguration = NULL,
  smoother = NULL,
  plotObject = NULL
)
Arguments
- data
A data.frame to use for plot.
- metaData
A named list of information about
datasuch as thedimensionandunitof its variables.- dataMapping
A
ResVsPredDataMappingobject mappingx,yand aesthetic groups to their variable names ofdata.- plotConfiguration
An optional
ResVsPredConfigurationobject defining labels, grid, background and watermark.- smoother
Optional name of smoother function:
"loess"for loess regression"lm"for linear regression
- plotObject
An optional
ggplotobject on which to add the plot layer
Examples
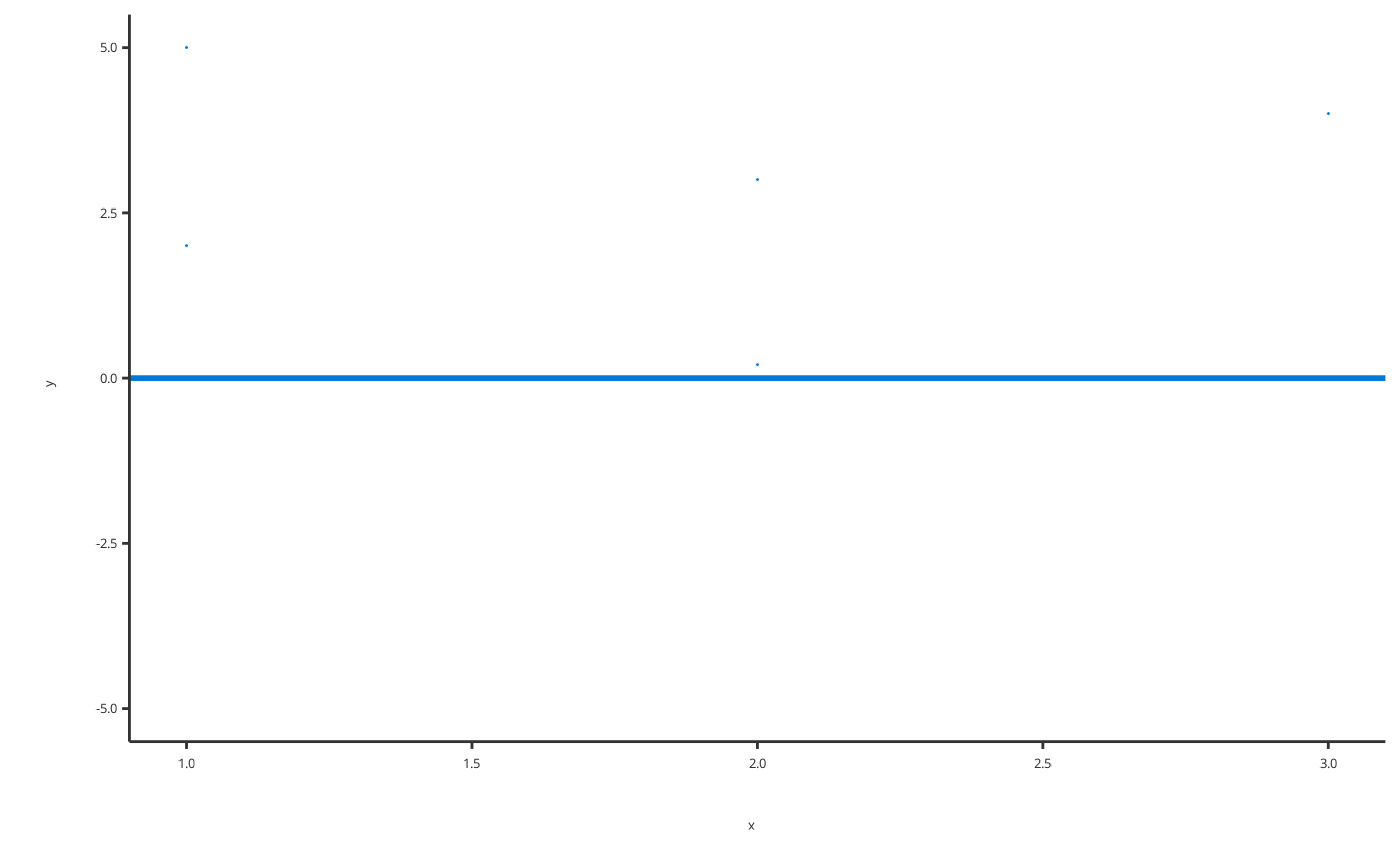
# Produce Obs vs Pred plot
resVsPredData <- data.frame(x = c(1, 2, 1, 2, 3), y = c(5, 0.2, 2, 3, 4))
plotResVsPred(data = resVsPredData, dataMapping = ResVsPredDataMapping$new(x = "x", y = "y"))
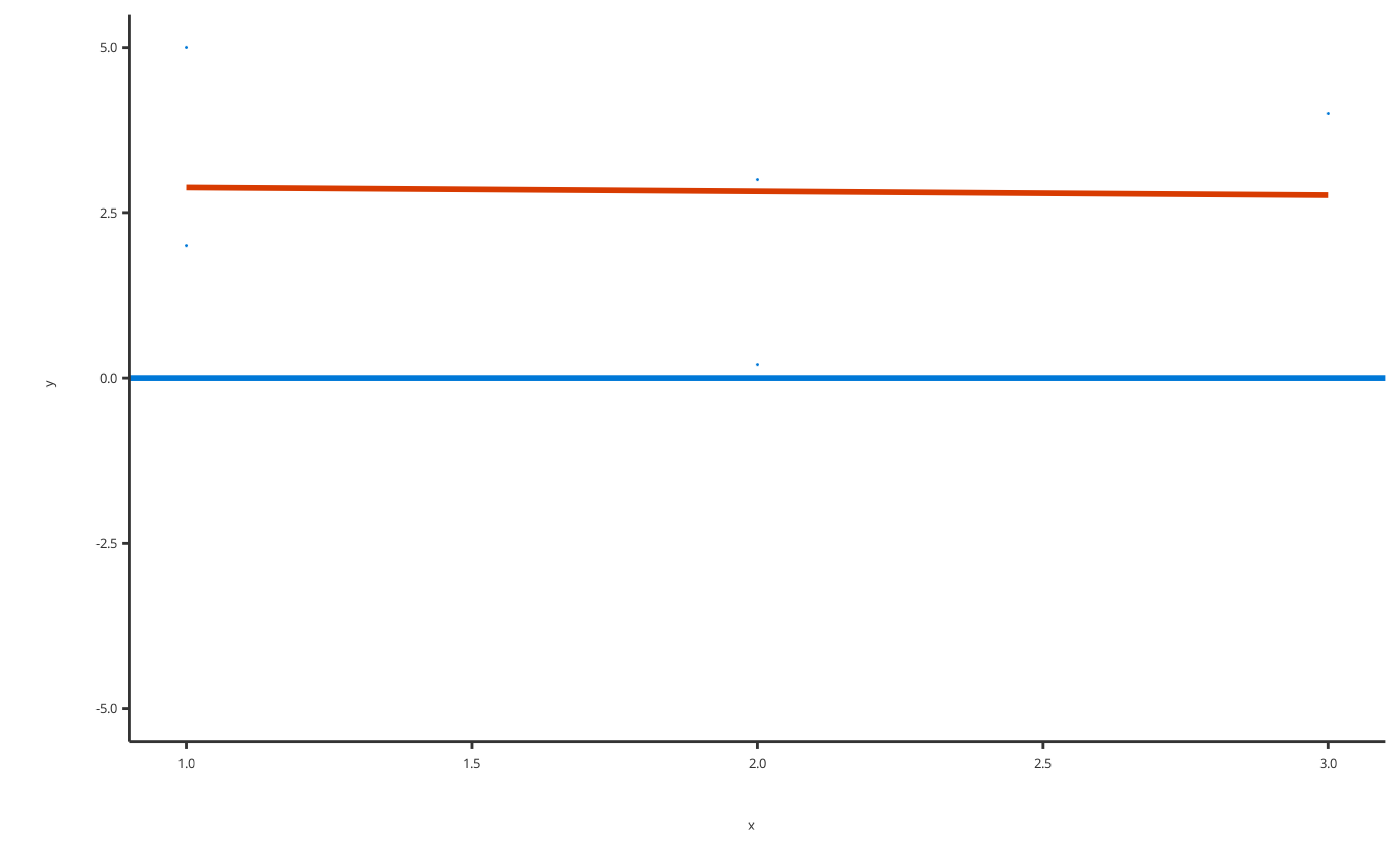
 # Produce Res vs Pred plot with linear regression
plotResVsPred(
data = resVsPredData,
dataMapping = ResVsPredDataMapping$new(x = "x", y = "y"),
smoother = "lm"
)
# Produce Res vs Pred plot with linear regression
plotResVsPred(
data = resVsPredData,
dataMapping = ResVsPredDataMapping$new(x = "x", y = "y"),
smoother = "lm"
)