Producing box-and-whisker plots
Usage
plotBoxWhisker(
  data,
  metaData = NULL,
  outliers = NULL,
  dataMapping = NULL,
  plotConfiguration = NULL,
  plotObject = NULL
)
Arguments
- data
A data.frame to use for plot.
- metaData
A named list of information about
datasuch as thedimensionandunitof its variables.- outliers
Logical defining if outliers should be included in boxplot
- dataMapping
A
BoxWhiskerDataMappingobject mappingx,yand aesthetic groups to their variable names ofdata.- plotConfiguration
An optional
BoxWhiskerConfigurationobject defining labels, grid, background and watermark.- plotObject
An optional
ggplotobject on which to add the plot layer
References
For examples, see: https://www.open-systems-pharmacology.org/TLF-Library/articles/box-whisker-vignette.html
Examples
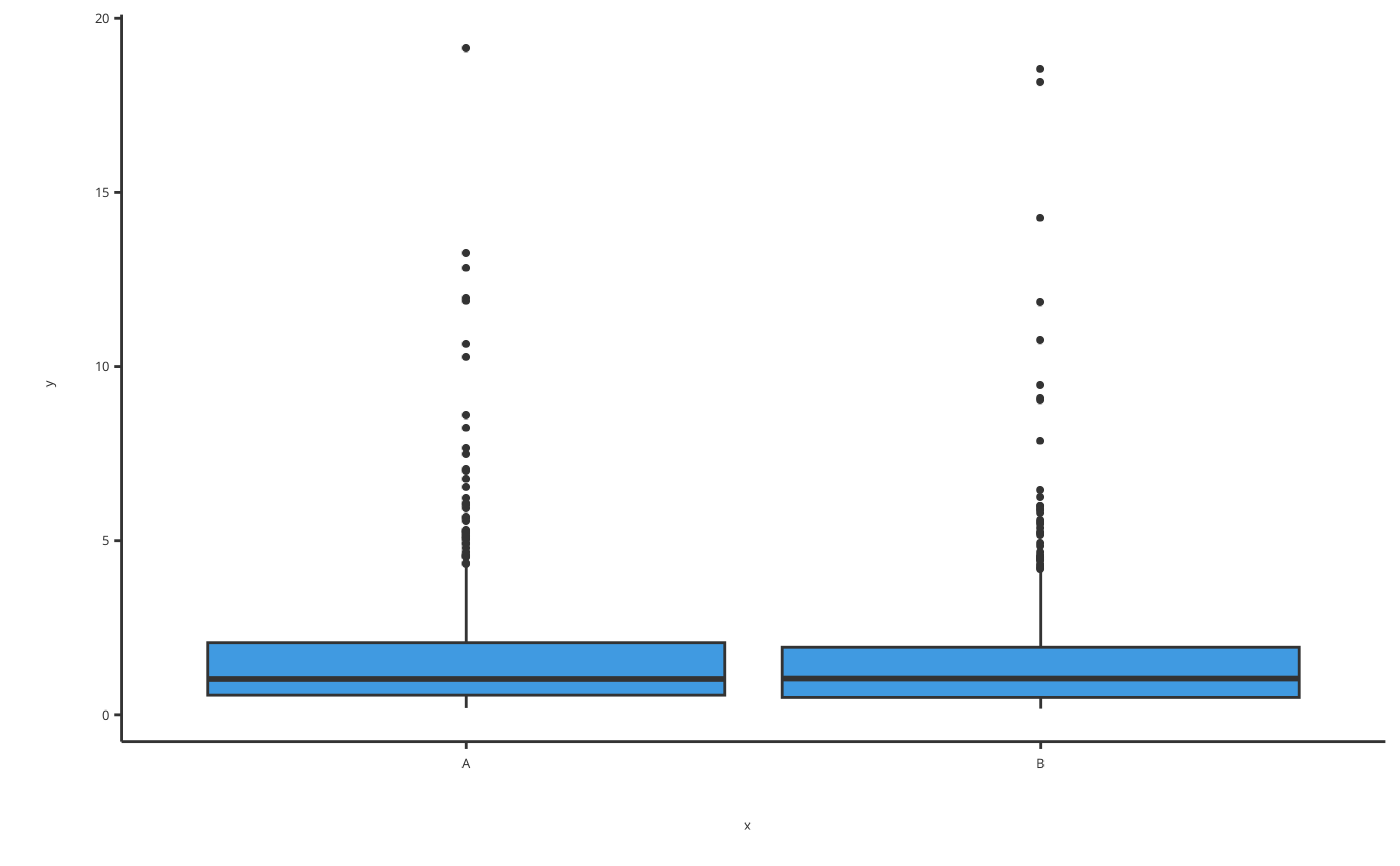
# Produce box-and-whisker plots of log-normal distributed data
boxData <- data.frame(x = c(rep("A", 500), rep("B", 500)), y = rlnorm(1000))
plotBoxWhisker(data = boxData, dataMapping = BoxWhiskerDataMapping$new(x = "x", y = "y"))
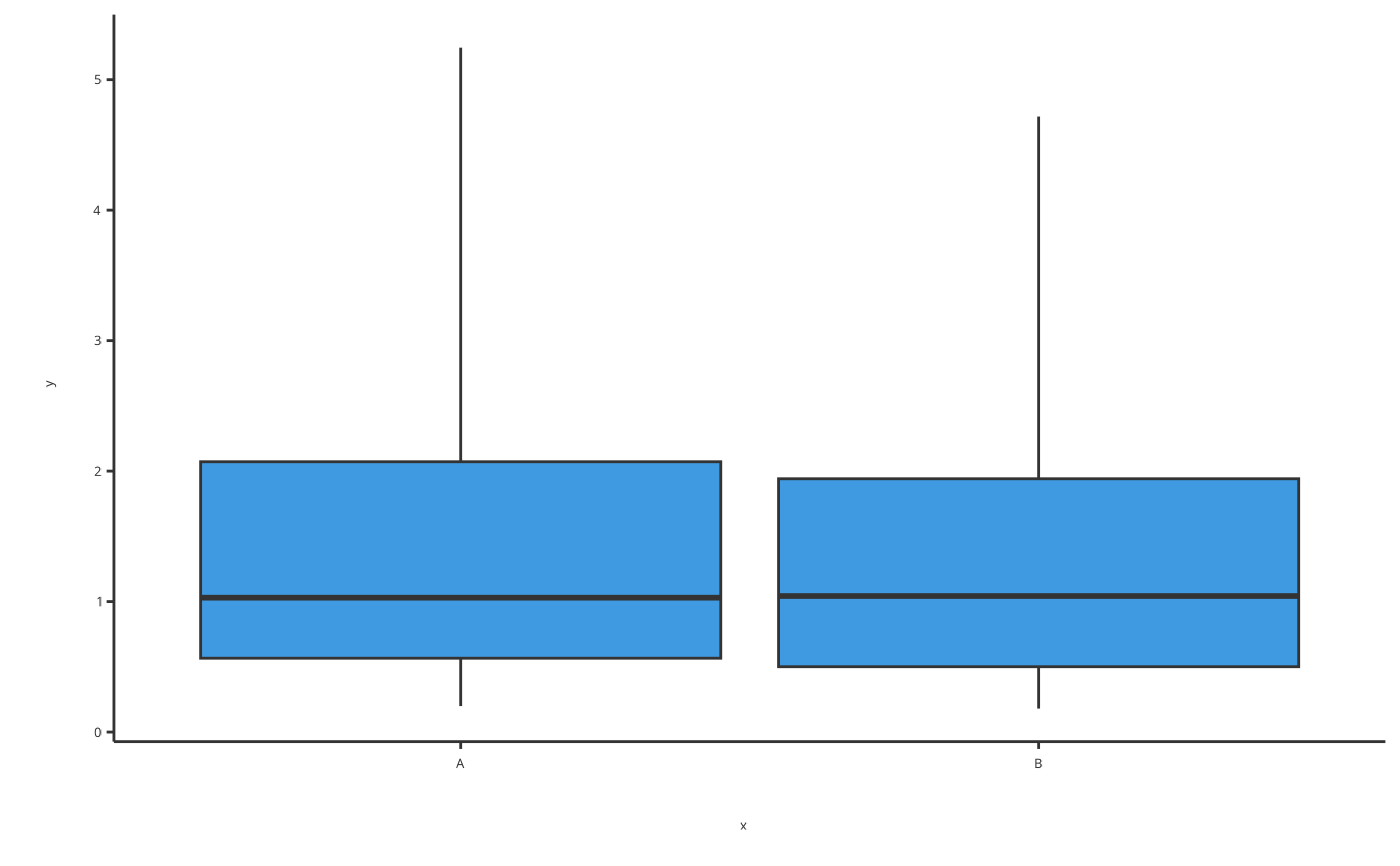
 # Remove outliers from boxplot
plotBoxWhisker(
data = boxData,
dataMapping = BoxWhiskerDataMapping$new(x = "x", y = "y"),
outliers = FALSE
)
# Remove outliers from boxplot
plotBoxWhisker(
data = boxData,
dataMapping = BoxWhiskerDataMapping$new(x = "x", y = "y"),
outliers = FALSE
)