Producing Cumulative Time Profile plots
Usage
plotCumulativeTimeProfile(
  data = NULL,
  metaData = NULL,
  dataMapping = NULL,
  colorPalette = NULL,
  plotConfiguration = NULL,
  plotObject = NULL
)
Arguments
- data
A data.frame to use for plot.
- metaData
A named list of information about
datasuch as thedimensionandunitof its variables.- dataMapping
A
CumulativeTimeProfileDataMappingobject mappingxand aesthetic groups to their variable names ofdata.- colorPalette
Optional character values defining a
ggplot2colorPalette (e.g."Set1"or"Spectral")- plotConfiguration
An optional
CumulativeTimeProfilePlotConfigurationobject defining labels, grid, background and watermark.- plotObject
An optional
ggplotobject on which to add the plot layer
Examples
# Define data to be plotted as cumulative time profile
time <- seq(1, 10)
data <- data.frame(
x = rep(time),
y = c(exp(-time / 10), 1 - exp(-time / 10)),
legend = rep(c("decreasing area", "increasing area"), each = 10)
)
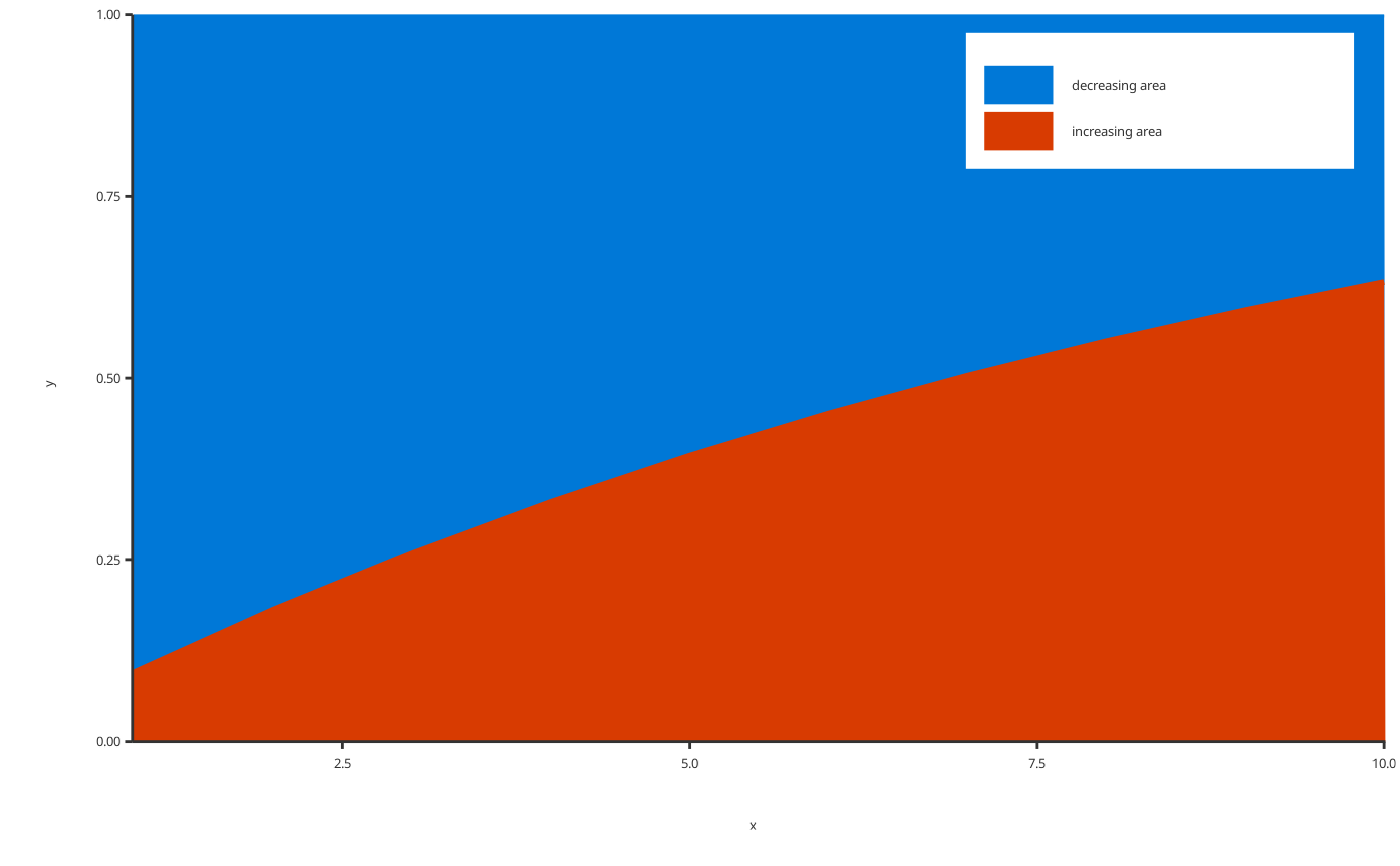
# Produce a Cumulative Time Profile plot
plotCumulativeTimeProfile(
data = data,
dataMapping = CumulativeTimeProfileDataMapping$new(x = "x", y = "y", fill = "legend")
)
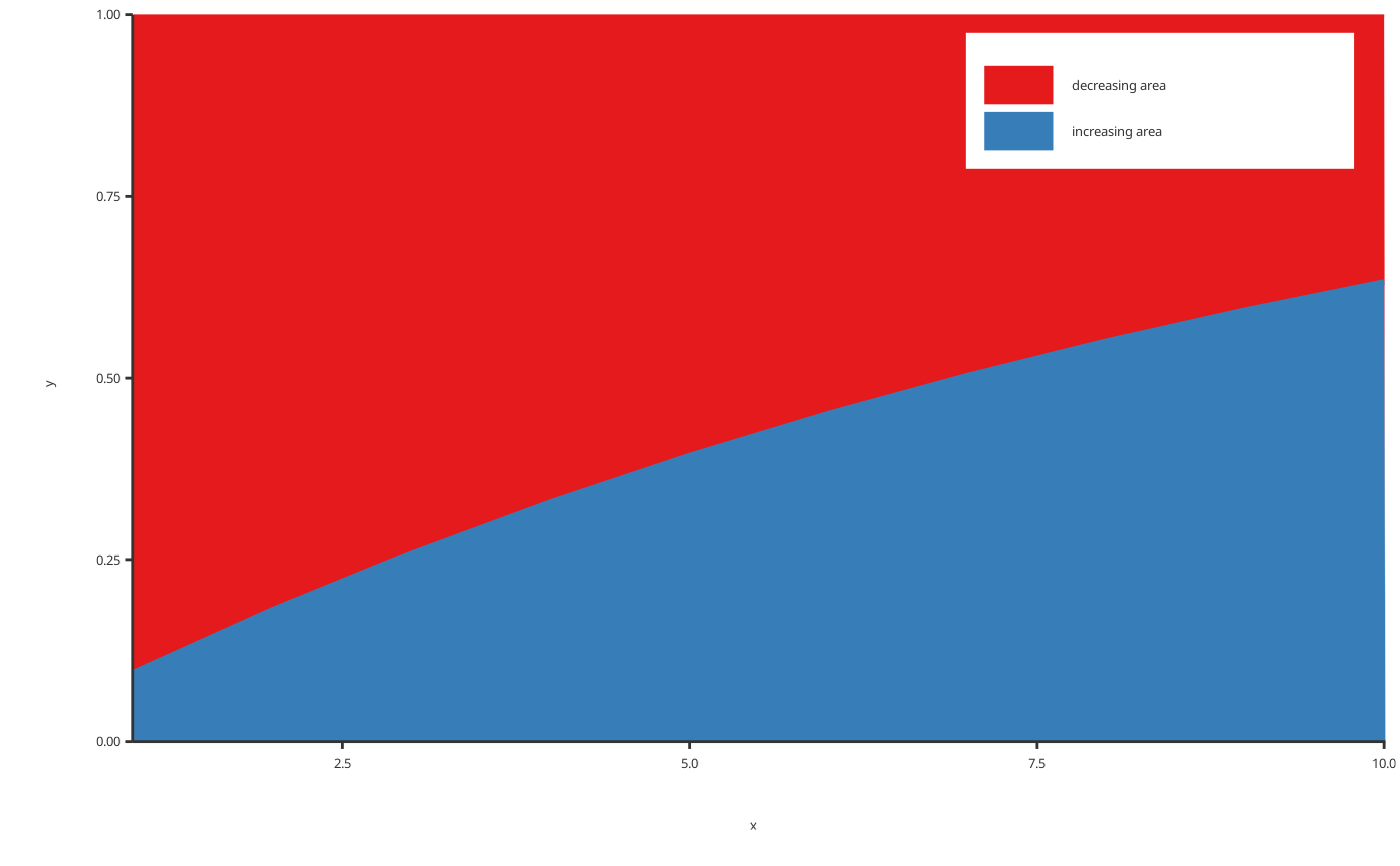
 # Produce a Cumulative Time Profile plot with a ggplot2 color palette
plotCumulativeTimeProfile(
data = data,
dataMapping = CumulativeTimeProfileDataMapping$new(
x = "x",
y = "y",
fill = "legend"
),
colorPalette = "Set1"
)
# Produce a Cumulative Time Profile plot with a ggplot2 color palette
plotCumulativeTimeProfile(
data = data,
dataMapping = CumulativeTimeProfileDataMapping$new(
x = "x",
y = "y",
fill = "legend"
),
colorPalette = "Set1"
)