Producing observed vs predicted plots
Usage
plotObsVsPred(
  data,
  metaData = NULL,
  dataMapping = NULL,
  plotConfiguration = NULL,
  foldDistance = NULL,
  smoother = NULL,
  plotObject = NULL
)
Arguments
- data
A data.frame to use for plot.
- metaData
A named list of information about
datasuch as thedimensionandunitof its variables.- dataMapping
A
ObsVsPredDataMappingobject mappingx,yand aesthetic groups to their variable names ofdata.- plotConfiguration
An optional
ObsVsPredConfigurationobject defining labels, grid, background and watermark.- foldDistance
Numeric values of fold distance lines to display in log plots. This argument is internally translated into
linesfield ofdataMapping. Caution: this argument is meant for log scaled plots and since fold distance is a ratio it is expected positive. In particular, line of identity corresponds to afoldDistanceof1.- smoother
Optional name of smoother function:
"loess"for loess regression"lm"for linear regression
- plotObject
An optional
ggplotobject on which to add the plot layer
Examples
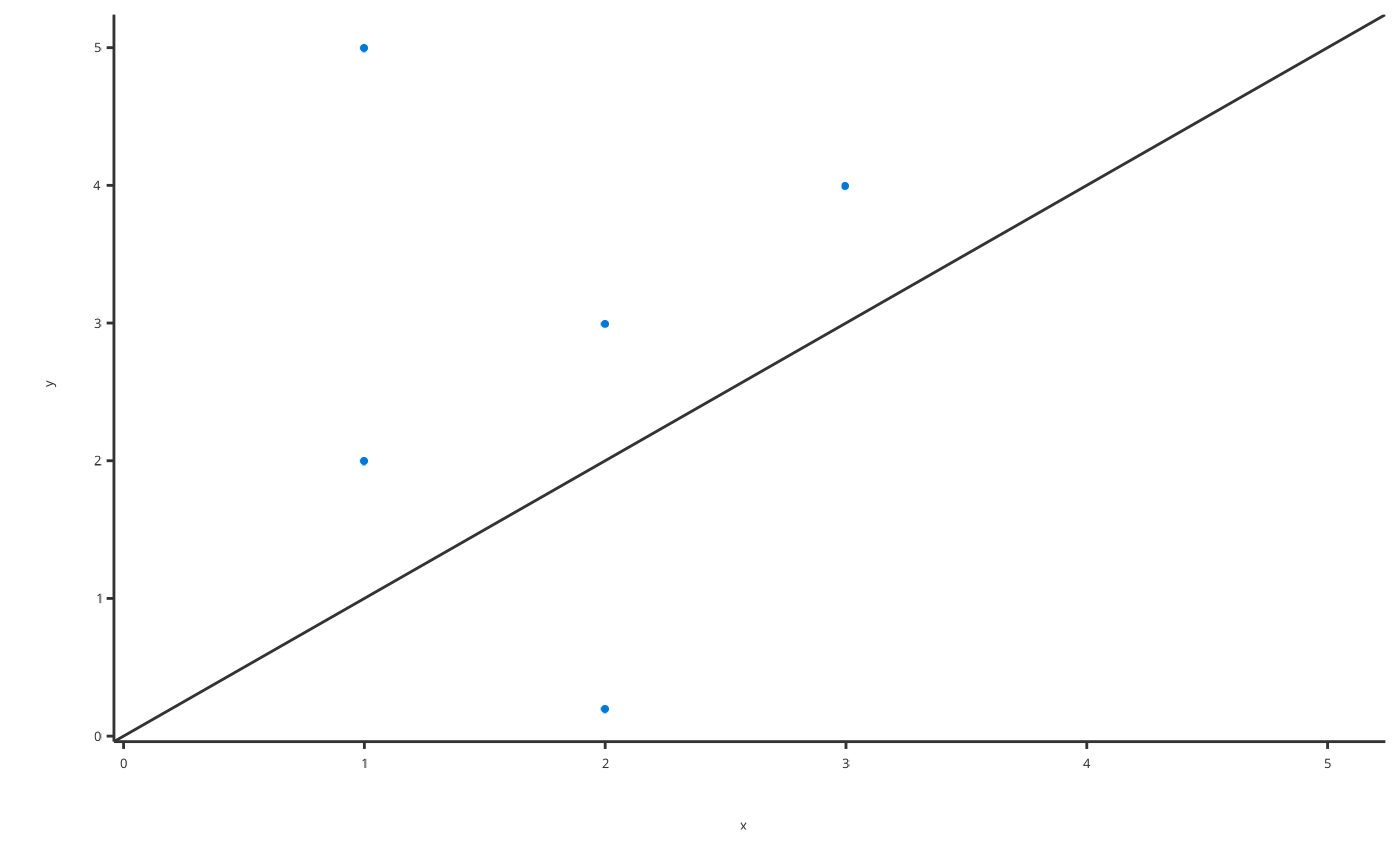
# Produce Obs vs Pred plot
obsVsPredData <- data.frame(x = c(1, 2, 1, 2, 3), y = c(5, 0.2, 2, 3, 4))
plotObsVsPred(data = obsVsPredData, dataMapping = ObsVsPredDataMapping$new(x = "x", y = "y"))
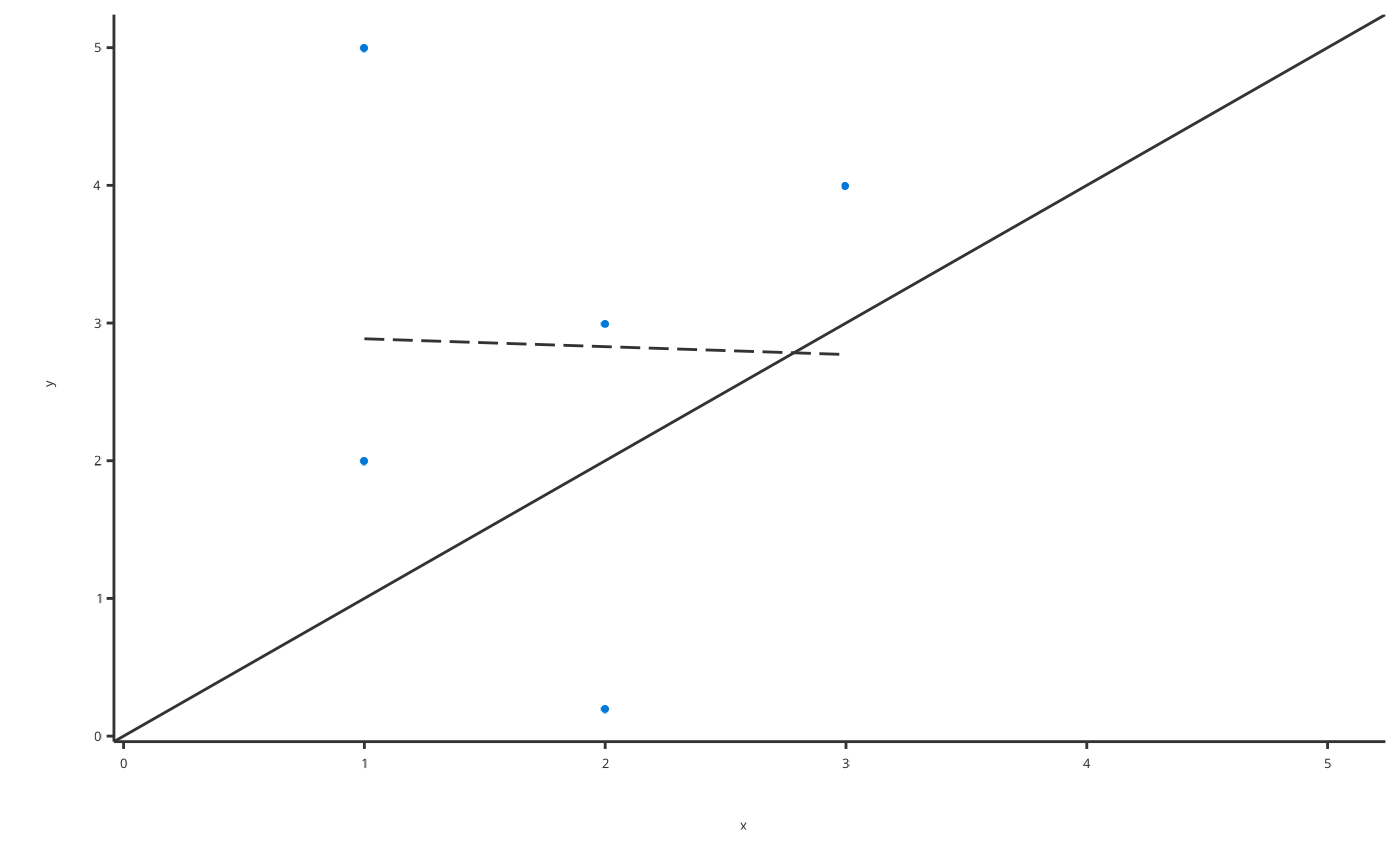
 # Produce Obs vs Pred plot with linear regression
plotObsVsPred(
data = obsVsPredData,
dataMapping = ObsVsPredDataMapping$new(x = "x", y = "y"),
smoother = "lm"
)
#> Warning: Using `size` aesthetic for lines was deprecated in ggplot2 3.4.0.
#> ℹ Please use `linewidth` instead.
#> ℹ The deprecated feature was likely used in the tlf package.
#> Please report the issue at
#> <https://github.com/open-systems-pharmacology/tlf-library/issues>.
# Produce Obs vs Pred plot with linear regression
plotObsVsPred(
data = obsVsPredData,
dataMapping = ObsVsPredDataMapping$new(x = "x", y = "y"),
smoother = "lm"
)
#> Warning: Using `size` aesthetic for lines was deprecated in ggplot2 3.4.0.
#> ℹ Please use `linewidth` instead.
#> ℹ The deprecated feature was likely used in the tlf package.
#> Please report the issue at
#> <https://github.com/open-systems-pharmacology/tlf-library/issues>.
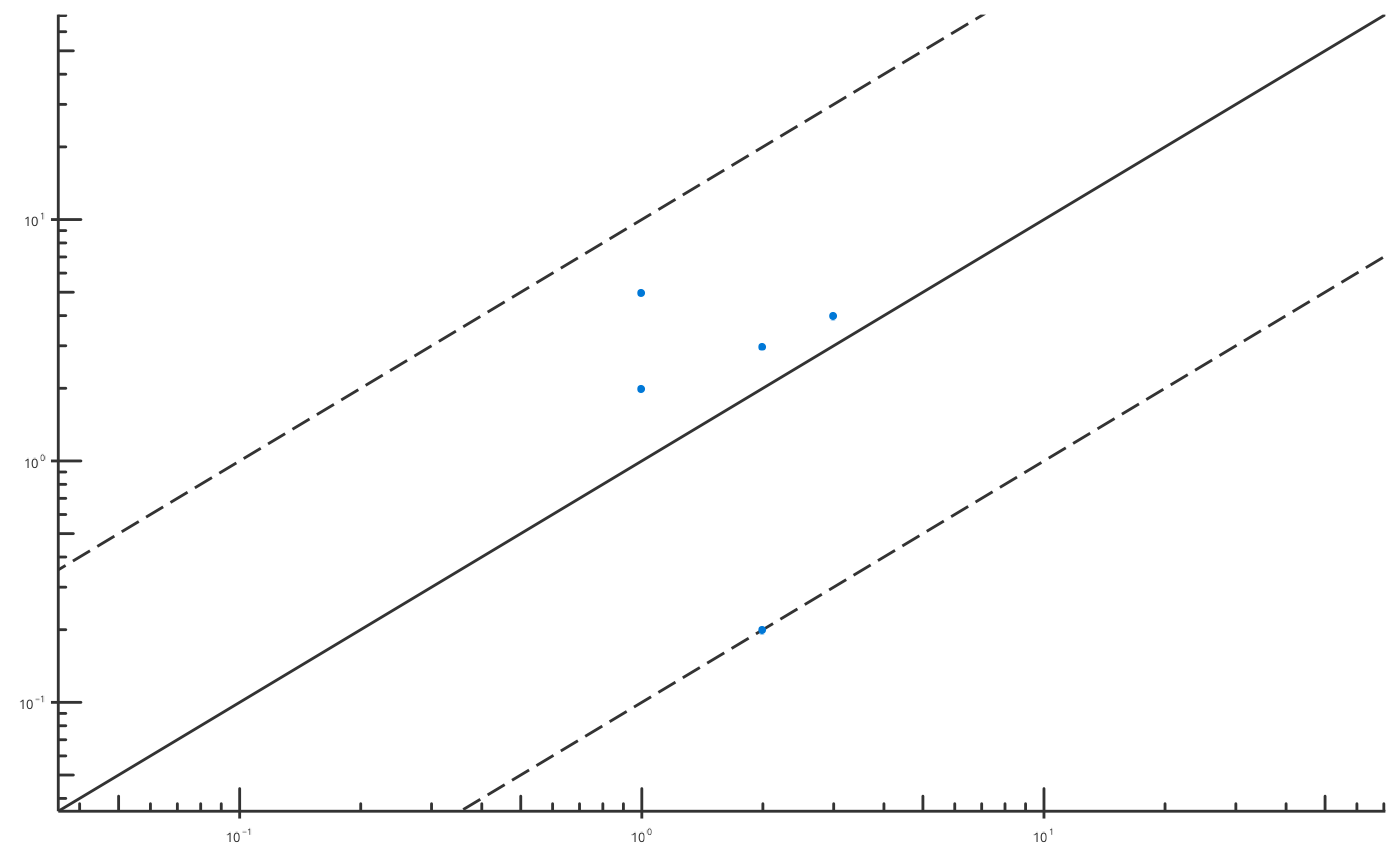
 # Produce Obs vs Pred plot with user-defined fold distance lines
plotObsVsPred(
data = obsVsPredData,
dataMapping = ObsVsPredDataMapping$new(x = "x", y = "y"),
plotConfiguration = ObsVsPredPlotConfiguration$new(
xScale = Scaling$log, xAxisLimits = c(0.05, 50),
yScale = Scaling$log, yAxisLimits = c(0.05, 50)
),
foldDistance = c(1, 10)
)
# Produce Obs vs Pred plot with user-defined fold distance lines
plotObsVsPred(
data = obsVsPredData,
dataMapping = ObsVsPredDataMapping$new(x = "x", y = "y"),
plotConfiguration = ObsVsPredPlotConfiguration$new(
xScale = Scaling$log, xAxisLimits = c(0.05, 50),
yScale = Scaling$log, yAxisLimits = c(0.05, 50)
),
foldDistance = c(1, 10)
)