Producing Histograms
Usage
plotQQ(
  data = NULL,
  metaData = NULL,
  y = NULL,
  dataMapping = NULL,
  plotConfiguration = NULL,
  plotObject = NULL
)
Arguments
- data
A data.frame to use for plot.
- metaData
A named list of information about
datasuch as thedimensionandunitof its variables.- y
Numeric values to plot along the
yaxis. Only used instead ofdataifdataisNULL.- dataMapping
A
QQDataMappingobject mappingyand aesthetic groups to their variable names ofdata.- plotConfiguration
An optional
QQPlotConfigurationobject defining labels, grid, background and watermark.- plotObject
An optional
ggplotobject on which to add the plot layer
Examples
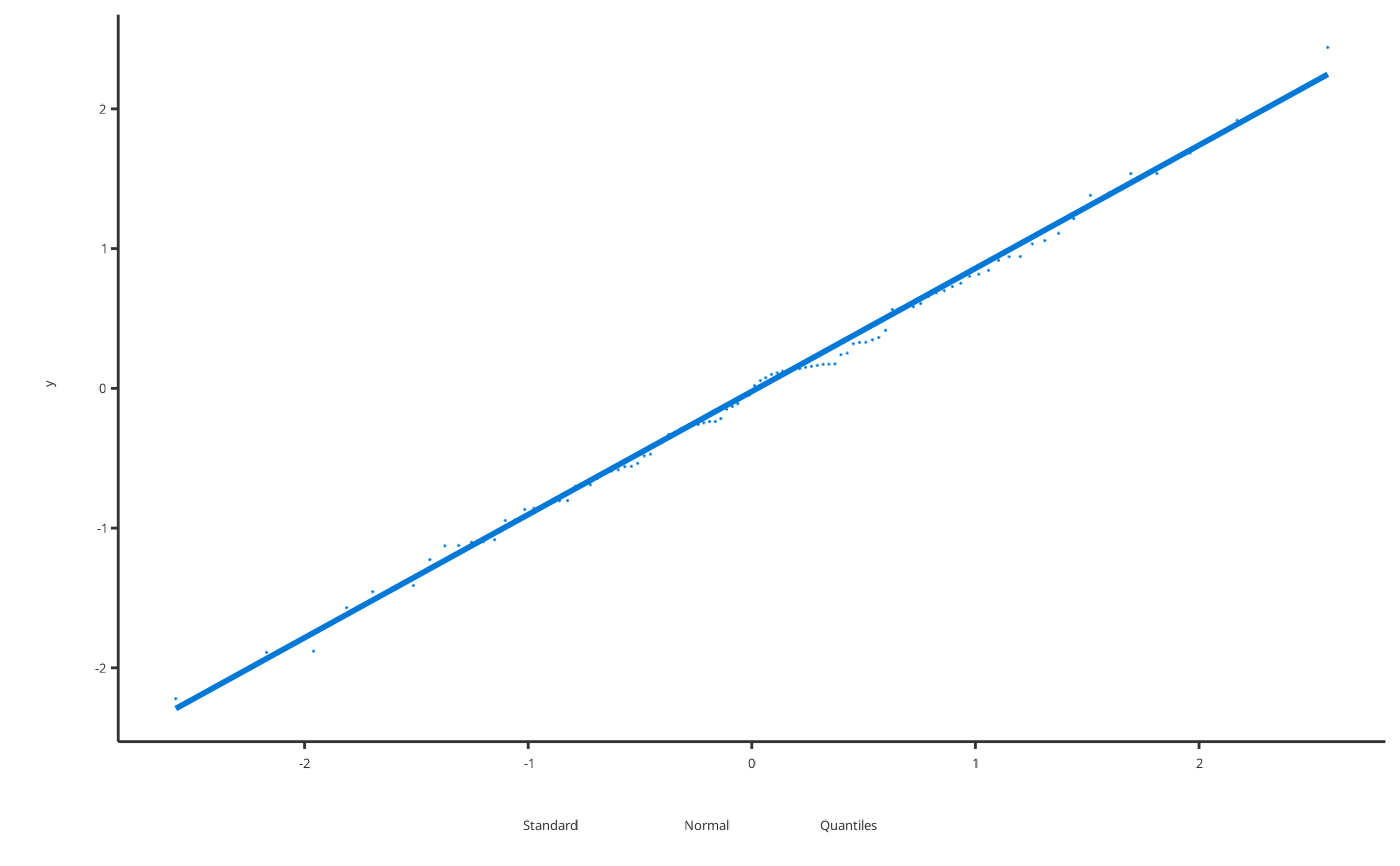
# Produce QQ plot of normally distributed data
plotQQ(y = rnorm(100))
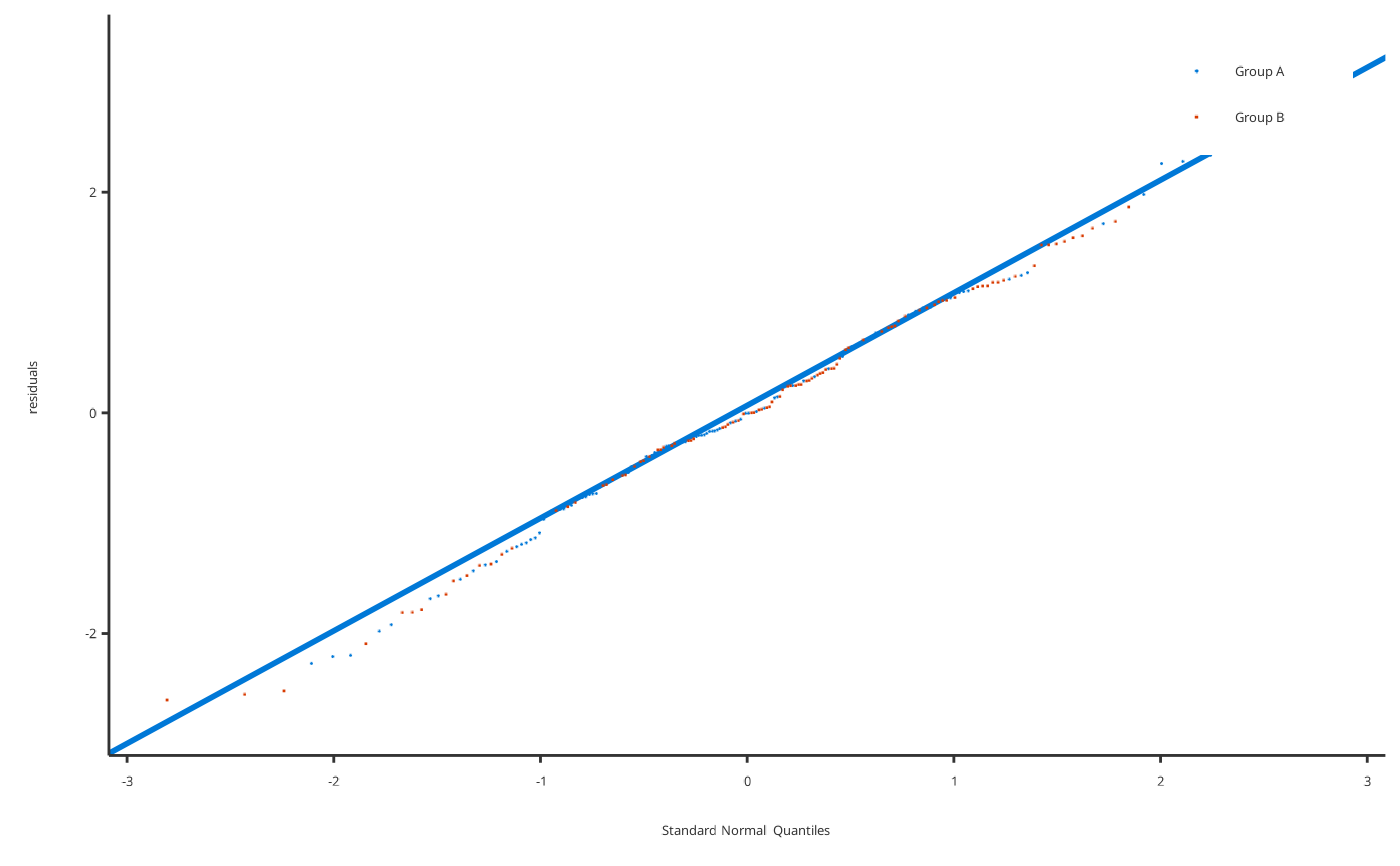
 # Produce QQ plot of normally distributed data split by group
qqData <- data.frame(
residuals = c(rnorm(100), rnorm(100)),
groups = c(rep("Group A", 100), rep("Group B", 100))
)
plotQQ(
data = qqData,
dataMapping = QQDataMapping$new(y = "residuals", group = "groups")
)
# Produce QQ plot of normally distributed data split by group
qqData <- data.frame(
residuals = c(rnorm(100), rnorm(100)),
groups = c(rep("Group A", 100), rep("Group B", 100))
)
plotQQ(
data = qqData,
dataMapping = QQDataMapping$new(y = "residuals", group = "groups")
)