Producing PK Ratio plots
Usage
plotPKRatio(
  data,
  metaData = NULL,
  dataMapping = NULL,
  plotConfiguration = NULL,
  foldDistance = NULL,
  plotObject = NULL
)
Arguments
- data
A data.frame to use for plot.
- metaData
A named list of information about
datasuch as thedimensionandunitof its variables.- dataMapping
A
PKRatioDataMappingobject mappingx,yand aesthetic groups to their variable names ofdata.- plotConfiguration
An optional
PKRatioPlotConfigurationobject defining labels, grid, background and watermark.- foldDistance
Numeric values of fold distance lines to display in log plots. This argument is internally translated into
linesfield ofdataMapping. Caution: this argument is meant for log scaled plots and since fold distance is a ratio it is expected positive. In particular, line of identity corresponds to afoldDistanceof1.- plotObject
An optional
ggplotobject on which to add the plot layer
References
For examples, see: https://www.open-systems-pharmacology.org/TLF-Library/articles/pk-ratio-vignette.html
Examples
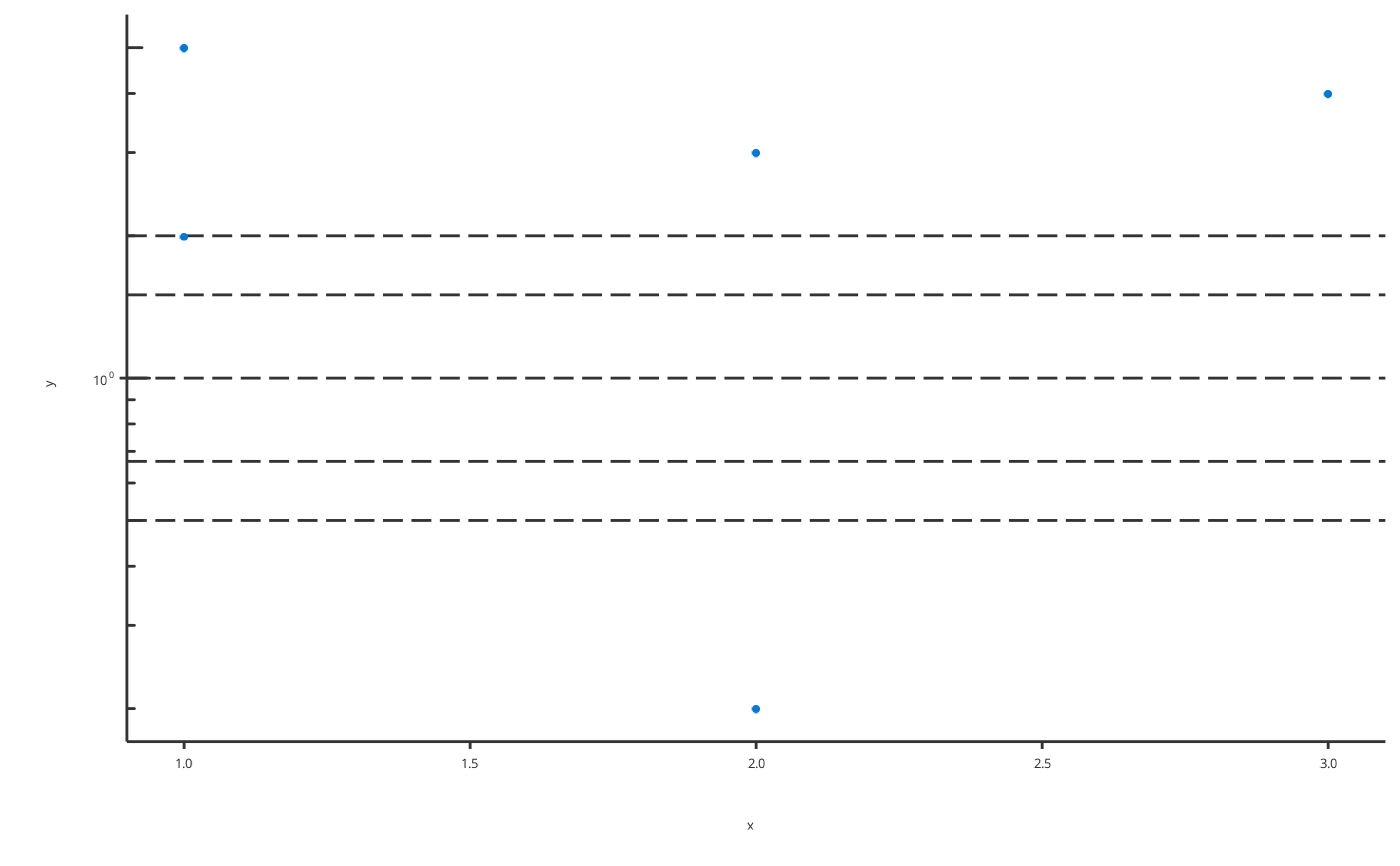
# Produce PK Ratio plot
pkData <- data.frame(x = c(1, 2, 1, 2, 3), y = c(5, 0.2, 2, 3, 4))
plotPKRatio(data = pkData, dataMapping = PKRatioDataMapping$new(x = "x", y = "y"))
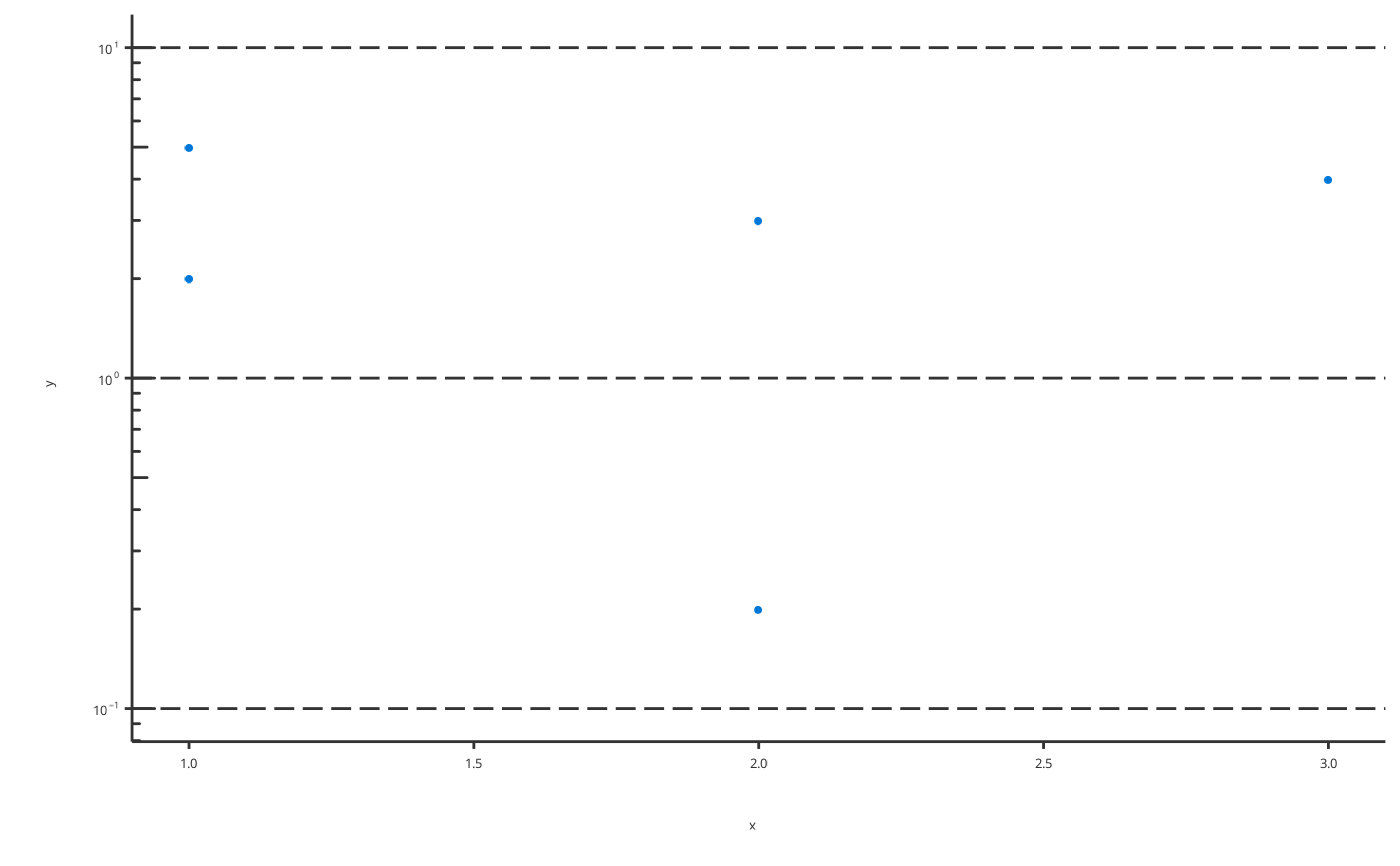
 # Produce PK Ratio plot with user-defined horizontal lines
plotPKRatio(
data = pkData,
dataMapping = PKRatioDataMapping$new(x = "x", y = "y"),
foldDistance = c(1, 10)
)
# Produce PK Ratio plot with user-defined horizontal lines
plotPKRatio(
data = pkData,
dataMapping = PKRatioDataMapping$new(x = "x", y = "y"),
foldDistance = c(1, 10)
)