Set x and y grid properties of a ggplot object
Arguments
- plotObject
A
ggplotobject- color
Optional character values defining the color of the grid. See
grDevices::colors()to get names of colors- linetype
Optional character values defining the linetype of the grid. See enum
Linetypesto get names of linetype.- size
Optional numeric values defining the size of the grid.
Examples
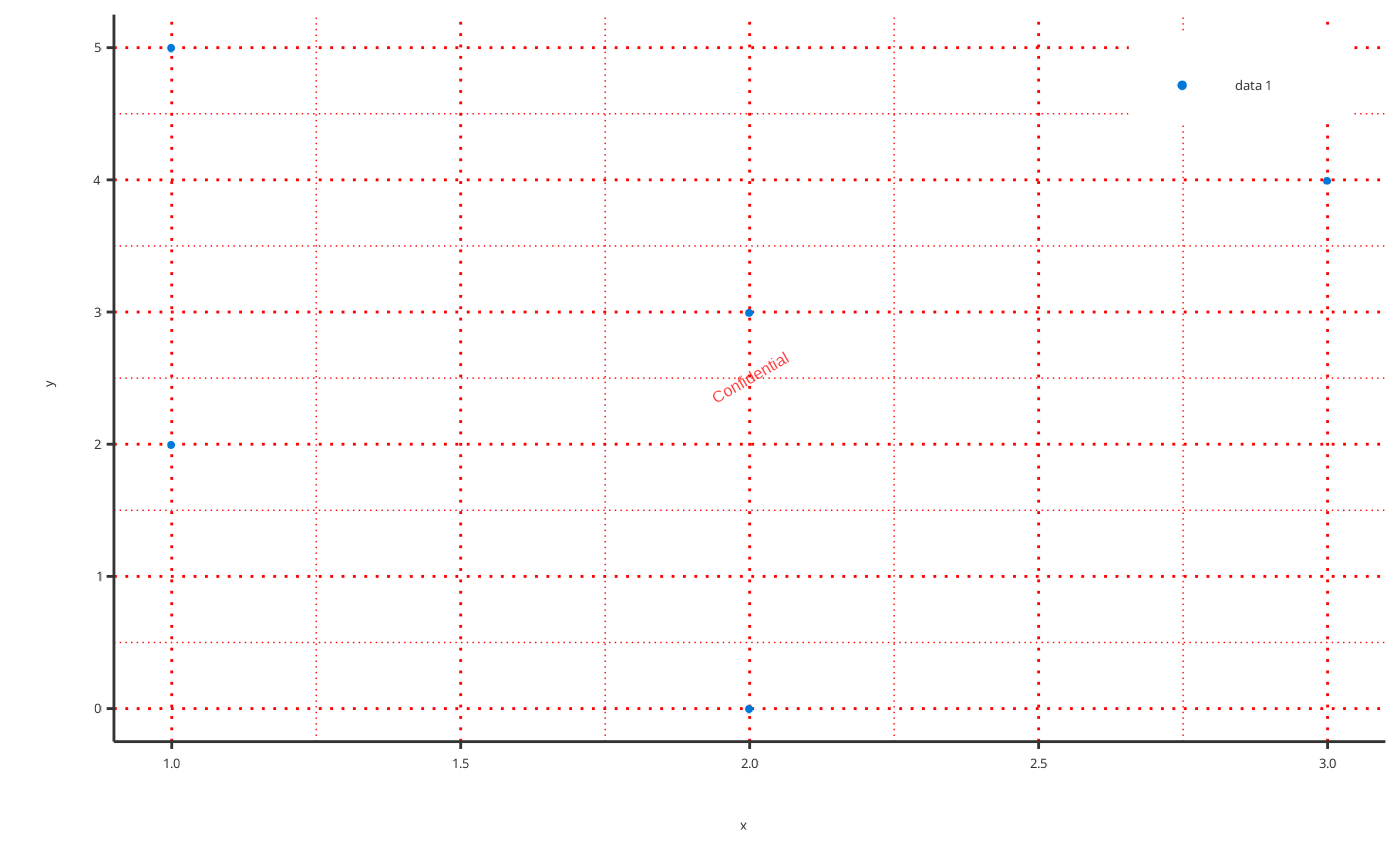
# Set grid of a scatter plot
p <- addScatter(x = c(1, 2, 1, 2, 3), y = c(5, 0, 2, 3, 4))

setGrid(p, color = "red", linetype = "dotted")