Add a scatter plot layer to a ggplot object
Usage
addScatter(
  data = NULL,
  metaData = NULL,
  x = NULL,
  y = NULL,
  caption = NULL,
  color = NULL,
  shape = NULL,
  size = NULL,
  linetype = NULL,
  dataMapping = NULL,
  plotConfiguration = NULL,
  plotObject = NULL
)
Arguments
- data
A data.frame to use for plot.
- metaData
A named list of information about
datasuch as thedimensionandunitof its variables.- x
Numeric values to plot along the
xaxis. Only used instead ofdataifdataisNULL.- y
Numeric values to plot along the
yaxis. Only used instead ofdataifdataisNULL.- caption
Optional character values defining the legend captions of the plot.
- color
Optional character values defining the colors of the plot layer. See
grDevices::colors()to get names of colors- shape
Optional character values defining the shapes/symbols of the plot layer. See enum
Shapesto get names of shapes.- size
Optional numeric values defining the size of the plot layer.
- linetype
Optional character values defining the linetype of the plot layer. See enum
Linetypesto get names of linetype.- dataMapping
A
XYGDataMappingobject mappingx,yand aesthetic groups to their variable names ofdata.- plotConfiguration
An optional
PlotConfigurationobject defining labels, grid, background and watermark.- plotObject
An optional
ggplotobject on which to add the plot layer
References
For examples, see: https://www.open-systems-pharmacology.org/TLF-Library/articles/atom-plots.html
See also
Other atom plots:
addErrorbar(),
addLine(),
addRibbon(),
initializePlot()
Examples
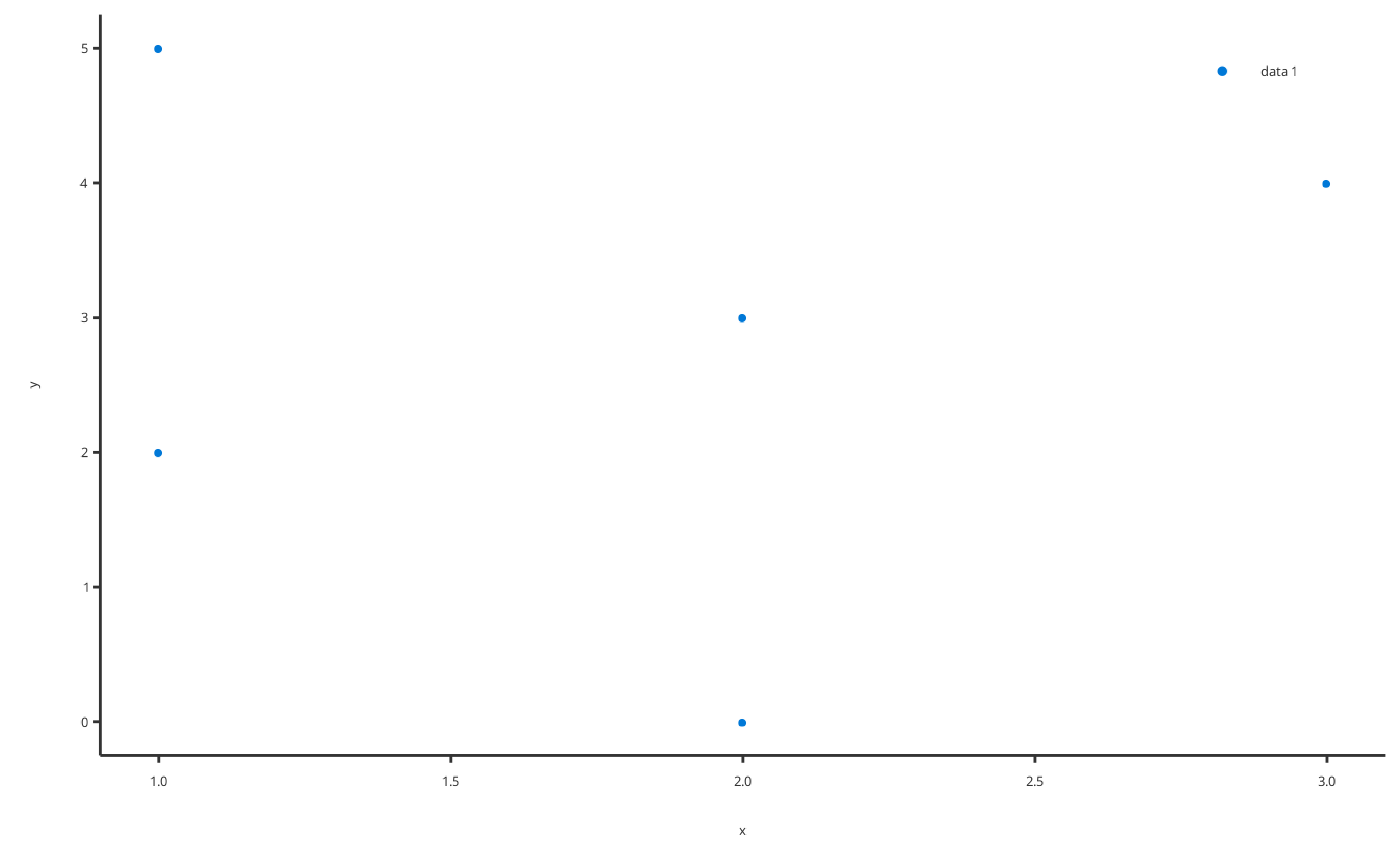
# Add scatter using x and y
addScatter(x = c(1, 2, 1, 2, 3), y = c(5, 0, 2, 3, 4))
 # Add scatter using a data.frame
time <- seq(0, 30, 0.1)
scatterData <- data.frame(x = time, y = cos(time))
addScatter(
data = scatterData,
dataMapping = XYGDataMapping$new(x = "x", y = "y")
)
# Add scatter using a data.frame
time <- seq(0, 30, 0.1)
scatterData <- data.frame(x = time, y = cos(time))
addScatter(
data = scatterData,
dataMapping = XYGDataMapping$new(x = "x", y = "y")
)
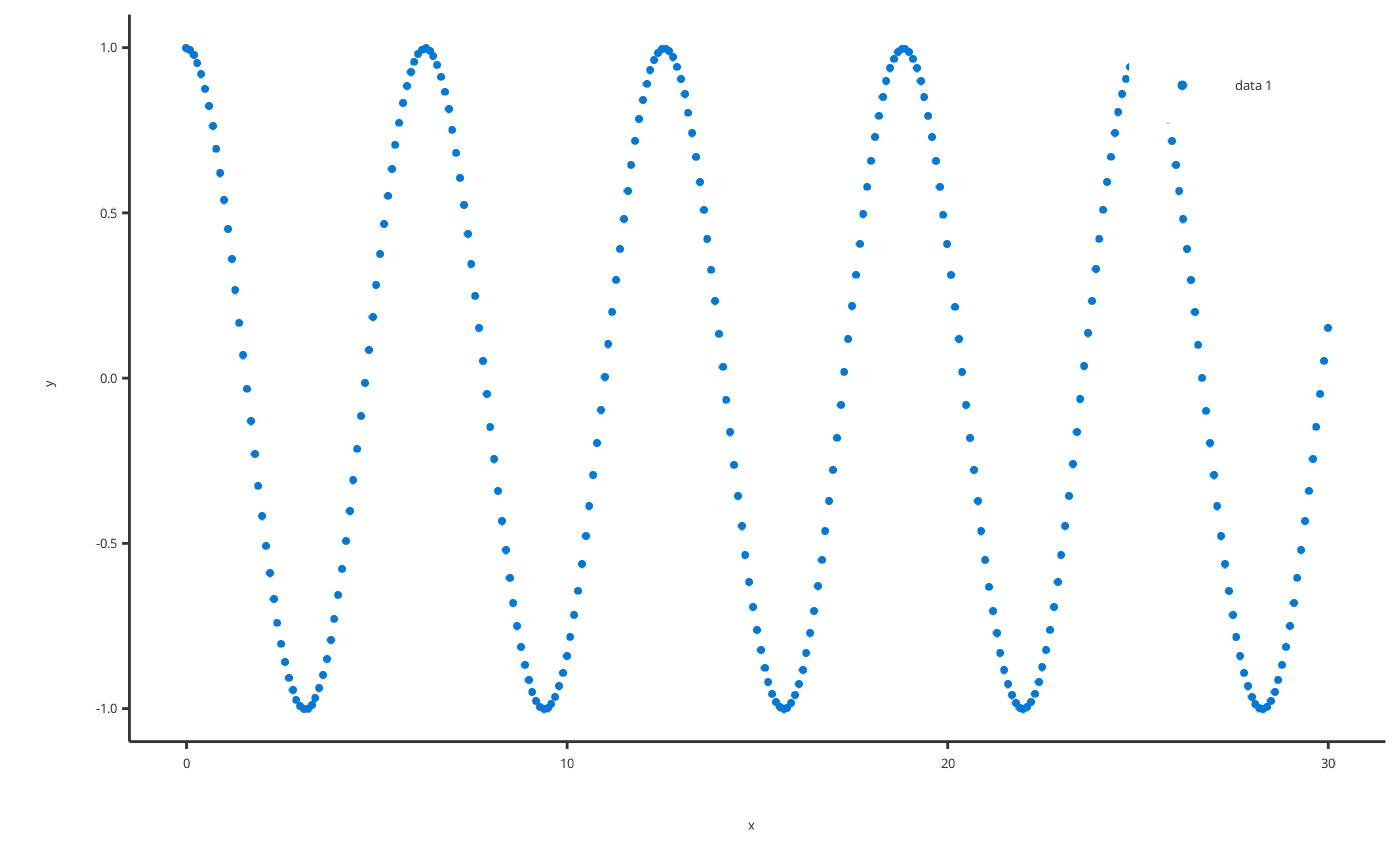 # Or for simple cases a smart mapping will get directly x and y from data
addScatter(data = scatterData)
# Or for simple cases a smart mapping will get directly x and y from data
addScatter(data = scatterData)
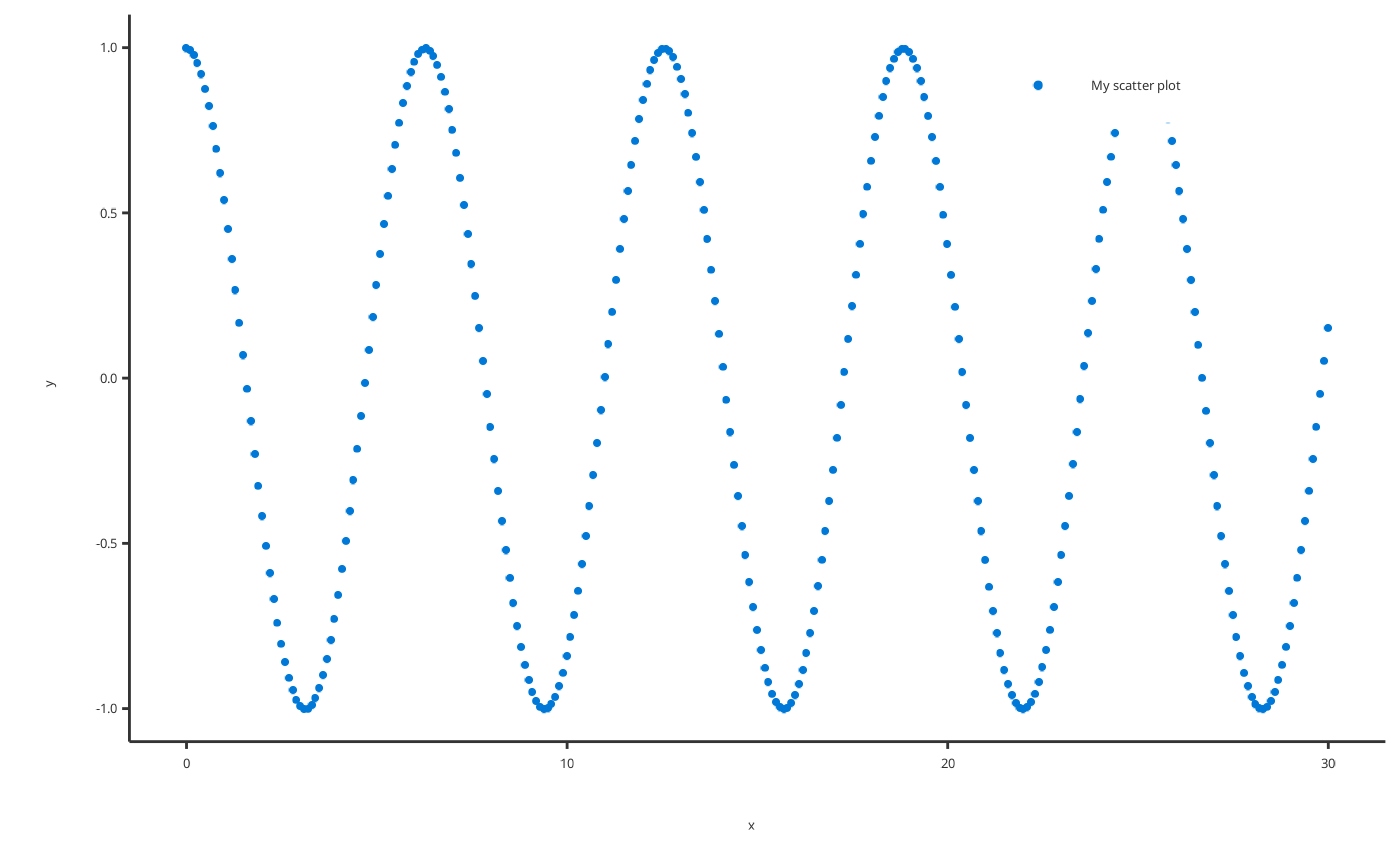
 # Add a scatter with caption
addScatter(data = scatterData, caption = "My scatter plot")
# Add a scatter with caption
addScatter(data = scatterData, caption = "My scatter plot")
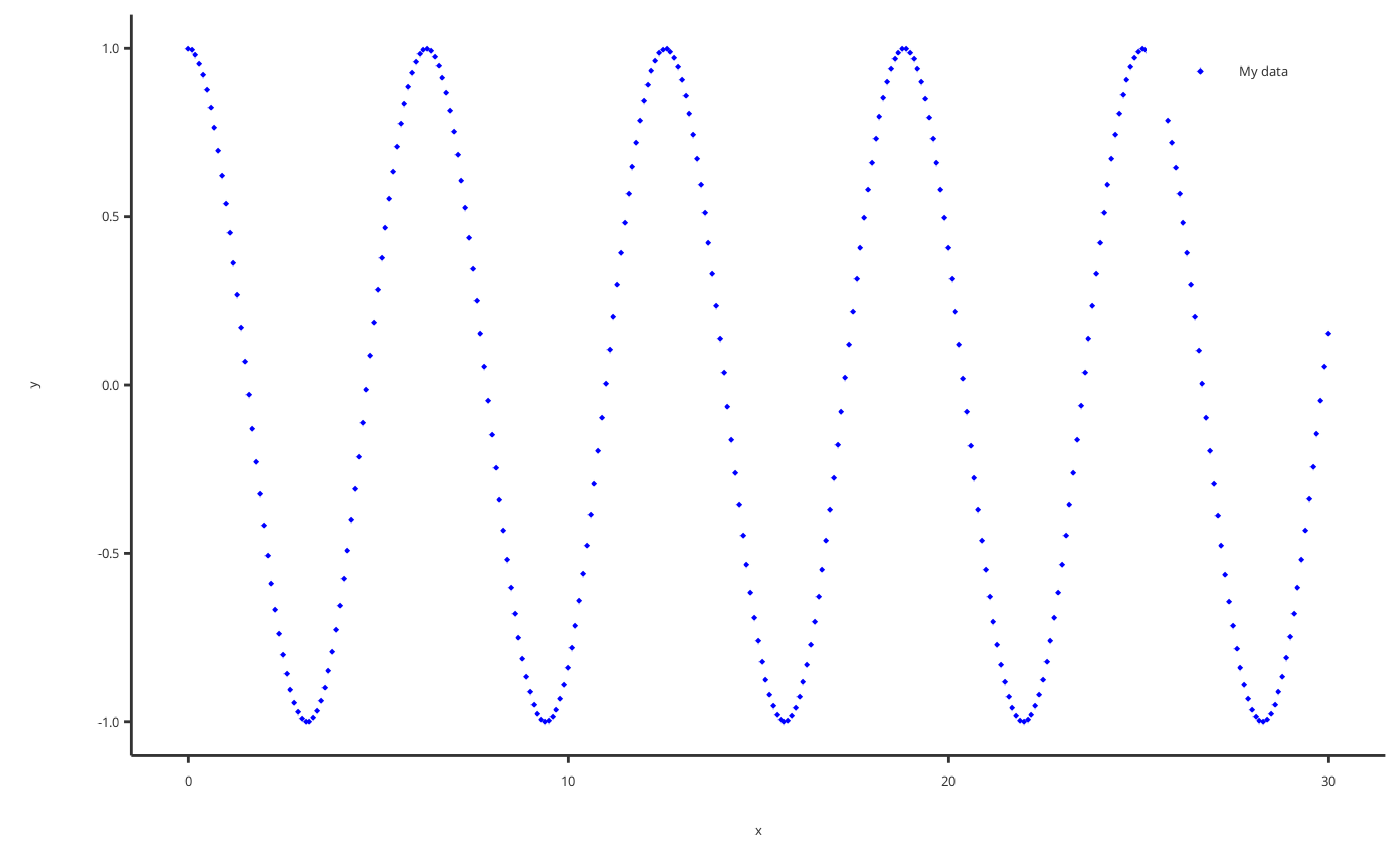
 # Add a scatter with specific properties
addScatter(
data = scatterData,
color = "blue", shape = "diamond", size = 2, caption = "My data"
)
# Add a scatter with specific properties
addScatter(
data = scatterData,
color = "blue", shape = "diamond", size = 2, caption = "My data"
)
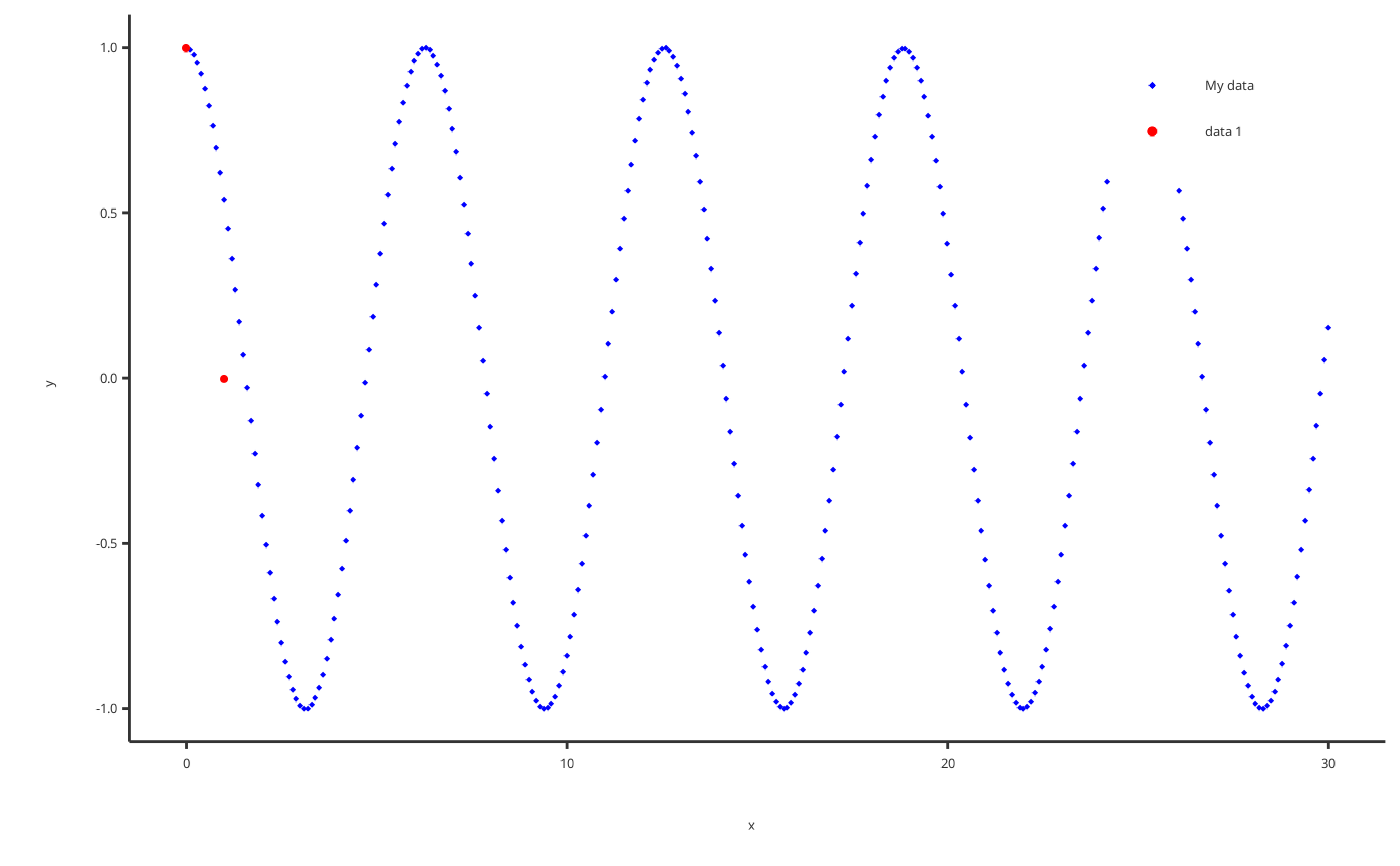
 # Add a scatter with specific properties
p <- addScatter(
data = scatterData,
color = "blue", shape = "diamond", size = 2, caption = "My data"
)
addScatter(
x = c(0, 1), y = c(1, 0),
color = "red", shape = "circle", size = 3,
plotObject = p
)
# Add a scatter with specific properties
p <- addScatter(
data = scatterData,
color = "blue", shape = "diamond", size = 2, caption = "My data"
)
addScatter(
x = c(0, 1), y = c(1, 0),
color = "red", shape = "circle", size = 3,
plotObject = p
)