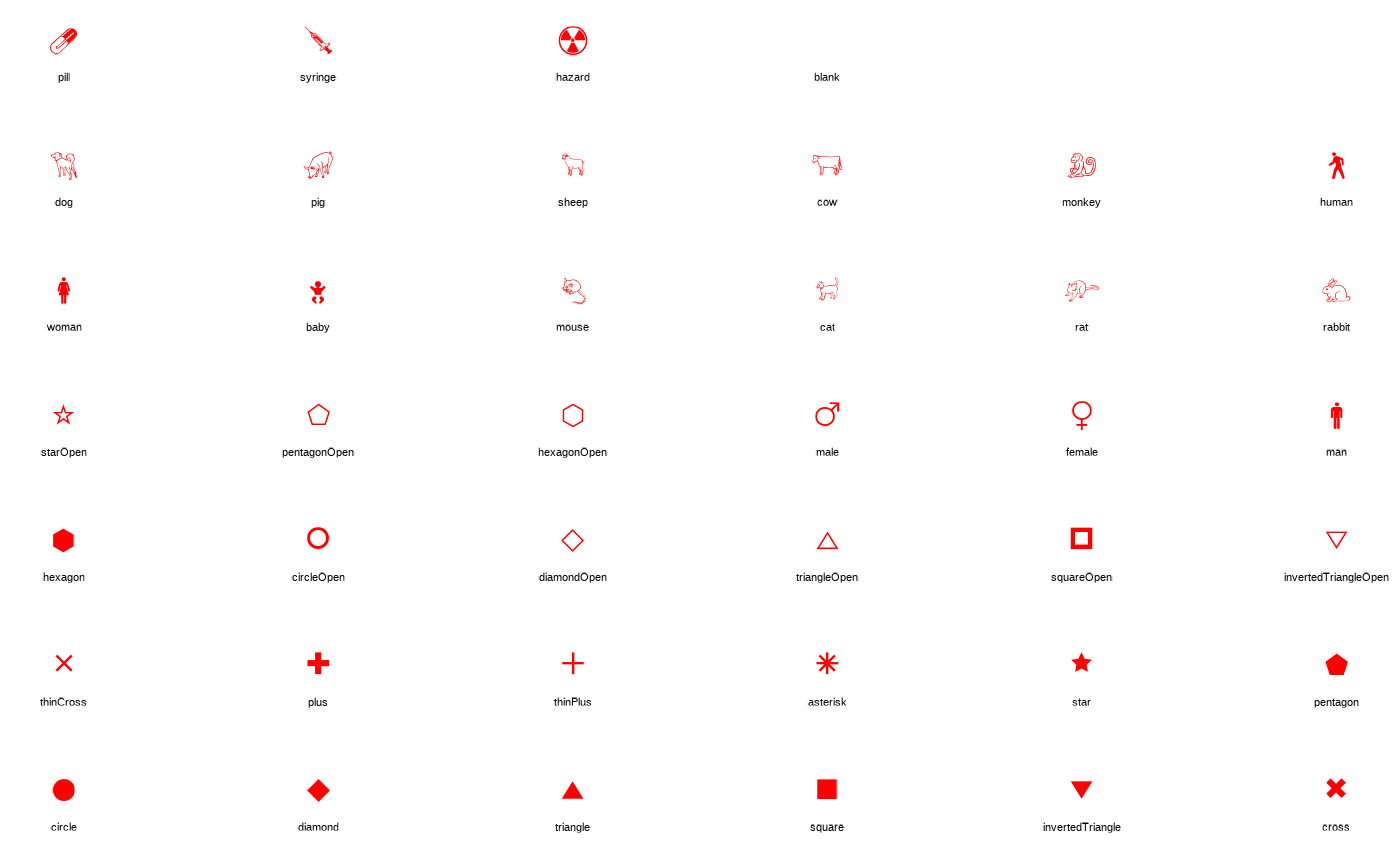
List of some ggplot2 shapes.
The shapes from this enum/list are unicode characters
corresponding to their appropriate shapes.
Note that user-defined characters are also accepted by geomTLFPoint()
See also
Other enum helpers:
AestheticFields,
AestheticProperties,
AestheticSelectionKeys,
Alignments,
AtomPlots,
ColorMaps,
ColorPalettes,
DataMappings,
DefaultDataMappingValues,
Directions,
ExportFormats,
ExportUnits,
FontFaces,
HorizontalJustification,
LegendPositions,
LegendTypes,
Linetypes,
MoleculePlots,
PlotAnnotationTextSize,
PlotConfigurations,
Scaling,
TagPositions,
TickLabelTransforms,
VerticalJustification,
tlfSettingsNames,
tlfStatFunctions
Examples
# Use ggplot2 to plot and label shapes
shapesData <- data.frame(
x = (seq_along(Shapes) - 1) %% 6,
y = floor((seq_along(Shapes) - 1) / 6),
shape = factor(names(Shapes), levels = names(Shapes))
)
ggplot2::ggplot(data = shapesData, ggplot2::aes(x, y)) +
ggplot2::theme_void() +
# Define size and color of shapes
geomTLFPoint(ggplot2::aes(shape = shape), size = 8, color = "red") +
# Add shape names from enum below the displayed shape
ggplot2::geom_text(ggplot2::aes(label = shape), nudge_y = -0.3, size = 3) +
# Use scale to display the actual shape
ggplot2::scale_shape_manual(values = as.character(unlist(Shapes))) +
# Remove the legend as the shape name is labelled below the shape
ggplot2::guides(shape = "none")
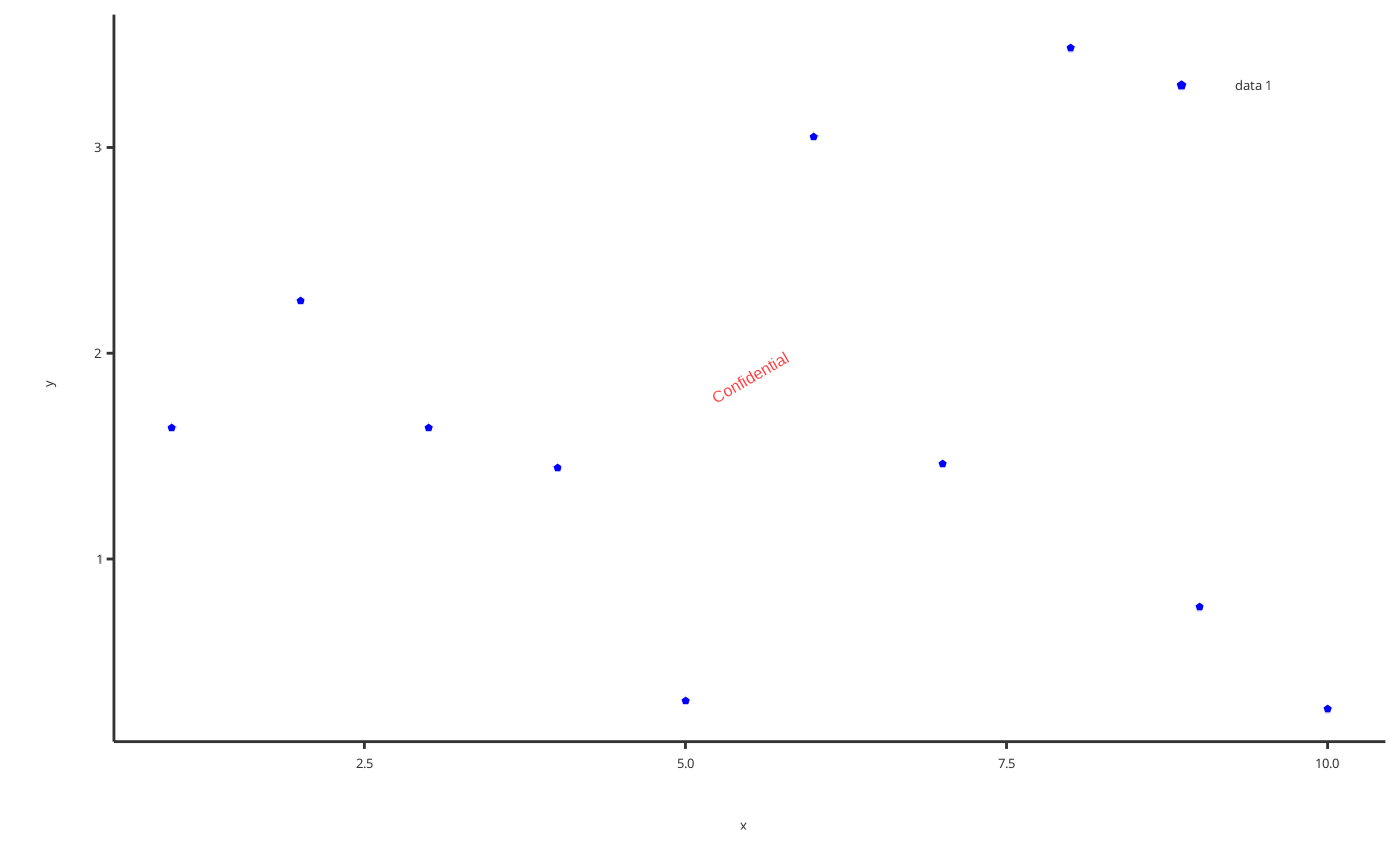
 # Perform a scatter plot with blue pentagons as shape
addScatter(
x = 1:10,
y = rlnorm(10),
shape = Shapes$pentagon,
color = "blue",
size = 3
)
# Perform a scatter plot with blue pentagons as shape
addScatter(
x = 1:10,
y = rlnorm(10),
shape = Shapes$pentagon,
color = "blue",
size = 3
)