require(ospsuite.reportingengine)
#> Loading required package: ospsuite.reportingengine
#> Loading required package: tlf
#> Loading required package: ospsuite
Overview
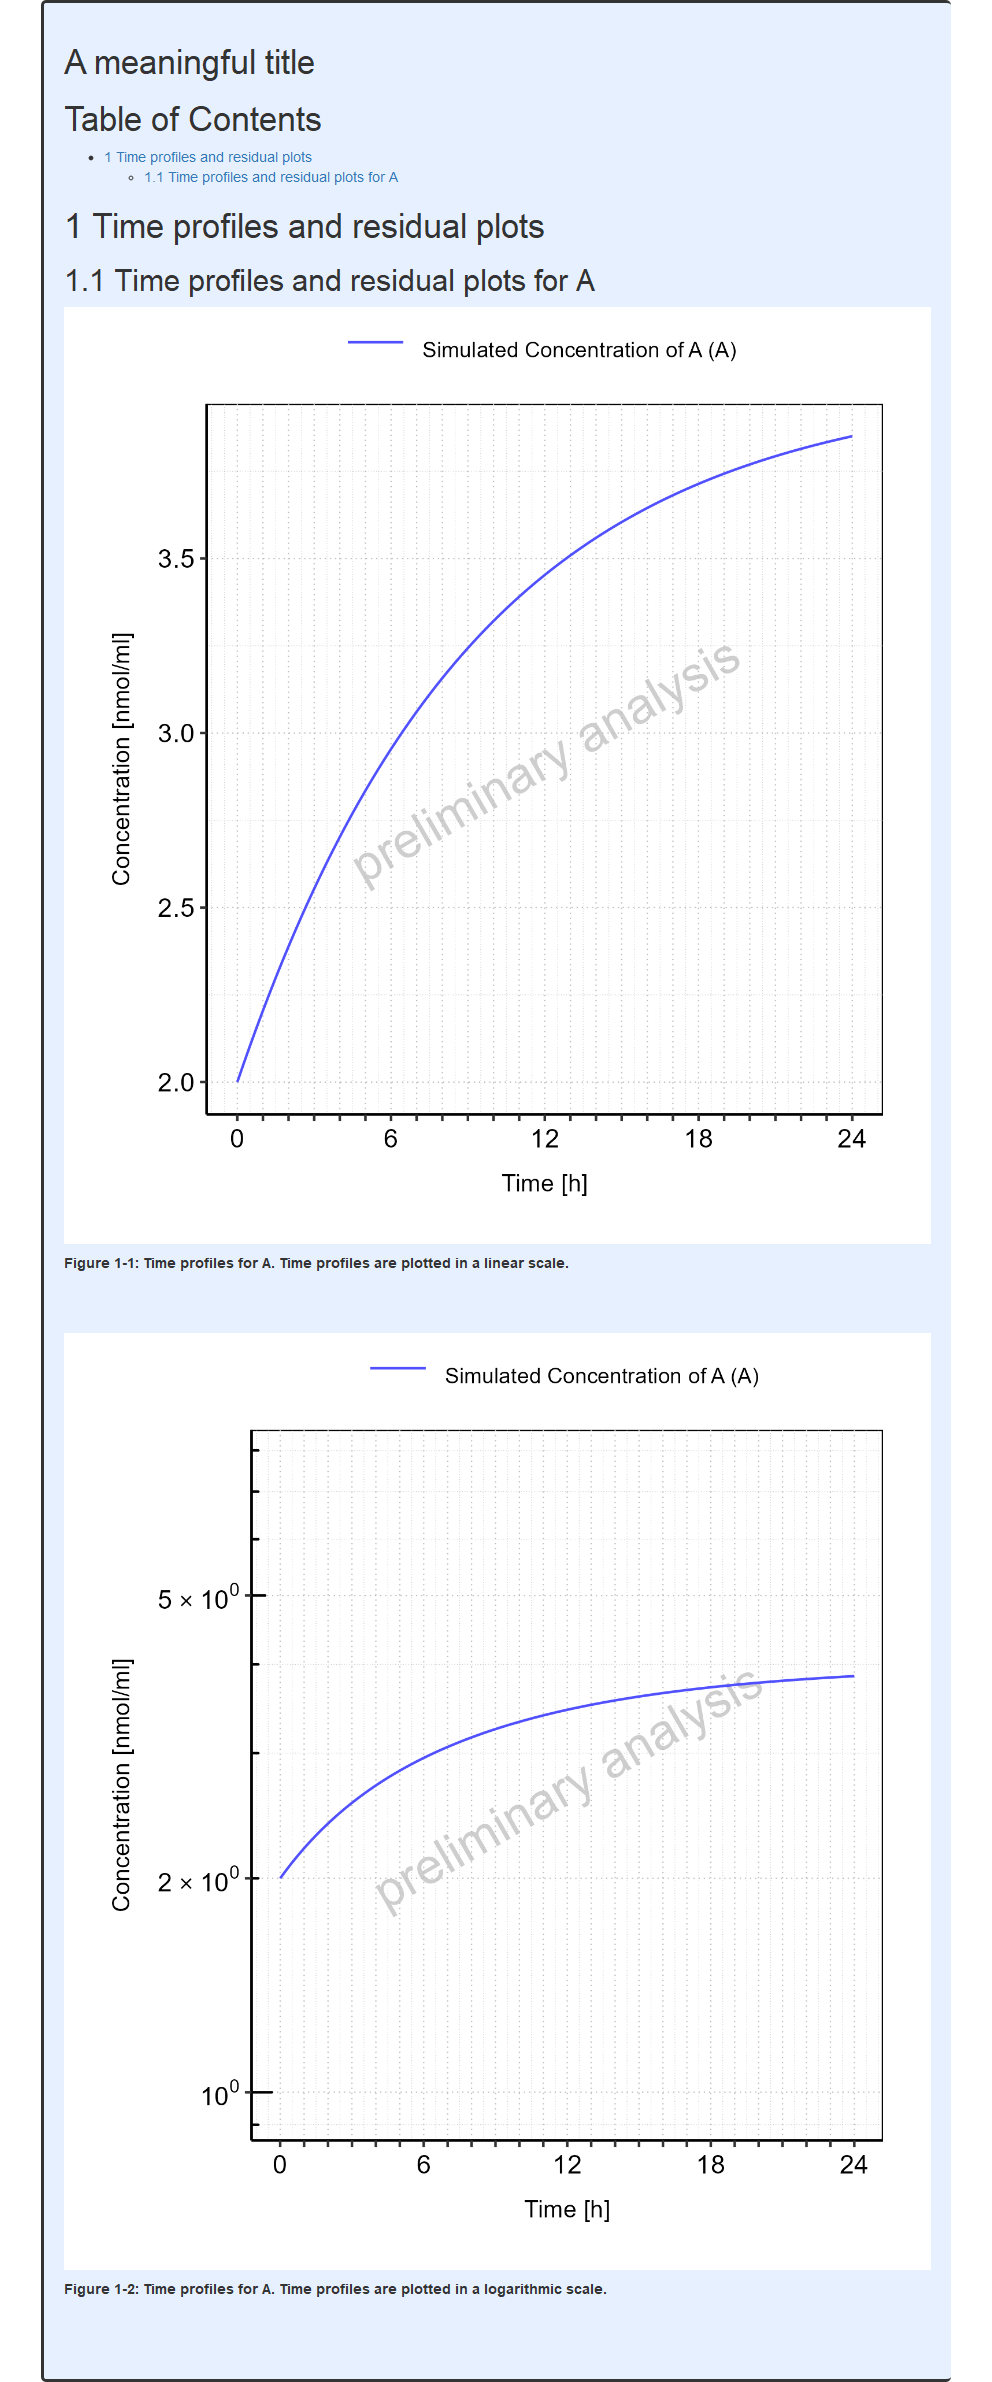
In Population workflows, the PK parameters task
(plotPKParameters) aims at reporting the distributions of
requested PK parameters that will account for the population workflow
type (as defined by variable PopulationWorkflowTypes). The
distributions are quantified with tables describing key statistics such
as percentiles and reported graphically using box and range plots.
Inputs
Results obtained from the calculatePKParameters task and
stored as csv files within the subdirectory
PKAnalysisResults from the workflowFolder
directory are required in order to perform the PK parameters
(plotPKParameters) task. As a consequence, if the workflow
output folder does not include the appropriate simulations, the task
calculatePKParameters needs to be
active.
Outputs
The PopulationSimulationSet and Output
objects define which and how the simulated PK parameters will be
reported. Especially, Output objects define from which
paths the PK Parameters are calculated.
The code below defines the files that will be used for the definition
of the population simulation sets as well as the Output
object describing the PK parameters to display in the report.
Code
# Define file paths for pkml simulation and populations
simulationFile <- system.file("extdata", "MiniModel2.pkml",
  package = "ospsuite.reportingengine"
)
populationFile500 <- system.file("extdata", "Pop500_p1p2p3.csv",
  package = "ospsuite.reportingengine"
)
populationFile200 <- system.file("extdata", "Pop200_p1p2p3.csv",
  package = "ospsuite.reportingengine"
)

# Update PK Parameters to display appropriate names in reports
updatePKParameter("C_max", displayName = "Cmax")
#> <PKParameter>
#>   • Name: C_max
#>   • DisplayName: Cmax
#>   • Dimension: Concentration (molar)
#>   • DisplayUnit: µmol/l
updatePKParameter("AUC_tEnd", displayName = "AUC")
#> <PKParameter>
#>   • Name: AUC_tEnd
#>   • DisplayName: AUC
#>   • Dimension: AUC (molar)
#>   • DisplayUnit: µmol*min/l

# Define paths and PK parameters to report
outputA <- Output$new(
  path = "Organism|A|Concentration in container",
  displayName = "A",
  pkParameters = c("C_max", "AUC_tEnd")
)
Parallel Comparison
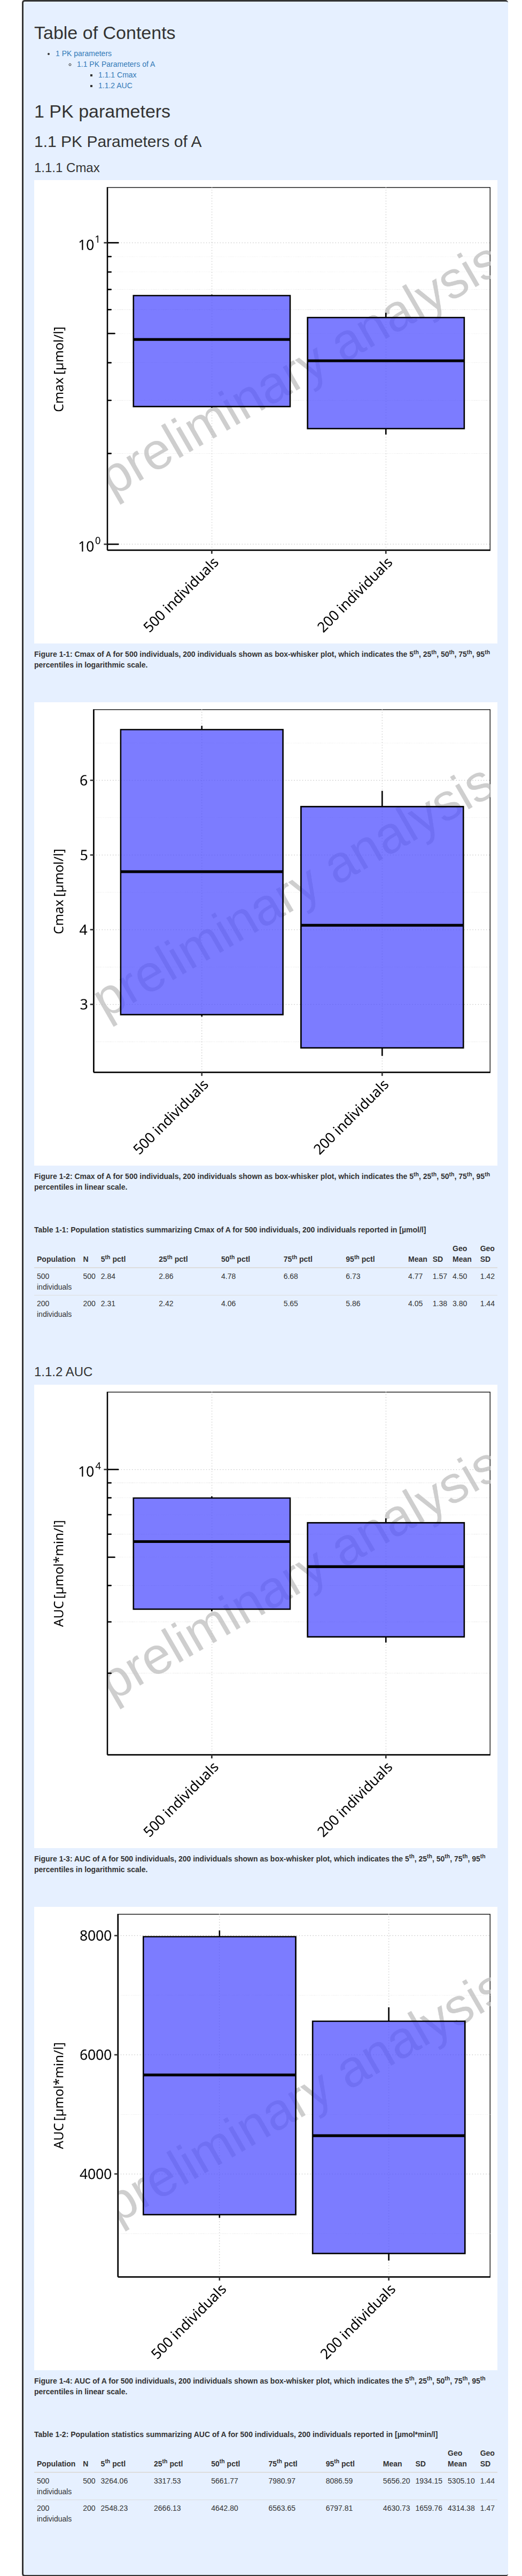
In the parallelComparison workflow type, the
distributions are graphically reported by box-whisker plots displaying
5th, 25th, 50th, 75th and
95th percentiles in both linear and logarithmic scales.
Moreover, a table reporting for each population simulation set, its name, size, 5th, 25th, 50th, 75th and 95th percentiles, arithmetic mean, standard deviation (SD) and coefficient of variation (CV) as well as geometric mean, SD and CV.
Example
Code
# Define the populations to report
set500 <- PopulationSimulationSet$new(
  simulationSetName = "500 individuals",
  simulationFile = simulationFile,
  populationFile = populationFile500,
  outputs = outputA
)
set200 <- PopulationSimulationSet$new(
  simulationSetName = "200 individuals",
  simulationFile = simulationFile,
  populationFile = populationFile200,
  outputs = outputA
)

# Create the workflow object
workflowParallel <-
  PopulationWorkflow$new(
    workflowType = PopulationWorkflowTypes$parallelComparison,
    simulationSets = c(set500, set200),
    workflowFolder = "Example-Pop-PK"
  )
#> 28/07/2025 - 09:45:19
#> i Info  Reporting Engine Information:
#>  Date: 28/07/2025 - 09:45:19
#>  User Information:
#>  Computer Name: pkrvmpptgkbjq6m
#>  User: runner
#>  Login: unknown
#>  System is NOT validated
#>  System versions:
#>  R version: R version 4.5.1 (2025-06-13)
#>  OSP Suite Package version: 12.3.0.9001
#>  OSP Reporting Engine version: 2.3.11
#>  tlf version: 1.6.0

# Set the workflow tasks to be run
workflowParallel$activateTasks(c("simulate", "calculatePKParameters", "plotPKParameters"))

# Run the workflow
workflowParallel$runWorkflow()
#> 28/07/2025 - 09:45:20
#> i Info  Starting run of Population Workflow for parallelComparison
#> 28/07/2025 - 09:45:20
#> i Info  Starting run of Simulation task
#> 28/07/2025 - 09:45:20
#> i Info  Starting run of Population Simulations
#>   |                                                                              |                                                                      |   0%
#> 28/07/2025 - 09:45:20
#> i Info  Starting run of 500 individuals (Pop500_p1p2p3)
#>   |                                                                              |===================================                                   |  50%
#> 28/07/2025 - 09:45:20
#> i Info  Starting run of 200 individuals (Pop200_p1p2p3)
#>   |                                                                              |======================================================================| 100%
#>
#> 28/07/2025 - 09:45:21
#> i Info  Simulation task completed in 0 min
#> 28/07/2025 - 09:45:21
#> i Info  Starting run of Calculate PK Parameters task
#>   |                                                                              |                                                                      |   0%
#> 28/07/2025 - 09:45:21
#> i Info  Starting run of Calculate PK Parameters task for 500 individuals
#>   |                                                                              |===================================                                   |  50%
#> 28/07/2025 - 09:45:21
#> i Info  Starting run of Calculate PK Parameters task for 200 individuals
#>   |                                                                              |======================================================================| 100%
#>
#> 28/07/2025 - 09:45:21
#> i Info  Calculate PK Parameters task completed in 0 min
#> 28/07/2025 - 09:45:21
#> i Info  Starting run of Plot PK Parameters task
#> 28/07/2025 - 09:45:27
#> i Info  Plot PK Parameters task completed in 0.1 min
#> 28/07/2025 - 09:45:27
#> i Info  Executing: pandoc --embed-resources --standalone --wrap=none --toc --from=markdown+tex_math_dollars+superscript+subscript+raw_attribute --reference-doc="/home/runner/work/_temp/Library/ospsuite.reportingengine/extdata/reference.docx" --resource-path="Example-Pop-PK" -t docx -o 'Example-Pop-PK/Report-word.docx' 'Example-Pop-PK/Report-word.md'
#>
#> 28/07/2025 - 09:45:27
#> i Info  Population Workflow for parallelComparison completed in 0.1 min
#> file:////home/runner/work/OSPSuite.ReportingEngine/OSPSuite.ReportingEngine/vignettes/Example-Pop-PK/Report.html screenshot completedReport
Ratio Comparison
In the ratioComparison workflow type, tables and figures
from the Parallel Comparison workflow
are reported.
Moreover, the distributions of ratios of PK Parameters relative to the reference population are also reported. The distributions of PK ratios are graphically reported by box-whisker plots displaying 5th, 25th, 50th, 75th and 95th percentiles of the PK Ratios in both linear and logarithmic scales. A table will also report for each population simulation set (except for the reference population), its ratio in population size and the 5th, 25th, 50th, 75th and 95th percentiles, arithmetic mean, standard deviation (SD) and coefficient of variation (CV) as well as geometric mean, SD and CV of the PK ratios.
The computation of the PK ratios will account for matching between the reference population and the populations to compare as described below.
Same Population
When the population to compare is the same as the reference
population, PK ratios will be evaluated for each subject of the
population (per IndividualId) as the individual ratios of
each PK Parameter value. The distributions of the corresponding PK
Parameter Ratios will be reported.
Different Populations
When the population to compare is different from the
reference population, PK ratios cannot be evaluated for
each subject of the population (per IndividualId). However,
the potential PK ratios between the populations can be approximated by
Monte Carlo sampling.
In more details, random sampling of the population that includes more subjects is performed in order to obtain 2 populations with the same size. The populations are then assumed the same and PK ratios are evaluated for each subject of the population as the individual ratios of each PK Parameter value (same method as section Same Population). Key statistics of the corresponding distribution are calculated. The final key statistics will be calculated as the median value obtained over all the repeated random samplings.
Since analytical formulas exist for the calculation of arithmetic and geometric means, SDs and CVs, the quality of the approximation calculated on the percentiles of the ratios will be assessed, reported in the logs.
The random seed and number of repetitions for the random samplings
can also be checked and set by the user globally as illustrated below.
But also locally within the workflow task
(workflow$calculatePKParameters$settings$mcRandomSeed)
# Get the random seed for the MC sampling
getDefaultMCRandomSeed()
#> [1] 123456

# Get the number of repetitions of the MC sampling
getDefaultMCRepetitions()
#> [1] 10000
# Set a new random seed for the MC sampling
setDefaultMCRandomSeed(54321)
# Set the number of repetitions of the MC sampling
setDefaultMCRepetitions(1e2)
Example
In this example, a Ratio Comparison population workflow is performed between different populations. Note that the quality and parameters of approximation from the Monte Carlo sampling is reported in the logs and displayed on the console.
Code
# Define reference population
set500 <- PopulationSimulationSet$new(
referencePopulation = TRUE,
simulationSetName = "500 individuals",
simulationFile = simulationFile,
populationFile = populationFile500,
outputs = outputA
)
# Define population to be compared
set200 <- PopulationSimulationSet$new(
simulationSetName = "200 individuals",
simulationFile = simulationFile,
populationFile = populationFile200,
outputs = outputA
)
# Create the workflow object
ratioWorkflow <-
PopulationWorkflow$new(
workflowType = PopulationWorkflowTypes$ratioComparison,
simulationSets = c(set500, set200),
workflowFolder = "Example-Pop-PK"
)
#> 28/07/2025 - 09:45:30
#> i Info Reporting Engine Information:
#> Date: 28/07/2025 - 09:45:29
#> User Information:
#> Computer Name: pkrvmpptgkbjq6m
#> User: runner
#> Login: unknown
#> System is NOT validated
#> System versions:
#> R version: R version 4.5.1 (2025-06-13)
#> OSP Suite Package version: 12.3.0.9001
#> OSP Reporting Engine version: 2.3.11
#> tlf version: 1.6.0
# Update settings to display the progress bar of the MC Simulations
# and use less simulation to speed up the workflow
ratioWorkflow$calculatePKParameters$settings$showProgress <- TRUE
ratioWorkflow$calculatePKParameters$settings$mcRepetitions <- 100
# Set the workflow tasks to be run
# Re-use the results from the previous PK analysis to save time as results are the same
ratioWorkflow$inactivateTasks()
ratioWorkflow$activateTasks(c("calculatePKParameters", "plotPKParameters"))
# Run the workflow
ratioWorkflow$runWorkflow()
#> 28/07/2025 - 09:45:30
#> i Info Starting run of Population Workflow for ratioComparison
#> 28/07/2025 - 09:45:30
#> i Info Starting run of Calculate PK Parameters task
#> | | | 0%
#> 28/07/2025 - 09:45:30
#> i Info Starting run of Calculate PK Parameters task for 500 individuals
#> | |=================================== | 50%
#> 28/07/2025 - 09:45:30
#> i Info Starting run of Calculate PK Parameters task for 200 individuals
#> | |======================================================================| 100%
#>
#> 28/07/2025 - 09:45:30
#> i Info Simulation Set '200 individuals' was identified with population different from reference '500 individuals'.
#> Ratio comparison will use Monte Carlo Sampling for analyzing statistics.
#> 28/07/2025 - 09:45:31
#> i Info Monte Carlo Sampling for 200 individuals will use 100 repetitions with Random Seed 123456
#> | | | 0% | |= | 1% | |= | 2% | |== | 3% | |=== | 4% | |==== | 5% | |==== | 6% | |===== | 7% | |====== | 8% | |====== | 9% | |======= | 10% | |======== | 11% | |======== | 12% | |========= | 13% | |========== | 14% | |========== | 15% | |=========== | 16% | |============ | 17% | |============= | 18% | |============= | 19% | |============== | 20% | |=============== | 21% | |=============== | 22% | |================ | 23% | |================= | 24% | |================== | 25% | |================== | 26% | |=================== | 27% | |==================== | 28% | |==================== | 29% | |===================== | 30% | |====================== | 31% | |====================== | 32% | |======================= | 33% | |======================== | 34% | |======================== | 35% | |========================= | 36% | |========================== | 37% | |=========================== | 38% | |=========================== | 39% | |============================ | 40% | |============================= | 41% | |============================= | 42% | |============================== | 43% | |=============================== | 44% | |================================ | 45% | |================================ | 46% | |================================= | 47% | |================================== | 48% | |================================== | 49% | |=================================== | 50% | |==================================== | 51% | |==================================== | 52% | |===================================== | 53% | |====================================== | 54% | |====================================== | 55% | |======================================= | 56% | |======================================== | 57% | |========================================= | 58% | |========================================= | 59% | |========================================== | 60% | |=========================================== | 61% | |=========================================== | 62% | |============================================ | 63% | |============================================= | 64% | |============================================== | 65% | |============================================== | 66% | |=============================================== | 67% | |================================================ | 68% | |================================================ | 69% | |================================================= | 70% | |================================================== | 71% | |================================================== | 72% | |=================================================== | 73% | |==================================================== | 74% | |==================================================== | 75% | |===================================================== | 76% | |====================================================== | 77% | |======================================================= | 78% | |======================================================= | 79% | |======================================================== | 80% | |========================================================= | 81% | |========================================================= | 82% | |========================================================== | 83% | |=========================================================== | 84% | |============================================================ | 85% | |============================================================ | 86% | |============================================================= | 87% | |============================================================== | 88% | |============================================================== | 89% | |=============================================================== | 90% | |================================================================ | 91% | |================================================================ | 92% | |================================================================= | 93% | |================================================================== | 94% | |================================================================== | 95% | |=================================================================== | 96% | |==================================================================== | 97% | |===================================================================== | 98% | |===================================================================== | 99% | |======================================================================| 100%
#> 28/07/2025 - 09:45:31
#> i Info Monte Carlo Sampling completed in 0 min
#> 28/07/2025 - 09:45:31
#> ! Warning There were 2 warnings in `summarise()`.
#> The first warning was:
#> ℹ In argument: `MeanLog = mean(log(Value), na.rm = TRUE)`.
#> ℹ In group 11: `QuantityPath = "Organism|A|Concentration in container"`
#> `Parameter = "Thalf"`.
#> Caused by warning in `log()`:
#> ! NaNs produced
#> ℹ Run `dplyr::last_dplyr_warnings()` to see the 1 remaining warning.
#> 28/07/2025 - 09:45:31
#> i Info Calculate PK Parameters task completed in 0 min
#> 28/07/2025 - 09:45:31
#> i Info Starting run of Plot PK Parameters task
#> 28/07/2025 - 09:45:31
#> ! Warning 'Example-Pop-PK/PKAnalysis' already exists
#> 28/07/2025 - 09:45:40
#> i Info Plot PK Parameters task completed in 0.1 min
#> 28/07/2025 - 09:45:40
#> i Info Executing: pandoc --embed-resources --standalone --wrap=none --toc --from=markdown+tex_math_dollars+superscript+subscript+raw_attribute --reference-doc="/home/runner/work/_temp/Library/ospsuite.reportingengine/extdata/reference.docx" --resource-path="Example-Pop-PK" -t docx -o 'Example-Pop-PK/Report-word.docx' 'Example-Pop-PK/Report-word.md'
#>
#> 28/07/2025 - 09:45:40
#> i Info Population Workflow for ratioComparison completed in 0.2 min#> file:////home/runner/work/OSPSuite.ReportingEngine/OSPSuite.ReportingEngine/vignettes/Example-Pop-PK/Report.html screenshot completedReport

Pediatric
In the pediatric workflow type, tables and figures from
the Parallel Comparison workflow are
reported.
Additionally, range plots in both linear and logarithmic scales are also reported. They describe the distributions of the PK Parameters as a function the following population variables “Organism|Age”, “Organism|Height”, “Organism|Weight”, “Organism|BMI”, “Gender”.
Variables displayed as xParameters in such range plots can be changed from the default as detailed within section Optional features
Since Pediatric workflows require a reference population, they also report range plots that include the distribution of the reference population in parallel of the other populations.
Moreover, the table of key statistics ratios comparing key statistics of each population to key statistics of the reference population is included in the report. This table is optional for Parallel Comparison workflows (more details in section Reference Population but automatically included in Pediatric workflows.
Example
In this example, a Pediatric population workflow is performed. Here, the populations do not include age and body weight in the model but parameters p1, p2 and p3. The parameter path p3 was used as the only xParameters for the range plots and the reference population was the population simulation set including 500 individuals.
Code
# Define reference population
set500 <- PopulationSimulationSet$new(
  referencePopulation = TRUE,
  simulationSetName = "500 individuals",
  simulationFile = simulationFile,
  populationFile = populationFile500,
  outputs = outputA
)
# Define population to be compared
set200 <- PopulationSimulationSet$new(
  simulationSetName = "200 individuals",
  simulationFile = simulationFile,
  populationFile = populationFile200,
  outputs = outputA
)

# Create the workflow object
pediatricWorkflow <-
  PopulationWorkflow$new(
    workflowType = PopulationWorkflowTypes$pediatric,
    simulationSets = c(set500, set200),
    workflowFolder = "Example-Pop-PK"
  )
#> 28/07/2025 - 09:45:43
#> i Info  Reporting Engine Information:
#>  Date: 28/07/2025 - 09:45:43
#>  User Information:
#>  Computer Name: pkrvmpptgkbjq6m
#>  User: runner
#>  Login: unknown
#>  System is NOT validated
#>  System versions:
#>  R version: R version 4.5.1 (2025-06-13)
#>  OSP Suite Package version: 12.3.0.9001
#>  OSP Reporting Engine version: 2.3.11
#>  tlf version: 1.6.0

# Set the workflow tasks to be run
# Re-use the results from the previous PK analysis to save time as results are the same
pediatricWorkflow$inactivateTasks()
pediatricWorkflow$activateTasks("plotPKParameters")

# Define paths to be reported as xParameters in range plots
setXParametersForPKParametersPlot(pediatricWorkflow, "Organism|p3")

# Run the workflow
pediatricWorkflow$runWorkflow()
#> 28/07/2025 - 09:45:43
#> i Info  Starting run of Population Workflow for pediatric
#> 28/07/2025 - 09:45:43
#> i Info  Starting run of Plot PK Parameters task
#> 28/07/2025 - 09:45:43
#> ! Warning   'Example-Pop-PK/PKAnalysis' already exists
#> 28/07/2025 - 09:45:57
#> i Info  Plot PK Parameters task completed in 0.2 min
#> 28/07/2025 - 09:45:57
#> i Info  Executing: pandoc --embed-resources --standalone --wrap=none --toc --from=markdown+tex_math_dollars+superscript+subscript+raw_attribute --reference-doc="/home/runner/work/_temp/Library/ospsuite.reportingengine/extdata/reference.docx" --resource-path="Example-Pop-PK" -t docx -o 'Example-Pop-PK/Report-word.docx' 'Example-Pop-PK/Report-word.md'
#>
#> 28/07/2025 - 09:45:58
#> i Info  Population Workflow for pediatric completed in 0.2 min
#> file:////home/runner/work/OSPSuite.ReportingEngine/OSPSuite.ReportingEngine/vignettes/Example-Pop-PK/Report.html screenshot completedReport

Optional features
Range plots
In population workflows, the PK Parameters task includes an optional
setting named xParameters meant to provide variables
for performing range plots describing the 5th,
25th, 50th, 75th and 95th
percentiles of the PK Parameters as a function of the
xParameters. Usually, xParameters are
paths defined in the population that could influence the distributions
of the PK Parameters such as the standard paths defined in
ospsuite::StandardPath.
With default settings, only Pediatric population workflows include the standard paths as xParameters and perform the range plots.
# Check default xParameters for pediatric workflows
getDefaultPKParametersXParameters(PopulationWorkflowTypes$pediatric)
#> $Age
#> [1] "Organism|Age"
#>
#> $Height
#> [1] "Organism|Height"
#>
#> $Weight
#> [1] "Organism|Weight"
#>
#> $BMI
#> [1] "Organism|BMI"
#>
#> $Gender
#> [1] "Gender"

# Check default xParameters for parallel comparison workflows
getDefaultPKParametersXParameters(PopulationWorkflowTypes$parallelComparison)
#> NULL

# Check default xParameters for ratio comparison workflows
getDefaultPKParametersXParameters(PopulationWorkflowTypes$ratioComparison)
#> NULL
However, you can report range plots for every population workflow type by including paths/variables defined in your population as xParameters as illustrated below.
# Create your population workflow
workflow <- PopulationWorkflow$new(workflowType = PopulationWorkflowTypes$parallelComparison, ...)

# Check if variables were included
getXParametersForPKParametersPlot(workflow)

# Set the xParameters for range plots of PK Parameters as a function of Age
setXParametersForPKParametersPlot(workflow, ospsuite::StandardPath$Age)
Example
In this example, a parallel comparison workflow is performed using xParameters for range plots
Code
# Define population simulations
set500 <- PopulationSimulationSet$new(
  simulationSetName = "500 individuals",
  simulationFile = simulationFile,
  populationFile = populationFile500,
  outputs = outputA
)
set200 <- PopulationSimulationSet$new(
  simulationSetName = "200 individuals",
  simulationFile = simulationFile,
  populationFile = populationFile200,
  outputs = outputA
)

# Create the workflow object
parallelRangeWorkflow <-
  PopulationWorkflow$new(
    workflowType = PopulationWorkflowTypes$parallelComparison,
    simulationSets = c(set500, set200),
    workflowFolder = "Example-Pop-PK"
  )
#> 28/07/2025 - 09:46:01
#> i Info  Reporting Engine Information:
#>  Date: 28/07/2025 - 09:46:01
#>  User Information:
#>  Computer Name: pkrvmpptgkbjq6m
#>  User: runner
#>  Login: unknown
#>  System is NOT validated
#>  System versions:
#>  R version: R version 4.5.1 (2025-06-13)
#>  OSP Suite Package version: 12.3.0.9001
#>  OSP Reporting Engine version: 2.3.11
#>  tlf version: 1.6.0

# Set the workflow tasks to be run
# Re-use the results from the previous PK analysis to save time as results are the same
parallelRangeWorkflow$inactivateTasks()
parallelRangeWorkflow$activateTasks("plotPKParameters")

# Define paths to be reported as xParameters in range plots
setXParametersForPKParametersPlot(parallelRangeWorkflow, "Organism|p3")

# Run the workflow
parallelRangeWorkflow$runWorkflow()
#> 28/07/2025 - 09:46:01
#> i Info  Starting run of Population Workflow for parallelComparison
#> 28/07/2025 - 09:46:01
#> i Info  Starting run of Plot PK Parameters task
#> 28/07/2025 - 09:46:01
#> ! Warning   'Example-Pop-PK/PKAnalysis' already exists
#> 28/07/2025 - 09:46:11
#> i Info  Plot PK Parameters task completed in 0.2 min
#> 28/07/2025 - 09:46:11
#> i Info  Executing: pandoc --embed-resources --standalone --wrap=none --toc --from=markdown+tex_math_dollars+superscript+subscript+raw_attribute --reference-doc="/home/runner/work/_temp/Library/ospsuite.reportingengine/extdata/reference.docx" --resource-path="Example-Pop-PK" -t docx -o 'Example-Pop-PK/Report-word.docx' 'Example-Pop-PK/Report-word.md'
#>
#> 28/07/2025 - 09:46:11
#> i Info  Population Workflow for parallelComparison completed in 0.2 min
#> file:////home/runner/work/OSPSuite.ReportingEngine/OSPSuite.ReportingEngine/vignettes/Example-Pop-PK/Report.html screenshot completedReport

Reference Population
Unlike Pediatric and Ratio Comparison, Parallel Comparison workflows does not require a reference population.
Inclusion of a reference population in the Parallel Comparison workflow will report an additional table comparing the following statistics to the ones of the reference population: size, 5th, 25th, 50th, 75th and 95th percentiles, arithmetic mean, SD and CV as well as geometric mean, SD and CV.
Example
In this example, a parallel comparison workflow is performed using a reference population
Code
# Define reference population
set500 <- PopulationSimulationSet$new(
  referencePopulation = TRUE,
  simulationSetName = "500 individuals",
  simulationFile = simulationFile,
  populationFile = populationFile500,
  outputs = outputA
)
# Define population to be compared
set200 <- PopulationSimulationSet$new(
  simulationSetName = "200 individuals",
  simulationFile = simulationFile,
  populationFile = populationFile200,
  outputs = outputA
)

# Create the workflow object
parallelReferenceWorkflow <-
  PopulationWorkflow$new(
    workflowType = PopulationWorkflowTypes$parallelComparison,
    simulationSets = c(set500, set200),
    workflowFolder = "Example-Pop-PK"
  )
#> 28/07/2025 - 09:46:14
#> i Info  Reporting Engine Information:
#>  Date: 28/07/2025 - 09:46:14
#>  User Information:
#>  Computer Name: pkrvmpptgkbjq6m
#>  User: runner
#>  Login: unknown
#>  System is NOT validated
#>  System versions:
#>  R version: R version 4.5.1 (2025-06-13)
#>  OSP Suite Package version: 12.3.0.9001
#>  OSP Reporting Engine version: 2.3.11
#>  tlf version: 1.6.0

# Set the workflow tasks to be run
# Re-use the results from the previous PK analysis to save time as results are the same
parallelReferenceWorkflow$inactivateTasks()
parallelReferenceWorkflow$activateTasks("plotPKParameters")

# Run the workflow
parallelReferenceWorkflow$runWorkflow()
#> 28/07/2025 - 09:46:14
#> i Info  Starting run of Population Workflow for parallelComparison
#> 28/07/2025 - 09:46:14
#> i Info  Starting run of Plot PK Parameters task
#> 28/07/2025 - 09:46:14
#> ! Warning   'Example-Pop-PK/PKAnalysis' already exists
#> 28/07/2025 - 09:46:21
#> i Info  Plot PK Parameters task completed in 0.1 min
#> 28/07/2025 - 09:46:21
#> i Info  Executing: pandoc --embed-resources --standalone --wrap=none --toc --from=markdown+tex_math_dollars+superscript+subscript+raw_attribute --reference-doc="/home/runner/work/_temp/Library/ospsuite.reportingengine/extdata/reference.docx" --resource-path="Example-Pop-PK" -t docx -o 'Example-Pop-PK/Report-word.docx' 'Example-Pop-PK/Report-word.md'
#>
#> 28/07/2025 - 09:46:21
#> i Info  Population Workflow for parallelComparison completed in 0.1 min
#> file:////home/runner/work/OSPSuite.ReportingEngine/OSPSuite.ReportingEngine/vignettes/Example-Pop-PK/Report.html screenshot completedReport