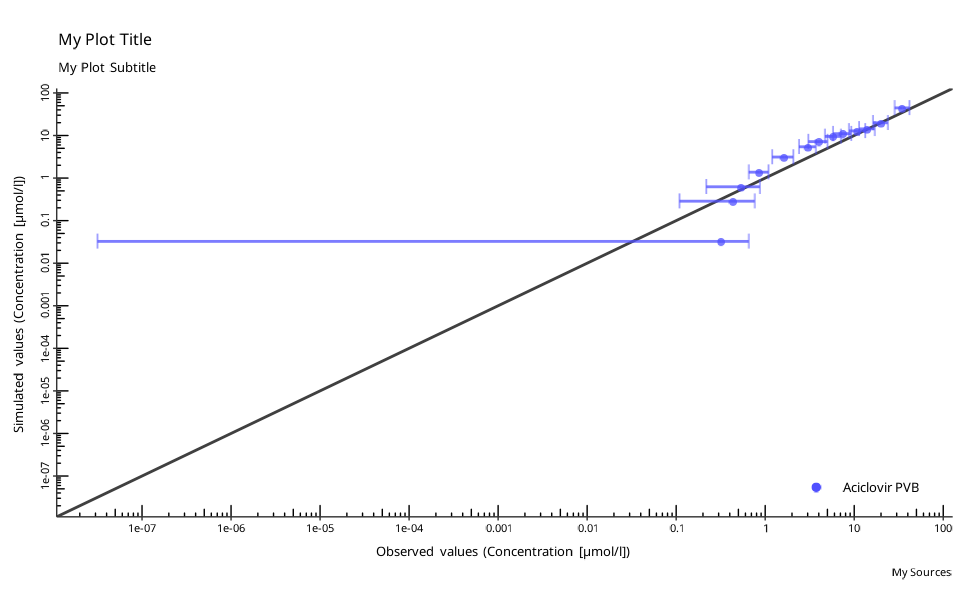
Observed versus predicted/simulated scatter plot
Source:R/plot-observed-vs-simulated.R
plotObservedVsSimulated.Rd![[Deprecated]](figures/lifecycle-deprecated.svg)
Arguments
- dataCombined
A single instance of
DataCombinedclass containing both observed and simulated datasets to be compared.- defaultPlotConfiguration
A
DefaultPlotConfigurationobject, which is anR6class object that defines plot properties.- foldDistance
A vector for plotting lines at required fold distances around the identity line (
x=y). Set to NULL (default) to only draw identity line. Set to FALSE to not draw any lines. The vector can include only fold distance values>1. Anx-fold distance is defined as all simulated values within the range betweenx-fold (depicted by the upper fold range line) and1/x-fold (depicted by the lower fold range line) of observed values. The identity line can be interpreted as the1-fold range.
Examples
# Create a new instance of `DefaultPlotConfiguration` class
myPlotConfiguration <- DefaultPlotConfiguration$new()
myPlotConfiguration$title <- "My Plot Title"
myPlotConfiguration$subtitle <- "My Plot Subtitle"
myPlotConfiguration$caption <- "My Sources"

# plot
plotObservedVsSimulated(dataCombinedAciclovir, myPlotConfiguration)
#> Warning: `plotObservedVsSimulated()` was deprecated in ospsuite 12.4.2.
#> ℹ Please use `plotPredictedVsObserved()` instead.
#> ℹ It will be removed in version 14.0.