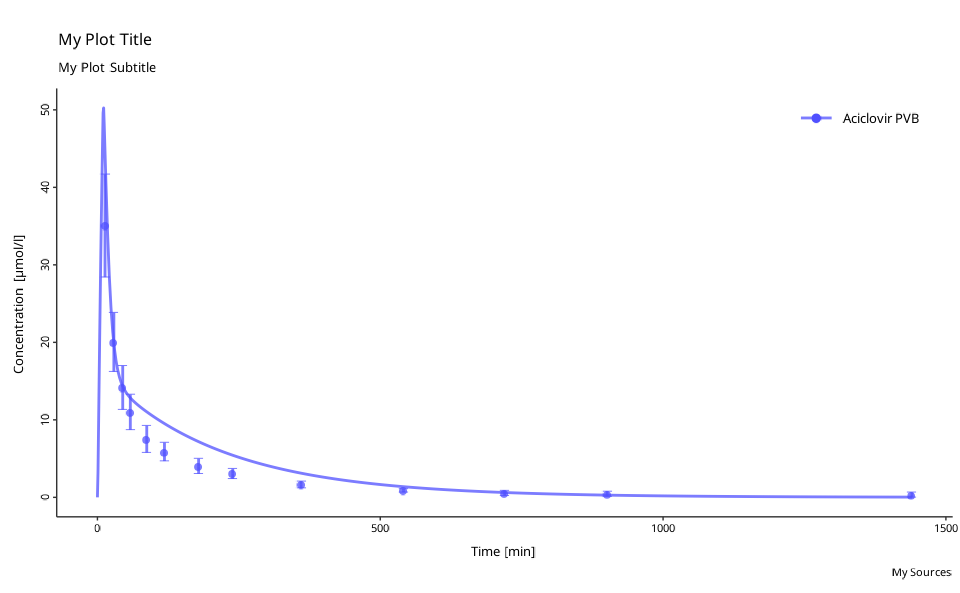
Time-profile plot of individual data
Source:R/plot-individual-time-profile.R
plotIndividualTimeProfile.RdTime-profile plot of individual data
Usage
plotIndividualTimeProfile(
  dataCombined,
  defaultPlotConfiguration = NULL,
  showLegendPerDataset = FALSE
)
Arguments
- dataCombined
A single instance of
DataCombinedclass containing both observed and simulated datasets to be compared.- defaultPlotConfiguration
A
DefaultPlotConfigurationobject, which is anR6class object that defines plot properties.- showLegendPerDataset
Logical flag to display separate legend entries for observed and simulated datasets, if available. This is experimental and may not work reliably when both observed and simulated datasets > 1. Defaults to
FALSE.
Examples
# simulated data
simFilePath <- system.file("extdata", "Aciclovir.pkml", package = "ospsuite")
sim <- loadSimulation(simFilePath)
simResults <- runSimulations(sim)[[1]]
outputPath <- "Organism|PeripheralVenousBlood|Aciclovir|Plasma (Peripheral Venous Blood)"

# observed data
obsData <- lapply(
  c("ObsDataAciclovir_1.pkml", "ObsDataAciclovir_2.pkml", "ObsDataAciclovir_3.pkml"),
  function(x) loadDataSetFromPKML(system.file("extdata", x, package = "ospsuite"))
)
names(obsData) <- lapply(obsData, function(x) x$name)


# Create a new instance of `DataCombined` class
myDataCombined <- DataCombined$new()

# Add simulated results
myDataCombined$addSimulationResults(
  simulationResults = simResults,
  quantitiesOrPaths = outputPath,
  groups = "Aciclovir PVB"
)

# Add observed data set
myDataCombined$addDataSets(obsData$`Vergin 1995.Iv`, groups = "Aciclovir PVB")

# Create a new instance of `DefaultPlotConfiguration` class
myPlotConfiguration <- DefaultPlotConfiguration$new()
myPlotConfiguration$title <- "My Plot Title"
myPlotConfiguration$subtitle <- "My Plot Subtitle"
myPlotConfiguration$caption <- "My Sources"

# plot
plotIndividualTimeProfile(myDataCombined, myPlotConfiguration)
