library(ospsuite.reportingengine)
#> Loading required package: tlf
#> Loading required package: ospsuite
#>
#> Attaching package: 'ospsuite'
#> The following object is masked from 'package:tlf':
#>
#>     plotTimeProfile
#> Warning: replacing previous import 'ospsuite::plotTimeProfile' by
#> 'tlf::plotTimeProfile' when loading 'ospsuite.reportingengine'
Overview
In Population workflows, the Demography task
(plotDemography) aims at reporting the distributions of
requested Demography parameters that will account for the population
workflow type (as defined by variable
PopulationWorkflowTypes). The distributions are reported
graphically using histograms or range plots depending on the workflow
settings.
Inclusion of observed data
Observed data can be included in the demography plots for comparison.
- In Parallel and Ratio Comparison histograms, observed demography distributions will be displayed along with the simulated demography distribution.
- In Pediatric histograms, the distributions of all the simulated populations are displayed together in the same figure, observed distributions of all the populations are also displayed together in the same figure.
- In range plots, observed demography distributions will be displayed along with the simulated demography distribution.
As illustrated below, DataSource objects are necessary
to include observed data in demography plots.
Code
# Define file paths for pkml simulation and populations
dictionary <- system.file("extdata", "popDictionary.csv",
  package = "ospsuite.reportingengine"
)
dataFile <- system.file("extdata", "obsPop.csv",
  package = "ospsuite.reportingengine"
)

dataSource <- DataSource$new(
  dataFile = dataFile,
  metaDataFile = dictionary,
  caption = "Demography vignette example"
)
In this process, the dictionary input as metaDataFile is
essential. Three columns of the dictionary are used by the workflow in
order to map and convert the demography parameters.
- pathID: Defines the path of the demography parameter to include
- datasetColumn: Defines the column name of the demography parameter in your dataset
- datasetUnit: Defines the unit of the demography parameter in your dataset
The 2 next table shows the dictionary and the first rows of the observed data used in our example.
Dictionary
| ID | type | datasetColumn | datasetUnit | reportName | pathID | comment |
|---|---|---|---|---|---|---|
| age | covariate | AGE | year(s) | Age | Organism|Age | |
| weight | covariate | WEIGHT | kg | Weight | Organism|Weight | |
| gender | covariate | GENDER | Gender | Gender | Make sure to use same names as in Population |
Observed Data
| ID | GENDER | POP | WEIGHT | AGE |
|---|---|---|---|---|
| 0 | MALE | Adults | 52 | 16 |
| 1 | MALE | Children | 48 | 9 |
| 2 | MALE | Children | 56 | 10 |
| 3 | MALE | Children | 33 | 6 |
| 4 | MALE | Adults | 87 | 33 |
| 5 | MALE | Children | 52 | 12 |
Tip: to ensure that the unit defined in
datasetUnit is appropriate, you can leverage the
ospsuite package and copy/paste the value from R. Below
provides a sample to get the appropriate unit for BMI (you need to use
format = 13 in order to keep correct encoded text as done
for the square below).
writeClipboard(ospsuite::ospUnits$BMI$`kg/m²`, format = 13)Vignette example
The code below creates the simulation sets used by the workflow defining the simulation, population and data files that will be used through this vignette.
In this example, the same observed data are included using the
dataSource argument and different data are selected using
the dataSelection argument of the PopulationSimulationSet.
Code
# Define file paths for pkml simulation and populations
simulationFile <- system.file("extdata", "Aciclovir.pkml", package = "ospsuite")
adultFile <- system.file("extdata", "adults.csv", package = "ospsuite.reportingengine")
childrenFile <- system.file("extdata", "children.csv", package = "ospsuite.reportingengine")

adultSet <- PopulationSimulationSet$new(
  referencePopulation = TRUE,
  simulationSetName = "Adults",
  simulationFile = simulationFile,
  populationFile = adultFile,
  dataSource = dataSource,
  dataSelection = 'POP %in% "Adults"'
)

childrenSet <- PopulationSimulationSet$new(
  simulationSetName = "Children",
  simulationFile = simulationFile,
  populationFile = childrenFile,
  dataSource = dataSource,
  dataSelection = 'POP %in% "Children"'
)
Parallel and Ratio Comparison Workflows
This section describes how to proceed with Parallel and Ratio Comparison workflows.
When creating a Parallel or a Ratio Comparison workflow, the
plotDemography task includes 2 fields named
xParameters and yParameters.
-
xParametersdefines the demography parameters displayed in the x-axis of range plots.
If noxParametersis defined (xParameters = NULL), histograms of demography parameters defined inyParametersare performed. -
yParametersdefines the demography parameters that will be displayed in the histograms if there is noxParametersor in the y-axis of range plots ifxParametersdefines demography parameters.
Note that the parameters can be defined as a vector of character values but also as a named list in which case the name will be used as display name in the figures.
By default, xParameters = NULL meaning that histogram
are displayed. Users can check the default xParameters of
their workflow type using the function getDefaultDemographyXParameters().
Default yParameters are independent of the workflow type
and listed in the table below.
| Parameter Path | Display Name |
|---|---|
| Organism|Age | Age |
| Organism|Height | Height |
| Organism|Weight | Weight |
| Organism|BMI | BMI |
| Gender | Gender |
To define different demography parameters in xParameters
and yParameters, the functions setXParametersForDemographyPlot()
and setYParametersForDemographyPlot()
can be respectively used.
Histograms
The code below initializes the parallel comparison workflow and activate only the demography task.
Code
parallelWorkflow <- PopulationWorkflow$new(
  workflowType = PopulationWorkflowTypes$parallelComparison,
  simulationSets = c(adultSet, childrenSet),
  workflowFolder = "Parallel-Histograms",
  createWordReport = FALSE
)
#> 25/06/2026 - 12:28:14
#> i Info  Reporting Engine Information:
#>  Date: 25/06/2026 - 12:28:14
#>  User Information:
#>  Computer Name: runnervmfmtub
#>  User: runner
#>  Login: unknown
#>  System is NOT validated
#>  System versions:
#>  R version: R version 4.6.1 (2026-06-24)
#>  OSP Suite Package version: 12.4.3.9011
#>  OSP Reporting Engine version: 2.4.0.9007
#>  tlf version: 1.6.2.9001

inactivateWorkflowTasks(parallelWorkflow)
activateWorkflowTasks(parallelWorkflow, tasks = AllAvailableTasks$plotDemography)
To plot histograms of demography parameters, no demography parameters
are defined in xParameters as illustrated in the example
below which defines the parameters to be plotted in the histograms.
To define parameters to be included in the report, either a character
array or a named list can be provided. In the case of a named list, the
name will be displayed while using its argument to query the appropriate
demography parameter. In this example, the parameter
Organism|Age is defined with Age as displayed
name. User can also leverage the ospsuite package and
look for the parameters in the enum StandardPath.
Code
# Query parameters defined in xParameters
getXParametersForDemographyPlot(workflow = parallelWorkflow)
#> NULL
# Query parameters defined in yParameters
getYParametersForDemographyPlot(workflow = parallelWorkflow)
#> $Age
#> [1] "Organism|Age"
#>
#> $Height
#> [1] "Organism|Height"
#>
#> $Weight
#> [1] "Organism|Weight"
#>
#> $BMI
#> [1] "Organism|BMI"
#>
#> $Gender
#> [1] "Gender"
displayedParameters <- list(
  Age = "Organism|Age",
  Weight = "Organism|Weight",
  Gender = "Gender"
)

# Define no parameters in xParameters to get histograms
setXParametersForDemographyPlot(workflow = parallelWorkflow, parameters = NULL)
# Define parameters to be displayed in histograms as yParameters
setYParametersForDemographyPlot(workflow = parallelWorkflow, parameters = displayedParameters)
Run the corresponding workflow:
parallelWorkflow$runWorkflow()
#> 25/06/2026 - 12:28:15
#> i Info Starting run of Population Workflow for parallelComparison
#> 25/06/2026 - 12:28:15
#> i Info Starting run of Plot Demography task
#> 25/06/2026 - 12:28:23
#> i Info Plot Demography task completed in 0.1 min
#> 25/06/2026 - 12:28:23
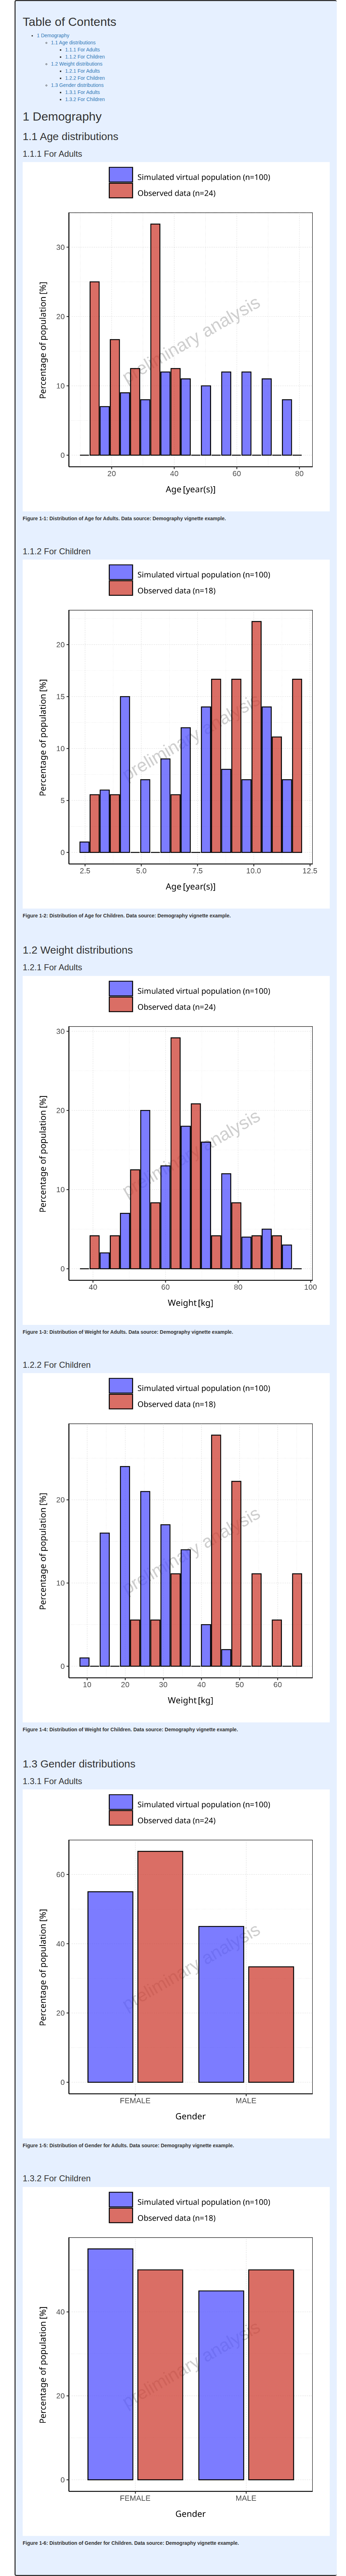
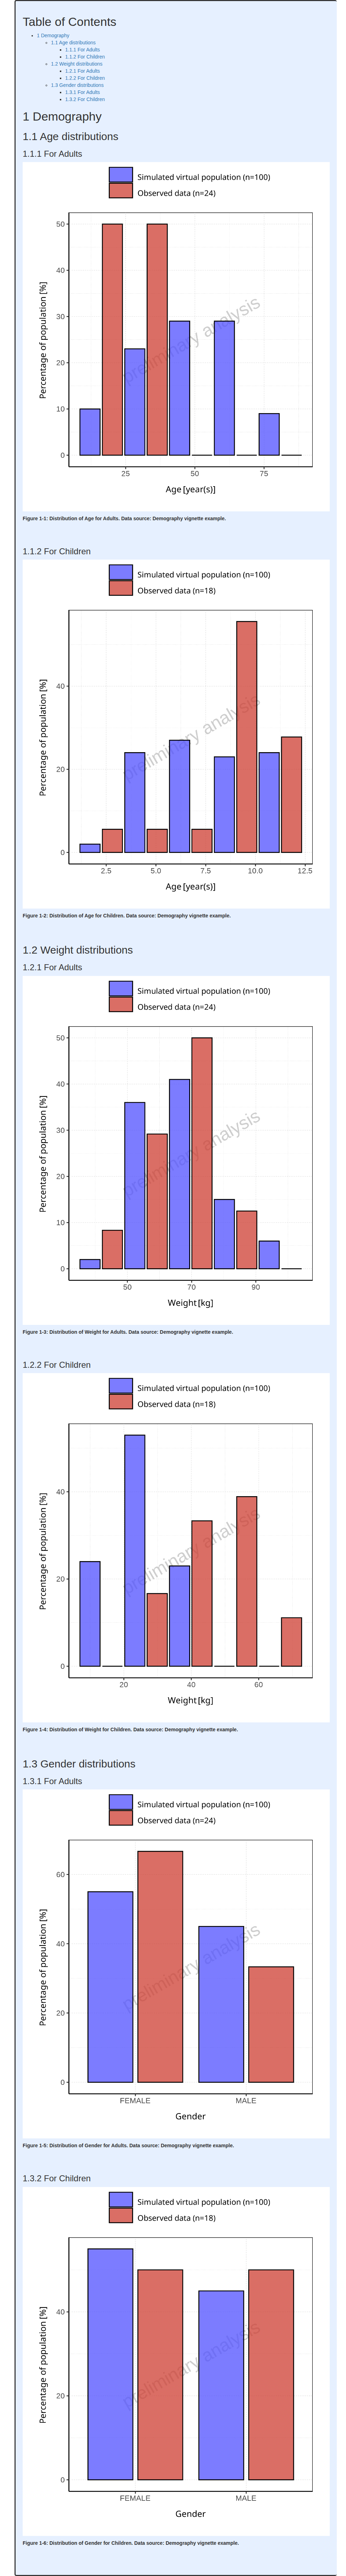
#> i Info Population Workflow for parallelComparison completed in 0.1 minFor Parallel and Ratio Comparison workflows, the demography histograms display the distributions for each simulation set along with its observed data if available (#17, #535).
For categorical parameters, it can be noted that R factor levels are leveraged to display the name of the categories as is. Thus, users need to ensure that the same names are used in both their population files and observed data.
#> file:////home/runner/work/OSPSuite.ReportingEngine/OSPSuite.ReportingEngine/vignettes/Parallel-Histograms/Report.html screenshot completedReport
Range plots
The code below initializes the parallel comparison workflow and activate only the demography task.
Code
parallelWorkflow <- PopulationWorkflow$new(
  workflowType = PopulationWorkflowTypes$parallelComparison,
  simulationSets = c(adultSet, childrenSet),
  workflowFolder = "Parallel-Range-Plots",
  createWordReport = FALSE
)
#> 25/06/2026 - 12:28:25
#> i Info  Reporting Engine Information:
#>  Date: 25/06/2026 - 12:28:25
#>  User Information:
#>  Computer Name: runnervmfmtub
#>  User: runner
#>  Login: unknown
#>  System is NOT validated
#>  System versions:
#>  R version: R version 4.6.1 (2026-06-24)
#>  OSP Suite Package version: 12.4.3.9011
#>  OSP Reporting Engine version: 2.4.0.9007
#>  tlf version: 1.6.2.9001

inactivateWorkflowTasks(parallelWorkflow)
activateWorkflowTasks(parallelWorkflow, tasks = AllAvailableTasks$plotDemography)
To display range plots of demography parameters, the demography
parameters to display are defined in xParameters as
illustrated in the example. Note that categorical
parameters defined as xParameters (Gender in this
case) are displayed (#1088)
using box-whisker plots.
Code
xParameters <- list(
  Age = "Organism|Age",
  Gender = "Gender"
)

setXParametersForDemographyPlot(workflow = parallelWorkflow, parameters = xParameters)
setYParametersForDemographyPlot(workflow = parallelWorkflow, parameters = displayedParameters)
Run the corresponding workflow:
parallelWorkflow$runWorkflow()
#> 25/06/2026 - 12:28:26
#> i Info Starting run of Population Workflow for parallelComparison
#> 25/06/2026 - 12:28:26
#> i Info Starting run of Plot Demography task
#> 25/06/2026 - 12:28:35
#> i Info Plot Demography task completed in 0.2 min
#> 25/06/2026 - 12:28:35
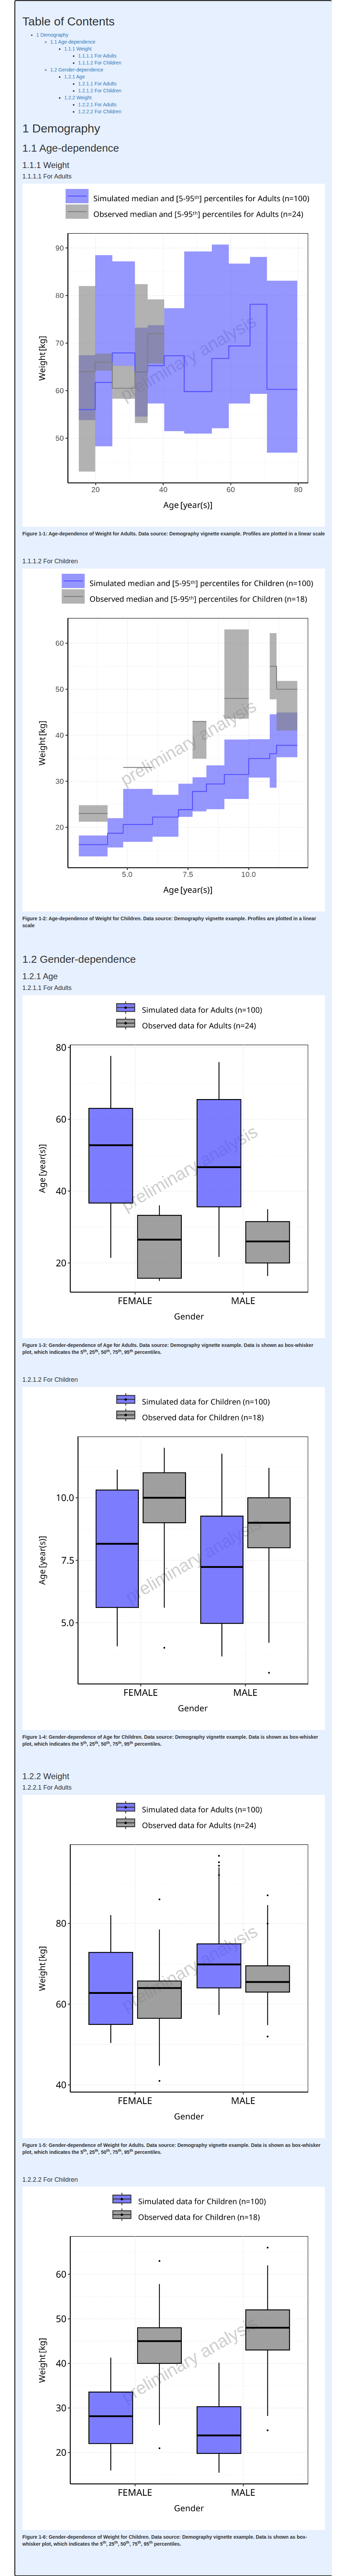
#> i Info Population Workflow for parallelComparison completed in 0.2 minFor Parallel and Ratio Comparison workflows, the demography range plots display the distributions for each simulation set along with its observed data if available (#17, #535).
Likewise, categorical parameters (Gender in this case) are displayed along with its observed data if available using boxplots instead (#1088.
For the comparison between simulated and observed populations to be the most relevant possible, the same binning is applied between simulated and observed populations.
#> file:////home/runner/work/OSPSuite.ReportingEngine/OSPSuite.ReportingEngine/vignettes/Parallel-Range-Plots/Report.html screenshot completedReport
Pediatric Workflows
This section describes how to proceed with Pediatric workflows.
When creating a Pediatric workflow, the plotDemography
task includes 2 fields named xParameters and
yParameters.
-
xParametersdefines the demography parameters displayed in the x-axis of range plots.
If noxParametersis defined (xParameters = NULL), histograms of demography parameters defined inyParametersare performed. -
yParametersdefines the demography parameters that will be displayed in the histograms if there is noxParametersor in the y-axis of range plots ifxParametersdefines demography parameters.
Note that the parameters can be defined as a vector of character values but also as a named list in which case the name will be used as display name in the figures.
By default, xParameters = "Organism|Age" meaning that
range plots of demography parameters vs Age are displayed. Users can
check the default xParameters of their workflow type using
the function getDefaultDemographyXParameters().
Default yParameters are independent of the workflow type
and listed in the table below.
| Parameter Path | Display Name |
|---|---|
| Organism|Age | Age |
| Organism|Height | Height |
| Organism|Weight | Weight |
| Organism|BMI | BMI |
| Gender | Gender |
To define different demography parameters in xParameters
and yParameters, the functions setXParametersForDemographyPlot()
and setYParametersForDemographyPlot()
can be respectively used.
Histograms
The code below initializes the pediatric workflow and activate only the demography task.
Code
pediatricWorkflow <- PopulationWorkflow$new(
  workflowType = PopulationWorkflowTypes$pediatric,
  simulationSets = c(adultSet, childrenSet),
  workflowFolder = "Pediatric-Histograms",
  createWordReport = FALSE
)
#> 25/06/2026 - 12:28:37
#> i Info  Reporting Engine Information:
#>  Date: 25/06/2026 - 12:28:37
#>  User Information:
#>  Computer Name: runnervmfmtub
#>  User: runner
#>  Login: unknown
#>  System is NOT validated
#>  System versions:
#>  R version: R version 4.6.1 (2026-06-24)
#>  OSP Suite Package version: 12.4.3.9011
#>  OSP Reporting Engine version: 2.4.0.9007
#>  tlf version: 1.6.2.9001

inactivateWorkflowTasks(pediatricWorkflow)
activateWorkflowTasks(pediatricWorkflow, tasks = AllAvailableTasks$plotDemography)
To plot histograms of demography parameters, no demography parameters
are defined in xParameters as illustrated in the example
below which defines the parameters to be plotted in the histograms.
Code
displayedParameters <- list(
  Age = "Organism|Age",
  Weight = "Organism|Weight",
  Gender = "Gender"
)

setXParametersForDemographyPlot(workflow = pediatricWorkflow, parameters = NULL)
setYParametersForDemographyPlot(workflow = pediatricWorkflow, parameters = displayedParameters)
Run the corresponding workflow:
pediatricWorkflow$runWorkflow()
#> 25/06/2026 - 12:28:37
#> i Info Starting run of Population Workflow for pediatric
#> 25/06/2026 - 12:28:37
#> i Info Starting run of Plot Demography task
#> 25/06/2026 - 12:28:45
#> i Info Plot Demography task completed in 0.1 min
#> 25/06/2026 - 12:28:45
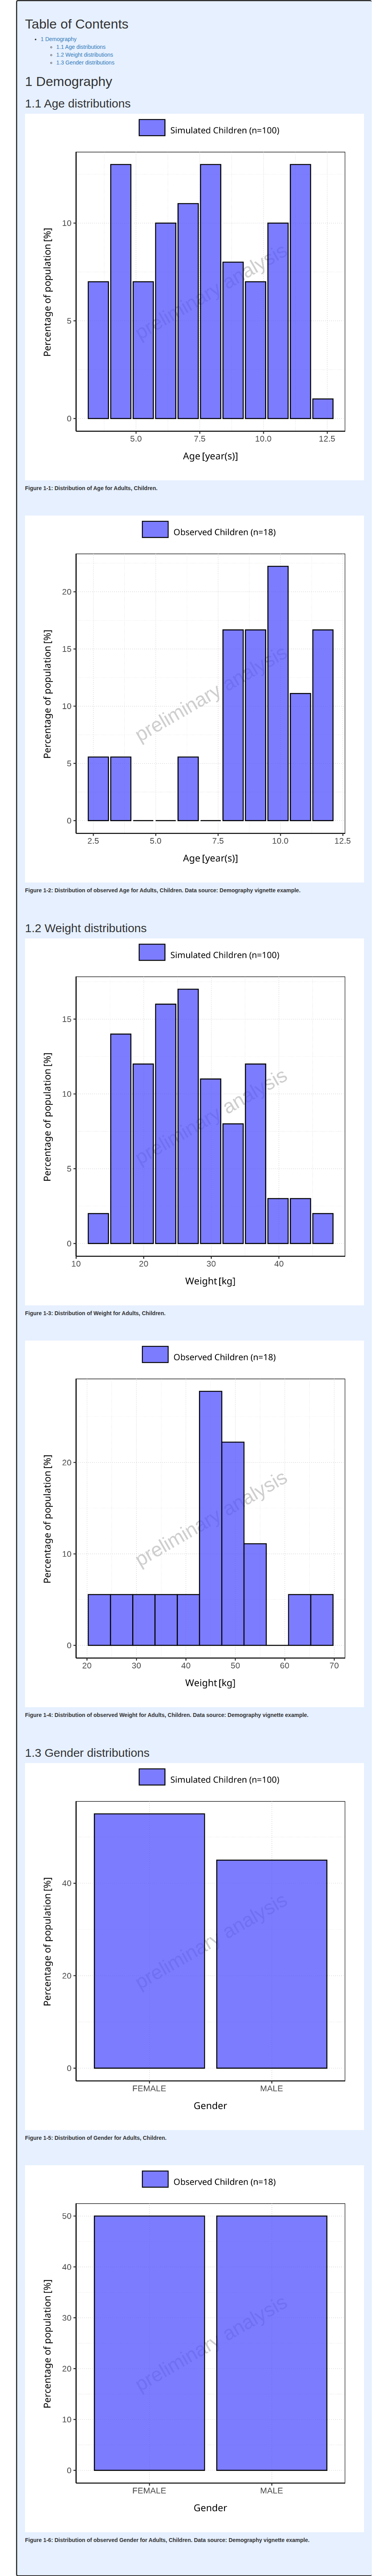
#> i Info Population Workflow for pediatric completed in 0.1 minFor Pediatric workflows, the demography histograms display the distributions for all simulation sets together (#17, #535). If observed data is available, the distributions for all simulation sets observed data are also displayed together.
For categorical parameters, it can be noted that R factor levels are leveraged to display the name of the categories as is. Thus, users need to ensure that the same names are used in both their population files and observed data.
#> file:////home/runner/work/OSPSuite.ReportingEngine/OSPSuite.ReportingEngine/vignettes/Pediatric-Histograms/Report.html screenshot completedReport
Range plots
The code below initializes the pediatric workflow and activate only the demography task.
Code
pediatricWorkflow <- PopulationWorkflow$new(
  workflowType = PopulationWorkflowTypes$pediatric,
  simulationSets = c(adultSet, childrenSet),
  workflowFolder = "Pediatric-Range-Plots",
  createWordReport = FALSE
)
#> 25/06/2026 - 12:28:47
#> i Info  Reporting Engine Information:
#>  Date: 25/06/2026 - 12:28:47
#>  User Information:
#>  Computer Name: runnervmfmtub
#>  User: runner
#>  Login: unknown
#>  System is NOT validated
#>  System versions:
#>  R version: R version 4.6.1 (2026-06-24)
#>  OSP Suite Package version: 12.4.3.9011
#>  OSP Reporting Engine version: 2.4.0.9007
#>  tlf version: 1.6.2.9001

inactivateWorkflowTasks(pediatricWorkflow)
activateWorkflowTasks(pediatricWorkflow, tasks = AllAvailableTasks$plotDemography)
To display range plots of demography parameters, the demography
parameters to display are defined in xParameters as
illustrated in the example. Note that categorical
parameters defined as xParameters (Gender in this
case) are displayed (#1088)
using box-whisker plots.
Code
xParameters <- list(
  Age = "Organism|Age",
  Gender = "Gender"
)

setXParametersForDemographyPlot(workflow = pediatricWorkflow, parameters = xParameters)
setYParametersForDemographyPlot(workflow = pediatricWorkflow, parameters = displayedParameters)
Run the corresponding workflow:
pediatricWorkflow$runWorkflow()
#> 25/06/2026 - 12:28:47
#> i Info Starting run of Population Workflow for pediatric
#> 25/06/2026 - 12:28:47
#> i Info Starting run of Plot Demography task
#> 25/06/2026 - 12:29:00
#> i Info Plot Demography task completed in 0.2 min
#> 25/06/2026 - 12:29:00
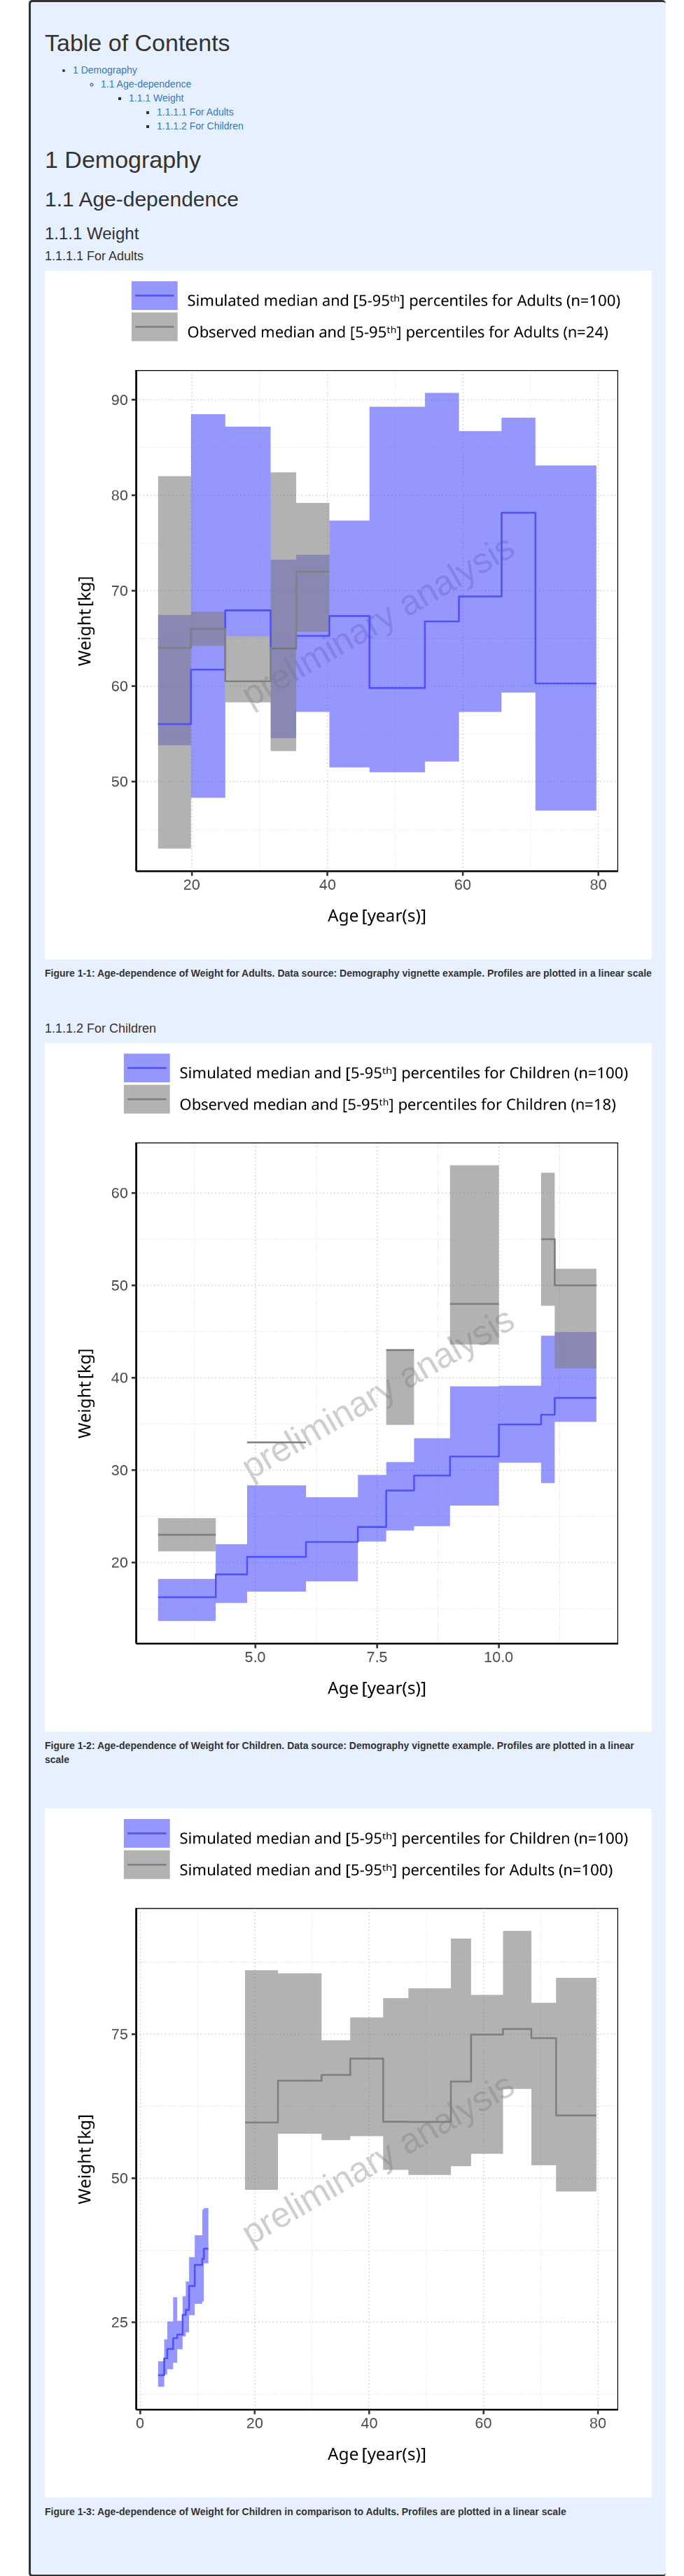
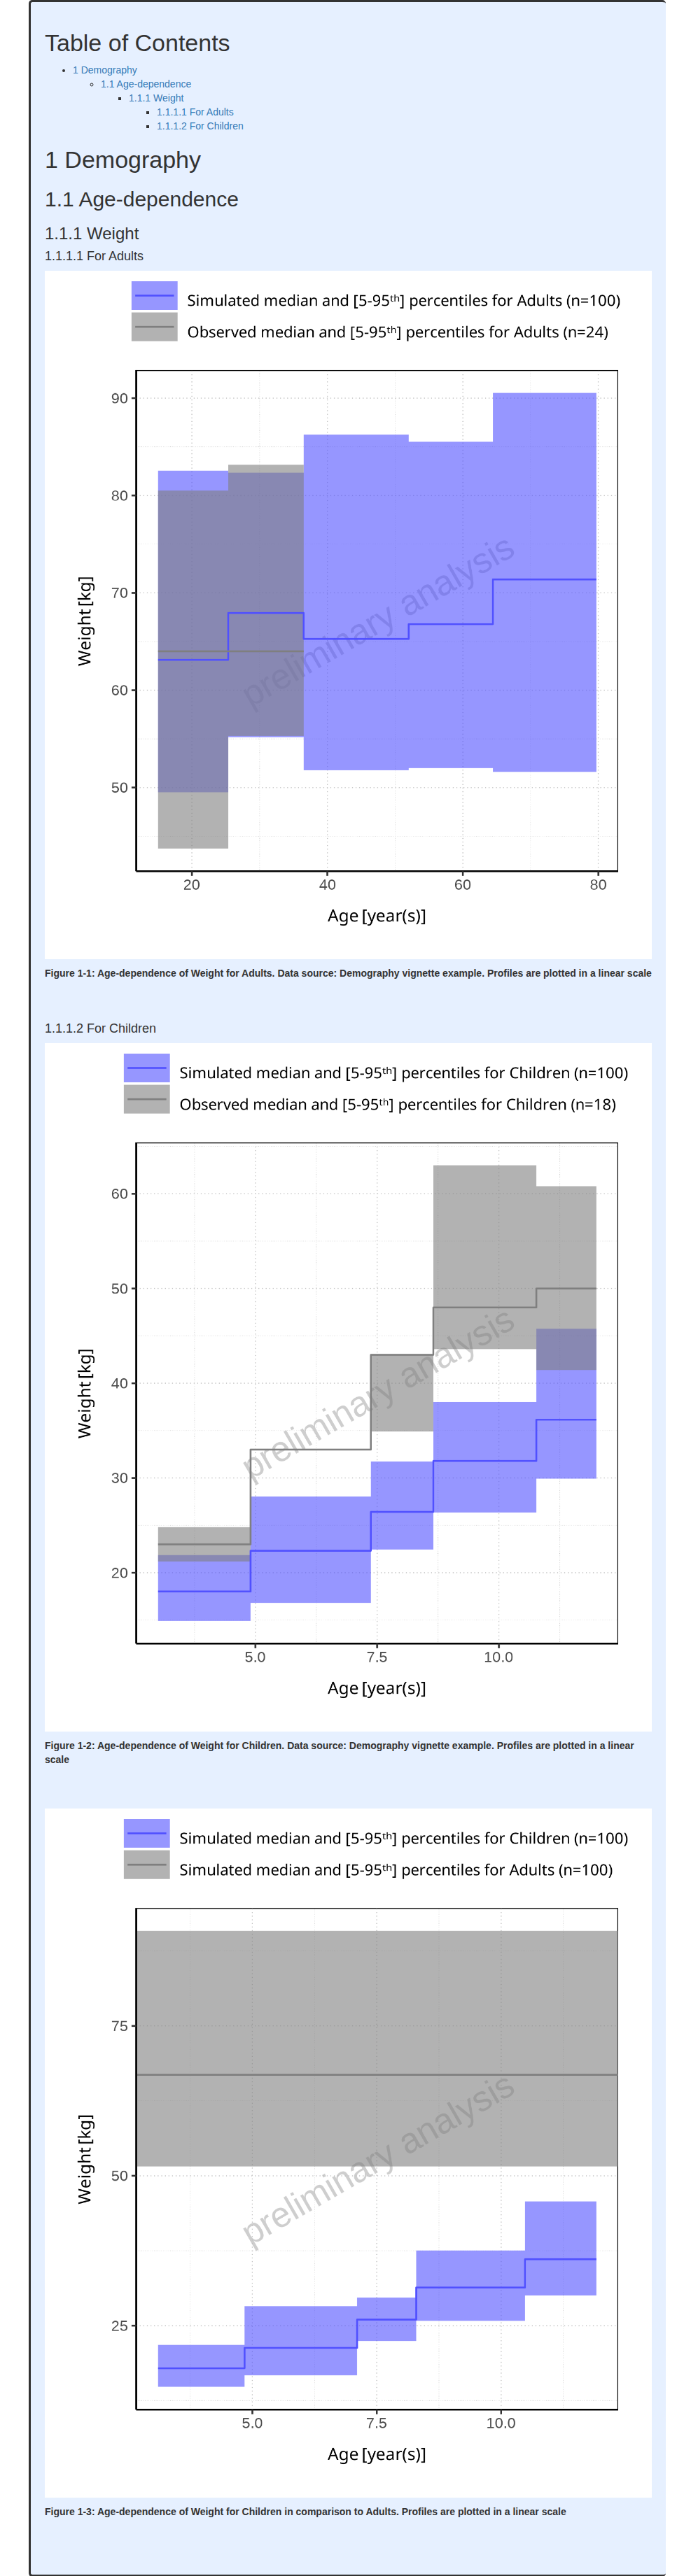
#> i Info Population Workflow for pediatric completed in 0.2 minFor Pediatric workflows, the demography range plots display the distributions for each simulation set along with its observed data if available (#17, #535). Additionally, range plots comparing the distribution of each simulation set to the reference simulation set is also performed.
Categorical parameters (Gender in this case) are also displayed along with the reference simulation set.
For the comparison between simulated and observed populations to be the most relevant possible, the same binning is used between simulated and observed populations.
For the additional comparison with the reference
simulation set, the global summary statistics of the
reference are displayed as horizontal ranges. However,
it is possible to display binned ranges for the reference
simulation set by turning off the settings referenceGlobalRange.
#> file:////home/runner/work/OSPSuite.ReportingEngine/OSPSuite.ReportingEngine/vignettes/Pediatric-Range-Plots/Report.html screenshot completedReport

Demography settings
The demography plot task includes a few settings that may allow users
to fine tune their demography plots. Such settings are available in the
field workflow$plotDemography$settings.
Since categorical parameters are displayed using boxplots, they are not affected by the settings described below.
Binning histograms and range plots
Currently, the default number of bins is set to 11.
However, users can update the number of bins or even include the bin
edges within the field bins as illustrated below.
workflow$plotDemography$settings$bins <- 5In the example below, the binning is included within a parallel workflow:
Code
parallelWorkflow <- PopulationWorkflow$new(
workflowType = PopulationWorkflowTypes$parallelComparison,
simulationSets = c(adultSet, childrenSet),
workflowFolder = "Parallel-Histograms",
createWordReport = FALSE
)
#> 25/06/2026 - 12:29:02
#> i Info Reporting Engine Information:
#> Date: 25/06/2026 - 12:29:02
#> User Information:
#> Computer Name: runnervmfmtub
#> User: runner
#> Login: unknown
#> System is NOT validated
#> System versions:
#> R version: R version 4.6.1 (2026-06-24)
#> OSP Suite Package version: 12.4.3.9011
#> OSP Reporting Engine version: 2.4.0.9007
#> tlf version: 1.6.2.9001
inactivateWorkflowTasks(parallelWorkflow)
activateWorkflowTasks(parallelWorkflow, tasks = AllAvailableTasks$plotDemography)
# Only display histograms for Age, Weight and Gender
displayedParameters <- list(
Age = "Organism|Age",
Weight = "Organism|Weight",
Gender = "Gender"
)
setYParametersForDemographyPlot(workflow = parallelWorkflow, parameters = displayedParameters)
# Set up 5 bins for all histograms
parallelWorkflow$plotDemography$settings$bins <- 5
parallelWorkflow$runWorkflow()
#> 25/06/2026 - 12:29:02
#> i Info Starting run of Population Workflow for parallelComparison
#> 25/06/2026 - 12:29:02
#> i Info Starting run of Plot Demography task
#> 25/06/2026 - 12:29:10
#> i Info Plot Demography task completed in 0.1 min
#> 25/06/2026 - 12:29:10
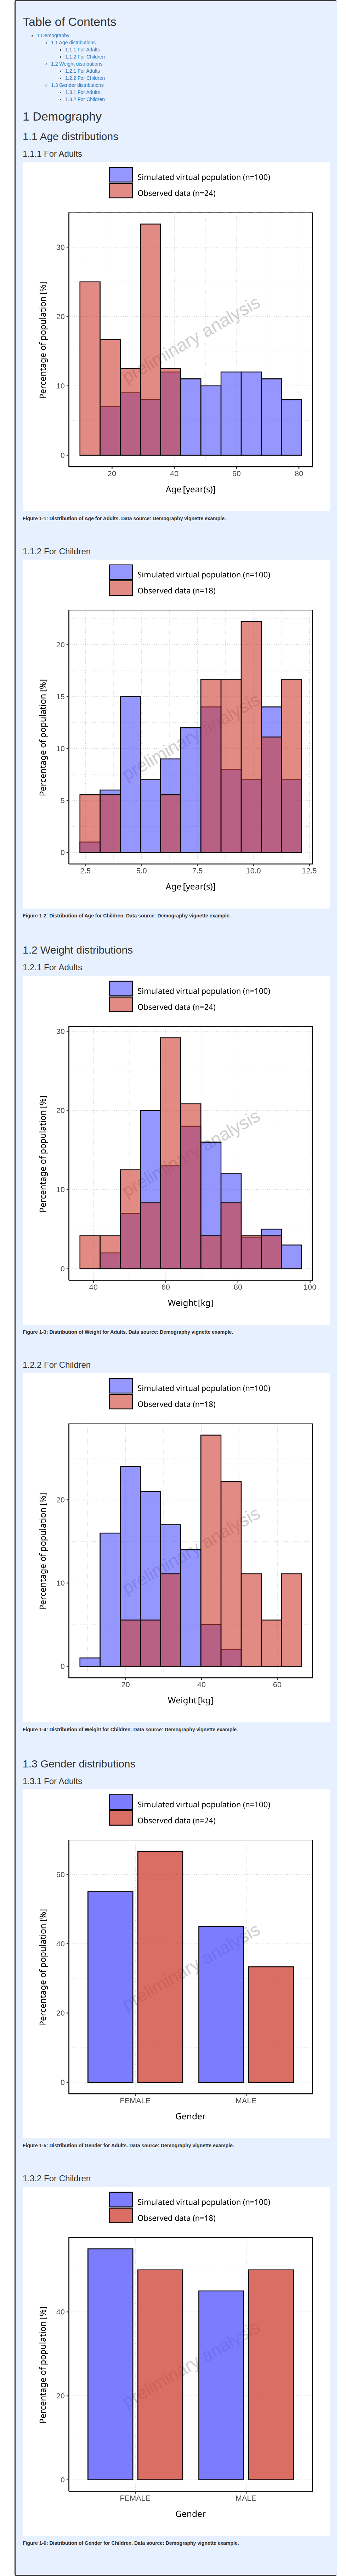
#> i Info Population Workflow for parallelComparison completed in 0.1 minIn the report displayed below, the histograms are displayed with 5 bins except for categorical parameter whose categories are displayed as is.
#> file:////home/runner/work/OSPSuite.ReportingEngine/OSPSuite.ReportingEngine/vignettes/Parallel-Histograms/Report.html screenshot completedReport
The same binning can also be applied to range plots as illustrated below:
Code
pediatricWorkflow <- PopulationWorkflow$new(
  workflowType = PopulationWorkflowTypes$pediatric,
  simulationSets = c(adultSet, childrenSet),
  workflowFolder = "Pediatric-Range",
  createWordReport = FALSE
)
#> 25/06/2026 - 12:29:12
#> i Info  Reporting Engine Information:
#>  Date: 25/06/2026 - 12:29:12
#>  User Information:
#>  Computer Name: runnervmfmtub
#>  User: runner
#>  Login: unknown
#>  System is NOT validated
#>  System versions:
#>  R version: R version 4.6.1 (2026-06-24)
#>  OSP Suite Package version: 12.4.3.9011
#>  OSP Reporting Engine version: 2.4.0.9007
#>  tlf version: 1.6.2.9001

inactivateWorkflowTasks(pediatricWorkflow)
activateWorkflowTasks(pediatricWorkflow, tasks = AllAvailableTasks$plotDemography)


displayedParameters <- list(
  Age = "Organism|Age",
  Weight = "Organism|Weight",
  Gender = "Gender"
)
setYParametersForDemographyPlot(workflow = pediatricWorkflow, parameters = displayedParameters)

# Set up 5 bins for all the range plots
pediatricWorkflow$plotDemography$settings$bins <- 5

pediatricWorkflow$runWorkflow()
#> 25/06/2026 - 12:29:12
#> i Info  Starting run of Population Workflow for pediatric
#> 25/06/2026 - 12:29:12
#> i Info  Starting run of Plot Demography task
#> 25/06/2026 - 12:29:17
#> i Info  Plot Demography task completed in 0.1 min
#> 25/06/2026 - 12:29:17
#> i Info  Population Workflow for pediatric completed in 0.1 min
#> file:////home/runner/work/OSPSuite.ReportingEngine/OSPSuite.ReportingEngine/vignettes/Pediatric-Range/Report.html screenshot completedReport
Note that the algorithm that calculates the bin edges based on the number of bins aims at including the same number of points in each bin.
It is also possible to update default aggregation settings in order to update binning but also computed and displayed aggregation values using the following functions:
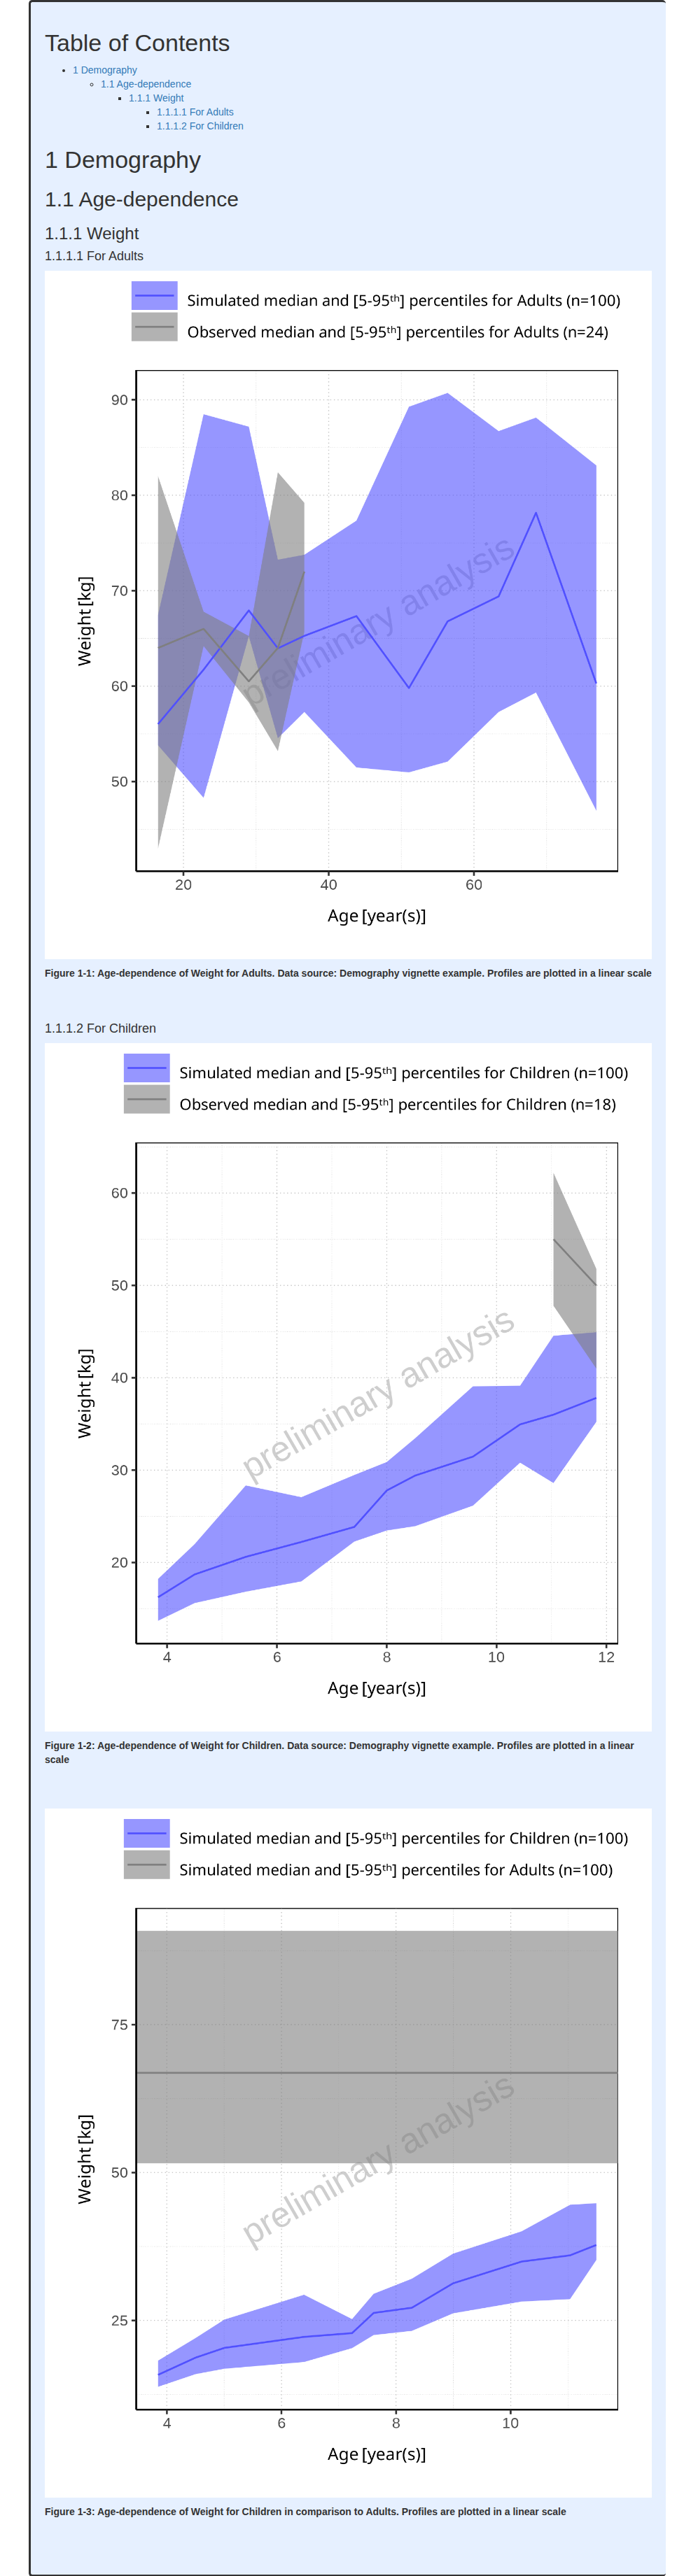
Continuous vs stair step range plots
By default, demography range plots are displayed as stair step range
plots. It is however possible to connect the aggregated values to get a
continuous range plot by setting the stairstep field to
FALSE as shown below.
workflow$plotDemography$settings$stairstep <- FALSEIn the example below, continuous range plots are included within a pediatric workflow:
Code
pediatricWorkflow <- PopulationWorkflow$new(
  workflowType = PopulationWorkflowTypes$pediatric,
  simulationSets = c(adultSet, childrenSet),
  workflowFolder = "Pediatric-Range",
  createWordReport = FALSE
)
#> 25/06/2026 - 12:29:19
#> i Info  Reporting Engine Information:
#>  Date: 25/06/2026 - 12:29:19
#>  User Information:
#>  Computer Name: runnervmfmtub
#>  User: runner
#>  Login: unknown
#>  System is NOT validated
#>  System versions:
#>  R version: R version 4.6.1 (2026-06-24)
#>  OSP Suite Package version: 12.4.3.9011
#>  OSP Reporting Engine version: 2.4.0.9007
#>  tlf version: 1.6.2.9001

inactivateWorkflowTasks(pediatricWorkflow)
activateWorkflowTasks(pediatricWorkflow, tasks = AllAvailableTasks$plotDemography)


displayedParameters <- list(
  Age = "Organism|Age",
  Weight = "Organism|Weight",
  Gender = "Gender"
)
setYParametersForDemographyPlot(workflow = pediatricWorkflow, parameters = displayedParameters)

# Set up continuous line between bins with stairstep settings being FALSE
pediatricWorkflow$plotDemography$settings$stairstep <- FALSE

pediatricWorkflow$runWorkflow()
#> 25/06/2026 - 12:29:19
#> i Info  Starting run of Population Workflow for pediatric
#> 25/06/2026 - 12:29:19
#> i Info  Starting run of Plot Demography task
#> 25/06/2026 - 12:29:25
#> i Info  Plot Demography task completed in 0.1 min
#> 25/06/2026 - 12:29:25
#> i Info  Population Workflow for pediatric completed in 0.1 min
#> file:////home/runner/work/OSPSuite.ReportingEngine/OSPSuite.ReportingEngine/vignettes/Pediatric-Range/Report.html screenshot completedReport
Dodging histogram bars
By default, demography histogram plots dodge the bars to prevent bars
masking one another. It is however possible to remove this settings in
case the bars do not overlap by setting the dodge field to
FALSE as shown below.
workflow$plotDemography$settings$dodge <- FALSEIn the example below, dodging is removed within a parallel comparison workflow:
Code
parallelWorkflow <- PopulationWorkflow$new(
  workflowType = PopulationWorkflowTypes$parallelComparison,
  simulationSets = c(adultSet, childrenSet),
  workflowFolder = "Parallel-Histograms",
  createWordReport = FALSE
)
#> 25/06/2026 - 12:29:26
#> i Info  Reporting Engine Information:
#>  Date: 25/06/2026 - 12:29:26
#>  User Information:
#>  Computer Name: runnervmfmtub
#>  User: runner
#>  Login: unknown
#>  System is NOT validated
#>  System versions:
#>  R version: R version 4.6.1 (2026-06-24)
#>  OSP Suite Package version: 12.4.3.9011
#>  OSP Reporting Engine version: 2.4.0.9007
#>  tlf version: 1.6.2.9001

inactivateWorkflowTasks(parallelWorkflow)
activateWorkflowTasks(parallelWorkflow, tasks = AllAvailableTasks$plotDemography)

displayedParameters <- list(
  Age = "Organism|Age",
  Weight = "Organism|Weight",
  Gender = "Gender"
)
setYParametersForDemographyPlot(workflow = parallelWorkflow, parameters = displayedParameters)

# Turn off dodging of histogram bars
parallelWorkflow$plotDemography$settings$dodge <- FALSE

parallelWorkflow$runWorkflow()
#> 25/06/2026 - 12:29:26
#> i Info  Starting run of Population Workflow for parallelComparison
#> 25/06/2026 - 12:29:26
#> i Info  Starting run of Plot Demography task
#> 25/06/2026 - 12:29:34
#> i Info  Plot Demography task completed in 0.1 min
#> 25/06/2026 - 12:29:34
#> i Info  Population Workflow for parallelComparison completed in 0.1 min
#> file:////home/runner/work/OSPSuite.ReportingEngine/OSPSuite.ReportingEngine/vignettes/Parallel-Histograms/Report.html screenshot completedReport
Display reference population global range
Pediatric workflow range plots compare simulation sets to the reference simulation set (#17).
In cases where distributions in xParameters between
populations are comparable, it may be more appropriate to display binned
distributions of the yParameters of the reference
population.
As a consequence, it is possible to define such feature by setting
the referenceGlobalRange field to FALSE as
illustrated below.
workflow$plotDemography$settings$referenceGlobalRange <- FALSEIn the example below, reference simulation set is displayed with same bins as the simulation set to compare:
Code
pediatricWorkflow <- PopulationWorkflow$new(
  workflowType = PopulationWorkflowTypes$pediatric,
  simulationSets = c(adultSet, childrenSet),
  workflowFolder = "Pediatric-Range",
  createWordReport = FALSE
)
#> 25/06/2026 - 12:29:36
#> i Info  Reporting Engine Information:
#>  Date: 25/06/2026 - 12:29:36
#>  User Information:
#>  Computer Name: runnervmfmtub
#>  User: runner
#>  Login: unknown
#>  System is NOT validated
#>  System versions:
#>  R version: R version 4.6.1 (2026-06-24)
#>  OSP Suite Package version: 12.4.3.9011
#>  OSP Reporting Engine version: 2.4.0.9007
#>  tlf version: 1.6.2.9001

inactivateWorkflowTasks(pediatricWorkflow)
activateWorkflowTasks(pediatricWorkflow, tasks = AllAvailableTasks$plotDemography)

displayedParameters <- list(
  Age = "Organism|Age",
  Weight = "Organism|Weight",
  Gender = "Gender"
)
setYParametersForDemographyPlot(workflow = pediatricWorkflow, parameters = displayedParameters)

# Turn off reference global range
pediatricWorkflow$plotDemography$settings$referenceGlobalRange <- FALSE

pediatricWorkflow$runWorkflow()
#> 25/06/2026 - 12:29:36
#> i Info  Starting run of Population Workflow for pediatric
#> 25/06/2026 - 12:29:36
#> i Info  Starting run of Plot Demography task
#> 25/06/2026 - 12:29:42
#> i Info  Plot Demography task completed in 0.1 min
#> 25/06/2026 - 12:29:42
#> i Info  Population Workflow for pediatric completed in 0.1 min
#> file:////home/runner/work/OSPSuite.ReportingEngine/OSPSuite.ReportingEngine/vignettes/Pediatric-Range/Report.html screenshot completedReport