OSP Shape Identity Scale
scale_shape_osp_identity.RdIdentity scale for when data already contains OSP shape names.
Use this when your shape column contains values from ospShapeNames
directly (e.g., "circle", "diamond", "star").
Equivalent to ggplot2::scale_shape_identity().
Arguments
- guide
Guide for the legend. Use
"legend"to show a legend, or"none"to hide it.- ...
Passed to
ggplot2::scale_shape_manual.
See also
Other shapes:
Shapes,
ospShapeNames,
scale_shape_osp(),
scale_shape_osp_manual()
Examples
library(ggplot2)
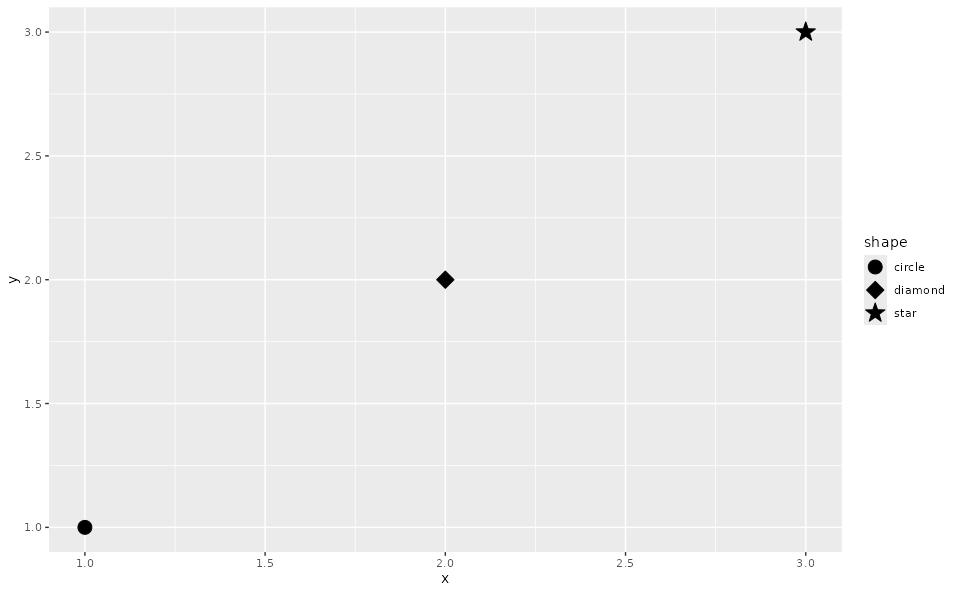
df <- data.frame(x = 1:3, y = 1:3, shape = c("circle", "diamond", "star"))
ggplot(df, aes(x, y, shape = shape)) +
geom_point_osp(size = 4) +
scale_shape_osp_identity(guide = "legend")